chapter 2: cancer - north slope borough, alaska · chapter 2: cancer half of all men and one-third...
TRANSCRIPT

Chapter 2: Cancer
Half of all men and one-third of all women in the United States will be diagnosed with cancer during their lifetime—most in their later years—and about one in five Americans will die from it.1 It is now the leading cause of death in Alaska overall, among Alaska Natives, and in the NSB, and it is understandably a major community health concern in the NSB. Overall cancer incidence rates and cancer death rates have declined in the United States, but cancer incidence is increasing not only among Alaska Natives but among Inuit in all circumpolar regions.2 Concerns about environmental pollution have fueled fears and anger about cancer in many arctic communities, while high smoking rates and dietary factors continue to increase cancer risk in the NSB and neighboring regions.

132|Part II: Full Report|Chapter 2: Cancer
2.1. Cancer Statistics 2.1.1. Cancer Incidence 2.1.1.1. Overall Cancer Incidence
There were 288 cases of invasive cancer documented in the NSB between 1996 and 2009. The age-adjusted incidence for this period was higher than both the statewide and national age-adjusted rates, but these differences were not statistically significant.In other words, these numbers are estimates of the “true” incidence of cancer in the populations adjusted for differences in age composition, and the ranges of estimates in the three groups overlap.1,3
Figure 2.1: Incidence of Invasive Cancers, all Types, 1996–2009: Cases per 100,000 population!"#$%&'A)(*'S1E"/&1E&'-F'S1X27"X&'U21E&%7H'233'Y@,&7H'(LLMvANNL*''U27&7',&%'(NNHNNN';-,$32."-1'
!
><N)('
JKB)('
JMB)J'
869'\JM()KOMNJ)M]'
:327Q2'\JK()AOJL<)(]'
[6''
Rates are per 100,000 population, age-adjusted to 2000 u.s. standard population.
nsB and alaska data source: alaska Cancer Registry Data and statistics: Cancer incidence Data and statistics 1996–2009.
u.s. data source: seeR (seeR 13 data series). u.s. rate is for 1996–2008.
Nationwide and in Alaska, overall incidence of invasive cancer has declined slightly, while in the NSB this decline is not apparent.1,3 Because of the small absolute number of cases annually in the NSB (generally in the range of 15–25 cases), rates fluctuate widely from year to year and trends over a relatively short period of time are difficult to interpret. Epidemiologic work done by Dr. Bowerman4 for the NSB in 1998 documented the increasing cancer incidence among Alaska Natives in the NSB between 1971 and 1994, and the NSB incidence data in Figure 2.2 suggest a continuation of this upward trend.
Figure 2.2: Trends in Incidence of Invasive Cancer, all Types, 1996–2009!"#$%&'A)A*'Y%&1/7'"1'S1E"/&1E&'-F'S1X27"X&'U21E&%H':33'Y@,&7*'(LLMaANNL'
!
<NN'
JNN'
>NN'
MNN'
BNN'
:X&%2#&'211$23'%2.&',&%'(NNHNNN',-,$32W-1'
869'
:327Q2'
[)6)''
nsB and alaska data source: alaska Cancer Registry Data and statistics: Cancer incidence Data and statistics 1996–2009.
u.s. data source: seeR (seeR 13 data series).
all rates are age-adjusted to 2000 u.s. standard population.
u.s. rates are for the single, midpoint year of the time period noted.

Chapter 2: CanCer
North Slope Borough Baseline Community Health Analysis|133
2.1.1.2. Cancer Incidence, by Type of CancerLung cancer is the most common type of cancer diagnosed in NSB residents, followed by colorectal, prostate, and breast cancers.3
Figure 2.3: Incidence of Invasive Cancer, by Site of Malignancy, 1996–2009!"#$%&'A)<*'S1E"/&1E&'+2.&7'-F'S1X27"X&'U21E&%H'I@'6".&'-F'`23"#121E@*'(LLMvANNL'
!
^$1#'21/'I%-1E5$7'
U-3-1'21/'%&E.$R'
9%&27.' ;%-7.2.&' 6.-R2E5d' h"/1&@d' ;21E%&27d'^@RO
,5-R2d'Y5@%-"/d'
869' ((<)J' ((()J' L<)A' BJ)B' JN)M' AK)K' (B)B' (N)L' M)>'
:327Q2'' M>)J' JL)M' (<<)B' (>J)K' >)M' (M)<' K)<' (K)A' (A)>'
[)6)'' MN)<' >N)K' (AL)B' (MB)M' K)M' (()L' (()J' AA)<' K)M'
N'
AN'
JN'
MN'
KN'
(NN'
(AN'
(JN'
(MN'
(KN'
U27&7',&%'(NNHNNN';-,$32W-1'
Cases per 100,000 population, age-adjusted to 2000 u.s. standard population.
*Rates for nsB are based on fewer than 20 cases and should be interpreted with caution.
nsB and alaska data source: alaska Cancer Registry Data and statistics: Cancer incidence Data and statistics 1996–2009.
nsB data source: seeR (u.s. rates are for 1996–2007).
Lung Cancer Incidence—Regional ComparisonsThe incidence of lung cancer among NSB males is the highest in the state and is significantly higher than the statewide incidence rate.3 Gender-specific lung cancer incidence show a striking male predominance in the NSB, with rates among males more than five times that among females. This male predominance in lung cancer incidence is also seen in other areas of the state, although it is most marked in the NSB, Nome, and Bethel regions. According to the Centers for Disease Control and Prevention, lung cancer incidence rates among U.S. males are less than twice rates among U.S. females (83 vs. 55 cases per 100,000 persons, respectively).5
Figure 2.4: Lung Cancer Incidence, by Borough and/or Census Area and Gender, 1996–2009!"#$%&'A)J*'^$1#'U21E&%'S1E"/&1E&'+2.&7H'I@'9-%-$#5'21/e-%'U&17$7':%&2'21/'0&1/&%*'(LLMvANNL'
!
M()K'
MM)<'
B()B'
BA)J'
KA)>'
KM)L'
KL)<'
((<)M'
(J>)K'
(LA)<'
MN'
>M)('
>>)('
>L)A'
MJ)L'
MJ)J'
M<)K'
AL'
M()>'
<M)J'
6".Q2'
r$1&2$'
8_:9'
Z"33"1#52R'
!2"%I21Q7'
:1E5-%2#&'
:^:6h:'
9&.5&3'
8-R&'
869'
_-R&1' `&1'
Cases per 100,000 population, age-adjusted to 2000 u.s. standard population.
Data source: alaska Cancer Registry Data and statistics: Cancer incidence Data and statistics 1996–2009.
nWaB=northwest arctic Borough

134|Part II: Full Report|Chapter 2: Cancer
Looking at Alaska Natives specifically, Alaska Native males in the Barrow service unit had a significantly higher incidence of lung cancer than the average incidence among Alaska Native males from all other service units combined during 1989–2003.6
Figure 2.5: Lung Cancer Incidence for Alaska Natives, by I.H.S. Service Unit and Gender, 1989–2003
!"#$%&'A)>*'^$1#'U21E&%'S1E"/&1E&'+2.&7'F-%':327Q2'82."X&7H'I@'S)4)6)'6&%X"E&'[1".'21/'0&1/&%*'(LKLvANN<''
!
(<A'
AKL'
(AJ'
((>'
((>'
K('
(>L'
(JA'
(NK'
>M'
KK'
B<'
><'
>N'
>('
JN'
:1E5-%2#&'
92%%-Gd'
9%"7.-3'92@'
S1.&%"-%'
h-.k&I$&'
`-$1.'C/#&E$RI&'
8-%.-1'6-$1/'
b$Q-1'h$7Q-QG"R' `&1' _-R&1'
Cases per 100,000 population, age-adjusted to 2000 u.s. standard population.
iHs service units include alaska native residents residing in communities served by the respective tribal health organization. the Barrow service unit includes residents of communities served by the arctic slope native association and thus does not include point Hope.
*statistically significant difference from average for all service areas combined (p<0.05).
Data source: lanier et al., Cancer in alaska natives 1969–2003: 35-year Report.
Colon Cancer Incidence—Regional ComparisonsThe second most common cancer in the NSB, colorectal cancer also shows a male predominance, but this gender difference is not statistically significant. Colon cancer incidence among NSB males is more than twice the overall statewide rate among males and is significantly higher than the overall statewide inci-dence for males or females. Colon cancer incidence is higher in the rural, predominantly Alaska Native regions, than it is in the urban centers of Anchorage, Fairbanks, and Juneau.3
Figure 2.6: Colorectal Cancer Incidence Rates, by Borough and/or Census Area and Gender, 1996–2009
!"#$%&'A)M*'U-3-%&E.23'U21E&%'S1E"/&1E&'+2.&7H'I@'9-%-$#5'21/e-%'U&17$7':%&2'21/'0&1/&%*'(LLMvANNL'
!
(<()<'
(N()K'
(NA)J'
LL'
BB)>'
BK)B'
MA'
><)B'
><)B'
>('
LL'
L<)M'
LB)A'
LK)('
J('
(A<)K'
JL)>'
J>)('
JA)<'
JM)>'
869'
Z"33"1#52R'
8-R&'
8_:9'
6".Q2'
9&.5&3'
:^:6h:'
r$1&2$'
:1E5-%2#&'
!2"%I21Q7' `&1' _-R&1'
Rates are per 100,000 population, age-adjusted to 2000 u.s. standard population.
Data source: alaska Cancer Registry Data and statistics: Cancer incidence Data and statistics 1996–2007.
nWaB=northwest arctic Borough.

Chapter 2: CanCer
North Slope Borough Baseline Community Health Analysis|135
Among Alaska Natives specifically, colon cancer incidence in the Barrow service unit was not signifi-cantly different from the average rate of the other service units combined during 1989–2003.6
Figure 2.7: Colon Cancer Incidence Rates for Alaska Natives, by I.H.S. Service Unit and Gender, 1989–2003
!"#$%&'()*+',-.-/',0/1&%'2/1"3&/1&'405&6'7-%'8.0690':05";&6<'=>'2)?)@)'@&%;"1&'A/"5'0/3'B&/3&%+'CDEDF(GGH''''
!
CCC'
CCD'
CIG'
ED'
D*'
CIG'
CIH'
EE'
CGG'
C(D'
CCJ'
EH'
EK'
KK'
CCE'
C(*'
8/1L-%0#&'
M0%%-N'
M%"65-.'M0>'
2/5&%"-%'
O-5P&=$&'
Q-$/5'R3#&1$S=&'
:-%5-/'@-$/3'
T$9-/'O$69-9N"S'
Q&/'
U-S&/'
Rates are per 100,000 population, age-adjusted to 2000 u.s. standard population.
iHs service units include alaska native residents residing in communities served by the respective tribal health organization. the Barrow service unit includes residents of communities served by the arctic slope native association and thus does not include point Hope.
Data source: lanier et al., Cancer in alaska natives 1969–2003: 35-year Report.
2.1.2. Cancer Mortality Over the last 20 years, cancer mortality rates in the NSB have been higher than statewide and national rates, although the differences are not statistically significant. Cancer mortality rates have been declining in Alaska and in the U.S., although this trend is not apparent in the NSB.7,8
Figure 2.8: Cancer Mortality Trends, 1990–2009: Cancer deaths per 100,000 population!"#$%&'A)K*'U21E&%'`-%.23".@'Y%&1/7*''U21E&%'Z&2.57',&%'(NNHNNN';-,$32."-1H'(LLNaANNL'
! !!
(>N'
ANN'
A>N'
<NN'
<>N'
869'
:327Q2'
4&23.5@':327Q217'AN(N'Y2%#&.'
[)6)'
nsB and alaska data source: alaska Bureau of Vital statistics.
nsB data source: national Center for Health statistics, Health, United States, 2008, and Health, United States 2007, with Chartbook on Trends in Health of Americans.u.s. rates are for the single, midpoint year of the time period noted.
all rates are age-adjusted to u.s. 2000 standard population.
Combining over a decade of cancer mortality rates for all malignancies combined, the age-adjusted aver-age annual rate in the NSB is almost 25% higher than the statewide mortality rate. The difference in rates does not quite reach statistical significance, however.3 The Healthy Alaskans 2010 target is to reduce the overall cancer death rate to 162/100,000.28

136|Part II: Full Report|Chapter 2: Cancer
Figure 2.9: Cancer Mortality Comparison: Number of cancer deaths per 100,000 population in the NSB and Alaska, 1996–2007!"#$%&'()*+',-./&%'01%2-3"24',156-%"71.+''8$59&%'1:',-./&%';&-2<7'6&%'=>>?>>>'@16$3-2"1.'".'2<&'8AB'-.C'D3-7E-?'=**FG(>>H'
!
(IF'
=*>'
8AB'J=KLM(*FN'
D3-7E-'J=KFM=*LN'
Data source: alaska Cancer Registry.
Rates are age-adjusted to 2000 u.s. standard population.
Lung cancer is a particularly deadly cancer and the leading cause of cancer death in the NSB, causing 35 of the 90 cancer deaths between 1996 and 2007. Of these deaths, 28 were in males and 7 in females. Lung cancer caused more than four times the number deaths attributed to stomach or colorectal cancer deaths, the next most common causes of cancer death.3
Table 2.1: Cancer Deaths in the NSB, 1996–2007
Site Number of Deaths
lung and bronchus 35
stomach 8
Colon and rectum 8
pancreas 7
oral cavity and pharynx *
esophagus *
Gallbladder *
peritoneum, omentum, and mesentery *
soft tissue *
Kidney *
Brain and other nervous system *
non-Hodgkin lymphoma *
myeloma *
miscellaneous malignancies 15
*Fewer than six cases.
Data source: alaska Cancer Registry.
2.1.3. Cancer Trends and Disparities in Alaska Natives Statewide and Among Circumpolar Inuit Cancer is an area of health disparity for Alaska Natives. Alaska Natives have experienced marked increases in cancer rates over the past 30 years and have cancer mortality rates that are significantly higher than rates among U.S. and Alaska whites.6,9 Statewide, cancers are diagnosed at similar stages among Alaska Natives and U.S. whites, but relative five-year survival rates for all invasive cancers, as well as for many specific sites, are significantly lower among Alaska Natives than for U.S. whites.6
Cancer in general has been increasing among Alaska Natives6 and among Inuit in all regions, among both men and women.2 The increasing cancer rates among Alaska Natives and among circumpolar Inuit have been due primarily to increases in lung and colon cancer. Lung cancer incidence among Alaska Native men doubled between 1969 and 2003, whereas among Alaska Native women, lung cancer incidence more than quadrupled.6 Colon cancer has also increased dramatically among both Alaska Native men and women. Cervical cancer rates have decreased due to the use of screening pap smears. For a number of cancer sites, incidence is higher among Alaska Natives than U.S. whites. These include oral cavity and pharynx, esophagus, stomach, colon-rectum, liver, gallbladder, pancreas, lung, and kidney.6
Several cancers, while relatively rare, are many times higher in Inuit populations than among other popu-lations. These so-called “traditional cancers” include nasopharyngeal and salivary cancers, both of which are associated with a viral infection called Epstein-Barr virus. Other cancers, including prostate cancer and brain cancer, affect Inuit in circumpolar regions at lower rates than in other populations,2,11 leading
Chapter 2: CanCer
North Slope Borough Baseline Community Health Analysis|137
researchers to search for genetic differences and environmental, diet, and lifestyle factors that may be protective against these types of cancer.11,12 The cancer incidence rate for all cancers combined is similar in Alaska Native children and U.S. white children.13
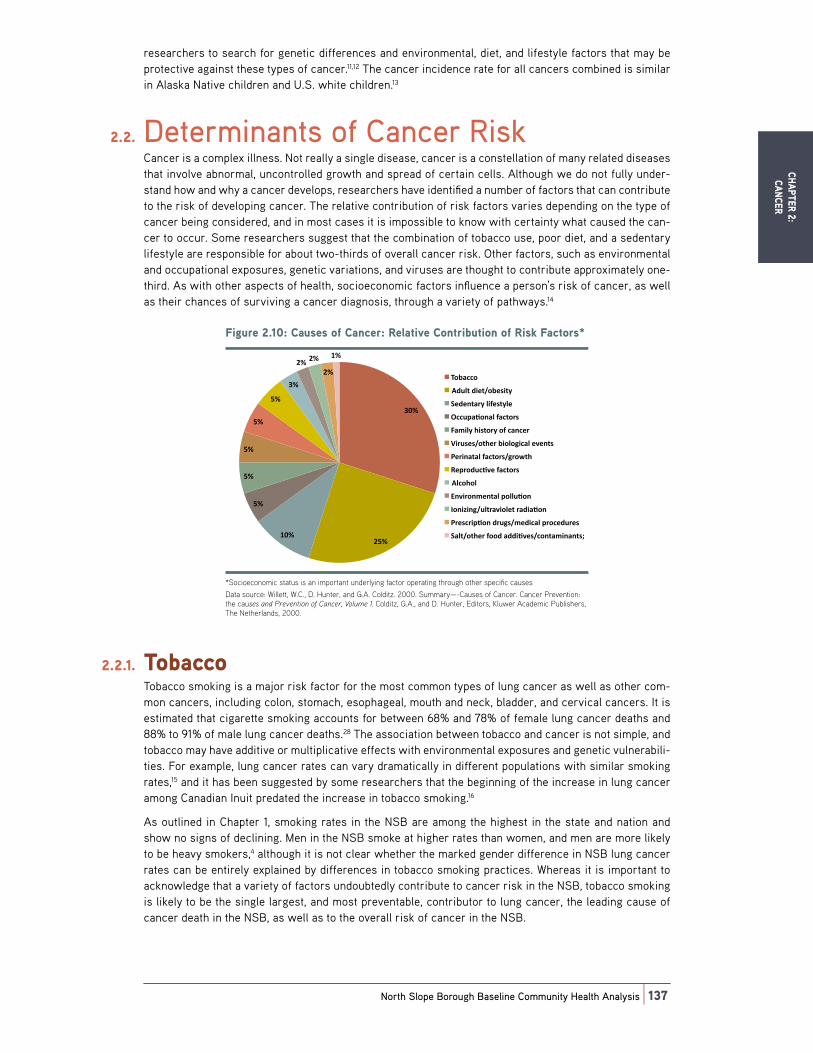
2.2. Determinants of Cancer Risk Cancer is a complex illness. Not really a single disease, cancer is a constellation of many related diseases that involve abnormal, uncontrolled growth and spread of certain cells. Although we do not fully under-stand how and why a cancer develops, researchers have identified a number of factors that can contribute to the risk of developing cancer. The relative contribution of risk factors varies depending on the type of cancer being considered, and in most cases it is impossible to know with certainty what caused the can-cer to occur. Some researchers suggest that the combination of tobacco use, poor diet, and a sedentary lifestyle are responsible for about two-thirds of overall cancer risk. Other factors, such as environmental and occupational exposures, genetic variations, and viruses are thought to contribute approximately one-third. As with other aspects of health, socioeconomic factors influence a person’s risk of cancer, as well as their chances of surviving a cancer diagnosis, through a variety of pathways.14
Figure 2.10: Causes of Cancer: Relative Contribution of Risk Factors*
!"#$%&'A)(N*'U2$7&7'-F'U21E&%*''+&32."X&'U-1.%"I$."-1'-F'+"7Q'!2E.-%7d'
!
<N='
A>='(N='
>='
>='
>='
>='
>='
<='
A='A='
A='
(='
Y-I2EE-'
:/$3.'/"&.e-I&7".@'
6&/&1.2%@'3"F&7.@3&'
VEE$,2W-123'F2E.-%7'
!2R"3@'5"7.-%@'-F'E21E&%'
?"%$7&7e-.5&%'I"-3-#"E23'&X&1.7'
;&%"12.23'F2E.-%7e#%-G.5'
+&,%-/$EWX&'F2E.-%7'
:3E-5-3'
C1X"%-1R&1.23',-33$W-1'
S-1"k"1#e$3.%2X"-3&.'%2/"2W-1'
;%&7E%",W-1'/%$#7eR&/"E23',%-E&/$%&7'
623.e-.5&%'F--/'2//"WX&7eE-1.2R"121.7w'
*socioeconomic status is an important underlying factor operating through other specific causes
Data source: Willett, W.C., D. Hunter, and G.a. Colditz. 2000. summary—-Causes of Cancer. Cancer prevention: the causes and Prevention of Cancer, Volume 1. Colditz, G.a., and D. Hunter, editors, Kluwer academic publishers, the netherlands, 2000.
2.2.1. TobaccoTobacco smoking is a major risk factor for the most common types of lung cancer as well as other com-mon cancers, including colon, stomach, esophageal, mouth and neck, bladder, and cervical cancers. It is estimated that cigarette smoking accounts for between 68% and 78% of female lung cancer deaths and 88% to 91% of male lung cancer deaths.28 The association between tobacco and cancer is not simple, and tobacco may have additive or multiplicative effects with environmental exposures and genetic vulnerabili-ties. For example, lung cancer rates can vary dramatically in different populations with similar smoking rates,15 and it has been suggested by some researchers that the beginning of the increase in lung cancer among Canadian Inuit predated the increase in tobacco smoking.16
As outlined in Chapter 1, smoking rates in the NSB are among the highest in the state and nation and show no signs of declining. Men in the NSB smoke at higher rates than women, and men are more likely to be heavy smokers,4 although it is not clear whether the marked gender difference in NSB lung cancer rates can be entirely explained by differences in tobacco smoking practices. Whereas it is important to acknowledge that a variety of factors undoubtedly contribute to cancer risk in the NSB, tobacco smoking is likely to be the single largest, and most preventable, contributor to lung cancer, the leading cause of cancer death in the NSB, as well as to the overall risk of cancer in the NSB.

138|Part II: Full Report|Chapter 2: Cancer
2.2.2. Diet and LifestyleDiets high in fruits and vegetables have been linked with a decreased risk of colon cancer, while diets high in red and processed meats have been associated with an increased risk of colon cancer,17 the sec-ond most common cancer in the NSB and one with higher rates than are seen statewide. Physical inactiv-ity and obesity, as well as heavy alcohol use, are also associated with an increase risk of colon cancer.17 Breast cancer is also associated with obesity and dietary factors, in addition to reproductive factors such as lower number of children, older age at first birth, and length of breastfeeding.17 Recent research sug-gests a possible association between pancreatic cancer, the fourth leading cause of cancer death in the NSB, and high consumption of soda pop.18
Subsistence foods may reduce the risk of some cancers. For example, consumption of subsistence foods rich in omega-3 fatty acids and selenium have been associated with reduced rates of prostate cancer in Canadian Inuit.11 The documented decline of subsistence foods consumption and replacement with pro-cessed store foods and sugared beverages among Alaska Natives in some parts of the state may be con-tributing to the increase in cancer in this group. Similar to many other communities in Alaska and the U.S., the NSB has experienced rising rates of obesity and diabetes, as outlined in Chapter 4. Similar to other communities in Alaska and the U.S., a majority of NSB residents also report levels of fruit and vegetable consumption and physical activity that are below recommended levels, as outlined in Chapter 1. More-over, levels of soda consumption in the NSB are well above statewide estimates. These patterns may be contributing to the risk of colon, breast, and other cancers in the NSB, although the continuing tradition of subsistence hunting and using local subsistence foods may be having an important protective effect.
2.2.3. Environmental FactorsEnvironmental causes of cancer have been a topic of particular concern in the NSB and throughout the circumpolar arctic, where global contaminants concentrate in the subsistence food chain and local indus-trial activity is a source of environmental pollution. Some NSB residents have expressed concerns about pollution from oil and gas development and its role in increasing rates of cancer in the NSB. Many North Slope residents are also concerned about possible health effects of exposure to radiation from sources such as radioactive fallout, the intentional dumping of radioactive materials, and the administration of the radioactive Iodine-131 to inadequately informed residents of Wainwright, Point Lay, Point Hope, and Anaktuvuk Pass during the now infamous 1957 thyroid function experiment.19
Generally, the contribution of known environmental cancer risk factors is thought to be far smaller than that of smoking and lifestyle factors.14 The environmental contribution to cancer risk cannot be dismissed, however, and may be larger than previously thought. A recent presidential report suggests that nation-wide, the environmental contributions to cancer have been grossly underestimated. The report cites the tens of thousands of unregulated chemicals in daily use today, some of which are known to cause cancer while most have never been rigorously tested for safety. In addition, the report recognizes the U.S. military as a major source of toxic occupational and environmental exposures that can increase the risk of cancer.21 Moreover, the combined effect of multiple low-level exposures must be considered when analyzing health risks.
The growing body of research, reviewed in Chapter 1, is demonstrating that the current health risks of radiation and other contaminants are very likely to be minimal in the Alaskan arctic, particularly when viewed relative to the health risks of other factors, such as smoking and obesity. The North Slope receives lower levels of global pollution than arctic Canada and Greenland, and in the NSB and throughout Alaska, the health benefits of subsistence foods, potentially including a reduction of cancer risk, are generally felt to outweigh any potential health risks caused by environmental contaminants.
The contribution to cancer risk in the NSB from air pollution generated by industrial and natural resource development activities has not been studied to the knowledge of the author. About 1- to 2% of lung can-cer deaths are attributable to air pollution in the U.S.28 Although many questions about air quality in the NSB remain unanswered, a recent examination of air pollution levels in Nuiqsut was somewhat reas-suring on this point.20 Diesel exhaust and other sources of air pollution may, however, increase the risk of certain cancers, and the number of vehicles registered in the NSB has increased considerably in the past 10 years. In addition, all but two villages (Barrow and Nuiqsut) use diesel oil as the primary way of heating homes and generating electricity. Environmental tobacco smoke is another environmental risk

Chapter 2: CanCer
North Slope Borough Baseline Community Health Analysis|139
factor for lung and other cancers. The city of Barrow has taken steps to decrease environmental tobacco smoke through a clean-indoor-air ordinance that prohibits smoking in restaurants, in addition to public governmental buildings. Previous NSB Census reports have documented a high level of awareness of the dangers of second-hand tobacco smoke. In the 2010 NSB Census, 95% of non-smoking household heads prohibit smoking in their home, but one of three household heads who smoke still allow smoking in their home.
Concerning the contribution of radioactivity to cancer risk in the North Slope specifically, cancer risk calculations have determined that in a worst-case scenario (likely overestimating the true risk by a factor of 10 to 1000), a maximum of 3.6 cases of cancer would have developed in North Slope villages over a 20-year period because of radioactive fallout burdens.19 Analyses of radioactivity levels of caribou and marine species in the North Slope have also demonstrated the safety of these important subsistence resources.22,23 At the state level, no increase in radiation-related cancers has been detected in Alaska Natives, nor have residents of Iñupiat villages exposed to increased levels of radiation been found to have higher rates of the types of cancers that result from radioactive fallout.19 At the state level, there also does not appear to be any excess in radiation-associated cancers in Alaska Native children, compared with U.S. white children.13 Caution is warranted in drawing any conclusions from such epidemiologic data, however, due to very small numbers of cases in individual villages and to the relative rarity of cancers associated with radiation exposure. Commissioned by the NSB, one small study of cancer cases in Point Hope raised concerns about possible environmental exposures by suggesting an association between cancer cases and residence in the village in 1962, the year that radioactive waste was dumped in a sub-sistence hunting area outside the village, known as the Project Chariot incident.24 Also commissioned by the NSB, a follow-up investigation of the 1957 radioactive Iodine-131 experiment found one case of thyroid cancer among former participants but concluded that the contribution to cancer risk among participants was extremely difficult to quantify.19
Of additional note, the relatively high rates of stomach cancer in rural Alaska and among Alaska Natives are thought to have a cause that is at least, in part, environmental. One risk factor for stomach cancer is chronic infection with the bacteria Helicobacter pylori.25 Infection with H.� pylori is associated with inadequate water and sanitation facilities, common in rural Alaska. It is possible that the improvements to sanitation infrastructure in the NSB have decreased this particular risk factor for cancer in the NSB.
2.2.4. Cancer Screening and Early DetectionSome types of cancer can be detected at early, potentially curable, stages through screening tests. Cervi-cal, breast, and colon cancer are the forms of cancer with screening tests that have been the most widely studied and supported by research.
2.2.4.1. Cervical Cancer ScreeningThe introduction of the routine Pap test, or Pap smear, has dramatically reduced the incidence and mor-tality of cervical cancer nationwide, including among Alaska Natives.6 Based on data from ASNA’s elec-tronic health record database, however, in 2007, 62.6% of Alaska Native women aged 21–64 years in the Barrow service unit (without history of hysterectomy) have had a documented Pap within the previous three years. This number was lower than the percentage of Alaska Natives statewide (74.9%) for the same year.26 These data do not include the village of Point Hope. Although these data have the benefit of documentation from electronic health records rather than self-report, the database may not fully capture records of Pap tests done outside the local health care system.
According to BRFSS survey data, based on a sample of 72 NSB women in 2005–2007, 93% (C.I. 79–97%) of surveyed NSB women aged 18 and over (without a history of hysterectomy) reported having had a Pap smear within the previous 3 years. This number is higher than the statewide estimate of 87% for 2006, but the NSB estimate is based on a small sample and the difference is not statistically significant.27 The Healthy Alaskans 2010 objective is to increase the percentage of women aged 18 years and older who have had a Pap test within three years to 96%.28
The percentage of Alaskan women who report having had a Pap test within the last three years has con-sistently been higher than the national average. In Alaska in 2006, there was not a significant difference in the percentage of Native vs. non-Native women who have had the test, and no differences were noted by age, education, or income level.2

140|Part II: Full Report|Chapter 2: Cancer
A vaccine to prevent cervical cancer was approved in 2006. The vaccine, which protects against infection with certain types of the human papilloma virus (HPV), is currently recommended for all girls and women aged nine to 26 years and the vaccine has recently been recommended for boys also as it has been found to protect against certain other types of cancer as well. The state of Alaska pays for the vaccine for girls age nine through 18 years who are eligible for the Vaccines for Children program. Data on vaccination rates in the NSB are not currently available, to the author’s knowledge.
2.2.4.2. Breast Cancer ScreeningData from ASNA’s electronic health records database suggest that breast cancer screening rates for Alaska Native women in the ASNA service area may be lower than in other service areas. In 2007, 48.3% of Alaska Native women in the Arctic Slope service area aged 52–64 years were documented to have received a mammogram within two years, compared with 61.8% of Alaska Native women statewide.26 These data do not include the village of Point Hope. Again, it is possible that these data may not fully capture screening received outside the local service area.
BRFSS survey data on mammographic screening for the NSB are not available because of insufficient sam-ple size. In Alaska and nationwide, the prevalence of mammography screening has been increasing since the early 1990s. In 2006, 73% of Alaskan women over the age of 40 years reported obtaining a mammogram in the prior two years. The percentage was higher for Native (81%) than for non-Native (72%) women, but this difference was not statistically significant.27 The Healthy Alaskans 2010 target is for 76% of women aged 40 years and older to have received a mammogram within the preceding two years.28
2.2.4.3. Colon Cancer Screening Data from ASNA’s electronic health records database suggest that colon cancer screening rates among Alaska Natives, as of 2007, were lower than statewide rates. In 2007, only 11.5% of Arctic Slope Alaska Native people aged 51–80 years were documented to have had lower colorectal cancer screening.26 Data do not include the village of Point Hope. This number is likely to increase significantly with the addition of colonoscopy services through ASNA’s Screening for Life program. Since, until recently, colonoscopies were only available outside the Barrow service area, it is also likely that some off-slope colon cancer screenings were not included in these estimates.
BRFSS survey data for the NSB on colon cancer screening are not available because of insufficient sample size. The number of U.S. and Alaskan adults over 50 undergoing colon cancer screening has increased over the past decade.27 In 2006, 55% of Alaskan survey respondents over age 50 years reported ever having had a sigmoidoscopy or colonoscopy. There were no significant differences by gender or race in the prevalence of ever having had a home blood stool test or colonoscopy or sigmoidoscopy, but screening rates increased with income and level of education.27 The Healthy Alaskans 2010 target is for 64% of adults aged 50 years and older to have received colorectal screening examination (sigmoidoscopy or colonoscopy).28
Chapter 2 Endnotes1. Surveillance and End Results (SEER) Program http://seer.cancer.gov/index.html.
2. Kelly, J., A. Lanier, M. Santos, S. Healey, R. Louchini, J. Friborg, K. Young, and C. Ng. Circumpolar Inuit Cancer Review Working Group. Cancer Among the Circumpolar Inuit, 1989–2003 II Patterns and trends. International�Journal�of�Circumpolar�Health 67, no. 5 (2008): 408–420.
3. Alaska Cancer Registry: http://www.hss.state.ak.us/dph/bvs/data/default.htm.
4. Bowerman, R.J. Alaska Native cancer epidemiology in the arctic. Public�Health 112, no. 1, (1998): 7–13.
5. Centers for Disease Control and Prevention. Cancer Data and Statistics. Accessed online at http://www.cdc.gov/cancer/dcpc/data/.
6. Cancer�in�Alaska�Natives�1969–2003:�35-Year�Report.�Lanier, A.P., J.J. Kelly, J. Maxwell, T. McEvoy, and C. Homan. Office of Alaska Native Health Research and Alaska Native Epidemiology Center,�Alaska Native Tribal Health Consortium, January 2006. http://www.anthc.org/chs/epicenter/upload/Cancer_Incidence_35-Year_Report.pdf.
7. Alaska Bureau of Vital Statistics (ABVS): http://www.hss.state.ak.us/dph/bvs/data/default.htm.
8. Health,�United�States,�2007,�with�Chartbook�onTrends�in�the�Health�of�Americans.�National Center for Health Statistics,�Hyattsville, MD, 2007. Accessed online at http://www.ncbi.nlm.nih.gov/bookshelf/br.fcgi?book=healthus07.

Chapter 2: CanCer
North Slope Borough Baseline Community Health Analysis|141
9. Alaska�Native�Health�Status�Report. Prepared by the Alaska Native Epidemiology Center, Alaska Native Tribal Health Consortium. August, 2009. http://www.anthc.org/chs/epicenter/upload/ANHSR.pdf.
10. Lanier, A. Cancer incidence in Alaska Natives: Comparison of two time periods, 1989–93 vs 1969–73. Cancer�83, suppl. 8 (1998): 1815–1817.
11. Dewailly,E., G. Mulvad, H. Pedersen, J.C. Hansen, N. Behrendt, and J.P. Hansen. Inuit are protected against prostate cancer. Cancer�Epidemiology,�Biomarkers,�and�Prevention 12(2003): 926–927.
12. Friborg, J.T., and M. Melbye. Cancer patterns in Inuit populations. Lancet�Oncology�9, no. 12 (2008): 1124.
13. Lanier, A., P. Holck, G. Ehrsam Day,and C. Key. Childhood cancer among Alaska Natives. Pediatrics�112, no. 5 (2003): e396.
14. Willett, W.C., D. Hunter, and G.A. Colditz. 2000. Summary—Causes of Cancer. Cancer�Prevention:�the�causes��and�Prevention�of�Cancer,�Volume�1.�G.A. Colditz and D. Hunter Editors, Kluwer Academic Publishers, The Netherlands, 2000.
15. Bowerman, R.J. Alaska Native cancer epidemiology in the arctic. Public�Health 112, no. 1, (1998): 7–13.
16. Miller, A.B., and L.A. Gaudetta. Cancer of the respiratory system in Circumpolar Inuit. Acta�Oncologica�35, no. 5 (1996): 571–576.
17. American Cancer Society: http://www.cancer.org/.
18. Mueller, N.T., A. Odegaard, K. Anderson, J.M. Yuan, M. Gross, W.P. Koh, and M.A. Pereira. Soft drink and juice consumption and risk of pancreatic cancer: the Singapore Chinese Health Study. Cancer�Epidemiology,�Biomarkers,�and�Prevention�19, no. 2 (2010): 447–455.
19. Investigation�and�Analysis�of�the�Arctic�Aeromedical�Laboratory’s�Thyroid�Function�Experiment�on�Humans�and�the�U.S.�Government’s�Response, prepared for the NSB by Petumenos, T., J. Woodruff, R. Buckendorf, Birch, Horton, Bittner and Cherot, and J. Ruttenber. January, 1997. Provided courtesy of the NSB, Tuzzy Consortium Library.
20. Driscoll, D. Director, Institute for Circumpolar Health Studies. University of Alaska Anchorage. Personal communication, September22, 2010 and March 4,2011.
21. Reducing�Environmental�Cancer�Risk:�What�We�can�Do�Now.�2008–2009 Annual Report of the President’s Cancer Panel. Accessed online at http://deainfo.nci.nih.gov/advisory/pcp/annualReports/pcp08-09rpt/PCP_Report_08-09_508.pdf.
22. Cooper, L.W., I.L. Larsen, T.M. O’Hara, S. Dolvin, V.M. Woshner, and G.F. Cota. Radionuclide contaminant burdens in arctic marine mammals harvested during subsistence hunting. Arctic 53, no. 2 (2000): 174–182.
23. O’Hara, T., D. Dasher, J. George, and V. Woshner. Radionuclide Levels in Caribou of Northern Alaska in 1995–96. Arctic 52, no. 3 (1999): 279–288.
24. Bowerman, R.J. A case-control study of cancer risk factors in the Alaskan Arctic: responding to village concern about environmental radiation. Arctic�Medical�Research 55 (1996): 129–134.
25. National Cancer Institute. U.S. National Institutes of Health. Helicobacter�pylori and Cancer. Accessed online at http://www.cancer.gov/cancertopics/factsheet/Risk/h-pylori-cancer.
26. Regional�Health�Profile,�Arctic�Slope; prepared by Alaska Native Epidemiology Center. April, 2009. Accessed online at http://www.anthc.org/chs/epicenter/upload/Regional_Health_Profile_ASNA_1109.pdf.
27. Behavioral Risk Factor Surveillance System (BRFSS): Statewide data accessed online at http://www.hss.state.ak.us/dph/chronic/hsl/brfss/default.htm. NSB-specific data for 1991–2007 was provided upon request for this report by the Alaska Department of Health and Social Services, Chronic Disease Prevention and Health Promotion, Division of Public Health.
28. Healthy�Alaskans�2010�Volume�I:�Targets�and�Strategies�for�Improved�Health:�Targets�for�Improved�Health, Alaska Department of Health and Social Services, Division of Public Health, November 2005. Available online at http://www.hss.state.ak.us/DPH/targets/ha2010/default.htm.
