chapter 2 genetic relationships among populations of
TRANSCRIPT
65
Chapter 2
Genetic relationships among populations of Cosmopolites
sordidus based on AFLP analysis
66
Abstract The banana weevil, Cosmopolites sordidus, is a serious pest of banana and plantain
(Musa) and has been distributed to most areas where the crops are grown. Pest status
is variable around the world, and may be influenced by genetically distinct
populations of weevil. The limited mobility of banana weevils suggests restricted
gene flow and the evolution of biotypes within areas. The aim of the study was to
quantify the genetic relatedness within and among geographically separated
populations of C. sordidus. Six populations from four countries were sampled:
Australia, Costa Rica, South Africa (South Coast, North Coast and Tzaneen) and
Uganda. DNA was isolated from 12 individuals per population and subjected to
amplified fragment length polymorphism (AFLP) analysis. The AFLP analysis
involved DNA restriction with EcoRI and PstI enzymes, ligation of adapters, and a
pre-selective and five selective PCR amplifications. Empirical analysis of the AFLP
fingerprints showed that, within populations, genetic diversity varied from 16-53%
(the proportion of polymorphic loci), with the South Coast and Tzaneen/Australian
populations the least and most variable, respectively. The coefficient of gene
differentiation showed that the Tzaneen population were the most differentiated from
the South Coast population, while the South and North Coast populations were the
most similar. All the populations showed statistically distinct marker frequencies,
except for the Costa Rican and South and North Coast populations, which were
similar. Based on the simple mismatch coefficient, a neighbour-joining tree showed
the Australian, Ugandan and South African coastal populations produced
monophyletic groups, while the South African Tzaneen population were removed
from the other populations and presented an ancestral state.
Keywords: AFLP, insect, population genetics, Cosmopolites
67
2.1 Introduction The banana weevil borer, Cosmopolites sordidus (Germar), has been recorded as the
most important insect pest of banana and plantain in the world (Waterhouse & Norris
1987; Gold et al. 1999). The weevil is found in almost all banana growing areas, with
only regions of North Africa and Israel apparently free of the pest (Cardenosa 1953,
Cuillé & Vilardebó 1963, Simmonds 1966, Castrillon 1991, Gettman et al. 1992;
Robinson 1996). Damage results from larvae tunnelling in the rhizome, thereby
causing a reduction in yield and lodging of plants. Yield losses of between 20 and
100% have been associated with banana weevil infestations (Mitchell 1980,
Anonymous 1986, Koppenhöfer & Schmutterer 1993, Peña et al. 1993; Rukazambuga
et al. 1998). Dissemination most often takes place by means of infested plant material,
but crawling adults also colonise nearby plantations (Feakin 1971, Franzmann 1972,
Waterhouse & Norris 1987; Seshu Reddy et al. 1999). The cryptic nature of the
banana weevil, and the fact that infestation symptoms of the weevil resemble
nematode and bacterial head rot (rhizome rot) (Erwinia spp.) damage (Jones 2000)
has caused the time of its introduction(s) to be underestimated, and allowed the pest to
remain undetected in certain areas (Gold et al. 2003).
The weevil has been reported as a major production constraint in several
tropical and subtropical localities (Froggatt 1926, Harris 1947, Braithwaite 1963,
Sikora et al. 1989, Seshu Reddy 1993, Davide 1994; Maolin 1994), including the
Indo-Malayian region, its presumed area of origin (Zimmerman 1968c, Stover &
Simmonds 1987; Vittayaruk et al. 1994). Empirical pest status, however, is unsure
(Ostmark 1974), and appears to be related to several factors, including weevil
biotypes (Fogain & Price 1994; Gowen 1995). Biotypes have been defined as
organisms that share a specified genotype or the genotype (or peculiarities) so shared
(Anonymous 2005), and as a population within an insect species that differs in their
ability to utilise a crop plant (Gallun & Khush 1980). Maxwell & Jennings (1980)
described a biotype as an individual or a population that is distinguished from the rest
of its species by criteria other than morphology, e.g. a difference in parasite ability.
The latter definition should be applied with caution, as dimorphic biotypes have been
reported (Starks & Burton 1972; Saxena & Rueda 1982).
The Cosmopolites genus (Coleoptera: Curculionidae: Rhynchophorinae)
comprise only two species, the banana weevil, C. sordidus and C. pruinosus Heller
68
(Zimmerman 1968a, b, c). Cosmopolites pruinosus is morphologically very similar to
C. sordidus, but differs externally in the nature of pruinosity on the dorsum and the
character of the elytral striae (Zimmerman 1968a, c). The former is associated with
bananas in Borneo, Philippines and the Caroline Islands (Zimmerman 1968a, b) and
considered to be a secondary pest species (Masanza 2003). Zimmerman (1968c)
provided taxonomic keys for the species. The limited mobility of banana weevils
suggests the existence of isolated populations with restricted gene flow, and also the
evolution of new biotypes (Gold et al. 2003). The occurrence of weevil biotypes has
been postulated after pathogenicity of an entomopathogenic nematode strain varied
between geographically different populations of C. sordidus (Parniski et al. 1990;
Kermarrec et al. 1993). Traore et al. (1993) also suggested that weevil biotypes exist
with different developmental temperature requirements. Studies on banana tolerance
or resistance were cautioned to consider possible geographical differences between
weevil populations (Fogain & Price 1994). Different biotypes could also have
contributed to variable weevil responses to semiochemical trapping in different
countries (De Graaf et al. 2005). Genetic research using random amplified
polymorphic DNA (RAPD)-PCR produced variable results, but generally supported
the existence of weevil biotypes (Ochieng 2001; Gold et al. 2003). The applicability
of the method, however, is limited (Vos et al. 1995; Zhu-Salzman et al. 2003),
because of extreme sensitivity to variations in experimental conditions (Ellsworth et
al. 1993, Muralidharan & Wakeland 1993, Vos et al. 1995; Mueller & Wolfenbarger
1999).
Amplified fragment length polymorphism (AFLP) analysis is considered to
be the ideal marker system for resolving genetic relatedness among individual
organisms, populations and species (Mueller & Wolfenbarger 1999). The technique,
developed by Vos et al. (1995), and originally known as selective restriction
fragment amplification (SRFA) (Zabeau & Vos 1993), is a high-throughput, highly
reproducible genome wide DNA fingerprinting technique. AFLP generates a large
number of potential markers across the genome that may counteract the low
information content of its dominant markers. The identity of same sized fragments is
unknown, but the possibility that products of different loci have the same molecular
weight is probably very small for closely related species (Yan et al. 1999; Kosman &
Leonard 2005). It has proven to be a powerful method for characterising infraspecific
polymorphism among insects (Reineke et al. 1999, Yan et al. 1999, Parsons & Shaw
69
2001, Ravel et al. 2001, Garcia et al. 2002; Carisio et al. 2004) and distinguishing
known insect biotypes (Cervera et al. 2000; Zhu-Salzman et al. 2003). Restriction
fragment length polymorphism (RFLP) and sequencing require more development
time with greater costs, and the number of independent loci assayed is often low
(Parsons & Shaw 2001).
The aim of the study was to determine the genetic relatedness within and
among populations of C. sordidus from different geographic origins using AFLPs.
The study will help to clarify the role of biotypes in host plant susceptibility, weevil
development and behaviour. In future it might provide useful information before the
implementation of integrated pest management strategies for countries affected by the
pest.
2.2 Material and methods 2.2.1 Sample collection and DNA extraction
Banana weevils, identified as C. sordidus according to the key provided in
Zimmerman (1968c), were collected from three geographical areas in South Africa
during 2004, and also from Australia, Costa Rica and Uganda (Table 2.1). Dissection
of residual pseudostems (Australian samples), split pseudostem traps (Ugandan and
South African South Coast samples) and pheromone (Cosmolure®) trapping (Costa
Rican and South African North Coast and Tzaneen samples) were used to collect
weevils. Before DNA extraction, all the weevils were preserved in absolute ethanol.
For molecular analysis, a total of 12 individuals (six females, six males) were
randomly selected per locality. Sitophilus orizae (L.) (Coleoptera: Curculionidae:
Rhynchophorinae), a weevil pest of stored grain, was used to serve as outgroup in this
study (Table 2.1).
Total genomic DNA was isolated from beetles with the abdomen, elytra and
wings removed. Weevils were first placed in a heat block at 55 °C for 10 minutes to
evaporate the ethanol and then re-hydrated in distilled water for 10 minutes. Samples
were frozen in liquid nitrogen and ground with Eppendorf micro-pestles in 1.5 ml
Eppendorf tubes (Hamburg, Germany). DNA extractions followed a commercial
protocol (High pure PCR template preparation kit, Roche Diagnostics, Mannheim,
Germany) and were stored at -20 °C.�
70
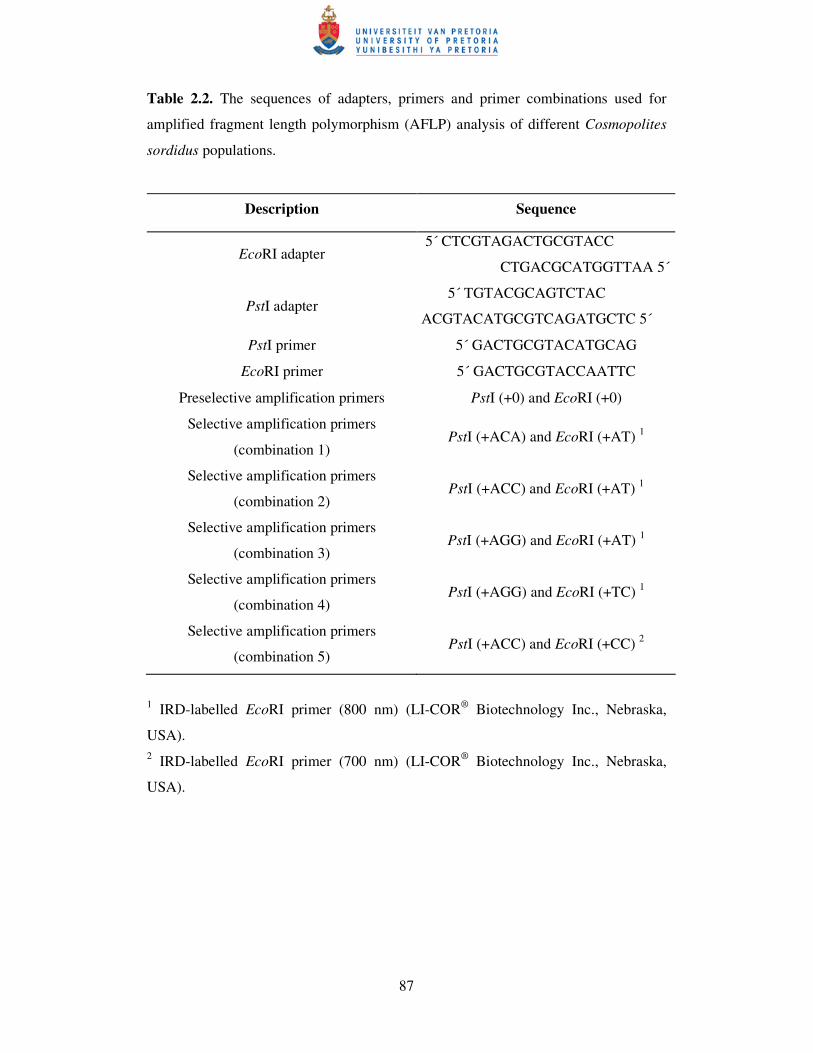
2.2.2 AFLP procedure
The method described by Vos et al. (1995) was followed with minor modifications.
Isolated DNA (100 ng) was restricted with two six-base recognition restriction
enzymes, EcoRI (Roche Molecular Biochemicals, Manheim, Germany) and PstI
(Fermentas International Inc., Ontario, Canada). The corresponding double stranded
adapters (Table 2.2) (Inqaba Biotechnical Industries (Pty) Ltd.) were subsequently
ligated to the sticky ends of fragments. EcoRI and PstI primers (Inqaba Biotechnical
Industries (Pty) Ltd.) with no selective nucleotides were used for preselective PCR
amplification (Table 2.2). An initial screening using 12 selective primer pair
combinations was performed on a randomly selected individual of each population.
Combinations providing clear and reproducible electrophoretic patterns with the
highest levels of polymorphisms between individuals were determined. Five EcoRI
(Biolegio BV Nijmegen/ Malden, The Netherlands) and PstI (Inqaba Biotechnical
Industries (Pty) Ltd.) primer combinations were selected for further analysis (Table
2.2).
Selective amplification products were analysed with a LI-COR® model 4200S
Automated DNA Analyser (LI-COR® Biotechnology Inc., Nebraska, USA).
Fragments were scored with the automated programme AFLP-Quantar Pro 1.0 (Key
Gene Products 2000) and confirmed by a visual check. Loci showing clear and
unambiguous banding patterns were scored and uncertain fragments were considered
as missing data. Band sizes were estimated with a standard size (50-700 bp) IRD-
labelled marker (LI-COR® Biotechnology Inc.).
2.2.3 Statistical analysis
To estimate the genetic diversity in and among C. sordidus populations, the following
assumptions were made: AFLP markers behave as diploid, dominant markers with
alleles either present (amplified, dominant alleles) or absent (not amplified, recessive
alleles), co-migrating fragments and fragments not amplified were identical among
and within populations; AFLP fragments segregated according to Mendelian
expectations, and genotypes at all AFLP loci were assumed to be in Hardy-Weinberg
equilibrium (Yan et al. 1999; Despres et al. 2002).
All the loci obtained with the five primer combinations were used in the
analyses. Genetic diversity within weevil populations was estimated from the
percentage of polymorphic loci out of all polymorphic loci (%PL), Shannon’s
71
Information Index (I) (Lewontin 1972) and Nei’s (1973) gene diversity (h), using
POPGENE version 1.31 (Yeh et al. 1997). Pair-wise Product-moment correlations of
the different indices were conducted in STATISTICA version 7 (Statsoft Inc. 2004).
To evaluate population structure in terms of among-population and among-group
differentiation, total genetic diversity was partitioned among groups, among
populations within groups, and within populations by conducting a hierarchical
analysis of molecular variance (AMOVA) on (the required) squared Euclidian pair-
wise distances (1000 permutations) (Excoffier et al. 1992, Huff et al. 1993, Peakall et
al. 1995; Despres et al. 2002) using ARLEQUIN version 2.000 (Schneider et al.
2000). Genetic differentiation among populations was assessed by calculating Nei’s
coefficient of gene differentiation, Gst (equivalent to Wright’s Fst) (Nei 1973) and
estimating gene flow, Nm (Slatkin & Barton 1989) from Gst (POPGENE version 1.31).
Interpopulation differentiation was scrutinised by using TFPGA version 1.3 (Miller
1997) to perform Monte Carlo approximations of Fisher’s exact (R�C) test (Raymond
& Rousset 1995) on marker frequencies at each locus between all pairs of
populations. To determine the phylogenic relationships among individuals, a
neighbour-joining dendrogram (Saitou & Nei 1987), based on the simple mismatch
coefficient (squared Euclidian distance), was constructed with 5000 bootstrap
(Felsenstein 1985) replications, using the program MEGA version 3.1 (Kumar et al.
2004) (Kosman & Leonard 2005). A correlation between Nei’s unbiased genetic
distance (Nei 1978) and simple mismatch coefficients and geographic distance (in
km) among populations (Garcia et al. 2002; Carisio et al. 2004) was investigated with
a Mantel test (Mantel 1967) using TFPGA version 1.3. The distance matrices were
transformed (ln (x+1)) and 10 000 random permutations used in the analysis (TFPGA
version 1.3).
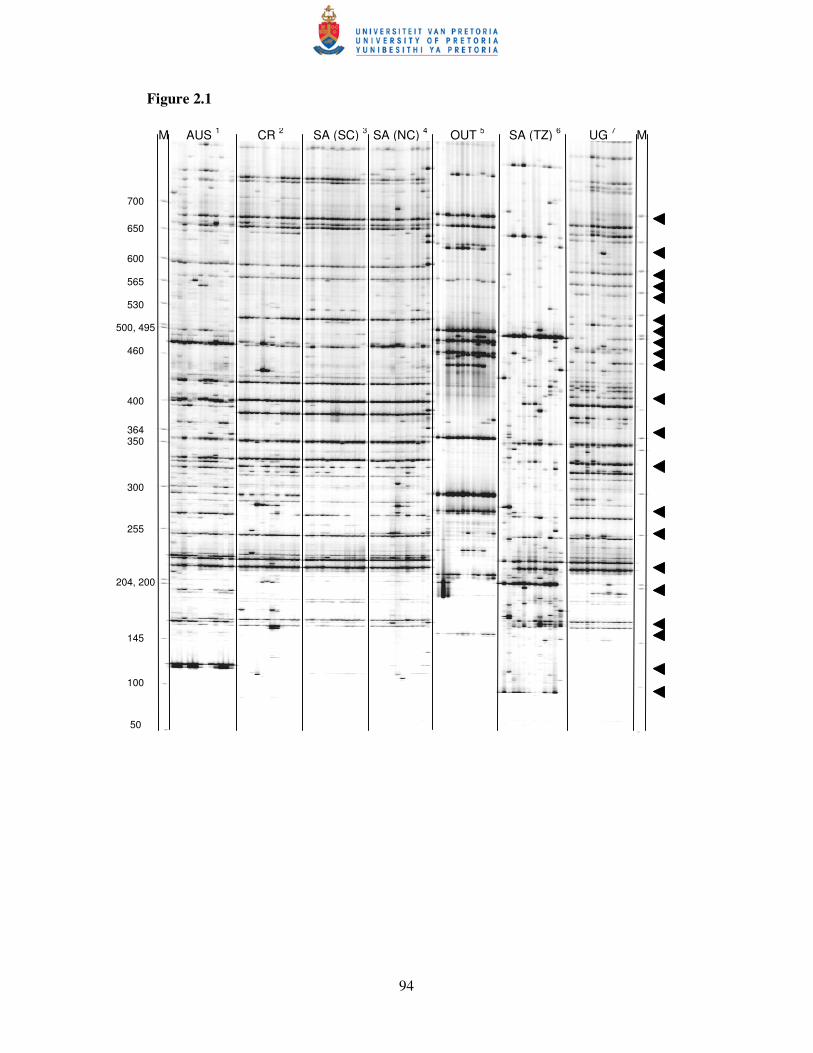
2.3 Results 2.3.1 AFLP patterns
Each primer combination produced approximately 100 to 150 amplified fragments
between 50-700 bp (Fig. 2.1), to give a total of 659 fragments, with 604 loci
polymorphic for C. sordidus. Visual assessment of all the raw data suggested that,
within banana weevil populations, the Tzaneen and Australian individuals showed
relatively high marker variability (Fig. 2.1). Unique bands were identified most
72
frequently for these populations, especially for Tzaneen, where bands were often
specific to individual level (Fig. 2.1). The Costa Rican and North and South Coast
populations from South Africa appeared to share relatively high levels of marker
homogeneity, with differences essentially based on band frequency. Similarities of the
Australian and Ugandan populations were also evident with the Costa Rican and
South African North and South Coast populations, while the South African samples
from Tzaneen showed a more distinct fingerprint. The outgroup demonstrated little
conformity with the other samples, and displayed the highest proportion of population
specific bands (Fig. 2.1).
2.3.2 Intra population genetic diversity
Empirical analysis of the loci showed that the Tzaneen (South Africa) and Australian
populations were the most variable, with 53.48% and 45.03% polymorphic loci,
respectively (Table 2.3). The South African South Coast population was the most
uniform (16.06 %PL), while the diversity of the remaining populations was close to
the overall mean of 35.02% polymorphic loci. The indices of Shannon (I) and Nei (h)
peaked at 0.169 and 0.101 for Tzaneen and 0.2 and 0.132 for Australia. The two
indices also supported the South Coast (South Africa) population as the least variable
(I=0.075, h=0.05). The three measures of intra population diversity were correlated (I
vs. h: R2=0.982; %PL vs. I: R2=0.787; %PL vs. h: R2=0.668, all P<0.001). Among all
the South African populations the percentage polymorphic loci, Shannon (I) and Nei
(h) diversity measures were (mean ± SD) 34.33 ± 18.73%, 0.126 ± 0.048 and 0.079 ±
0.026, respectively (data not shown).
2.3.3 Population structure
The AMOVA revealed that the genetic variation within C. sordidus was, in general,
equally divided among and within the populations studied (Table 2.4). Genetic
differences between populations were highly significant. Grouping of populations
showed significant structure when the South African coastal populations and the
Costa Rican population were combined and compared to the other populations. As a
group, the three South African populations were also significantly differentiated from
the other populations, but the proportion of variance contained in the former grouping
was higher (10.85%) than the latter (3.19%). In both groupings, the most variation
was contained within populations, while variation amongst populations was also high
73
(>40%) and showed significant differentiation. Amongst the South Coast, North
Coast and Tzaneen populations in South Africa, significant differences existed
(P<0.001), with 51.59% and 48.41% of genetic variation contained amongst and
within the populations, respectively (Table 2.4).
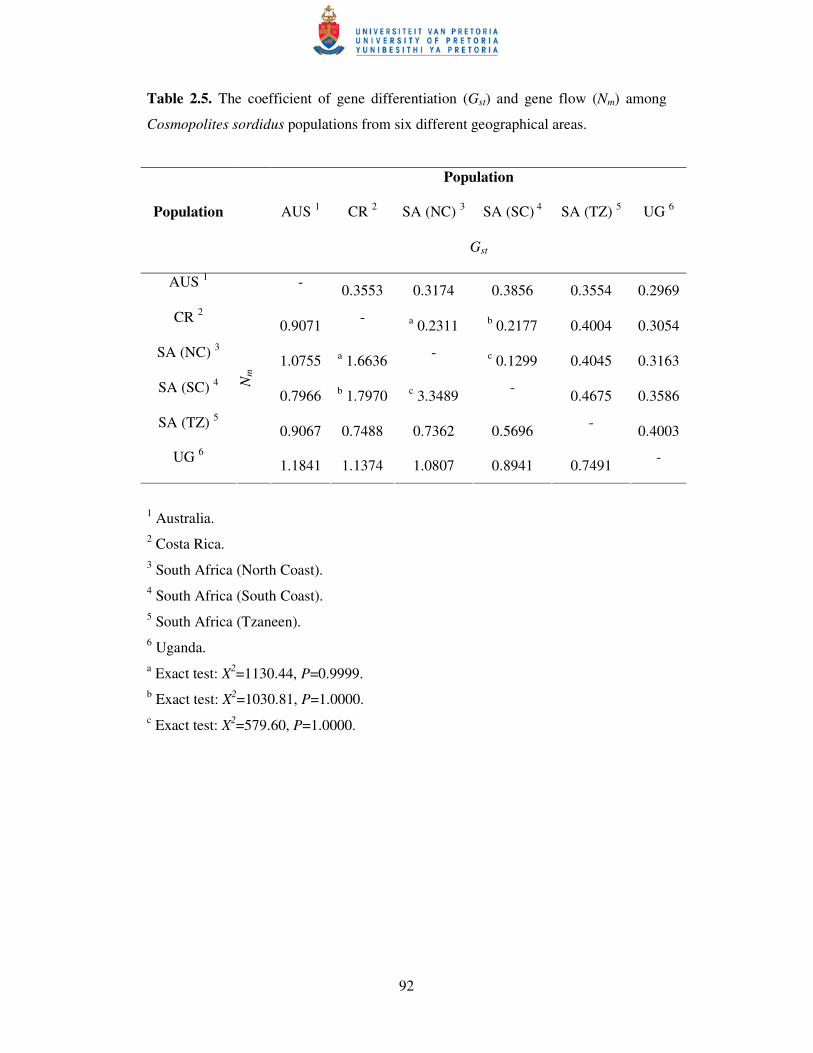
The global Gst value among all populations and among South African
populations was 0.4744 and 0.4316, respectively, while associated gene flow (Nm) for
all the populations and for South African populations was 0.5540 and 0.6586 (data
not shown). The coefficient of gene differentiation and gene flow calculated for pair-
wise population comparisons indicated that, among all the populations, the greatest
differentiation occurred between the South African South Coast and Tzaneen
populations, with about 47% difference between the populations, equating to a mean
of 0.57 migrants per generation (Table 2.5). The populations sharing the most genetic
similarity were the South and North Coast populations from South Africa, with a Gst
and Nm value of 0.13 and 3.35 respectively (Table 2.5). Based on the Monte Carlo
approximation of Fisher’s exact test (through 1000 dememorisation steps, in 10
batches with 2000 permutations per batch), most population pairs were significantly
different (P<0.001) (data not shown). Only the Costa Rican population was not
significantly (P>0.999) differentiated from the two South African coastal populations,
whom also showed no significant (P=1.000) among population differences (Table
2.5).
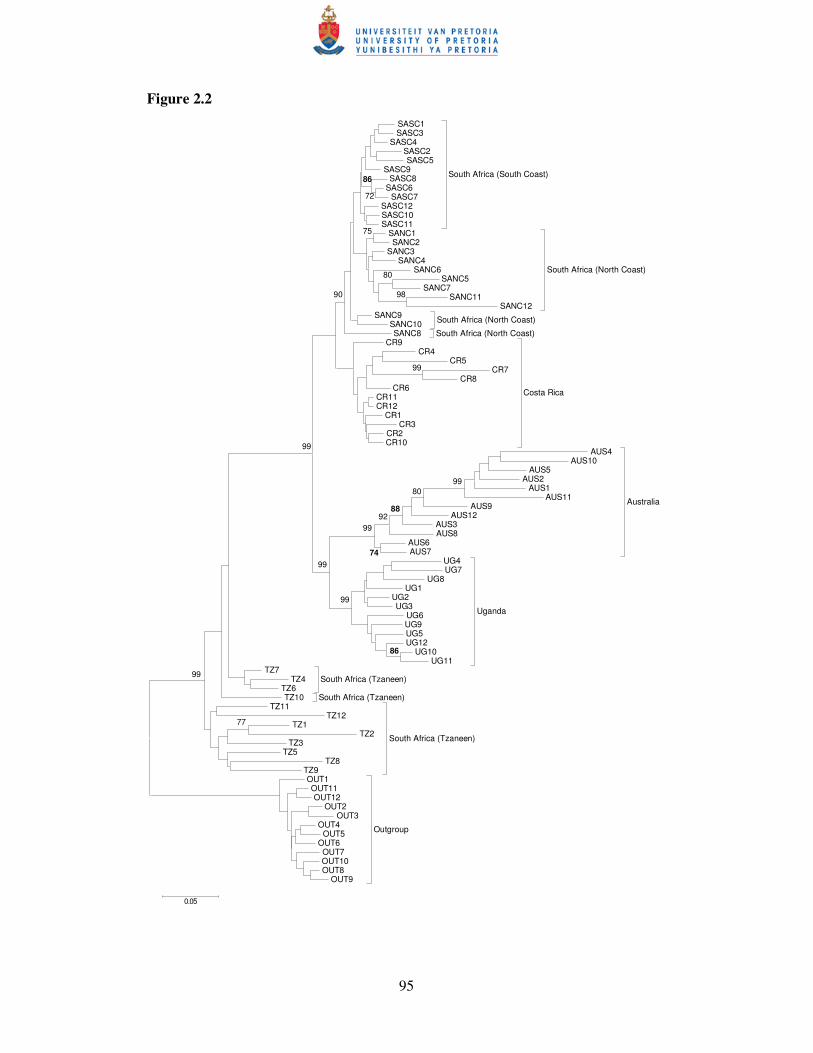
2.3.4 Phylogeny
The neighbour-joining phenogram showed high bootstrap support for the partitioning
of banana weevil populations (Fig. 2.2). The outgroup provided an alternative root.
The Tzaneen population from South Africa was separated (bootstrap value 99%), and
the basal divergent population of the other C. sordidus individuals (Fig. 2.2).
Monophyletic clusters of the South African South and North Coast, Australian and
Ugandan populations were supported by high bootstrap values (�90%) (Fig. 2.2). The
node grouping the South African coastal populations with Costa Rican individuals
was not very robust (bootstrap value 43%) (data not shown). A recent common
ancestor between Australia and Uganda was supported by a 99% bootstrap value (Fig
2.2). The Australian and the Tzaneen populations showed relatively low levels of
similarity between individuals, whilst the highest level of similarity between samples
was found in the South Coast population from South Africa (Fig. 2.2).
74
2.3.5 Isolation by distance
The correlation between Nei’s unbiased genetic distance and geographic distance for
all pair-wise comparisons among the six banana weevil populations, indicated an
overall non-significant pattern of isolation by distance (R=0.053, P=0.849). The Costa
Rican and Tzaneen (South Africa) samples generally showed a negative relation
between genetic and geographic distance (data not shown). Removal of these
populations from the data matrix improved the fit of the isolation pattern, but not
significantly so (R=0.935, P=0.083). Correlation between the simple mismatch
coefficient and geographic distance supported a non significant pattern of isolation by
distance (R=-0.201, P=0.737).
2.4 Discussion Diversity in C. sordidus, collected from four countries in three continents revealed
that, within all populations, the percentage of polymorphic loci ranged from 16-53%,
with an average diversity of 35%. Among the South African populations, within-
population diversity was slightly lower. These results are in contrast to a mean of
92% polymorphic loci (percentage of all loci), ranging from 78-98%, reported for the
species following RAPD analysis of a worldwide population (Ochieng 2001). The
diversity reported within a region (Uganda) ranged from 78-100%, with a mean of
94% polymorphic loci. RAPD analysis of C. sordidus (Ochieng 2001) was based on
46 loci and 15 worldwide populations, while 37 loci and 15 populations were studied
in Uganda. The present study is based on 659 loci (91% polymorphic loci) and the
information content is, therefore, more than 14 times higher. The proportion of
polymorphic loci in the present study is comparable to recent AFLP studies in
termites (8-39%) (Garcia et al. 2002), crickets (28-43%) (Parsons & Shaw 2001) and
three species of dung beetles (44.2-79.7%) (Carisio et al. 2004).
The low within-population diversity of the South Coast population in South
Africa suggests a founder effect, where the current population was introduced as a
small number of genetically related individuals. Alternatively, or in combination with
a founder effect, strong selection pressures (including chemical control) may have
contributed to the lower levels of diversity. In turn, the higher genetic diversity
observed for the Australian and Tzaneen (in South Africa) populations suggests a
75
relatively large establishment population and/or lower selection pressures. The
unique bands observed within these populations suggested intra-populational sub-
structuring, or pooling of populations that differed in genetic composition.
Genetic variation among banana weevil populations was significantly
genealogically and spatially clumped, despite relatively high levels of variation
within populations. Molecular variance analysis indicated that the South African
coastal populations grouped more closely with the Costa Rican population than with
the Tzaneen population. Nevertheless, even for the former grouping, 89% of genetic
variance was still partitioned (almost equally) among and within the populations.
Among all the populations and the South African populations, most variation was
equally divided or between, and not within populations, as reported by Ochieng
(2001).
The coefficient of gene differentiation (Gst) can be interpreted according to
Wright’s (1978) suggestions for Fst (= Gst): The range 0 to 0.05 may be considered as
little, 0.05 to 0.15 as moderate, 0.15 to 0.25 as great and values above 0.25 as very
great genetic differentiation. Similarly, gene flow (Nm) values of less than one can
indicate little or no gene flow (Crow & Aoki 1984). The overall genetic
differentiation of C. sordidus populations, and also the populations from South
Africa was, therefore, very great, with migration between populations very rare. Pair-
wise comparisons indicated a very great differentiation between most populations,
with a great separation between the South African coastal and Costa Rican
populations, and with moderate genetic differences between the North and South
Coast population from South Africa. As expected, results on gene differentiation
were supported by the dependent gene flow parameter. Some degree of gene flow
was suggested between populations of great genetic differentiation i.e. the South
African coastal populations and Costa Rica. According to the Monte Carlo
approximation of Fisher’s exact test, most populations were separate entities, except
for the Costa Rican and South African South and North Coast populations, which
were similar. The significance should be interpreted with caution, as the
approximation for diploid dominant data sets can only be performed on marker
frequencies (Miller 1997) and thus may lead to an overestimate of population
differentiation (Arafeh et al. 2002). The neighbour-joining dendrogram of C.
sordidus showed that the South African coastal, Australian and Ugandan populations
were distinct groupings, while the South African Tzaneen population presented the
76
ancestral state of the banana weevils. Phylogenetically, a recent common ancestor
between the Costa Rican and South African coastal populations was not strongly
supported.
Most of the data suggested that, under similar ecological and agronomical
conditions, the most robust comparisons can be made between local coastal
populations and studies conducted in Costa Rica. All the data suggested that the
South African coastal, Australian, Ugandan, and Tzaneen populations could be
classified as separate taxonomic units. Especially the Tzaneen population had a
relatively unique AFLP fingerprint, but then also showed high within population
diversity. Results were relative to a low number of C. sordidus populations sampled
and even though three continents were included, analysis of additional populations is
required to test the hypothesis. Biotype status of the different C. sordidus populations
should be quantified under controlled studies in relation to host plant susceptibility,
development and behaviour.
Genetic inter-populational differences are assumed to depend on genetic drift
and gene flow (Carisio et al. 2004). Based on a model of population structure among
organisms whose dispersal ability is constrained by distance (Kimura 1953; Kimura
& Weis 1964), a positive correlation between geographical and genetic distances
suggests a basic equilibrium between drift and gene flow, while no correlation
indicates drift prevalence (Hutchison & Templeton 1999; Despres et al. 2002). No
correlation between genetic and geographical distance for C. sordidus was found in
the present study. Genetic drift could, therefore, be most important in shaping present
day genetic diversity patterns of the banana weevil. Nevertheless, the data indicated
that C. sordidus probably does not strictly conform to the model. The relative close
genetic relationship and geographic distance between the North and South Coast
populations in South Africa suggests gene flow or recent separation. The genetic
disparity between the coastal populations and the Tzaneen population, in turn, can
support isolation and genetic drift. However, the underlying genetic data (high
genetic differentiation, high within population diversity and unique bands) of the
Tzaneen population suggested that it could be the result of random dissemination
from a number of populations rather than extreme genetic drift from a common or
local ancestor. The species was first reported in South Africa in the 1920s (Cuille
1950; Simmonds 1966), but the original timing and source of the introductions are
unknown. The current and future population genetics of the species may, therefore,
77
be complicated by the past and future dissemination of infested plant material within
and between areas, of which no reliable records exist.
2.5 Acknowledgements A. Akehurst (NSW Department of Primary Industries), D. Alpizar (C. Rodríguez,
ChemTica Internacional), G. Booysen (Insect Science) and G. Kagezi (C.S. Gold,
IITA) are acknowledged for providing banana weevil samples from Australia, Costa
Rica, South Africa (Tzaneen) and Uganda, respectively. Sitophilus orizae weevils
were kindly provided by T. Saayman (ARC-PPRI). S. Groenewald assisted in
technical aspects and E. Steenkamp provided helpful comments on earlier versions of
the manuscript. The project was financially supported by the Banana Growers
Association of South Africa (BGASA), Technology and Human Resources for
Industry Programme (THRIP), National Research Foundation (NRF) and the
University of Pretoria (UP).
78
2.6 References ANONYMOUS. 1986. Banana Research in East Africa. Proposal for a Regional
Research and Development Network. INIBAP, Montpellier, France.
ANONYMOUS. 2005. WordNet, a lexical database for the English language.
Cognitive science laboratory, Princeton University, NJ. World Wide Web:
http://www.cogsci.princeton.edu/cgi-bin/webwn?stage=1&word=biotype.
ARAFEH, R.M.H., SAPIR, Y., SHMIDA, A., IRAKI, N., FRAGMAN, O. &
COMES, H.P. 2002. Patterns of genetic and phenotypic variation in Iris haynei
and I. atrofusca (Iris sect. Oncocyclus = the royal irises) along an
ecogeographical gradient in Israel and the West Bank. Molecular Ecology 11: 39-
53.
BRAITHWAITE, B.M. 1963. The banana beetle borer. The Agricultural Gazette 7:
396-419.
CARDENOSA, R. 1953. El genero Musa en Columbia. Notas Agronomia 6: 1-368.
CARISIO, L., CERVELLA, P., PALESTRINI, C., DELPERO, M. & ROLANDO,
A. 2004. Biogeographical patterns of genetic differentiation in dung beetles of the
genus Trypocopris (Coleoptera, Geotrupidae) inferred from mtDNA and AFLP
analysis. Journal of Biogeography 31: 1149-1162.
CASTRILLON, C. 1991. Manejo del picudo negro (Cosmopolites sordidus Germar)
en plátano y banano de la zona cafetera de Colombia. In: Memorias IX
ACORBAT. 349-362.
CERVERA, M.T., CABEZAS, J.A., SIMÓN, B., MARTINEZ-ZAPATER, J.M.,
BEITIA, F. & CENIS, J.L. 2000. Genetic relationships among biotypes of
Bemisia tabaci (Hemiptera: Aleyrodidae) based on AFLP analysis. Bulletin of
Entomological Research 90: 391-396.
CROW, J.F. & AOKI, K. 1984. Group selection for polygenic behavioral trait:
Estimating the degree of population subdivision. Proceedings of the National
Academy of Sciences of the United States of America 81: 6073-6077.
CUILLÉ, J. 1950. Recherches sur le Charancon du Bananier. Institut des Fruits
Agrumes Coloniaux; Serie Technique No 4, Paris.
CUILLE, J. & VILARDEBO, A. 1963. Les calandrini nuisibles au bananier. In:
Balachowsky (Ed.) Entomologie Appliquee a l’Agriculture. 1099-1114. Masson et
Cie Ed., Paris.
79
DAVIDE, R.G. 1994. Status of nematode and weevil borer problems affecting banana
in the Philippines. In: Valmayor, R.V., Davide, R.G, Stanton, J.M., Treverrow,
N.L., & Roa, V.N. (Eds.) Proceedings of Banana Nematode/Borer Weevil
Conference in Los Banos, Philippines: INIBAP. 79-88.
DE GRAAF, J., GOVENDER, P., SCHOEMAN, A.S. & VILJOEN, A. 2005.
Efficacy of pseudostem and pheromone seasonal trapping of the banana weevil
Cosmopolites sordidus in South Africa. International Journal of Pest
Management (In Press).
DESPRES, L., LORIOT, S. & GAUDEUL, M. 2002. Geographic pattern of genetic
variation in the European globeflower Trollius europaeus L. (Ranunculaceae)
inferred from amplified fragment length polymorphism markers. Molecular
Ecology 11: 2337-2347.
ELLSWORTH, D.L., RITTENHOUSE, K.D. & HONEYCUTT, R.L. 1993.
Artifactual variation in randomly amplified polymorphic DNA banding-patterns.
Biotechniques 14: 214-217.
EXCOFFIER, L., SMOUSE, P.E. & QUATTRO, J.M. 1992. Analysis of molecular
variance inferred from metric distances among DNA haplotypes: Application to
human mitochondrial DNA restriction sites. Genetics 131: 479-491.
FEAKIN, S.D. 1971. Pest Control in Bananas. 2nd Edition. London, PANS.
FELSENSTEIN, J. 1985. Confidence limits on phylogenies: an approach using the
bootstrap. Evolution 39: 783-791.
FOGAIN, R. & PRICE, N.S. 1994. Varietal screening of some Musa cultivars for
susceptibility to the banana weevil, Cosmopolites sordidus (Coleoptera:
Curculionidae). Fruits 49: 247-251.
FRANZMANN, B.A. 1972. Banana weevil borer in North Queensland. Queensland
Agricultural Journal 98: 319-321.
FROGGATT, J.L. 1926. The Banana Weevil Borer. Bulletin No. 4. Queensland
Department of Agriculture and Stock, Brisbane, Australia.
GALLUN, R.L. & KHUSH, G.S. 1980. Genetic factors effecting expression and
stability of resistance. In: Maxwell, F.G. & Jennings, P.R. (Eds.) Breeding Plants
Resistant to Insects. 64-85. Wiley, New York.
GARCIA, J., MAEKAWA, K., MIURA, T & MATSUMOTO, T. 2002. Population
structure and genetic diversity in insular populations of Nasutitermes
80
takasagoensis (Ispotera: Termitidae) analysed by AFLP markers. Zoological
Science 19: 1141-1146.
GETTMAN, A.D., MITCHELL, W.C., LI, P. & MAU, R.F.L. 1992. A hot water
treatment for control of the banana root borer, Cosmopolites sordidus (Germar)
(Coleoptera: Curculionidae) in banana planting stock. Proceedings of the
Hawaiian Entomological Society 31: 59-63.
GOLD, C.S., PEÑA, J.E. & KARAMURA, E.B. 2003. Biology and integrated pest
management for the banana weevil Cosmopolites sordidus (Germar) (Coleoptera:
Curculionidae). Integrated Pest Management Reviews 6: 79-155.
GOLD, C.S., RUKAZAMBUGA, N.D.T.R., KARAMURA, E.B., NEMEYE, P. &
NIGHT, G. 1999. Recent advances in banana weevil biology, population
dynamics and pest status with emphasis on East Africa. In: Proceedings of a
Workshop on Banana IPM, Nelspruit, South Africa. November 1998: 33-50.
GOWEN, S.R. 1995. Pests. In: Gowen, S.R. (Ed.) Bananas and Plantains. 382-402.
Chapman & Hall, London.
HARRIS, W.V. 1947. The banana borer. East African Agricultural and Forestry
Journal 13: 15-18.
HUFF, D.R., PEAKALL, R. & SMOUSE, P.E. 1993. RAPD variation within and
among natural populations of outcrossing buffalograss Buchloe dactyloides
(Nutt) Engelm. Theoretical and Applied Genetics 86: 927-934.
HUTCHISON, D.W. & TEMPLETON, A.R. 1999. Correlation of pairwise genetic
and geographic distance measures: inferring the relative influences of gene flow
and drift on the distribution of genetic variability. Evolution 53: 1898-1914.
JONES, D.R. 2000. Introduction to banana, abacá and enset. In: Jones, D.R. (Ed.)
Diseases of Banana, Abacá and Enset. 1-36. CAB International, Wallingford.
KERMARREC, A., SIRJUSINGH, C., MAULÉON, H. & SARAH, J.L. 1993.
Biological control of weevils and whitegrubs on bananas in the Caribbean: A
review. In: Gold, C.S. & Gemmil, B. (Eds.) Biological and Integrated Control of
Highland Banana and Plantain Pests and Diseases. Proceedings of a Research
Coordination Meeting in Cotonou, Benin: IITA. 155-170.
KEY GENE PRODUCTS. 2000. AFLP-Quantar Pro 1.0. Wageningen, The
Netherlands.
KIMURA, M. 1953. Stepping-stone model of population. Annual Report of the
National Institute of Genetics 3: 62-63.
81
KIMURA, M. & WEIS, G.H. 1964. The stepping-stone model of population
structure and the decrease of genetic correlation with distance. Genetics 49: 561-
576.
KOPPENHÖFER, A.M. & SCHMUTTERER, H. 1993. Dactylosternum abdominale
(F.) (Coleoptera: Hydrophilidae): A predator of the banana weevil. Biocontrol
Science and Technology 3: 141-147.
KOSMAN, E. & LEONARD, K.J. 2005. Similarity coefficients for molecular
markers in studies of genetic relationships between individuals for haploid,
diploid and polyploid species. Molecular Ecology 14: 415-424.
KUMAR, S., TAMURA, K. & NEI, M. 2004. MEGA3: Integrated software for
molecular evolutionary genetics analysis and sequence alignment. Briefings in
Bioinformatics 5:150-163.
LEWONTIN, R.C. 1972. The apportionment of human diversity. Evolutionary
Biology 6: 381-394.
MANTEL, N. 1967. The detection of disease clustering and a generalized regression
approach. Cancer Research 27: 209-220.
MAOLIN, S. 1994. Status of nematode and weevil borer problems affecting banana
in China. In: Valmayor, R.V., Davide, R.G, Stanton, J.M., Treverrow, N.L., &
Roa, V.N. (Eds.) Proceedings of Banana Nematode/Borer Weevil Conference in
Los Banos, Philippines, INIBAP. 57-62.
MASANZA, M. 2003. Effect of Crop Sanitation on Banana Weevil Cosmopolites
sordidus (Germar) Populations and Associated Damage. Ph.D. Thesis.
Wageningen University, Wageningen, The Netherlands.
MAXWELL, F.G. & JENNINGS, P.R. 1980. Breeding Plants Resistant to Insects.
Wiley & Sons, New York.
MILLER, M.P. 1997. Tools for population genetic analysis (TFPGA) 1.3: A
Windows program for the analysis of allozyme and molecular population genetic
data. Northern Arizona University, U.S.A.
MITCHELL, G. 1980. Banana Entomology in the Windward Islands. Final report
1974-1978. Centre for Overseas Pest Research, London.
MUELLER, U.G. & WOLFENBARGER, L.L. 1999. AFLP genotyping and
fingerprinting. Trends in Ecology and Evolution 14: 389-394.
82
MURALIDHARAN, K. & WAKELAND, E.K. 1993. Concentration of primer and
template qualitatively affects products in random-amplified polymorphic DNA
PCR. Biotechniques 14: 362-364.
NEI, M. 1973. Analysis of gene diversity in subdivided populations. Proceedings of
the National Academy of Science of the United States of America 70: 3321-3323.
NEI, M. 1978. Estimation of average heterozygosity and genetic distance from a
small number of individuals. Genetics 89: 583-590.
OCHIENG, V.O. 2001. Genetic Biodiversity in Banana Weevil Cosmopolites
sordidus Populations in Banana Growing Regions of the World. Ph.D. Thesis,
University of Nairobi, Kenya.
OSTMARK, H.E. 1974. Economic insect pests of bananas. Annual Review of
Entomology 19: 161-176.
PARNISKI, P.F., TREVERROW, N.L., BEDDING, R.A. & SIKORA, R.A. 1990.
Susceptibility of adults of the banana weevil borer Cosmopolites sordidus to 32
species and strains of Heterorhabditis and Neoaplectana. In: Abstracts from the
Second International Nematology Congress. 121-122.
PARSONS, Y.M. & SHAW, K.L. 2001. Species boundaries and genetic diversity
among Hawaiian crickets of the genus Laupala identified using amplified
fragment length polymorphism. Molecular Ecology 10: 1765-1772.
PEAKALL, R., SMOUSE, P.E. & HUFF, D.R. 1995. Evolutionary implications of
allozyme and RAPD variation in diploid populations of dioecious buffalograss
Buchloe dactyloides. Molecular Ecology 4: 135-147.
PEÑA, J.E., DUNCAN, R. & MARTIN, R. 1993. Biological control of Cosmopolites
sordidus in Florida. In Gold, C.S. & Gemmil, B. (Eds.) Biological and Integrated
Control of Highland Banana and Plantain Pests and Diseases. Proceedings of a
Research Coordination Meeting in Cotonou, Benin: IITA. 124-139.
RAVEL, S., MONTENY, N., OLMOS, D.V., VERDUGO, J.E. & CUNY, G. 2001.
A preliminary study of the population genetics of Aedes aegypti (Diptera:
Culicidae) from Mexico using microsatellite and AFLP markers. Acta Tropica
78: 241-250.
RAYMOND, M.L. & ROUSSET, F. 1995. An exact test for population
differentiation. Evolution 49: 1280-1283.
REINEKE, A., KARLOVSKI, P. & ZEBITZ, C.P.W. 1999. Amplified fragment
length polymorphism analysis of different geographical populations of the gypsy
83
moth, Lymantria dispar (Lepidoptera: Lymantriidae). Bulletin of Entomological
Research 89: 79-88.
ROBINSON, J.C. 1996. Bananas and Plantains. CAB International, Wallingford.
RUKAZAMBUGA, N.D.T.M., GOLD, C.S. & GOWEN, S.R. 1998. Yield loss in
East African highland banana (Musa spp., AAA-EA group) caused by the banana
weevil, Cosmopolites sordidus Germar. Crop Protection 17: 581-589.
SAITOU, N. & NEI, M. 1987. The neighbour-joining method: a new method for
reconstructing phylogenetic trees. Molecular Biology and Evolution 4: 406-425.
SAXENA, R.C. & RUEDA, L.M. 1982. Morphological variations among three
biotypes of the brown planthopper, Nilaparvata lugens in the Philippines. Insect
Science and its Application 3: 193-210.
SCHNEIDER, S., ROESSLI, D. & EXCOFFIER, L. 2000. Arlequin ver. 2.000. A
software for population genetics data analysis. Genetics and Biometry
Laboratory, University of Geneva, Switzerland.
SESHU REDDY, K.V. 1993. An overview of the ICIPE’S project on the
development of integrated pest management strategies for the control of the
banana weevil/nematode complex. In Gold, C.S. & Gemmil, B. (Eds.) Biological
and Integrated Control of Highland Banana and Plantain Pests and Diseases.
Proceedings of a Research Coordination Meeting in Cotonou, Benin: IITA. 350-
353.
SESHU REDDY, K.V., GOLD, C.S. & NGODE, L. 1999. Cultural control strategies
for the banana weevil, Cosmopolites sordidus Germar. In: Proceedings of a
Workshop on Banana IPM, Nelspruit, South Africa. November 1998: 51-57.
SIKORA, R.A., BAFOKUZARA, N.D., MBWANA, A.S.S., OLOO, G.W.,
URONU, B. & SESHU-REDDY, K.V. 1989. Interrelationship between banana
weevil, root lesion nematode and agronomic practises and their importance for
banana decline in the United Republic of Tanzania. FAO Plant Protection
Bulletin 37: 151-157.
SIMMONDS, N.W. 1966. Bananas. 2nd Edition. Longmans Press, London.
SLATKIN, M. & BARTON, N.H. 1989. A comparison of three indirect methods for
estimating average levels of gene flow. Evolution 43: 1349-1368.
STARKS, K.J. & BURTON, R.L. 1972. Greenbugs: Determining Biotypes,
Culturing and Screening for Plant Resistance. Technical Bulletin, USDA-ARS.
No 1556, 12pp.
84
STATSOFT INCORPORATED. 2004. Statistica, version 7. Tulsa, U.S.A.
STOVER, R.H. & SIMMONDS, N.W. 1987. Bananas. Third Edition. 469. John
Wiley and Sons, New York.
TRAORE, L., GOLD, C.S., PILON, J.G. & BOIVIN, G. 1993. Effects of
temperature on embryonic development of banana weevil Cosmopolites sordidus
Germar. African Crop Science Journal 1: 111-116.
VITTAYARUK, W., WATTANACHAIYINGCHAROEN, W.,
CHUAYCHAROEN, T. & WATTANACHAIYINGCHAROEN, D. 1994. Status
of weevil borer problems affecting banana in Thailand. In: Valmayor, R.V.,
Davide, R.G, Stanton, J.M., Treverrow, N.L., & Roa, V.N. (Eds.) Proceedings of
Banana Nematode/Borer Weevil Conference in, Los Banos, Philippines: INIBAP.
106-114.
VOS, P., HOGERS, R., BLEEKER, M., REIJANS, M. VAN DER LEE, T.,
HORNES, M., FRIJTERS, A., POT, J., PELEMAN, J., KUIPER, M. &
ZABEAU, M. 1995. AFLP: a new technique for DNA fingerprinting. Nucleic
Acids Research 23: 4407-4414.
WATERHOUSE, D.F. & NORRIS, K.R. 1987. Cosmopolites sordidus (Germar). In:
Waterhouse, D.F. & Norris, K.R. (Eds.) Biological Control: Pacific Prospects.
152-158, 454. Inkata Press, Melbourne.
WRIGHT, S. 1978. Evolution and the Genetics of Populations. Variability Within
and Among Natural Populations. University of Chicago Press, Chicago.
YAN, G., ROMERO-SEVERSON, J., WALTON, M., CHADEE, D.D. &
SEVERSON, D.W. 1999. Population genetics of the yellow fewer mosquito in
Trinidad: comparisons of amplified fragment length polymorphism (AFLP) and
restriction fragment length polymorphism (RFLP) markers. Molecular Ecology 8:
951-963.
YEH, F.C., YANG, R. & BOYLE, T. 1997. Popgene, version 1.31. Microsoft
windows-based freeware for population genetic analysis. Joint Project
Development by University of Alberta and the Centre for International Forestry
Research.
ZABEAU, M. & VOS, P. 1993. Selective restriction fragment amplification: a general
method for DNA fingerprinting. European patent application, publication no. EP
0534858-A1, No. 92402629.7.
85
ZHU-SALZMAN, K., LI, H., KLEIN, P.E., GORENA, R.L. & SALZMAN, R.A.
2003. Using high-throughput amplified fragment length polymorphism to
distinguish sorghum greenbug (Homoptera: Aphididae) biotypes. Agricultural
and Forest Entomology 5: 311-315.
ZIMMERMAN, E.C. 1968a. Cosmopolites pruinosus, a new pest of banana. Journal
of Economic Entomology 61: 870-871.
ZIMMERMAN, E.C. 1968b. Rhynchophorinae of southeastern Polynesia. Pacific
Insects 10: 47-77.
ZIMMERMAN, E.C. 1968c. The Cosmopolites banana weevils (Coleoptera:
Curculionidae: Rhynchophorinae). Pacific Insects 10: 295-299.

86
Table 2.1. The geographical origin and global positioning system (GPS) co-ordinates
of Cosmopolites sordidus populations and Sitophilus orizae (outgroup) sampled in
2004 for genetic analysis.
GPS co-ordinates Species Geographic origin
Latitude Longitude
C. sordidus Australia (New South Wales, Tweed
Shire) 28º22’15’’S 153º29’15’’E
C. sordidus Costa Rica (Limón, Guapiles) 10º36’10’’N 84º17’11’’W
C. sordidus South Africa (KwaZulu-Natal, North
Coast) 29º28’52’’S 31º07’18’’E
C. sordidus South Africa (KwaZulu-Natal, South
Coast) 30º58’14’’S 30º15’33’’E
C. sordidus South Africa (Limpopo Province,
Tzaneen) 23º48’09’’S 30º07’41’’E
C. sordidus Uganda (Busoga Province, Kawanda) 0º25’05’’N 32º31’54’’E
S. orizae South Africa (Gauteng, Pretoria) 25º39’00’’S 28º22’30’’E
87
Table 2.2. The sequences of adapters, primers and primer combinations used for
amplified fragment length polymorphism (AFLP) analysis of different Cosmopolites
sordidus populations.
Description Sequence
EcoRI adapter 5´ CTCGTAGACTGCGTACC�
CTGACGCATGGTTAA 5´�
PstI adapter 5´ TGTACGCAGTCTAC
ACGTACATGCGTCAGATGCTC 5´
PstI primer 5´ GACTGCGTACATGCAG
EcoRI primer 5´ GACTGCGTACCAATTC
Preselective amplification primers PstI (+0) and EcoRI (+0)
Selective amplification primers
(combination 1) PstI (+ACA) and EcoRI (+AT) 1
Selective amplification primers
(combination 2) PstI (+ACC) and EcoRI (+AT) 1
Selective amplification primers
(combination 3) PstI (+AGG) and EcoRI (+AT) 1
Selective amplification primers
(combination 4) PstI (+AGG) and EcoRI (+TC) 1
Selective amplification primers
(combination 5) PstI (+ACC) and EcoRI (+CC) 2
1 IRD-labelled EcoRI primer (800 nm) (LI-COR® Biotechnology Inc., Nebraska,
USA). 2 IRD-labelled EcoRI primer (700 nm) (LI-COR® Biotechnology Inc., Nebraska,
USA).

88
Table 2.3. Intra population genetic diversity of Cosmopolites sordidus expressed as
the percentage of polymorphic loci (%PL), Shannon’s Information Index (I) and Nei’s
gene diversity (h). Standard deviations are in parenthesis.
1 South Africa (North Coast). 2 South African (South Coast). 3 South Africa (Tzaneen).
Genetic diversity parameter Geographical
population Polymorphic
loci %PL I H
Australia 272 45.03 0.200 (0.2666) 0.132 (0.1848)
Costa Rica 190 31.46 0.122 (0.2209) 0.078 (0.1518)
SA (NC) 1 202 33.44 0.134 (0.2307) 0.087 (0.1584)
SA (SC) 2 97 16.06 0.075 (0.1942) 0.050 (0.1342)
SA (TZ) 3 323 53.48 0.169 (0.2117) 0.101 (0.1424)
Uganda 185 30.63 0.142 (0.2476) 0.095 (0.1715)
Mean 211.5 (78.05) 35.02 (12.92) 0.142 (0.0425) 0.091 (0.0270)

89
Table 2.4. Analysis of molecular variance (AMOVA) of Cosmopolites sordidus
populations from six geographical areas. Analysis is indicated for all banana weevil
populations with no hierarchical structure and for groupings of different populations.

90
AMOVA parameter Grouping
Source of variation d.f. Sum of
squares
Variance
components
Percentage
of variation
P-
value
Cosmopolites sordidus
Among populations 5 748.792 11.50238 49.51 <0.001
Within populations 66 774.167 11.72980 50.49
Total 71 1522.958 23.23218 100
SA (SC), SA (NC), CR vs.
AUS, UG, SA (TZ) 1
Among groups 1 225.625 2.63426 10.85 <0.001
Among populations within
groups 4 523.167 9.92182 40.85 <0.001
Within populations 66 774.167 11.72980 48.30
Total 71 1522.958 24.28588 100
SA vs. AUS, CR, UG 2
Among groups 1 171.375 0.75058 3.19 <0.05
Among populations within
groups 4 577.417 11.05203 46.97 <0.001
Within populations 66 774.167 11.72980 49.85
Total 71 1522.958 23.53241 100
South Africa 3
Among populations in S.A. 2 367.333 14.19571 51.60 <0.001
Within populations in S.A. 33 439.500 13.31818 48.41
Total 35 806.833 27.51389 100
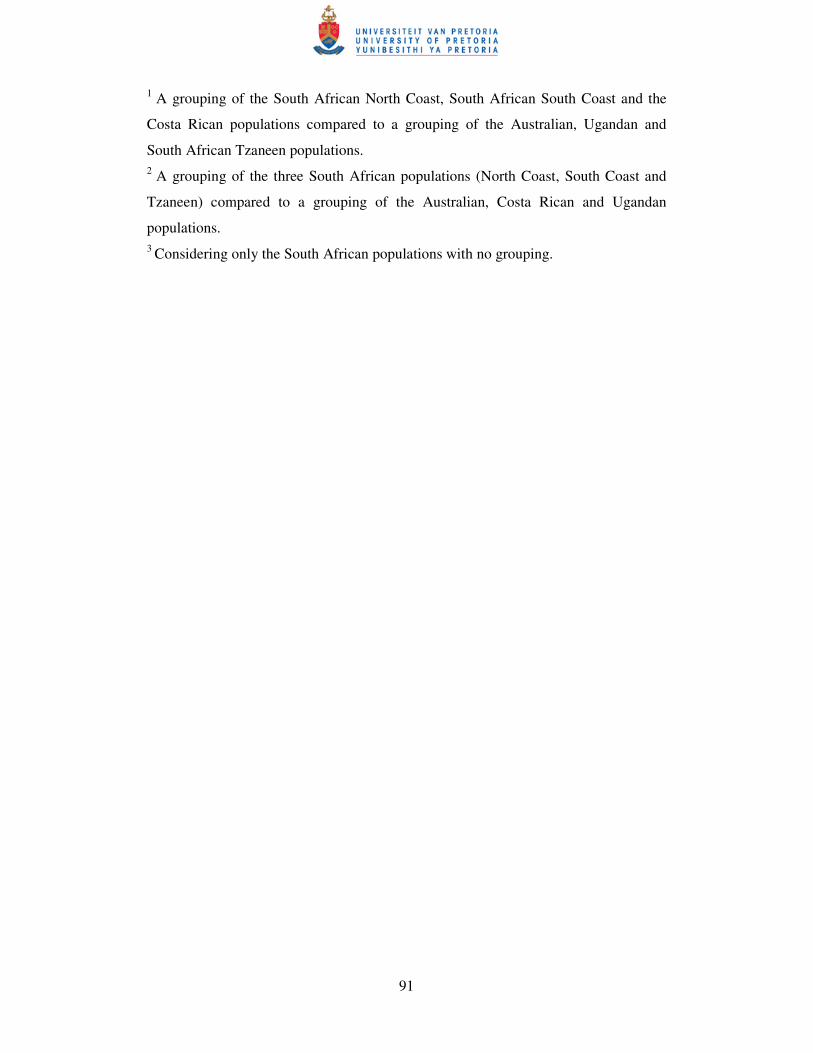
91
1 A grouping of the South African North Coast, South African South Coast and the
Costa Rican populations compared to a grouping of the Australian, Ugandan and
South African Tzaneen populations. 2 A grouping of the three South African populations (North Coast, South Coast and
Tzaneen) compared to a grouping of the Australian, Costa Rican and Ugandan
populations. 3 Considering only the South African populations with no grouping.
92
Table 2.5. The coefficient of gene differentiation (Gst) and gene flow (Nm) among
Cosmopolites sordidus populations from six different geographical areas.
1 Australia. 2 Costa Rica. 3 South Africa (North Coast). 4 South Africa (South Coast). 5 South Africa (Tzaneen). 6 Uganda. a Exact test: X2=1130.44, P=0.9999. b Exact test: X2=1030.81, P=1.0000. c Exact test: X2=579.60, P=1.0000.
Population
AUS 1 CR 2 SA (NC) 3 SA (SC) 4 SA (TZ) 5 UG 6 Population
Gst
AUS 1 - 0.3553 0.3174 0.3856 0.3554 0.2969
CR 2
0.9071 - a 0.2311 b 0.2177 0.4004 0.3054
SA (NC) 3
1.0755 a 1.6636 - c 0.1299 0.4045 0.3163
SA (SC) 4
0.7966 b 1.7970 c 3.3489 - 0.4675 0.3586
SA (TZ) 5
0.9067 0.7488 0.7362 0.5696 - 0.4003
UG 6
Nm
1.1841 1.1374 1.0807 0.8941 0.7491 -

93
Figure legends Figure 2.1. Amplified fragment length polymorphism (AFLP) fingerprint of
selectively amplified DNA fragments from different Cosmopolites sordidus
populations and Sitophilus orizae (outgroup). Molecular weight markers (M) and their
sizes (in bp) are indicated. The inverted gel image of the selective primers PstI
(+ACC) and EcoRI (+AT) is presented for 12 individuals per population (six females
and six males, respectively) between approximately 800 and 50 bp. Arrows mark
selected polymorphisms. Not all polymorphisms are marked. 1 Australia, 2 Costa Rica, 3 South Africa (South Coast), 4 South Africa (North Coast), 5 Outgroup, 6 South
Africa (Tzaneen) and 7 Uganda.
Figure 2.2. Neighbour-joining phylogram of Cosmopolites sordidus individuals from
six populations and the outgroup population (Sitophilus orizae), based on the simple
mismatch coefficient. Bootstrap values (5000 replications) are indicated on the branch
nodes (only >70%) and a scale bar at the bottom of the graph indicates branch lengths.
94
Figure 2.1
M AUS 1 CR 2 SA (SC) 3 SA (NC) 4 OUT 5 SA (TZ) 6 UG 7 M
700
650
600
565
530
500, 495
460
400
364 350
300
255
204, 200
145
100
50
95
Figure 2.2
99
86
72
75
80
98
90
99
99
99
92
88
80
99
86
99
99
77
SASC1 SASC3
SASC4 SASC2 SASC5
SASC9 SASC8
SASC6 SASC7
SASC12 SASC10 SASC11
South Africa (South Coast)
SANC1 SANC2
SANC3 SANC4
SANC6 SANC5
SANC7 SANC11
SANC12
South Africa (North Coast)
SANC9 SANC10 South Africa (North Coast)
South Africa (North Coast) SANC8 CR9
CR4 CR5
CR7 CR8
CR6 CR11 CR12
CR1 CR3
CR2 CR10
Costa Rica
AUS4 AUS10
AUS5 AUS2
AUS1 AUS11
AUS9 AUS12
AUS3 AUS8
AUS6 AUS7
Australia
UG4 UG7
UG8 UG1
UG2 UG3
UG6 UG9 UG5 UG12
UG10 UG11
Uganda
TZ7 TZ4
TZ6South Africa (Tzaneen)
South Africa (Tzaneen) TZ10 TZ11
TZ12 TZ1
TZ2 TZ3
TZ5 TZ8
TZ9
South Africa (Tzaneen)
OUT1 OUT11 OUT12
OUT2 OUT3
OUT4 OUT5
OUT6 OUT7 OUT10 OUT8
OUT9
Outgroup
0.05
74