chapter 2 literature review -...
TRANSCRIPT
11
CHAPTER 2
LITERATURE REVIEW
2.1 REVIEW FOR LINK POWER ESTIMATION OF VARIOUS
PON ARCHITECTURE
A review of the work carried out in link power estimation for
DBA / DWA scheme of various PON architecture systems is given below in
general. Also some of the major literature reviews for the link power
estimation of various PON towards the research are pointed out in every
chapter. ITU-T has created several standards for optical access systems.
Several customers share the optical fiber and OLT; PON can offer economical
services by reducing subscriber (or customer) cost. For these reasons, a PON
system is considered to be eminently suitable for the future optical access
system (Expression of Interest for GPON FTTH Systems 2005).
2.1.1 1.25 Gbps EPON
In LAN to WAN, the Fiber cost, local loop deregulation and high
speed internet demand are the major needs and still require to upgradation of
fiber based IP architecture for full service access networks (FSAN). In late
1980s the asymmetric digital subscriber line (ADSL) had been developed to
access high speed transmissions and continued its operations for triple play
services (Ingrid Van de Voorde and Gert Van der Plas 1997). But it suffered
with limited bandwidth transmissions through metallic cables. Synchronous
optical network (SONET) based ATM PON is a type of low cost EPONs
12
developed in 1990 and its format was accepted in 1995 by ITU-T standard
G.983 to deliver triple play services for FSAN (Nam Jae-Hyun et al 1998).
The transmission was considered with fixed 53 bytes of ATM cell size,
maximum speed supported 622 Mbps both downstream and upstream.
Owing to ATM PONs inadequate bandwidth, more expenses and
complexity in an operation, EPON was developed in 2000 by Ethernet in the
First Mile (EFM) study group (Glen Kramer and Biswanth Mukherjee 2000).
The EFM had concentrated the FTTX applications and offered triple play
services with higher bandwidths and low cost. In 2001, the Broadband PON
(BPON) standard was recognized with recommendations G.983.4 were
additionally operate upstream transmission from 155 Mbps to 622 Mbps for
DBA (IEEE 802.3 Ethernet in First Mile Study Group 2001). At the same
time in 2003, recommendations G.983.1 recognized additionally to BPON
standard to process downstream transmission up to 1.25Gbps (Tsutomu
Tatsuta et al 2003). A survey analyzed and EPON novel method using ring
topology developed in 2004 for the upstream transmission up to 1Gbps for
DBA scheme (Michel McGarry et al 2004, ASM Delowar Hossain et al
2005).
The wavelength ranges used for upstream and downstream
transmission are 1310 nm and 1490 nm respectively. IEEE 802.3 working
group has started to extend the EPON access rate from 1 Gbps to 10 Gbps
recently (Glen Kramer 2006). The power budget and path penalty have been
calculated to 1 Gbps EPON which is 21 dBm and 1.5 dBm for the launched
and received power -2.2 dBm and -23.2 dBm respectively using wavelength
range 1480nm - 1500nm. Similarly the 10Gbps EPON has expected the power
budget and path penalty of 30 dBm and 1 dBm for the minimum transmitted
optical power 4 dBm and received power -26.1 dBm. So, it is ascertained that
the link power budget and path penalty requirements depend on the maximum

13
receiver sensitivity (Frank Chang and Vitesse 2007). Also higher design
complexity have been identified using Ethernet frame burst mode compared
with non-frame burst mode in the EPON downstream link (Wen-Kang Jia
and Yaw-Chung Chen 2008). So, an EPON complete study has been carried
out to access 1 Gbps DBA scheme for the High Definition Television
(HDTV) video demand and other broad band service applications (Hussain
Sattar and Fernando Xavier 2008). Based on the EPON performance for DBA
scheme, the link power estimation is a very essential one while upgrading the
bandwidth capacity.
2.1.2 10 Gbps Gigabit PON (GPON)
BPON transmission capacity has been expanded its transmission
speed in upstream transmission. But the difficulties occurred in upstream
transmission bit rate above 622 Mbps due to the problem of synchronization
as in physical layer of BPON. Alternatively, high speed PON specification for
higher gigabit transmission with variable length packets called Gigabit EPON
or GPON had begun in 2001. The standardization work was divided into three
parts, i.e. G-PON service requirements (GSR), G-PON physical medium
dependent (G-PMD) layer and G-PON transmission convergence layer (GTC)
(Hadjiantonis Sherif et al 2004). A comparative relationship of GPON with
EPON the standardization of the EPON by IEEE 802.3; its transmission speed
supports 1 Gbps in both directions and transmits Ethernet frames without
alteration. Sometimes it is also called as Gigabit Ethernet PON (GEPON). It
was developed by ITU-T G.984 in 2003 and supports 2.5 Gbps in both
directions, but it has not yet reached the deployment stage. In June 2004,
the IEEE ratified EPON as the IEEE802.3ah standard. GPON offers three
Layer 2 networks: ATM for voice, Ethernet for data, and proprietary
encapsulation for voice, whereas EPON employs a single Layer 2 network
that uses IP to carry data, voice, and video. It suggested that there are some

14
distinct differences between EPON and GPON at Layer 2. The EPON channel
link capacity and utilization need more number of segments in their system
than GPON, but its transceiver cost to carry the VoIP is nearly 70 percentange
lesser than the GPON system. So, the major differnences between GPON and
EPON come in utilization of the link capacity, reach, per-subscriber costs, and
management (Sami Lallukka and Pertti Raatikainen 2005).
In the link power budget, the GIANT project in 2005, a burst mode
packet transmisssion using PMD layer approach for upstream optical link has
been experimented for the 1.25 Gbps GPON. The anlysis was carried out
using SMF link distance 20 km, 1x 32 splitter at RN. The bandwidth was
shared for 32 ONUs with P2MP and TDMA technique. The results were
found out for the power leveling mechanism by setting the APD gain 6.
The sensititvity obtained was -31.6 dBm with a dynamic range of 21.9dB,
extinction ratio with and without fiber for the distance 15km were 14 to 17 dB
and 11 to 14 dB and bit- error rate (BER) was 10-10 ( Verhulst et al 2005).
A 10 Gbps GEPON burst mode receiver has carried out in 2007
with system budget 26dB, -0.5dB and 0.6 dB as a power penalty, the optical
budget measured for both downstream and upstream respectively with 20km
SMF link and 1xN star coupler at RN (Junichi Nakagawa 2007).
The minimum and maximum path loss for the loss budget of GPON system
has been calculated for 1490 - 1500nm range with 13dB and 28dB. Also, the
power budget has been calculated for the worst case scenario and obtained
required minimum power penalties were 25.5dB and 2.5dB for 1.25 Gbps
GPON using wavelength 1550nm, 32 ONUs and SMF distance 20km (Ivica
Cale and Aida Salihovic 2007).
In this way, an attempt made for another GPON budget extension
for 2.5 Gpbs GPON using Erbium Doped Fiber Amplifier (EDFA) has been

15
analysed. The various parameters assumed for EDFA are the noise factor less
than 4.5, maximum gain 35- 40dB with the SMF distance 20 km also to reach
for 32 ONUs. The extended optical budget was obtained upto 38.4dB and
36dB as required by minimum and maximum level in budget (Genay et al
2007). The 2.5 Gbps GPON was extended up to 135 km to support 2560
ONUs with 64 split. The every split was considerd by a split of 1x8
followed by 1x8 at RN using 40λ amplified dense WDM system for merto
functions . The network design has been considered to reduce cost and total
split loss by 32 (Davey et al 2006). Similarly for the metro network
applications, a long reach 10Gbps GPON symmetrical network was
developed for 1024 uesrs at a distance of 100 km length using two Nx16 and
one Nx4 splitter in cascade with optical amplifiers to meet out the optical
power budget. The analytical modeling was performed with OptSim
simulation package and aimed to achieve the system performance values for
Q-factor and BER are 16 dB and 10-10. The optimized study has been carried
out for receiver downstram filter bandwidth with respect to various noise
powers in the range of -160 dBm to -110 dBm. Also the Optical Signal-to-
Noise Ratio (OSNR) is increased with the given high input power from OLT
in downstram path (Darren Shea and John Mitchell 2007).
The Ericsson’s suggested that GPON has been possible to extend
the long reach 60 km and increase the splitting ratio using power splitter and
optical amplifiers or new components for NGA networks. Also outlined to
extend the 2.5 Gbps GPON to change into 10Gbps even upto 640 Gbps
with seperate overlay of G.984.5 wavlelength using TDM PON along with
four WDM multiplexres and it is called XGEPON. But the XGPON sytsem
requires higher in cost, power, speed optical transceiver and more complexity
(Elmar Trojer et al 2008).
16
2.1.3 10Gbps Time Division Multiplexing PON (TDM PON)
In 1989, the Multiple Access Customer Network (MACNET) system was introduced by an Australian access network. It had been described that the subscriber loop applications to access 2 Mbps per user end by the Singe Mode Fiber (SMF) distance of 2.1 km using TDM PON. It was shared with the bandwidth in the process 10 log N dB and equally distributed in 12dB signal strength using synchronous multiplexing techniques transmission for 16 end users with 1x16 optical fiber couplers at the RN. The multi-longitudinal mode laser sourced the wavelength range from 1060 to 1400 nm and receiver side the p-i-n-FET received the information. The received optical power and total loss for downstream was -28 dBm and 25 dB for launched optical power -3dBm. Similarly in the upstream side -40 dBm and 29 dB for the launched optical power was -11 dBm. The assumed crosstalk penalty was 0.5 dB at 10dB signal-to-crosstalk ratio and calculated receiver sensitivity was greater than 15.4 dB (Ian McGregor et al 1989). In 1995, Cell-Based TDMA system was a new approach introduced for APONs. It has been suggested that the selection of a phase confirmed by 70% eye closure waveform has enough within the open part of the eye for jitter from the bit and byte synchronization analysis. (Stephen Topliss et al 1995). In the last half decade, tree topology and MAC protocol had been developed in the first generation access networks. Presently TDM-PON supports the line rate up to 1Gbps and maximum link reach of 20 km or more. These capabilities support the high-speed broadband access to care the needs of current residential end-users. The cost maintenance is controlled in TDM PON by sharing a light source among ONUs using power splitters at RN. At the same time, TDM PON still suffers in major issue of synchronization of packet transmission which is a major drawback and with some types of MAC protocol complications. The entire architecture upgradation for TDM PON is required for any change in line rate and frame format of the MAC protocol (Fu-Tai An and Kyeong Soo Kim 2004).

17
In 2006, a tree topology based TDM PON architecture was
proposed with a 1xN Splitter and N 2x2 coupler at RN were used for
decentralized DBA among ONUs. The intention of the proposed decentralized
DBA scheme was to obtain better synchronization among ONUs and satisfy
the issue of MAC layer, i.e. free from collisions of packets during upstream
transmission. The performance was evaluated by decentralized algorithm with
respect to IPACT and static EPONs. The measure was verified for the average
end-to-end delay between OLT and ONU distances of 20 km and 30 km using
OPNETTM. It suggests that a stable approach has been proposed and
supported for cost effective and higher speed operation of TDM PON
(Sungkuen Lee et al 2006). The TDM PON was possible to change its
topology from star to ring with feeder network set up. The changes are used to
propose next generation PON using DFB laser to produce the wavelength of
1490nm as optical source at the OLT (Ki-Man Choi et al 2007). In 2007, a
TDM PON model was proposed to provide next generation guaranteed higher
bandwidth 1.25 Gbps for 32 end user and access bandwidth (40Mbps per end
user) with negligible crosstalk (avoided synchronization mismatching) using
DFB laser source with the wavelength of 1480nm to 1500nm range at OLT
during downstream. The transmission has been carried out for a length of
20km with a splitting ratio of 32. The measured optical signal power for
downstream was in the range of -60dBm to -10dBm and for upstream -80dBm
to -20dBm with reference to obtained optical spectrum (Junichi Nakagawa
2007). Also another novel approach has been proposed using TDM PON
standard overlaid with different WDM channels with single-fiber-ring-tree
topology at a distance 20km for the resilience if the fiber is cut.
In the proposed network architecture TDM/TDMA protocols of
GPON have been extended to deliver 1Gbps to 2.5 Gbps by increasing the RN
in the order of 2N (N=2, 4, 8 and 16). The maximum bandwidth distribution
has been extended upto 2048 users with 32.25Mbps as average bandwidth per
18
user when the splitting ratio (k) arrives 64. In every RN, all the wavelengths
were routed with optical interleaver, and the power budget was optimized
within the range -40dB to -10dB for 16 RNs and used 50/50 power coupler in
RN for resilience purpose. It suggests that the power loss and BER decrease
were mainly due to more RN passes and not affected the receiver sensitivity
by keeping the OSNR range higher than 26 dB and 34 dB for downstream and
upstream respectively (Carlos Bock et al 2007).
2.1.4 10Gbps Wavelength/Dense Wavelength Division Multiplexing
PON (WDM/dense WDM PON)
WDM PON offers better solution for increasing high capacity of
high speed optical networks. The IP based WDM network and its access
network architecture support for IPv4, Ipv6, and interoperability WiMax
based internet access concepts design (Biswanth Mukherjee 2000). Many
passive optical components including Arrayed Waveguide Gratings (AWG)
are consuming power in signal paths during multiplexing / demultiplexing
process of WDM PON (Fu-Tai An and Kyeong Soo Kim 2004). In 2005, the
modulation of Fabry Perot-Laser Diode (FP-LD) was demonstrated
experimentally and studies the usage of low cost WDM device. The proposed
spectrum sliced Broadband Light Source (BLS) and it’s wavelength-locked
by mutual injection technique of FP-LD which performed well to reduce the
Relative Intensity Noise (RIN). The investigation describes the importance of
RIN, symmetric and asymmetric bias requirement for FP-LD lasing condition.
Also low RIN was obtained by setting asymmetric bias condition
while transmitting 3 channels which carried out the transmission individually
from 155Mbps Pseudo Random Bit Sequence (PRBS) data to 20km distance
through fiber. The received signal power was obtained in the range of -39
dBm to -42 dBm almost for all three channels (Ki-Man Choi et al 2005). Also
19
in 2005, the same group researchers demonstrated another experiment for 12
channels of denseWDM PON with 50GHz channel spacing (0.4nm) based on
wavelength-locked FP-LD. In the experiment again it was chosen and
transmitted 155Mbps both downstream and upstream bidirectionally over
20 km through SMF. Also two cyclic AWG have been chosen and placed in
both OLT and RN. In the proposed method it was possible to accommodate
80 channels with C-band range 1548.1 to 1553.3nm for upstream and L-band
range 1581.1 to 1585.8nm for downstream transmission using EDFA.
The investigation reported that there was no dispersion penalty while
checking the crosstalk among 12 channels in the dense WDM PON
transmission. But the power penalty upto 4dB and detuning has been required
while decreasing the mode spacing 0.6 to 0.4 nm. Also, detuning was
accepted for the range increase for 0.08 to 0.26nm when using the FP-LD
reflectivity was 1%. The analysis was made for transmission length up to 30
km including 10 km distribution fiber distance. The measured receiver
sensitivity and output optical signal power range -37.5 to -36 dBm was
achieved BER 10-10(Sang-Mook Lee et al 2005).
In 2006, bidirectional Long reach PON has been demonstrated for
10Gbps both downstream and upstream transmission using wavelength
1550.4nm and 1548.0nm respectively for a distance of 120 km through Non-
Zero Dispersion Fiber (NZDF), dense WDM channels spacing and Raman
Amplifier. An optical Band Pass Filter (BPF) was used to remove the
Amplified Spontaneous Emission (ASE) in the receiver side. The link power
budget has been calculated for the splitting ratio 1/8. Various losses were
assumed as 6dB, 9dB, 1.5dB and 4dB for dense WDM channels, split loss,
splice loss and transmission loss for the distance 10 to 20 km respectively.
The obtained result 40dB OSNR was shown as an excess value and limited
the transmission penalties in 0.8dB (Rasmus Kjaer et al 2006). Also in 2006,
BSIK Freeband Broadband Photonic Project (BSIK-FBPP) has modeled a
20
flexible design for dense WDM PON with cost effective control and
management scheme. The cost effective investigation is considered by
configurable control plane and protection management of better performance
in the node components design flexibility. In this scheme a node component
passive splitter has replaced and introduced Lambda-Router which equally
performs like Reconfigurable Optical Add-Drop Multiplexer (ROADM) in
dense WDM PON networks. It is suggested that the BSIK-FBPP design of a
dense WDM PON provides better protection for the optical plane and cost
effective scheme control the components design in hardware and software
(Rajeev Roy et al 2006).
In 2007, the long reach 64 channel dense WDM PON was
demonstrated and equally considered 64 channels for downstream (L-band)
and upstream transmission(C-band) using 50GHz channel spacing with FP-
LD. It has been proposed to have an access to a maximum of 155Mbps PRBS
sequence with a length of 231-1 up to 70km reach through SMF, guaranteed
100Mbps per channel in metro network for the satellite and HDTV
applications.
The obtained link budget is nearly 32dB and the link loss occurred for two
AWG is 10dB, and insertion loss due to other device is 3dB. Finally 13dB is
considered as total loss without fiber between transmitter and receiver.
The link loss has occurred due to backscattered BLS. It is suggested that the
possibility of colour free operation using Reflective Semiconductor Optical
Amplifier (RSOA) in place of FP-LD was to minimize the utilization of high
current and device cost (Sang-Mook Lee et al 2007).
An investigation was made for colour free optical source in
WDM PON. The effect of back reflection penalty has been reduced by
increasing the line width of the seed light. In this experiment, the Distributed
Feedback Laser Diode (DFB-LD) coherent light source was used as a seed
21
light at OLT. FP-LD was used as a modulator at ONU and optical coupler at
RN with EDFA. The Rayleigh backscattering was also considered in this back
reflection analysis. The obtained result for 1.25Gbps transmission describes
the Quality factor (Q-factor) which is lesser for narrow line width 19.1dB
than the widest line width 21.1dB.
The investigated results describe the higher back reflections which
depend on reflectivity of RSOA. The link budget has been calculated for
effects of seed light line width with maximum fiber loss 12.5dB and obtained
guaranteed Q-factor of 16.9dB. Also the fiber dispersion limits the seed light
line width while changing the channel spacing from 100 GHz to 200GHz.
Finally, the optimized line width for optical signal or seed light was obtained
in the range of 7 to 30 GHz (Jung-Hyung Moon et al 2007).
In 2008, the high Data-Rate WDM PON (DRWDM-PON) using
Direct Modulated Lasers (DML), Fabry-Perot Etalon (FPE) with FSR of
100GHz per channel (0.8nm) and RSOA has developed a scheme with
10Gbps and 1.25 Gbps for downstream and upstream transmission
respectively. AWG has been used for demultiplexing the downstream
channels and the total link distance is considered at 25 km .The eye opened
and received power arrived in the range of -21 to -15 dBm and -26 to -22dBm
for downstream and upstream respectively (Shu-Chuan Lin et al 2008).
In 2008, with the support of IT research and development program
of MIC/IITA, Republic of Korea, for the growth of Korean
Telecommunication (KT) standard, a group of researchers demonstrated the
cost effective transmission to upgrade 10Gbps to 40Gbps using dense WDM
PON infrastructure and optimized the 10Gbps line rate over SMF by the
obtained Q-factor value. The transmission link has been considered with 40
channels. In these 40 channels, 20 channels were linked for 10 Gbps line rate
22
using Non-Return-to-Zero (NRZ) format and another 20 channels were linked
for 42.8 Gbps line rate using Carrier-Suppressed Return-to-Zero (CS-RZ)
format.
All multiplexed signals were transported through Standard SMF
(SSMF) distance of 511 km in the KT network with the support of eight span
of link located in every 80km. The obtained results were for dispersion and
power in the range of -400 to 1000 ps/km and 5dB to reach the distance of
640 km using 1500nm wavelength range. The Q-factor obtained for 10Gbps
transmission is 17 to 19dB with forward error correction (FEC) limit for BER
10-11 and a margin of 5.4dB and for 42.8Gbps transmission is 14 to 16dB with
super-FEC limit for BER 10-15 and a margin of 5.2dB (Sang Soo Lee et al
2008).
TDM PON is not possible for the future 10 Gbps transmission since
it is limited with two major factors by the power budget analysis. One is
occurrence of severe insertion loss or splitting loss using 1x N splitter ratio
and the second is long reach or link length distance between OLT and ONU
with power budget. The above limitations were overcome by WDM PON and
every channel is assigned individually to every ONU support to offer 10Gbps
in near future. WDM PON also has more scalability and possible to make
splitting ratio even up to 1x1000 and above. The long reach is more than
1000 km to route the multiplexed signal. Hence, it is referred and made
suitable for DWA scheme (Klaus Grobe and Jorg-Peter Elbers 2008). MAC
protocol issue is not a major issue in WDM PON since it supports packet
transmission for both synchronous and asynchronous transmission. Similarly
both line rates and frame rates are independent during the packet transmission
(Fu-Tai An and Kyeong Soo Kim 2004, David Gutierrez et al 2005).
23
2.1.5 10 Gbps dense WDM/TDM PON or Hybrid PON (HPON)
Finally in this section the literature concerned with HPON
performance with the arrival of certain novel ideas which were compared with
TDM PON and WDM PON as given in the previous sections have been
proposed and demonstrated. In 1998, the WDM/TDM PON has been operated
with four fixed DFB lasers sourced the Continuous Wave (CW) 1550nm
range wavelength for WDM PON and one Acousto-Optical Tunable Filter
(AOTF) for TDM PON optical sources with EDFA. In the experiment, better
line rate 51.84 Mbps was transported and obtained receiver sensitivities BER
10-9 and -30.0, -29.5, -30.6 and -31.0dBm for all four WDM PON channels,
whereas the BER from the receiver sensitivity for TDM PON was 10-11. The
estimated value of power penalty for AOTF was 0.17dB (Chang-Joon Chae
and Nam-Hyun Oh 1998).
In 2001, dense WDM/TDM multiplexing techniques have been
considered for interferometric fiber optic sensor applications using Optical
ADM (OADM) and found out the crosstalk level range between -47dB and
-76dB. The power budget has been determined by receiving a peak pulse
power -25.8dBm which arrived from the single reflector in the array
(Geoffrey Cranch and Philip Nash 2001). In 2002, an investigation was made
to analyze the amplitude noise and timing jitter of pulse for slicing coherent
Supercontinuum (SC) spectrum. The investigation has been made for data
regeneration or data recovery in the TDM/ WDM system and its applications.
The SC has been optimized the amplitude and jitter level for data regeneration
by obtaining Q-factor values with normalized fiber length (Taccheo and
Ennser 2002).

24
In 2004, the Stanford University aCCESS (SUCCESS) or hybrid
WDM/TDM PON architecture with ring-star topology was proposed with
Photonic Networking Research Lab (PNRL) researchers. The focus of the
SUCCESS PON was to upgrade the DWA / DBA and the migration of TDM
PON to dense WDM PON with advanced WDM techniques for the FTTH
applications. The above new novel approach was attempted during 2004 by
the PNRL researchers for the PON network and called it as Hybrid WDM /
TDM-PON, or SUCCESS-HPON. This architecture is meant for the smooth
migration from TDM PON to dense WDM PON. Again the PNRL research
team has analyzed various scheduling algorithms including batch scheduling
algorithms using OMNET++ testbed and measured the end-to- end delay,
throughput and average packet delay for both downstream and upstream
transmission for 10Gbps line rate (Varga 2003, Fu-Tai An et al 2004).
In 2005 many group of researchers including PNRL group
proposed many demonstrations for hybrid WDM/TDM PON for the line rate
2.5Gbps to 10Gbps with SMF distance 30km and above. This section outlines
three major proposals which were given by three different group researchers
in the year 2005. One group of researchers analyzed the unicast and multicast
data using free spectral range (FSR) periodicity of two cascaded AWG in
hybrid WDM/TDM PON for the line rate 2.5Gbps. It was suggested that the
topology was having the features of security, suitability of tunable laser and
fixed laser for unicast and multicast respectively (Carlos Bock and Josep Prat
2005).
The second group of researchers identified and proposed a novelty
of SUCCESS PON, to operate the DWA scheme. Also it has been suggested
as a powerful architecture for NGA optical network in terms of cost,
scalability and performance (Yu-Li Hsueh et al 2005). Finally, another novel
architecture has been presented in 2005, a centralized light source and DBA
25
scheme using AWG FSR for WDM/ TDM PON. It focused the importance of
space division multiplexing (SDM) support for hybrid WDM/TDM, tunable
laser source and photo detector in receiver for DBA scheme and finally
transmission made with 2.5 Gbps for the SMF distance of 30km using the
wavelength range 1500nm (Carlos Bock, Josep Prat and Stuart Walker 2005).
In 2006, an experiment dealing with numerical approach was made
for 10Gbps hybrid dense WDM-TDM PON to the maximum long reach of
115 km for 1088 users (17 PON x 64 split) and an accessed mean data rate of
155Mbps has been analyzed. The investigated result was almost satisfied by
obtained OSNR range -20 to 30dB with respect to Rayleigh Back Scattering
(RBS) for hybrid dense WDM/TDM PON (MacHale et al 2006).
In 2007, the proposed lower cost maintenance self protection
scheme describes the usage of optical components AWG, WDM coupler and
optical splitter at OLT, RN and ONUs of hybrid WDM /TDM PON.
The study has been made for 16 ONUs and found out the power budget 23 dB
for downstream and 11.2 dB for upstream respectively (Jiajia Chan and
Lena Wosinka 2007). Also in 2007, a few among the WDM/ TDM research
groups analyzed the QoS for reservation based DBA scheme by properly
designing the size of ONUs time slot, GATE message transmission time and
dynamic control of ONUs service weight for fairness. Another group
proposed an innovative concept on Optical Burst Switching (OBS) for
metro-network application using hybrid WDM/TDM PON and pointed out
the usage of Reflective ONU (R-ONU), tunable laser at OLT and AWG at
the outside plant which was a good choice for upstream transmission to
reduce the cost. (Seung Jin Lee et al 2007).
In addition, a scheme has been proposed in 2007 for
HDTV/Gigabit/ CATV applications with bidirectional hybrid dense WDM
26
PON. In this architecture four Vertical-Cavity Surface Emitting Lasers
(VCSEL) and DFB laser were operated with 1550nm wavelength range to
carry the bit rate 1.25Gbps in bidirectional for the SMF distance 40km with
Ethernet link, and finally supported 129 and 77 channels for HDTV and
CATV respectively. The obtained results have proven the better BER 10-9
received optical power within the range -28 to -26.2dBm and controlled the
power penalty improvements without using the AWG component in the
hybrid dense WDM / TDM PON system (Hai-Han Lu et al 2007).
In 2008, the literature viewed the importance of RSOA which has
taken a device and considered it for following two major applications of
hybrid WDM/TDM PON.
1. The RSOA has taken care of remotely pumped EDFA for
1.25Gbps upstream transmission controlled 32-WDM
channels and 16-TDM splits at SMF distance of 25 km and
distributed maximum of 512 ONUs. The results obtained
without and with RSOA were better and occurred value for
BER is 10-9 and sufficient gain 15dB for upstream signal
with CW seed light power in the range of 0 to -14dBm
(Jung Mi Oh et al 2008).
2. The RSOA was used in burst mode operation for hybrid
WDM / TDMA PON and is proposed as a low cost PON. The
demonstration describes the achievement to transport
1.25Gbps with SMF distance 50km and is distributed the
bandwidth to 1024 users. The obtained result gives the RSOA
differential power gain changed to a maximum of 2dB and
supports 20 to 22dB as maximum power budget. Also
27
comparative performance was made with GPON class B+ type
power budget between 13 to 28dB (Belfqih et al 2008).
Extended hybrid PON architecture which has been proposed in
2008, shared the wavelength similar to GPON using colourless ONT.
It supports 128 users with four 1x32 PONs over a SMF distance of 60km and
shared 40Gbps in downstream transmission using Course WDM (CWDM)
and Medium-Dense WDM (MDWDM) filters. The obtained results were
compared with GPON module over the distance transmission of 80km and
given better result improvement in BER 10-15 and received signal power in the
range of -29 to -28dBm (Martin Bouda et al 2008).
In the following section an analytical traffic model for PON access
system has been proposed innovatively from the literature review to identify
the limitations of MAC layer issues of PON access system. The traffic model
analyzes the MAC and network layer performance and measures the waiting
time in queue, time-slot assignment accuracy, tuning latency and utilization at
the peak traffic or burst mode transmission. This traffic model investigation
supports the fiber based 10 Gbps and above high bit rate packet or frame
transmission of PON access system. Similarly, the physical layer performance
of PON and its various parameters of Optical Signal Power (OSP), Optical
Noise Power (ONP), OSNR, gain and fiber distance are also measured in the
following main chapters.
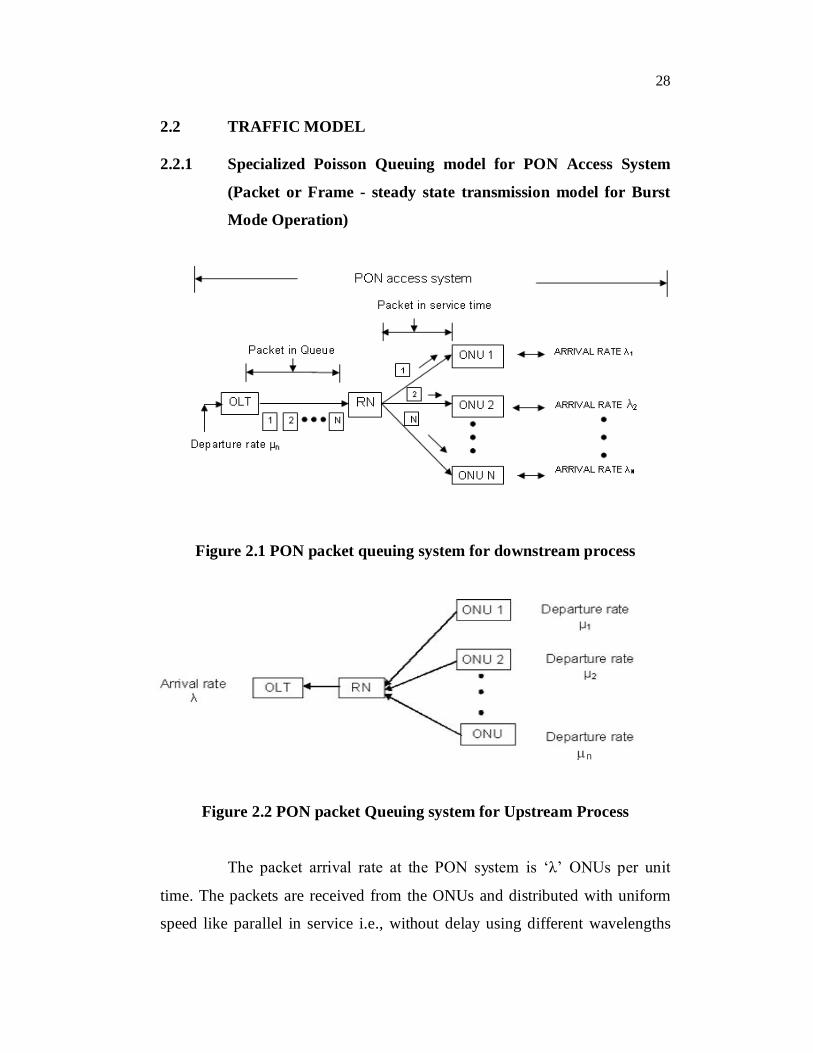
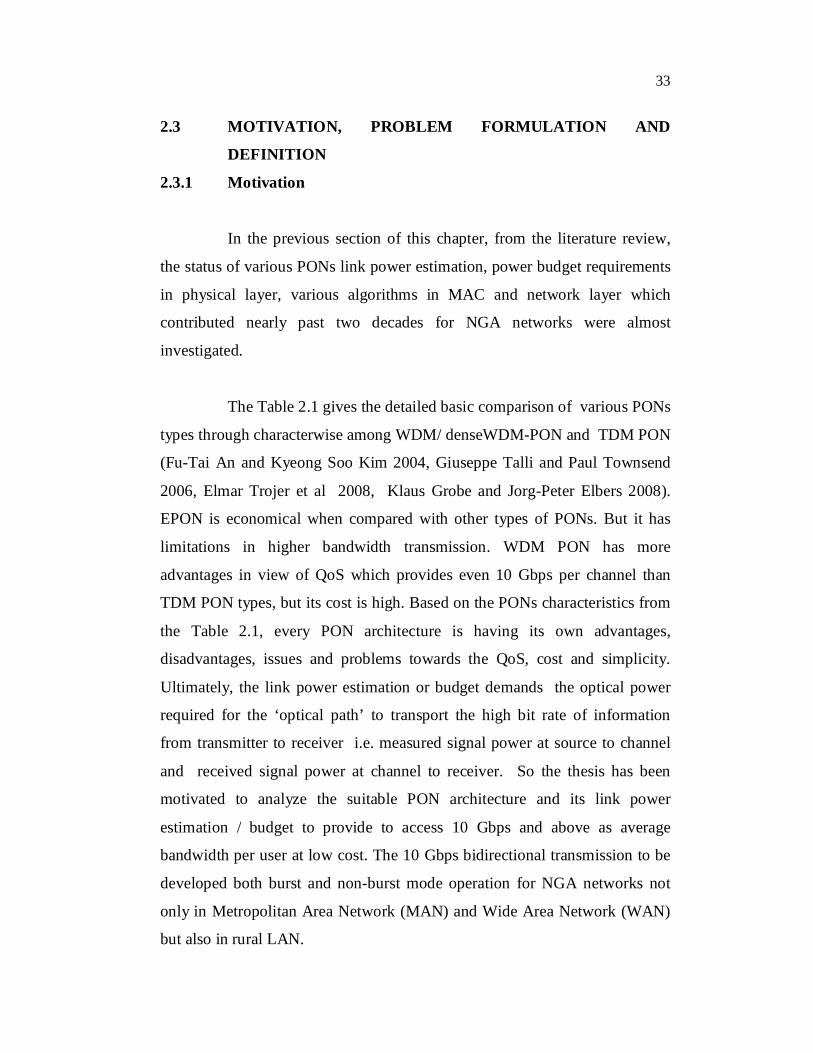
The Figures 2.1 and 2.2 explain the specialized Poisson queuing
situations and its model with uniform packet distribution in service among all
the ONUs and OLT for both the downstream and upstream processes.
28
2.2 TRAFFIC MODEL
2.2.1 Specialized Poisson Queuing model for PON Access System
(Packet or Frame - steady state transmission model for Burst
Mode Operation)
Figure 2.1 PON packet queuing system for downstream process
Figure 2.2 PON packet Queuing system for Upstream Process
The packet arrival rate at the PON system is ‘λ’ ONUs per unit
time. The packets are received from the ONUs and distributed with uniform
speed like parallel in service i.e., without delay using different wavelengths
n

29
called the WDM-PON and with different delays using different time slots
called the TDM-PON. If all the parallel services are identical, then the service
rate for any service is ‘µ’ ONUs per unit time. Ultimately the numbers of
ONUs accessing the information in the PON system is defined by those
ONUs which are in service and those ONUs which are in queue. The traffic
model of PON access system using specialized Poisson queues have been
explained in Figures 2.1, 2.2 and 2.3 and following expressions (2.1) - (2.10)
are used for the PON queuing system in traffic model (Hamedy Taha 2002)
The characteristics of queuing situation as per the following format
(Ap / Dp / ONUpp): (Qd /e /f ) (2.1)
where,
Ap - Packets arrival distribution
Dp - packet departure (transmission time) distribution
ONUpp - number of parallel packet transmission from RN to
ONUn.(n =1, 2, 3... ∞)
Qd - Queue discipline
Mp - maximum number (finite or infinite) allowed in the
system (in queue plus and in transmission)
SOLT - size of the OLT (finite or Infinite)
The Packet queue discipline can be formed by Markovian
modulated Poisson process as for WDM-PON Model is
(M/D/m): (GD/m/∞)
(M/D/64):(GD/64/∞) (2.2)

30
The Packet queue discipline can be formed by Markovian
modulated Poisson process as for TDM-PON Model is
(M/DD/m): (GD/m/∞)
(M/DD/1024):(GD/1024/∞) (2.3)
where,
M - Markovian (or) Poisson arrivals or departures
distribution (or equivalently exponential inter-arrival or
transmission time distribution)
m - Number of customers (64 in WDM PON and 1024 in
TDM PON) on the entire system
D - Constant (deterministic) time
DD - different/constant time slot
GD - General discipline of packet queue (any queue model like
FIFO, LILO, LIFO etc.,)
Steady-state measurement of performance
The most common measure used in PON system as per queuing
model in a queuing situation could be represented by information arrival rate
λ relationship, which is shown in Figure 2.3 as a concept diagram.
Figure 2.3 Relation between λ, λlost and λeff

31
Rs - Expected number of ONUs in PON system.
Rq - Expected number of ONUs in packet queue
Ws - Expected packet waiting time in PON system.
Wq - Expected packet waiting time in queue.
ppONU - Expected number of ONUs in the busy (or) burst mode
operation
It should be remembered that, any PON system includes both
packet queue and packet in transmission time facility. Therefore, the steady
state probabilities (Pn) of ‘n’ ONUs in the PON system can be used to
determine the Rq and Rs values by using the relations,
R nPs nn 1
(2.4)
pp 1
q pp nn ONU
R n ONU P
(2.5)
The relation between the Rs and Ws and also between Wq and Rq is
known as Little’s formula and can be given by the simple relations
s eff sR W (2.6 a)
q eff qR W (2.6 b)
The above relations 2.6(a) and 2.6(b) are valid under general
conditions. Parameter λeff is the effective packet arrival rate of the system.
In this way, the direct relation between the Wq and Ws can be determined
using the relation

32
Expected packet waiting time in system = Expected waiting time of
packet in queue + expected packet service time i.e.,
1
W Ws q
(2.7)
From the above relation it is possible to relate the Rs and Rq by
simple multiplication of λeff on both sides, obtain
s qeffR R
(2.8)
By definition the difference between the average numbers of ONUs
(Rs) and the average number of packet queues (Rq) must equal the average
number of busy or Bursty mode
pp s qeffONU R R
(2.9)
It follows the facility utilization which could be given as,
pp
pp
ONUUtilization Bursty mod e / Non Bursty mode performance
ONU
(2.10)
A PON traffic analysis is given with an example in the
Appendix 1.
33
2.3 MOTIVATION, PROBLEM FORMULATION AND
DEFINITION
2.3.1 Motivation
In the previous section of this chapter, from the literature review,
the status of various PONs link power estimation, power budget requirements
in physical layer, various algorithms in MAC and network layer which
contributed nearly past two decades for NGA networks were almost
investigated.
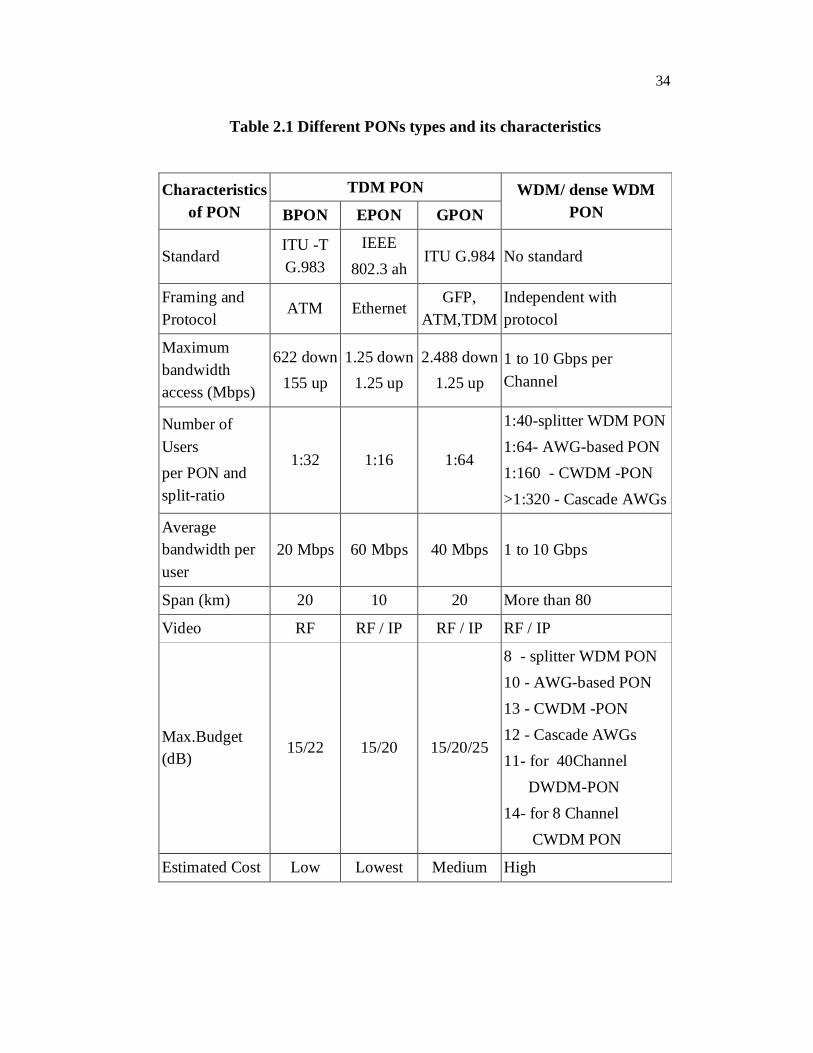
The Table 2.1 gives the detailed basic comparison of various PONs
types through characterwise among WDM/ denseWDM-PON and TDM PON
(Fu-Tai An and Kyeong Soo Kim 2004, Giuseppe Talli and Paul Townsend
2006, Elmar Trojer et al 2008, Klaus Grobe and Jorg-Peter Elbers 2008).
EPON is economical when compared with other types of PONs. But it has
limitations in higher bandwidth transmission. WDM PON has more
advantages in view of QoS which provides even 10 Gbps per channel than
TDM PON types, but its cost is high. Based on the PONs characteristics from
the Table 2.1, every PON architecture is having its own advantages,
disadvantages, issues and problems towards the QoS, cost and simplicity.
Ultimately, the link power estimation or budget demands the optical power
required for the ‘optical path’ to transport the high bit rate of information
from transmitter to receiver i.e. measured signal power at source to channel
and received signal power at channel to receiver. So the thesis has been
motivated to analyze the suitable PON architecture and its link power
estimation / budget to provide to access 10 Gbps and above as average
bandwidth per user at low cost. The 10 Gbps bidirectional transmission to be
developed both burst and non-burst mode operation for NGA networks not
only in Metropolitan Area Network (MAN) and Wide Area Network (WAN)
but also in rural LAN.
34
Table 2.1 Different PONs types and its characteristics
Characteristics of PON
TDM PON WDM/ dense WDM PON BPON EPON GPON
Standard ITU -T G.983
IEEE 802.3 ah
ITU G.984 No standard
Framing and Protocol
ATM Ethernet GFP,
ATM,TDM Independent with protocol
Maximum bandwidth access (Mbps)
622 down 155 up
1.25 down 1.25 up
2.488 down 1.25 up
1 to 10 Gbps per Channel
Number of Users per PON and split-ratio
1:32 1:16 1:64
1:40-splitter WDM PON 1:64- AWG-based PON 1:160 - CWDM -PON >1:320 - Cascade AWGs
Average bandwidth per user
20 Mbps 60 Mbps 40 Mbps 1 to 10 Gbps
Span (km) 20 10 20 More than 80
Video RF RF / IP RF / IP RF / IP
Max.Budget (dB)
15/22 15/20 15/20/25
8 - splitter WDM PON 10 - AWG-based PON 13 - CWDM -PON 12 - Cascade AWGs 11- for 40Channel DWDM-PON 14- for 8 Channel CWDM PON
Estimated Cost Low Lowest Medium High
35
2.3.2 Problem formulation and definition
All the above specification details, literature review and PON
traffic mathematical model have been investigated in the previous sections to
access 10Gbps in future with standard PON architecture. Even though many
proposed methods and analysis were carried out with optical amplifiers,
generally the link power estimation of any PON system architecture design
performance in traffic is to be satisfied for receiver sensitivity and system
degradation (Cooper et al 1992, Govind Agarawal 1997, David Cunningham
and Piers Dawe 2002, Lisa Peng and Robert Carlisle 2002, Lee Sorin and
Byong Yoon Kim 2006). It is an issue and compensating the Power Penalty
Requirements (PPR) or link power budget, as well as better receiver
sensitivity or ONU performance during downstream and upstream high bit
rate transmission. In this way a problem is formulated for link power
estimation to any PON architecture which can meet out and full fill its power
penalty during DBA / DWA. Based on above needs, it is essential to select
optimal optical pulse for assigning more number of channels with less
channel spacing which needs to be suited for high bandwidth transmission
through fiber by operating with best tunable source, RN and receiver
components. Every pulse is responsible to carry a maximum bandwidth and it
is to be allocated properly to access every user node from OLT to ONUs with
negligible fiber pulse dispersion, non-linear effects and optical power
distribution complexity bidirectionally from the RN (Marcuse and Lin 1981,
Dilwali and Soundra Pandian 1992, Zhou et al 2000, Cheng-Chung Chien and
Ilya Lyubomirsky 2007). In order to get loss free optical power or negligible
optical pulse power penalty from OLT to ONUs, optical pulses are controlled
with 3R techniques which are Re amplification, Re timing and Re shaping.
The PPR and power budget improvements are necessary for LAN
to any type of long haul PON access system. The PON system itself is very
36
less to view as an ideal or optical pulse power loss free system both in non
burst and burst mode transmission (Frank Effenberger et al 2007). So, in this
research work, it is interested to investigate the importance of downstream
link power budget for types of TDM and WDM PON, since downstream
bandwidth (downloading) required ratio has more demand in end user side
than upstream bandwidth (uploading) for IP, HDTV and satellite link based
applications in practice. Also the PPR for various PONs have been analyzed
and compared in the following chapter of this research work. The above
discussion motivated to define the problem as follows (Frank Efffenberger
et al 2001, Samee Ullah Khan 2003).
The novel link power budget estimation problem in PON is defined
as the occurrence due to the RN power splitting loss complexity, routing the
wavelength in undirected optical path, not receiving optimal optical and
electrical pulse power to every ONU unknown location, while transmitting
high bit rate from OLT through unoptimized fiber medium link length and
hence the need for power penalty
2.4 RESEARCH METHODOLOGY
2.4.1 Optimization techniques for Power Penalty Requirements
(PPR)
Based on the problem formulation and definition, estimating the
PPR for various PONs, the research method of analyzing the PPR uses two
optimization techniques which are as follows (Optisystem 2006)
(a) Single-Parameter-Single-Result Optimization (SPO) technique
which is to measure the PPR value for single parameter
performance.

37
(b) Multi-Parameter-Multi-Result Optimization (MPO) technique
which is to measure the PPR value with two or more
parameters performance
Both techniques are having some advantages to find the PPR for
PON which are as follows
Optimize the optical amplifiers parameters and obtain the
gain.
To measure the effective value of Q-factor and minimum
BER (Min.BER) by optimizing the fiber length of the link.
To estimate system margin and noise figure.
The SPO optimization deals with the main operation set up within a
span of fiber link length using optical amplifiers in PON architecture. In this
research work, the SPO optimization technique is only used to find the stated
problem of PPR for all PONs type with the arrived optical link power
performance results like gain, noise figure, fiber length and received optical
signal power and so on.
2.5 GENERIC PLATFORM FOR THE WORK
2.5.1 Various links in PON Architecture
The schematic diagram for bidirectional link of DBA/ DWA in
PON architecture is shown in Figure 2.4. Feeder network and distribution
networks are establishing a link between OLT to RN and RN to ONUs. In the
proposed 10 Gbps PON architecture, Source-Fiber Coupling Power (SFCP) is
shown as feeder network and Fiber-Receivers Coupling Powers (FRCP) via
RN as distribution networks. Inter coupling process between the links are very
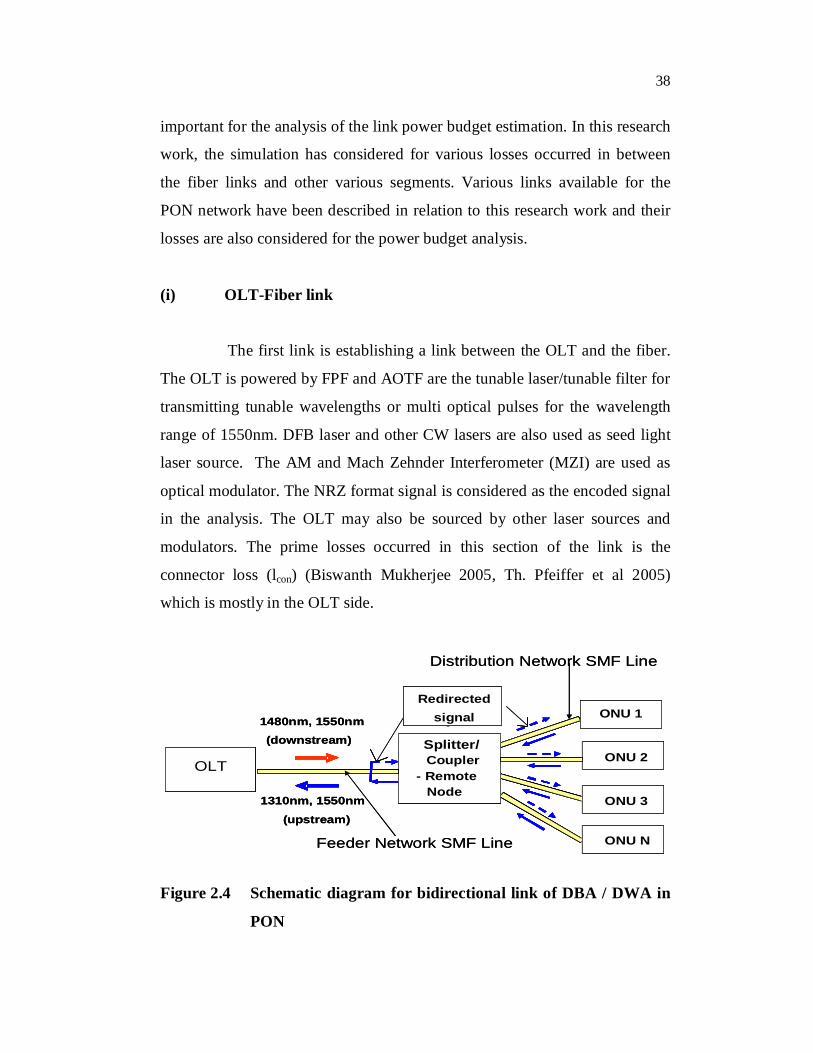
38
important for the analysis of the link power budget estimation. In this research
work, the simulation has considered for various losses occurred in between
the fiber links and other various segments. Various links available for the
PON network have been described in relation to this research work and their
losses are also considered for the power budget analysis.
(i) OLT-Fiber link
The first link is establishing a link between the OLT and the fiber.
The OLT is powered by FPF and AOTF are the tunable laser/tunable filter for
transmitting tunable wavelengths or multi optical pulses for the wavelength
range of 1550nm. DFB laser and other CW lasers are also used as seed light
laser source. The AM and Mach Zehnder Interferometer (MZI) are used as
optical modulator. The NRZ format signal is considered as the encoded signal
in the analysis. The OLT may also be sourced by other laser sources and
modulators. The prime losses occurred in this section of the link is the
connector loss (lcon) (Biswanth Mukherjee 2005, Th. Pfeiffer et al 2005)
which is mostly in the OLT side.
OLT
Splitter/Coupler -Remote
Node ONU
ONU
ONU(downstream)
ONU
Redirected1310nm
signal
Splitter/Coupler
- RemoteNode
ONU 3
ONU N
ONU 2
1480nm, 1550nm
1310nm, 1550nm(upstream)
ONU 1Redirected
signal
OLT
Feeder Network SMF Line
Distribution Network SMF Line
OLT
Splitter/Coupler -Remote
Node ONU
ONU
ONU(downstream)
ONU
Redirected1310nm
signal
Splitter/Coupler
- RemoteNode
ONU 3
ONU N
ONU 2
1480nm, 1550nm
1310nm, 1550nm(upstream)
ONU 1Redirected
signal
OLT
Feeder Network SMF Line
Distribution Network SMF Line
Figure 2.4 Schematic diagram for bidirectional link of DBA / DWA in
PON
39
(ii) Fiber–RN link
Single mode fiber or multi mode fibers have been used for
connection between the OLT and RN. Losses were due to high bit
transmission for long distances using MMF and other losses due to various
dispersions mechanism and bandwidth distance product. The important losses
occurred in this links are dispersion loss (ldisp) and bandwidth-distance loss
(lbd). The fiber coupled with 1xN power splitter in the RN and splitter stage
the splitting ratio 0.1 to 0.5 have been considered for link budget analysis
(Dhillon and Chris DiMinico 2002, Kim and Chen 2004, Chan and Chen
2006, Huan Song and Biswanth Mukharjee 2006, Davey et al 2006).
(iii) RN – ONUs link
The final stage of PONs consists of various end user nodes which
are connected in symmetric distance among all ONUs with fiber link.
Normally, the receiver unit consists of PIN or APD photo detectors with an
operating wavelength of 1310nm for CWDM and 1550nm for WDM/DWDM
respectively (Glen Kramer et al 2000, Kyeong Soo Kim et al 2005, Sawsan
Al Zahr and Maurice Gagnaire 2006). The power and bandwidth losses are
identified and redistributed again to ONUs from RN by the feedback set up
(Glen Kramer et al 2001, Sherif et al 2004). In this analysis, APD has been
used to receive the optical signal at wavelength range of 1550 nm for all
ONUs.
(iv) Bidirectional link
PONs which are considered as information, pulse and packet (bit or
byte) transmission between physical and network layer of from OLT to ONUs
as downstream or downlink and from ONUs to OLT as upstream or uplink.
40
From an architectural point of view, every PONs nodes is operating as
transceiver. (David Gutierrez et al 2005). So for many link powers budget
designs have suffered to stand long term and aimed to do good services to
various PONs like TDM PON, WDM PON, HPON and long reach
(LR PON). All these PONs provide 10 Gbps over 100 km up to 1000-way
multistage split with lower cost fiber by minimizing components of ONUs,
splitting losses and lack of bandwidth sharing while accessing in bursty traffic
(Optical Broadband Working Group 2006, Biswanth Mukherjee 2005).
Practical implementation requires complete study and analysis of link budget
estimation. In this link budget analysis, cost trade off and the point of
customer feasibility for link power budget design of 10 Gbps DBA scheme
using PON architecture with a data handling capacity from 1Gbps to 10 Gbps
are focused.
In the link power budget analysis for the 10Gbps PON architecture,
three major issues were considered. The first needs more efficient wavelength
selective passive device at OLT, RN and ONUs i.e., upgradation of physical
layer performance using tunable mechanism. The second one needs faster or
modified scheduling algorithm, routing and wavelength assignment algorithm
for higher bandwidth allocation dynamically i.e., to achieve or improve high
throughput especially at burst mode receiver operations to improve the
network layer performance, and adaptively processing interleaving/de-
interleaving time of packet transmission without any collision. Finally with
minimum number of device how packet transmission time was effectively
utilized by maximum throughput taken to achieve cost trade off and best QoS
availing high bandwidth at lowest cost for the end user needs or customer
satisfaction.(Sherif et al 2004, David Gutierrez et al 2005)
41
2.5.2 Flowchart Approach for 10 Gbps PON Link Power Estimation
(LPE)
In the proposed link budget estimation, the third window
wavelength region near 1550nm range has been taken for the lowest fiber
loss occurring for bit rate R ≤ 10Gbs. CW laser source bit rate- distance
product (RL) can use laser source with SI – SM fiber to achieve RL for
1550nm in 10Gps (Franz and Jain 2000, Glen Kramer et al 2001) and also has
chosen the 1550nm range for downstream and 1300nm link for upstream link
power in burst mode traffic which has been modeled in a flowchart is shown
in Figure 2.5. The flow chart gives an idea to estimate the link power budget
with power margin (Pm) and ‘m’ is the number of decibels which are greater
than or equal to 4dB as per maximum link length calculation and power
budget (Franz and Jain 2000, Chan and Chen 2006). In this research work the
flowchart is considered not only a novel model to estimate the link power for
one PON but also it helps to estimate the link power for all PON types.
It is concluded in this chapter, the advances in PON devices and
accessing technology offer higher bandwidth capacity, but researchers have
recognized that many problems need to be addressed before these various
PONs are implemented on a large scale. Currently, many researchers
including Stanford University are working on building a hybrid PON system.
The literature on the design requirement of link power estimation for standard
10 Gbps PON was discussed. The main focus of the study is on OLT, RN and
receivers of various PON, since it is the most promising architecture in terms
of scalability with the DBA/DWA and number of ONUs. The difficulties
involved in the design of high performance PON have been described.

42
Figure 2.5 Flow chart for modeling the link power budget design for 10 Gbps PON
Start
Specify Bit Rate (R), Bit Error Rate (BER),
Link Length (L)
Select OLT & ONUs – Tx , Rx
fiber – uni or bidirectional – SMF or MMFRN device – Coupler, Splitter / Combiner, AWG
Evaluate Received power P rfor given R , BER
Determine Power margin P m
Is Pm > n dB?
yes
Make power budget
Is it Satisfactory?
Evaluate max Link length,Dispersion, dispersion limit, splice
Loss and connector loss etc.,
List out Tx , RX, fiber, RN devices
Stop
No
All combinations tried?Select different
Combinations
yes
No
No
Amplifier need,
specify span
length ,BER
yes
Start
Specify Bit Rate (R), Bit Error Rate (BER),
Link Length (L)
Select OLT & ONUs – Tx , Rx
fiber – uni or bidirectional – SMF or MMFRN device – Coupler, Splitter / Combiner, AWG
Evaluate Received power P rfor given R , BER
Determine Power margin P m
Is Pm > n dB?
yes
Make power budget
Is it Satisfactory?
Evaluate max Link length,Dispersion, dispersion limit, splice
Loss and connector loss etc.,
List out Tx , RX, fiber, RN devices
Stop
No
All com binations tried?Select different
Combinations
yes
No
No
Amplifier need,
specify span
length ,BER
yes
Optimization level
Start
Specify Bit Rate (R), Bit Error Rate (BER),
Link Length (L)
Select OLT & ONUs – Tx , Rx
fiber – uni or bidirectional – SMF or MMFRN device – Coupler, Splitter / Combiner, AWG
Evaluate Received power P rfor given R , BER
Determine Power margin P m
Is Pm > n dB?
yes
Make power budget
Is it Satisfactory?
Evaluate max Link length,Dispersion, dispersion limit, splice
Loss and connector loss etc.,
List out Tx , RX, fiber, RN devices
Stop
No
All combinations tried?Select different
Combinations
yes
No
No
Amplifier need,
specify span
length ,BER
yes
Start
Specify Bit Rate (R), Bit Error Rate (BER),
Link Length (L)
Select OLT & ONUs – Tx , Rx
fiber – uni or bidirectional – SMF or MMFRN device – Coupler, Splitter / Combiner, AWG
Evaluate Received power P rfor given R , BER
Determine Power margin P m
Is Pm > n dB?
yes
Make power budget
Is it Satisfactory?
Evaluate max Link length,Dispersion, dispersion limit, splice
Loss and connector loss etc.,
List out Tx , RX, fiber, RN devices
Stop
No
All com binations tried?Select different
Combinations
yes
No
No
Amplifier need,
specify span
length ,BER
yes
Optimization level

43
After formulating the problem of link power estimation as power
budget requirements problem in the optical path, various PONs developments
were introduced. The NGA network of PONs will still be to develop simpler
and more efficient broad band access networks.
2.5.3 Overview of the thesis work
The detailed overview of the thesis work is shown in Figure 2.6 for
the 10 Gbps link power estimation with various innovative in the proposed
PONs using SPO optimization technique.

44
Figure 2.6 An Overview of the thesis work