chapter 2 magnetic materials and their characteristics
TRANSCRIPT

Chapter 2
Magnetic Materials and Their Characteristics
Copyright © 2004 by Marcel Dekker, Inc. All Rights Reserved.

Introduction
The magnetic material is the paramount player in the design of magnetic components. The magnetics
design engineer has three standard words when making the normal design trade-off study: cost, size, and
performance. He will be happy to stuff any two into the bag. The magnetics engineer is now designing
magnetic components that operate from below the audio range to the megahertz range. He is normally
asked to design for maximum performance, with the minimum of his parasitic friends' capacitance and
leakage inductance. Today, the magnetic materials the engineer has to work with are silicon steel, nickel
iron (permalloy), cobalt iron (permendur), amorphous metallic alloys, and ferrites. These also have spin-off
material variants, such as moly-permalloy powder, sendust powder, and iron powder cores. From this group
of magnetic materials, the engineer will make trade-offs with the magnetic properties for his design. These
properties are: saturation Bs, permeability u, resistivity p (core loss), remanence Br, and coercivity Hc.
Saturation
A typical hysteresis loop of a soft magnetic material is shown in Figure 2-1. When a high magnetizing
force is encountered, a point is reached where further increase in, H, does not cause useful increase in, B.
This point is known as the saturation point of that material. The saturation flux density, Bs, and the required
magnetizing force, Hs, to saturate the core are shown with dashed lines.
Figure 2-1. Typical B-H or Hysteresis Loop of a Soft Magnetic Material.
Copyright © 2004 by Marcel Dekker, Inc. All Rights Reserved.
Remanence Flux, Br, and Coercivity Hc
In Figure 2-1 the hysteresis loop clearly shows the remanence flux density, Br. The remanence flux is the
polarized flux remaining in the core after the excitation has been removed. The magnetizing force, -Hc, is
called coercivity. It is the amount of magnetizing force required to bring the remanence flux density back to
zero.
Permeability, fi
The permeability of a magnetic material is a measure of the ease in magnetizing the material. Permeability,
u, is the ratio of the flux density, B, to the magnetizing force, H.
D
=—, [permeability] [2-1]H
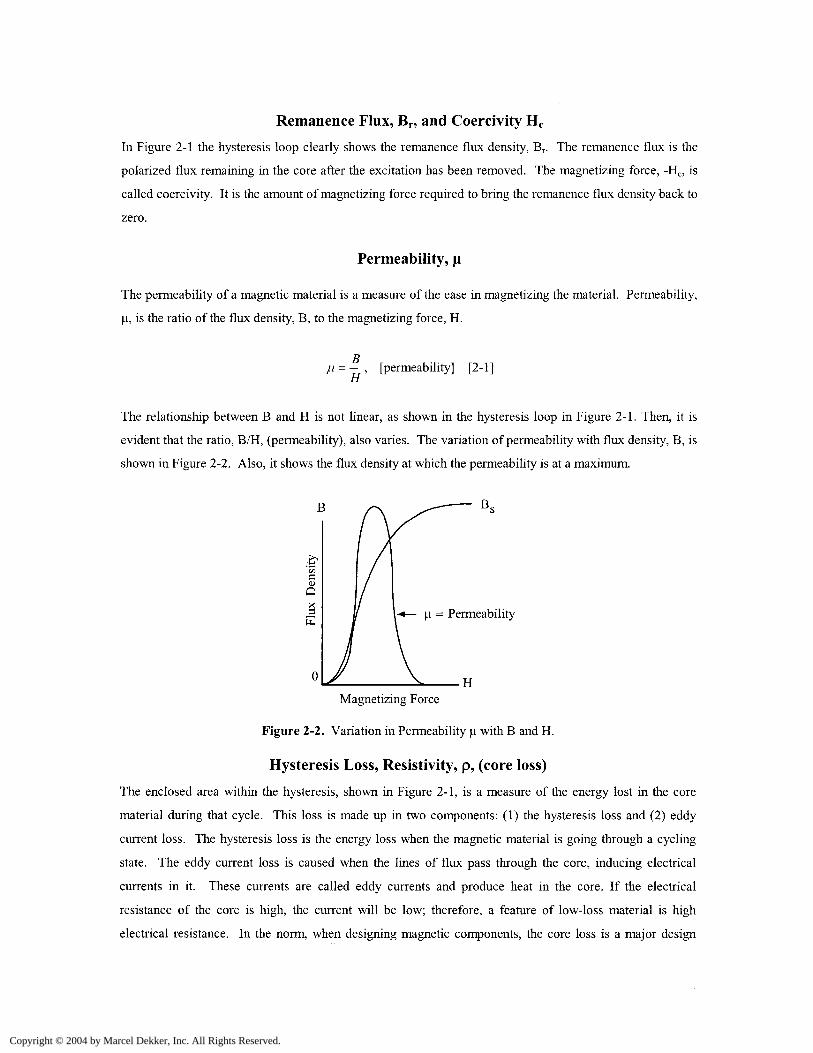
The relationship between B and H is not linear, as shown in the hysteresis loop in Figure 2-1. Then, it is
evident that the ratio, B/H, (permeability), also varies. The variation of permeability with flux density, B, is
shown in Figure 2-2. Also, it shows the flux density at which the permeability is at a maximum.
u = Permeability
0
Magnetizing Force
Figure 2-2. Variation in Permeability n with B and H.
Hysteresis Loss, Resistivity, p, (core loss)
The enclosed area within the hysteresis, shown in Figure 2-1, is a measure of the energy lost in the core
material during that cycle. This loss is made up in two components: (1) the hysteresis loss and (2) eddy
current loss. The hysteresis loss is the energy loss when the magnetic material is going through a cycling
state. The eddy current loss is caused when the lines of flux pass through the core, inducing electrical
currents in it. These currents are called eddy currents and produce heat in the core. If the electrical
resistance of the core is high, the current will be low; therefore, a feature of low-loss material is high
electrical resistance. In the norm, when designing magnetic components, the core loss is a major design
Copyright © 2004 by Marcel Dekker, Inc. All Rights Reserved.

factor. Core loss can be controlled by selecting the right material and thickness. Selecting the correct
material, and operating within its limits, will prevent overheating that could result in damage to the wire
insulation and/or the potting compound.
Introduction to Silicon Steel
Silicon steel was one of the first alloys to be used in transformers and inductors. It has been greatly
improved over the years and is probably, pound for pound, the most, widely used magnetic material. One
of the drawbacks in using steel in the early years was, as the material became older, the losses would
increase. With the addition of silicon to the steel, the advantages were twofold: it increased the electrical
resistivity, therefore reducing the eddy current losses, and it also improved the material's stability with age.
Silicon steel offers high saturation flux density, a relatively good permeability at high flux density, and a
moderate loss at audio frequency. One of the important improvements made to the silicon steel was in the
process called cold-rolled, grain-oriented, AISI type M6. This M6 grain-oriented steel has exceptionally
low losses and high permeability. It is used in applications requiring high performance and the losses will
be at a minimum.
Introduction to Thin Tape Nickel Alloys
High permeability metal alloys are based primarily on the nickel-iron system. Although Hopkinson
investigated nickel-iron alloys as early as 1889, it was not until the studies by Elmen, starting in about 1913,
on properties in weak magnetic fields and effects of heat-treatments, that the importance of the Ni-Fe alloys
was realized. Elmen called his Ni-Fe alloys, "Permalloys," and his first patent was filed in 1916. His
preferred composition was the 78Ni-Fe alloy. Shortly after Elmen, Yensen started an independent
investigation that resulted in the 50Ni-50Fe alloy, "Hipernik," which has lower permeability and resistivity
but higher saturation than the 78-Permalloy, (1.5 tesla compared to 0.75 tesla), making it more useful in
power equipment.
Improvements in the Ni-Fe alloys were achieved by high temperature anneals in hydrogen atmosphere, as
first reported by Yensen. The next improvement was done by using grain-oriented material and annealing
it, in a magnetic field, which was also in a hydrogen atmosphere. This work was done by Kelsall and
Bozorth. Using these two methods, a new material, called Supermalloy, was achieved. It has a higher
permeability, a lower coercive force, and about the same flux density as 78-Permalloy. Perhaps the most
important of these factors is the magnetic anneal, which, not only increases permeability, but also provides a
"square" magnetization curve, important in high frequency power conversion equipment.
Copyright © 2004 by Marcel Dekker, Inc. All Rights Reserved.

In order to obtain high resistance, and therefore lower core losses for high frequency applications, two
approaches have been followed: (1) modification of the shape of metallic alloys and (2) development of
magnetic oxides. The result was the development of thin tapes and powdered alloys in the 1920's, and thin
films in the 1950's. The development of thin film has been spurred by the requirements of aerospace, power
conversion electronics from the mid 1960's to the present.
The Ni-Fe alloys are available in thicknesses of 2 mil, 1 mil, 0.5 mil, 0.25 and 0.125 mil. The material
comes with a round or square B-H loop. This gives the engineer a wide range of sizes and configurations
from which to select for a design. The iron alloy properties for some of the most popular materials are
shown in Table 2-1. Also, given in Table 2-1, is the Figure number for the B-H loop of each of the
magnetic materials.
Table 2-1 Magnetic Properties for Selected Iron Alloys Materials.
Iron Alloy Material PropertiesMaterial
Name
Silicon
Supermendur*
Orthonol
Permalloy
Supermalloy
Composition
3% Si
97% Fe
49% Co
49% Fe
2%V
50% Ni
50% Fe
79% Ni
17%Fe
4% Mo
78% Ni
17%Fe
5% Mo
Initial
Permeability
Hi
1.5K.
0.8 K
2K
12K-100K
10K-50K
Flux Density
Tesla
Bs
1.5-1.8
1.9-2.2
1.42-1.58
0.66-0.82
0.65-0.82
Curie
Temp.
°C
750
940
500
460
460
dc, Coercive
Force, He
Oersteds
0.4-0.6
0.15-0.35
0.1-0.2
0.02-0.04
0.003-0.008
Density
grams/cm
8
7.63
8.15
8.24
8.73
8.76
Weight
Factor
X
1.000
1.068
1.080
1.144
1.148
Typical
B-H Loop
Figures
(2-3)
(2-4)
(2-5)
(2-6)
(2-7)
* Field Anneal.
x Silicon has unity weight factor.
Copyright © 2004 by Marcel Dekker, Inc. All Rights Reserved.

MagnesilDC Hysteresis Loop
i
1.6 1.2 0.8
1
B, t
1.6-
1.2-
0.8-
0.4-
.4 -
^/ :
ssla
- 0.4
- 0.4
" 0.8
~ 1.2
1.6
(
0.8 1.2 1
H, oersteds
Figure 2-3. Silicon B-H Loop: 97% Fe 3% Si.
SupermendurDC Hysteresis Loop
1.6
1.2
0.8
0.4
1.6 1.2 0.8 0.4
0.4 0.8 1.2 1.6
H, oersteds0.4
0.8
1.2
1.6
Figure 2-4. Supermendur B-H Loop: 49% Fe 49% Co 2% V.
Copyright © 2004 by Marcel Dekker, Inc. All Rights Reserved.

OrthonolDC Hysteresis Loop 0.8
0.4
0.8 0.6 0.4 0.:
0.2 0.4 0,6 , 0.*
H, oersteds
Figure 2-5. Orthonol B-H loop: 50% Fe 50% Ni.
B, tesla
0.8-r
Square Permalloy 80 j - -DC Hysteresis Loop Of 4 - -
10.04 0.08 0.12 0.16
Figure 2-6. Square Permalloy 80 B-H loop: 79% Ni 17% Fe 4% Mo.
Copyright © 2004 by Marcel Dekker, Inc. All Rights Reserved.

B, tesla
0.8 -r
SupermalloyDC Hysteresis Loop
0.04 0.08 0.12 0.16
Figure 2-7. Supermalloy B-H Loop: 78% Ni 17% Fe 5% Mo.
Introduction to Metallic Glass
The first synthesis of a metallic glass drawing wide attention among material scientists, occurred in 1960.
Klement, Willens and Duwez reported that a liquid, AuSi alloy, when rapidly quenched to liquid nitrogen
temperature, would form an amorphous solid. It was twelve years later that Chen and Polk produced
ferrous-based metallic glasses in useful shapes with significant ductility. Metallic glasses have since
survived the transition from laboratory curiosities to useful products, and currently are the focus of intensive
technological and fundamental studies.
Metallic glasses are generally produced, by liquid quenching, in which a molten metal alloy is rapidly
cooled, at rates on the order of 105 degrees/sec., through the temperature at which crystallization normally
occurs. The basic difference between crystalline (standard magnetic material) and glassy metals is in their
atomic structures. Crystalline metals are composed of regular, three-dimensional arrays of atoms which
exhibit long-range order. Metallic glasses do not have long-range structural order. Despite their structural
differences, crystalline and glassy metals of the same compositions exhibit nearly the same densities.
The electrical resistivities of metallic glasses are much larger, (up to three times higher), than those of
crystalline metals of similar compositions. The magnitude of the electrical resistivities and their
temperature coefficients in the glassy and liquid states are almost identical.
Copyright © 2004 by Marcel Dekker, Inc. All Rights Reserved.

Metallic glasses are quite soft magnetically. The term, "soft," refers to a large response of the
magnetization to a small-applied field. A large magnetic response is desirable in such applications as
transformers and inductors. The obvious advantages of these new materials are in high frequency
applications with their high induction, high permeability and low core loss.
There are four amorphous materials that have been used in high frequency applications: 2605SC, 2714A,
2714AF and Vitroperm 500F. Material 2605SC offers a unique combination of high resistivity, high
saturation induction, and low core loss, making it suitable for designing high frequency dc inductors.
Material 2714A is a cobalt material that offers a unique combination of high resistivity, high squareness
ratio Br/Bs, and very low core loss, making it suitable for designing high frequency aerospace transformers
and mag-amps. The Vitroperm 500F is an iron based material with a saturation of 1.2 tesla and is well-
suited for high frequency transformers and gapped inductors. The high frequency core loss for the
nanocrystal 500F is lower than some ferrite, even operating at a high flux density. The amorphous
properties for some of the most popular materials are shown in Table 2-2. Also, given in Table 2-2, is the
Figure number for the B-H loop of each of the magnetic materials.
Table 2-2. Magnetic Properties for Selected Amorphous Materials.
Amorphous Material Properties
Material
Name
2605 SC
2714A
2714AF
Nanocrystal
Vitroperm 500F*
Major
Composition
81%Fe
13.5%B
3.5% Si
66% Co
15% Si
4% Fe
66% Co
15% Si
4% Fe
73.5% Fe
l%Cu
15.5% Si
Initial
Permeability
Mi
1.5K
0.8K
2K
30K-80K
Flux Density
Tesla
Bs
1.5-1.6
0.5-0.65
0.5-0.65
1.0-1.2
Curie
Temperature
°C
370
205
205
460
dc, Coercive
Force, He
Oersteds
0.4-0.6
0.15-0.35
0.1-0.2
0.02-0.04
Density
grams/cm"
5
7.32
7.59
7.59
7.73
Weight
Factor
X
0.957
0.995
0.995
1.013
Typical
B-H Loop
Figures
(2-8)
(2-9)
(2-10)
(2-11)
* Vitroperm is the trademark of Vacuumschmelze.
x Silicon has a unity weight factor. See Table 2-1.
Copyright © 2004 by Marcel Dekker, Inc. All Rights Reserved.

B, Tesla1.6
Metglas Type 2605SC 1.2DC Hysteresis Loop
0.8
0.4H, oerstedH—h H h-
0.6 0.4 0.2H 1 1 1 1 1—
0.2 0.4 0.6O 4 H, oersted
0.8
1.2
-L 1.6
Figure 2-8. Amorphous 2605SC B-H Loop: 81% Fe 13.5% B 3.5% Si.
Metglas Type 271 4 ADC Hysteresis Loop
i i i ii i i i0.05 0.03
B, Tesla
0.6
0.5 t
0.4
0.3
0.2 -
0.1u ... .
0.01
J
. f
0.01 0.03 0.051 1 1 1 1 t1 | 1 1 | 1
. 0 1 H, oersted
- 0.2
- 0.3
- 0.4
) 0.5
- 0.6
Figure 2-9. Amorphous 2714A B-H Loop: 66% Co 15% Si 4% Fe.
Copyright © 2004 by Marcel Dekker, Inc. All Rights Reserved.
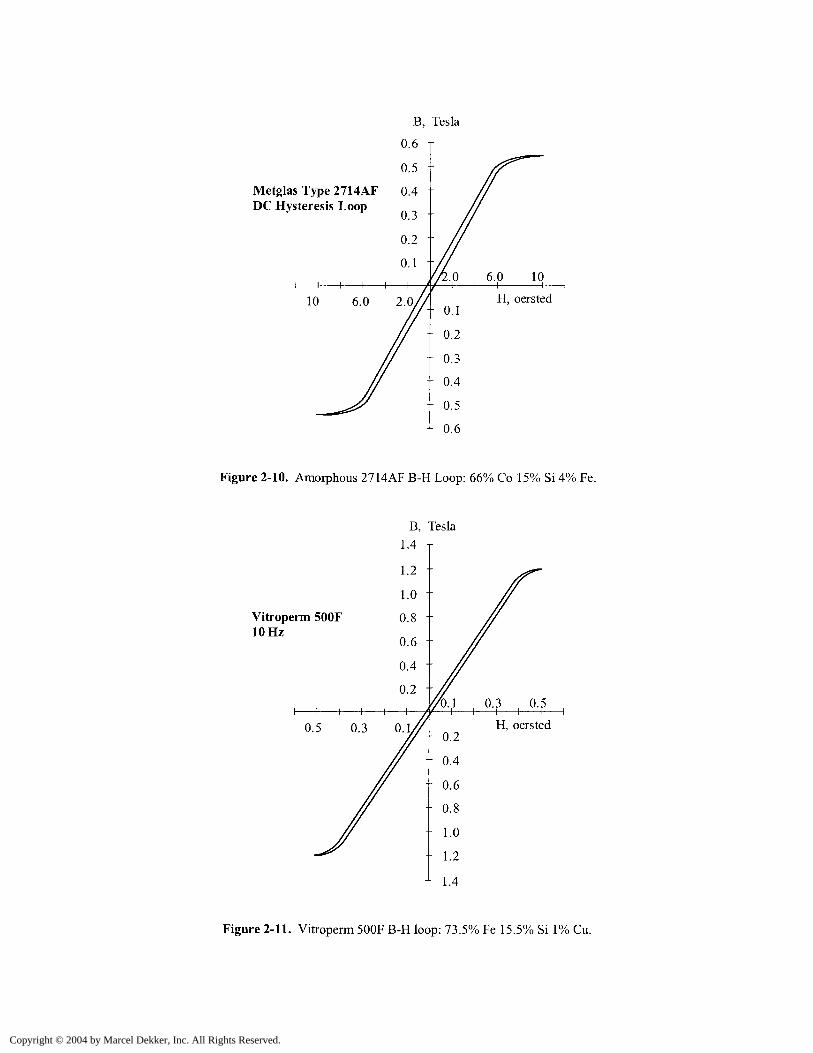
Metglas Type 2714AFDC Hysteresis Loop
Figure 2-10. Amorphous 2714AF B-H Loop: 66% Co 15% Si 4% Fe.
Vitroperm SOOF10 Hz
Figure 2-11. Vitroperm SOOF B-H loop: 73.5% Fe 15.5% Si 1% Cu.
Copyright © 2004 by Marcel Dekker, Inc. All Rights Reserved.

Introduction to Soft Ferrites
In the early days of electrical industry, the need for the indispensable magnetic material was served by iron
and its magnetic alloys. However, with the advent of higher frequencies, the standard techniques of
reducing eddy current losses, (using laminations or iron powder cores), was no longer efficient or cost
effective.
This realization stimulated a renewed interest in "magnetic insulators," as first reported by S. Hilpert in
Germany, in 1909. It was readily understood that, if the high electrical resistivity of oxides could be
combined with desired magnetic characteristics, a magnetic material that was particularly well-suited for
high frequency operation would result.
Research to develop such a material was being performed by scientists in various laboratories all over the
world, such as V. Kato, T. Takei, and N. Kawai in the 1930's in Japan, and by J. Snoek of the Philips'
Research Laboratories in the period 1935-1945 in The Netherlands. By 1945, Snoek had laid down the
basic fundamentals of the physics and technology of practical ferrite materials. In 1948, the Neel Theory of
ferromagnetism provided the theoretical understanding of this type of magnetic material.
Ferrites are ceramic, homogeneous materials composed of oxides; iron oxide is their main constituent. Soft
ferrites can be divided into two major categories; manganese-zinc and nickel-zinc. In each of these
categories, changing the chemical composition, or manufacturing technology, can manufacture many
different Mn-Zn and Ni-Zn material grades. The two families of Mn-Zn and Ni-Zn ferrite materials
complement each other, and allow the use of soft ferrites from audio frequencies to several hundred
megahertz. Manufacturers do not like to handle manganese-zinc in the same area, or building with nickel-
zinc, because one contaminates the other, which leads to poor performance yields. The basic difference
between Manganese-Zinc and Nickel-Zinc is shown in Table 2-3. The biggest difference is Manganese-
Zinc has a higher permeability and Nickel-Zinc has a higher resistivity. Shown in Table 2-4 are some of the
most popular ferrite materials. Also, given in Table 2-4, is the Figure number for the B-H loop of each of
the materials.
Table 2-3. Comparing Manganese-Zinc and Nickel-Zinc Basic Properties.
Basic Ferrite Material Properties
Materials
Manganese Zinc
Nickel Zinc
InitialPermeability
Hi750-15 K
15-1500
Flux DensitypDmax
Tesla
0.3-0.5
0.3-0.5
CurieTemperature,
°C
100-300
150-450
dc, CoerciveForce, Hc
Oersteds
0.04-0.25
0.3-0.5
Resistivity
Q-cm
10-100
106
Copyright © 2004 by Marcel Dekker, Inc. All Rights Reserved.

Manganese-Zinc Ferrites
This type of soft ferrite is the most common, and is used in many more applications than the nickel-zinc
ferrites. Within the Mn-Zn category, a large variety of materials are possible. Manganese-zinc ferrites are
primarily used at frequencies less than 2 MHz.
Nickel-Zinc Ferrites
This class of soft ferrite is characterized by its high material resistivity, several orders of magnitude higher
than Mn-Zn ferrites. Because of its high resistivity, Ni-Zn ferrite is the material of choice for operating
from 1-2 MHz to several hundred megahertz.
The material permeability, um, has little influence on the effective permeability, ue, when the gap dimension
is relatively large, as shown in Table 2-5.
Table 2-4. Magnetic Properties for Selected Ferrite Materials.
Ferrites Material Properties
*Magnetics
Material
Name
K
R
P
F
W
H
Initial
Permeability
m
1500
2300
2500
5000
10,000
15,000
Flux Density
Tesla
Bs@15Oe
0.48T
0.50T
0.50T
0.49T
0.43T
0.43T
Residual Flux
Tesla
Br
0.08T
0.1 2T
0.1 2T
0.1 OT
0.07T
0.07T
Curie
Temperature
°C
>230
>230
>230
>250
>125
>125
dc, Coercive
Force, He
Oersteds
0.2
0.18
0.18
0.2
0.15
0.15
Density
grams/cm
8
4.7
4.8
4.8
4.8
4.8
4.8
Typical
B-H Loop
Figures
(2-12)
(2-13)
(2-13)
(2-14)
(2-15)
(2-15)
*Magnetics, a Division of Spang & Company
Table 2-5. Permeability, and its Effect on Gapped Inductors.
Comparing Material Permeabilities*Material
KRPF
Um
1500230025003000
Gap, inch0.040.040.040.04
Gap, cm0.1010.1010.1010.101
**MPL, cm10.410.410.410.4
"e969899100
*The materials are from Magnetics, a Division of Spang and Company**Core , ETD44
Copyright © 2004 by Marcel Dekker, Inc. All Rights Reserved.

Bm, Tesla
K Material
0.5 l . O 1.5 2.0 2.5
25 °C Bm = 0460T ig IS oersted
100 °C Bm = 0.350T @ 15 oersted
Figure 2-12. Ferrite B-H loop, K Material at 25 and 100 ° C.
P &R Material
25 °C Bm - 0 500T @ 150.2 oersted
100 °C Bm = 0.375T @ 15 oersted
Figure 2-13. Ferrite B-H loop, P & R Material at 25 and 100 ° C.
Copyright © 2004 by Marcel Dekker, Inc. All Rights Reserved.
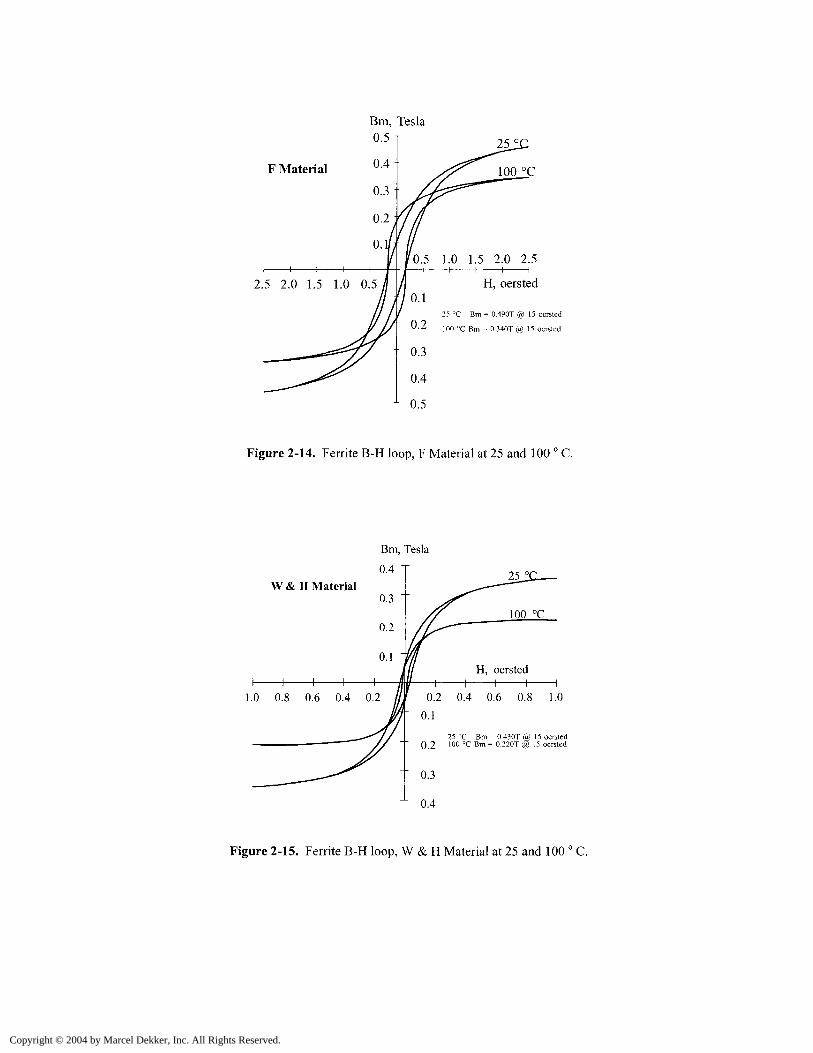
Bm, Tesla0.5 T
F Material
0.5 1.0 1.5 2.0 2.5—i 1 \ 1 1
H, oersted
25 °C Bm = 0.490T @ 15 oersted
100 "C Bm = 0.340T @ 15 oersted
Figure 2-14. Ferrite B-H loop, F Material at 25 and 100 ° C.
Bm, Tesla
W & H Material
0.2 0.4 0.6 0.8 1.01.0 0.8 0.6 0.4 0.2
25 °C Bm = 0.430T @ 15 oersted0.2 10° °C Bm = 0.220T @ 15 oersted
0.3
0.4
Figure 2-15. Ferrite B-H loop, W & H Material at 25 and 100 ° C.
Copyright © 2004 by Marcel Dekker, Inc. All Rights Reserved.
Ferrite Cross Reference
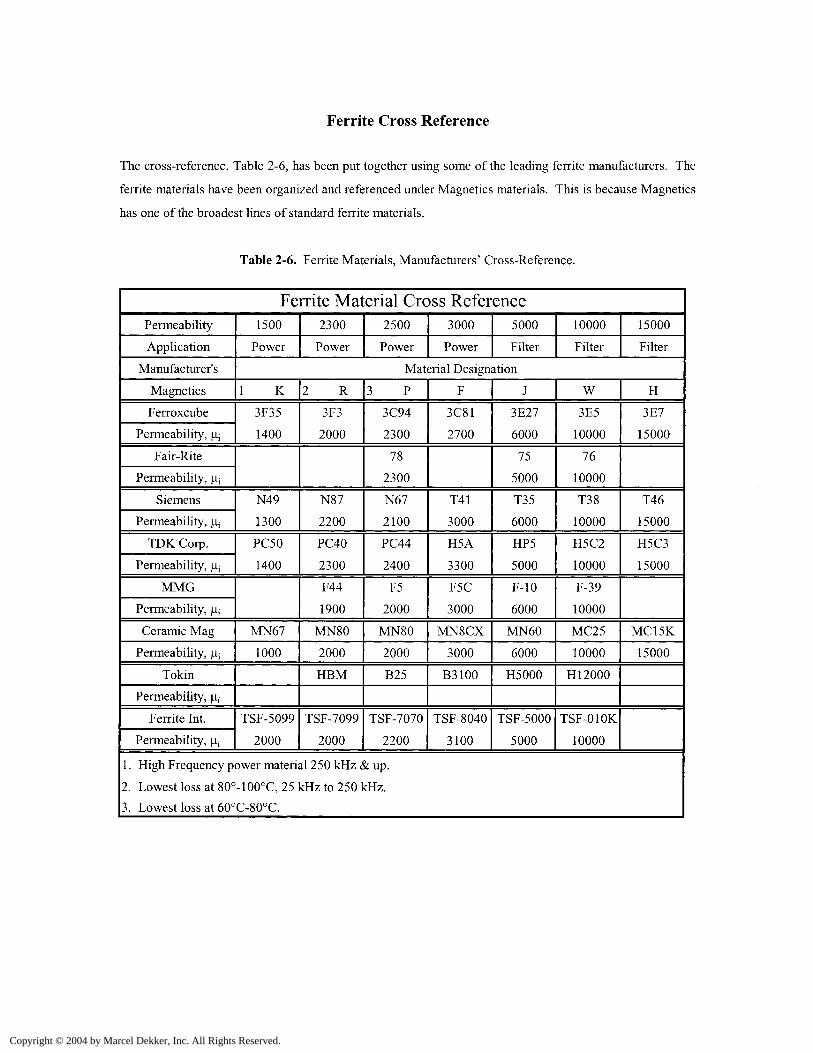
The cross-reference, Table 2-6, has been put together using some of the leading ferrite manufacturers. The
ferrite materials have been organized and referenced under Magnetics materials. This is because Magnetics
has one of the broadest lines of standard ferrite materials.
Table 2-6. Ferrite Materials, Manufacturers' Cross-Reference.
Ferrite Material Cross ReferencePermeability
Application
Manufacturer's
Magnetics
Ferroxcube
Permeability, U;
Fair-Rite
Permeability, Uj
Siemens
Permeability, u^
TDK Corp.
Permeability, u(
MMG
Permeability, u<
Ceramic Mag
Permeability, Uj
Tokin
Permeability, u,
Ferrite Int.
Permeability, u;
1500
Power
2300
Power
2500
Power
3000
Power
5000
Filter
10000
Filter
15000
Filter
Material Designation
1 K
3F35
1400
N49
1300
PC50
1400
MN67
1000
TSF-5099
2000
2 R
3F3
2000
N87
2200
PC40
2300
F44
1900
MN80
2000
HBM
TSF-7099
2000
3 P
3C94
2300
78
2300
N67
2100
PC44
2400
F5
2000
MN80
2000
B25
TSF-7070
2200
F
3C81
2700
T41
3000
H5A
3300
F5C
3000
MN8CX
3000
B3100
TSF-8040
3100
J
3E27
6000
75
5000
T35
6000
HP5
5000
F-10
6000
MN60
6000
H5000
TSF-5000
5000
W
3E5
10000
76
10000
T38
10000
H5C2
10000
F-39
10000
MC25
10000
HI 2000
TSF-010K
10000
H
3E7
15000
T46
15000
H5C3
15000
MC15K
15000
1 . High Frequency power material 250 kHz & up.
2. Lowest loss at 80°-100°C, 25 kHz to 250 kHz.
3. Lowest loss at 60°C-80°C.
Copyright © 2004 by Marcel Dekker, Inc. All Rights Reserved.
Introduction to Molypermalloy Powder Cores
The nickel-iron (Ni-Fe) high permeability magnetic alloys (permalloy) were discovered in 1923 and 1927.
Permalloy alloys were successfully used in powder cores, greatly contributing to the carrier wave
communications of the time.
In the early 1940's, a new material, trademarked Molybdenum Permalloy Powder (MPP), was developed
into cores by the Bell Telephone Laboratory and the Western Electric Company. This new material was
developed for loading coils, filtering coils, and transformers at audio and carrier frequencies in the
telephone facility. The use of such cores has been extended to many industrial and military circuits. The
stability of permeability and core losses with time, temperature, and flux level, are particularly important to
engineers designing tuned circuits and timing circuits. This new material has given reliable and superior
performance over all past powder core materials.
Molybdenum permalloy powder, [2 Molybdenum (Mo)-82 Nickel (Ni)-16 Iron (Fe)], is made by grinding
hot-rolled and embrittled cast ingots; then, the alloy is insulated and screened to a fineness of 120 mesh for
use in audio frequency applications, and 400 mesh for use at high frequencies.
In the power conversion field, the MPP core has made its greatest impact in switching power supplies. The
use of MPP cores and power MOSFET transistors has permitted increased frequency, resulting in greater
compactness and weight reduction in computer systems. The power supply is the heart of the system.
When the power supply is designed correctly, using a moderate temperature rise, the system will last until it
becomes obsolete. In these power systems there are switching inductors, smoothing choke coils, common
mode filters, input filters, output filters, power transformers, current transformers and pulse transformers.
They cannot all be optimally designed, using MPP cores. But, in some cases, MPP cores are the only ones
that will perform in the available space with the proper temperature rise.
Introduction to Iron Powder Cores
The development of compressed iron powder cores as a magnetic material for inductance coils, stemmed
from efforts of Bell Telephone Laboratory engineers to find a substitute for fine iron-wire cores. The use of
iron powder cores was suggested by Heaviside, in 1887, and again, by Dolezalek in 1900.
The first iron powder cores of commercially valuable properties were described by Buckner Speed, in U.S.
Patent No. 1274952, issued in 1918. Buckner Speed and G.W. Elman published a paper in the A.I.E.E.
Transactions, "Magnetic Properties of Compressed Powdered Iron," in 1921. This paper describes a
Copyright © 2004 by Marcel Dekker, Inc. All Rights Reserved.

magnetic material, which is well-suited to the construction of cores in small inductance coils and
transformers, such as those used in a telephone system. These iron powder cores were made from 80 Mesh
Electrolytic Iron Powder. The material was annealed, then, insulated by oxidizing the surface of the
individual particles. In this way, a very thin and tough insulation of grains of iron was obtained; this did not
break down when the cores were compressed. A shellac solution was applied to the insulated powder as a
further insulator and binder. This was how toroidal iron powder cores were manufactured by Western
Electric Company until about 1929. Today's iron powder cores are manufactured in much the same way,
using highly pure iron powder and a more exotic insulator and binder. The prepared powder is compressed
under extremely high pressures to produce a solid-looking core. This process creates a magnetic structure
with a distributed air-gap. The inherent high saturation flux density of iron, combined with the distributed
air-gap, produces a core material with initial permeability of less than 100, and with high-energy storage
capabilities.
The dc current does not generate core loss, but an ac or ripple current does generate core loss. Iron powder
material has higher core loss than some other, more expensive, core materials. Most dc-biased inductors
have a relatively small percentage of ripple current and, thus, core loss will be minimal. However, core loss
will sometimes become a limiting factor in applications with a relatively high percentage of ripple current at
very high frequency. Iron powder is not recommended for inductors with discontinuous current or
transformers with large ac flux swings.
Low cost, iron powder cores are typically used in today's, low and high frequency power switching
conversion applications, for differential-mode, input and output power inductors. Because iron powder
cores have such low permeability, a relatively large number of turns are required for the proper inductance,
thus keeping the ac flux at a minimum. The penalty for using iron powder cores is usually found in the size
and efficiency of the magnetic component.
There are four standard powder materials available for power magnetic devices: Mob/permalloy (MPP)
Powder Cores with a family of curves, as shown in Figure 2-20; High flux (HF) Powder Cores with a family
of curves, as shown in Figure 2-21; Sendust Powder Cores, *(Kool Mu), with a family of curves, as shown
in Figure 2-22; and Iron Powder Cores, with a family of curves, as shown in Figure 2-23. The powder cores
come in a variety of permeabilities. This gives the engineer a wide range in which to optimize the design.
The powder core properties for the most popular materials are shown in Table 2-7. Also, given in Table 2-
7, is the Figure number for the B-H loop of each of the powder core materials. In Table 2-8 is a listing of
the most popular permeabilities for each of the powder core materials.
*Trademark of Magnetics Division, Spang and Company.
Copyright © 2004 by Marcel Dekker, Inc. All Rights Reserved.

Table 2-7. Powder Core Material Properties.
Powder Core Material PropertiesMaterial
Name
MPP
High Flux
Sendust
(Kool Mu)
Iron Powder
Composition
80% Ni20% Fe50% Ni50% Fe85% Fe9% Si6% Al
100%Fe
InitialPermeability
Hi14-550
14- 160
26-125
4.0- 100
Flux DensityTesla
Bs
0.7
1.5
1
0.5- 1.4
CurieTemperature
°C450
360
740
770
dc, CoerciveForce, HeOersteds
0.3
1
0.5
5.0-9.0
Densitygrams/cm
68.5
8
6.15
3.3-7.2
TypicalB-H Loop
Figures(2-16)
(2-17)
(2-18) .
(2-19)
Table 2-8. Standard Powder Core Permeabilities.
Standard Powder Core PermeabilitiesPowder Material
Initial Permeability, u,j
1014263555607590100125147160173200300550
MPP
XX
X
XXXXXXX
High Flux
XX
X
XXX
Sendust(Kool Mu)
X
XXX
X
Iron Powder
X
XXXX
X
Copyright © 2004 by Marcel Dekker, Inc. All Rights Reserved.

B, Tesla
1.0 T
Molypermalloy MPP125 Perm
50 100 150 200 250
250 200 150 100 50
Figure 2-16. Molypermalloy Powder Core, 125 Perm.
High Flux HF125 Perm
50 100 150 200 250
250 200 150 100 50
Figure 2-17. High Flux Powder Core, 125 Perm.
Copyright © 2004 by Marcel Dekker, Inc. All Rights Reserved.

Kool Mu125 Perm
50 100 150 200 250
250 200 150 100 50
Figure 2-18. Sendust (Kool MH) Powder Core, 125 Perm.
Tesla
Iron Powder-5275 Perm
50 100 150 200 250i 1 1
250 200 150 100 50
Figure 2-19. Iron Powder (-52) Core, 75 Perm.
Copyright © 2004 by Marcel Dekker, Inc. All Rights Reserved.

i i i i i i
MPP Powder Cores
DC Magnetizing Force (Oersteds)i i i i i i i i I I i i M
100 1000
Figure 2-20. Permeability Versus dc Bias for Molypermalloy Powder Cores.
100 I I I I I IHigh Flux Powder Cores
DC Magnetizing Force (Oersteds)
I I I i i i i i i i i i
1000
Figure 2-21. Permeability Versus dc Bias for High Flux Powder Cores.
Copyright © 2004 by Marcel Dekker, Inc. All Rights Reserved.

100
80
a
1 60
a 40
&
20
i i i i r \ \ T i l T l I l l rSendust Powder Cores (Kool Mp,)
DC Magnetizing Force (Oersteds)I I I I I I I l l I I I I I I I
1.0 10 100 1000
Figure 2-22. Permeability Versus dc Bias for Sendust Powder Cores.
100
80
J20301
8 60o
OH
B 40
20
I I I I ! I IIron Powder Cores
J I
DC Magnetizing Force (Oersteds)l l l I l l l l l l I I J I
1.0 10 100 1000
Figure 2-23. Permeability Versus dc Bias for Iron Powder Cores.
Copyright © 2004 by Marcel Dekker, Inc. All Rights Reserved.

Core Loss
The designer of power magnetic components, such as transformer and inductors, requires specific
knowledge about the electrical and magnetic properties of the magnetic materials used in these components.
There are two magnetic properties that are of interest, the dc and the ac. The dc B-H hysteresis loop is a
very useful guide for comparing the different types of magnetic materials. It is the ac magnetic properties
that are of interest to the design engineer. One of the most important ac properties is the core loss. The ac
core loss is a function of the magnetic material, magnetic material thickness, magnetic flux density Bac,
frequency f, and operating temperature. Thus, the choice of the magnetic material is based upon achieving
the best characteristic using the standard trade-off such as cost, size, and performance.
All manufacturers do not use the same units when describing their core loss. The user should be aware of
the different core loss units when comparing different magnetic materials. A typical core loss graph is
shown in Figure 2-24. The vertical scale is core loss, and the horizontal scale is flux density. The core loss
data is plotted at different frequencies, as shown in Figure 2-24.
100
10
0>k.oU
1.0
0.1
Frequency #1
Frequency #2
Frequency #3
Frequency #4
0.01 0.1 1.0
Flux Density
Figure 2-24. Typical Graph for Plotting Core Loss at Different Frequencies.
Copyright © 2004 by Marcel Dekker, Inc. All Rights Reserved.

Vertical Scale
Here is a list of core loss units used by manufacturers:
1. watts per pound
2. watts per kilogram
3. milliwatts per gram
4. milliwatts per cubic centimeter (cmj)
Horizontal Scale
Here is a list of flux density units used by manufacturers:
1. gauss
2. kilogauss
3. tesla
4. millitesla
The data can be plotted or presented in either hertz or kilohertz.
Core Loss Equations
Manufacturers are now presenting the core loss in the form of an equation such as:
[2-2]watts / kilogram =kf(m)B(n)
Here, again, the units will change from one manufacturer to another. In the following tables the
manufacturers core loss data has been organized with the same units for all core losses. The data was
modified to put the data in metric units, gauss to tesla and, watts per pound to watts per kilogram. The
coefficients for Magnetics Inc. molypermalloy powder cores, (MPP), using Equation [2-2] are shown in
Table 2-9. The coefficients for Magnetics Inc. High Flux powder cores, (HF), using Equation [2-2] are
shown in Table 2-10. The coefficients for Magnetics Inc. Sendust powder cores, (Kool-Mu), using
Equation [2-2] are shown in Table 2-11. The coefficients for iron alloy materials using Equation [2-2] are
shown in Table 2-12.
Table 2-9. Core Loss Coefficients for MPP Powder Cores.
Core Loss Equation Factors
Magnetics MPP Powder CoresMaterial
MPPMPPMPPMPPMPPMPPMPP
Permeability
V142660125
147-160-173200-300
550
Coefficientk
0.0059800.0011900.0007880.0017800.0004890.0002500.001320
Coefficient(m)
1.3201.4101.4101.4001.5001.6401.590
Coefficient(n)
2.2102.1802.2402.3102.2502.2702.360
Copyright © 2004 by Marcel Dekker, Inc. All Rights Reserved.
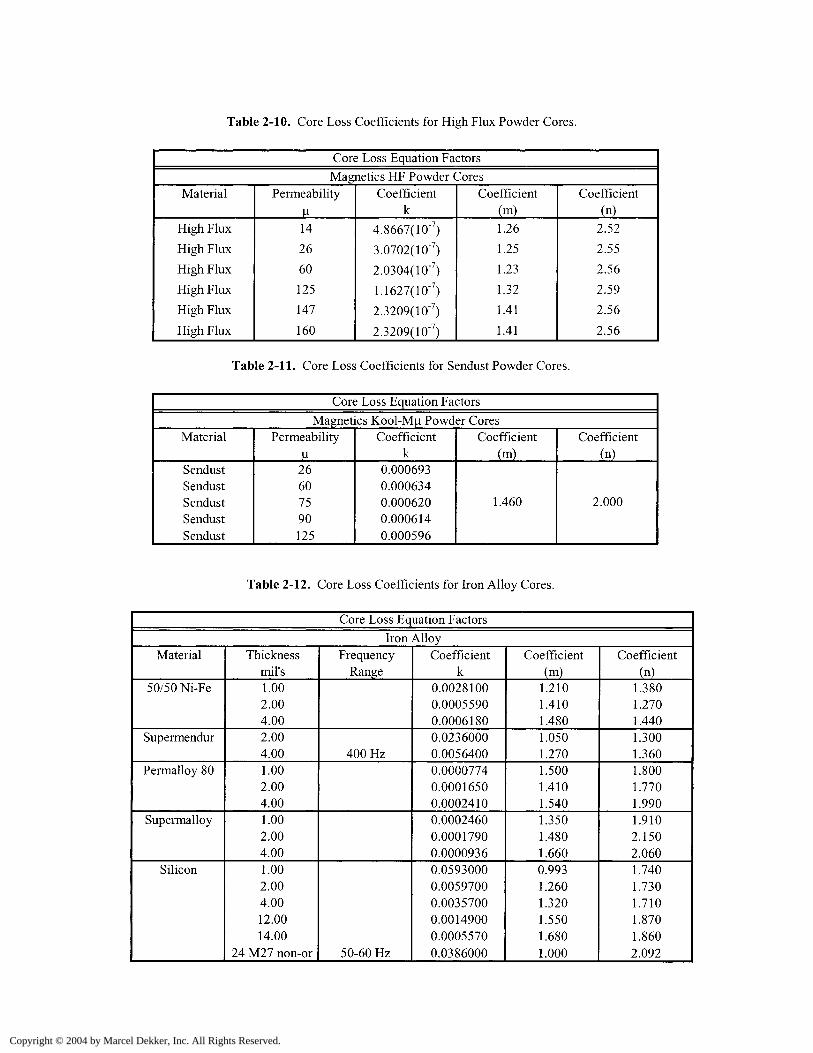
Table 2-10. Core Loss Coefficients for High Flux Powder Cores.
Core Loss Equation Factors
Magnetics HF Powder CoresMaterial
High Flux
High Flux
High Flux
High Flux
High Flux
High Flux
Permeability
U14
26
60
125
147
160
Coefficientk
4.8667(1 0"7)
3.0702(10"7)
2.0304(1 0'7)
1.1627(10'7)
2.3209(10"7)
2.3209(10'7)
Coefficient(m)1.26
1.25
1.23
1.32
1.41
1.41
Coefficient(n)
2.52
2.55
2.56
2.59
2.56
2.56
Table 2-11. Core Loss Coefficients for Sendust Powder Cores.
Core Loss Equation Factors
Magnetics Kool-Mii Powder CoresMaterial
SendustSendustSendustSendustSendust
Permeability
U26607590125
Coefficientk
0.0006930.0006340.0006200.0006140.000596
Coefficient(m)
1.460
Coefficient(n)
2.000
Table 2-12. Core Loss Coefficients for Iron Alloy Cores.
Core Loss Equation Factors
Iron AlloyMaterial
50/50 Ni-Fe
Supermendur
Permalloy 80
Supermalloy
Silicon
Thicknessmil's1.002.004.002.004.001.002.004.001.002.004.001.002.004.0012.0014.00
24 M27 non-or
FrequencyRange
400 Hz
50-60 H/
Coefficientk
0.00281000.00055900.00061800.02360000.00564000.00007740.00016500.00024100.00024600.00017900.00009360.05930000.00597000.00357000.00149000.00055700.0386000
Coefficient(m)
1.2101.4101.4801.0501.2701.5001.4101.5401.3501.4801.6600.9931.2601.3201.5501.6801.000
Coefficient(n)
1.3801.2701.4401.3001.3601.8001.7701.9901.9102.1502.0601.7401.7301.7101.8701.8602.092
Copyright © 2004 by Marcel Dekker, Inc. All Rights Reserved.

The coefficients for amorphous materials, using Equation [2-2] are shown in Table 2-13. The coefficients
for Magnetics ferrite materials, using Equation [2-2] are shown in Table 2-14. The coefficients for
Micrometals iron powder materials, using Equation [2-3] are shown in Table 2-15.
watts/kilogram = k 2Bl [2.3]
Table 2-13. Core Loss Coefficients for Amorphous Materials.
Core Loss Equation Factors
AmorphousMaterial
2605SC2714A
Vitroperm 500
Thicknessmils0.800.800.80
Coefficientk
8.79(10"6)10.1(10-6)
0.864(10-6)
Coefficient(m)
1.7301.5501.834
Coefficient(n)
2.2301.6702.112
Table 2-14. Core Loss Coefficients for Magnetics Ferrites Materials.
Core Loss Equation FactorsMagnetic's Ferrite Core Materials
Material
K
K
K
R
R
R
P
P
P
F
F
F
F
J
J
W
wH
H
FrequencyRange
f< 500kHz
500kHz <=f< 1.0 MHz
f=>1.0MHz
f < 100kHz
100kHz<=f< 500kHz
f=> 500kHz
f < 100kHz
100kHz<=f< 500kHz
f=> 500kHz
f =< 10kHz
10kHz<f<100kHz
100kHz<=f< 500kHz
f=> 500kHz
f=< 20kHz
f> 20kHz
f=< 20kHz
f> 20kHz
f=< 20kHz
f> 20kHz
Coefficientk
2.524(10"4)
8.147(10'8)
1.465(10"19)
5.597(10'4)
4.316(10"5)
1.678(10"6)
1.983(10'3)
4.855(10'5)
2.068(10'15)
7.698(10"2)
4.724(1 0"5)
5.983(10'5)
1.173(10"6)
1.091(10"3)
1.658(10'8)
4.194(10"3)
3.638(10"8)
1.698(10"4)
5.3720(10"5)
Coefficient(m)1.60
2.19
4.13
1.43
1.64
1.84
1.36
1.63
3.47
1.06
1.72
1.66
1.88
1.39
2.42
1.26
2.32
1.50
1.62
Coefficient(n)
3.15
3.10
2.98
2.85
2.68
2.28
2.86
2.62
2.54
2.85
2.66
2.68
2.29
2.50
2.50
2.60
2.62
2.25
2.15
Copyright © 2004 by Marcel Dekker, Inc. All Rights Reserved.

Table 2-15. Core Loss Coefficients for Iron Powder Cores.
Core Loss Equation FactorsMicrometals Iron Powder Cores
Material
Mix-08
Mix- 18
Mix-26
Mix-52
Permeabilityu
35
55
75
75
Coefficient(a)
0.01235
0.00528
0.00700
0.00700
Coefficient(b)
0.8202
0.7079
0.4858
0.4858
Coefficient(c)
1.4694
1.4921
3.3408
3.6925
Coefficient(d)
3.85(10"7)
4.70(1 0"7)
2.71(10"6)
9.86(10'7)
Selection of Magnetic Materials
Transformers used in static inverters, converters, and transformer-rectifier, (T-R), supplies, intended for
aerospace and electronics industry power applications, are usually square loop tape, toroidal design. The
design of reliable, efficient, and lightweight devices for this use has been seriously hampered by the lack of
engineering data, describing the behavior of both the commonly used and more exotic core materials, with
higher-frequency square wave excitation.
A program was carried out at the Jet Propulsion Laboratory, JPL, to develop these data from measurements
of the dynamic B-H loop characteristics of the tape core materials presently available from various industry
sources. Cores were produced in both toroidal and C forms, and were tested in both ungapped (uncut) and
gapped (cut) configuiations. This section describes the results of that investigation.
Typical Operation
A transformer used for inverters, converters, and transformer-rectifier suppliers operates from a power bus,
which could be dc or ac. In some power applications, a commonly used circuit is a driven transistor switch
arrangement, such as that shown in Figure 2.25.
Tl
2.4kHzSquare-wave
Figure 2-25. Typical Driven Power MOSFET Inverter.
Copyright © 2004 by Marcel Dekker, Inc. All Rights Reserved.
One important consideration affecting the design of suitable transformers is that care must be taken to
ensure that operation involves balance drive to the transformer primary. In the absence balance drive, a net
dc current will flow in the transformer primary, which causes the core to saturate easily during alternate
half-cycles. A saturated core cannot support the applied voltage, limited mainly by its on resistance. The
resulting high current, in conjunction with the transformer leakage inductance, results in a high-voltage
spike during the switching sequence, which could be destructive to the power MOSFET. To provide
balanced drive, it is necessary to exactly match the MOSFETs for RDS(on)- But, this is not always
sufficiently effective. Also, exact matching of the MOSFETs is a major problem in a practical sense.
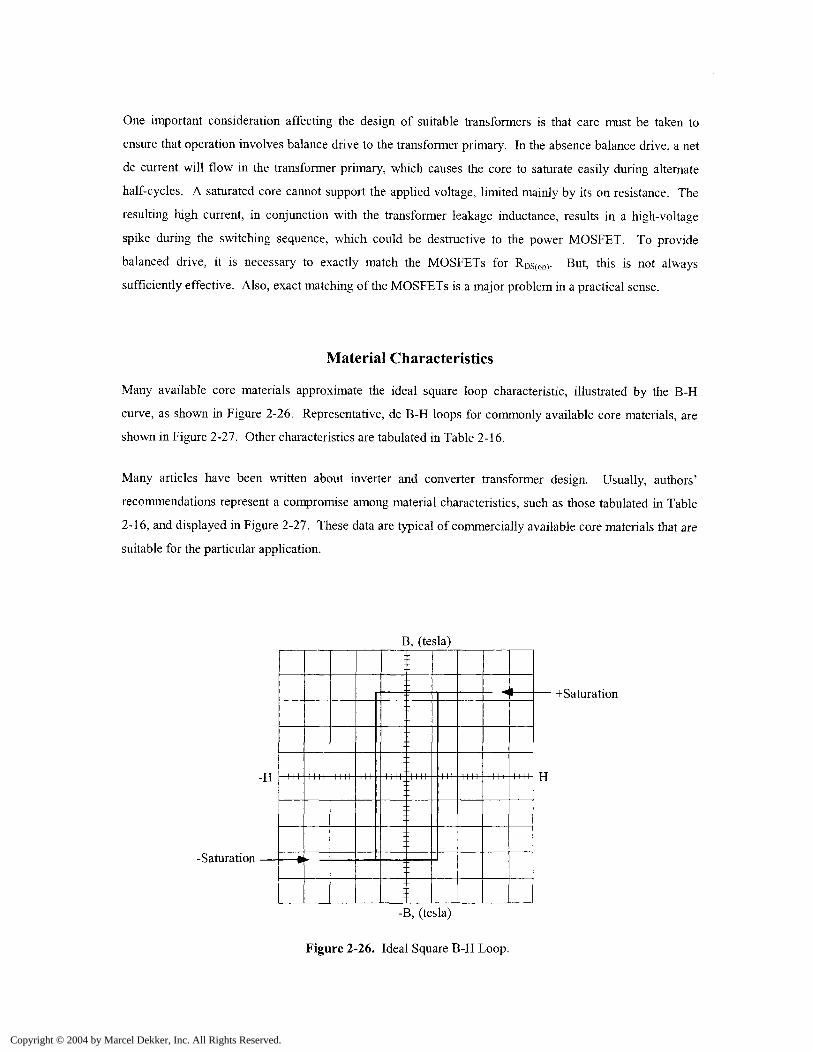
Material Characteristics
Many available core materials approximate the ideal square loop characteristic, illustrated by the B-H
curve, as shown in Figure 2-26. Representative, dc B-H loops for commonly available core materials, are
shown in Figure 2-27. Other characteristics are tabulated in Table 2-16.
Many articles have been written about inverter and converter transformer design. Usually, authors'
recommendations represent a compromise among material characteristics, such as those tabulated in Table
2-16, and displayed in Figure 2-27. These data are typical of commercially available core materials that are
suitable for the particular application.
B, (tesla)
-H
-Saturation
+Saturation
H
-B, (tesla)
Figure 2-26. Ideal Square B-H Loop.
Copyright © 2004 by Marcel Dekker, Inc. All Rights Reserved.

B
2.2
Supermendur
Sq. Permalloy
Supermalloy
0.4 0.3 0.2 0.1 0 0.H, amp-turn/cm
H0.2 0.3 0.4
Figure 2-27. Typical dc B-H Loops of Magnetic Materials.
As can be seen, the material that provides the highest flux density (supermendur) would result in the
smallest component size, and tins would influence the choice if size were the most important consideration.
The ferrite materml, (see the ferrite curve in Figure 2-27), has the lowest flux density. This results in the
largest transformer. Magnetic materials selected for transformers or inductors cannot be chosen by flux
alone. There are other parameters, such as frequency and core configuration that must be taken intoconsideration.
Copyright © 2004 by Marcel Dekker, Inc. All Rights Reserved.

Table 2-16. Magnetic Core Material Characteristics.
Magnetic Core Material CharacteristicsMaterial
Name
Magnesil
Supermendur*
Orthonol
Sq. Permalloy
Supermalloy
Amorphous
2605-SC
Amorphous
2714A
Ferrite
Composition
3% Si
97% Fe
49% Co
49% Fe
2%V
50% Ni
50% Fe
79% Ni
17%Fe
4% Mo
78% Ni
17%Fe
5% Mo
81%Fe
13.5%B
3.5% Fe
66% Co
15% Si
4% Fe
MnZn
Initial
Permeability
Hi
1.5 K
0.8 K
2 K
12K-100K
10K-50K
3K
20K
0.75-15K
Flux Density
Tesla
Bs
1.5-1.8
1.9-2.2
1.42-1.58
0.66-0.82
0.65-0.82
1.5-1.6
0.5-0.58
0.3-0.5
Curie
Temperature
°C
750
940
500
460
460
370
205
100-300
dc, Coercive
Force, He
Oersteds
0.4-0.6
0.15-0.35
0.1-0.2
0.02-0.04
0.003-0.008
0.03-0.08
0.008-0.02
0.04-0.25
Density
grams/cm
5
7.3
8.15
8.24
8.73
8.76
7.32
7.59
4.8
* Field Anneal.
Copyright © 2004 by Marcel Dekker, Inc. All Rights Reserved.

Usually, inverter transformer design is aimed at the smallest size, the highest efficiency and adequate
performance under the widest range of environmental conditions. Unfortunately, the core material that can
produce the smallest size has the lowest efficiency, and the highest efficiency materials result in the largest
size. Thus, the transformer designer must make tradeoffs between allowable transformer size and the
minimum efficiency that can be tolerated. Then, the choice of core material will be based upon achieving
the best characteristic on the most critical or important design parameter, and upon acceptable compromises
on the other parameters.
After analysis of a number of designs, most engineers choose size rather than efficiency as the most
important criterion, and select an intermediate loss factor on core material for their transformers.
Consequently, as the frequency is increased, ferrites have become the most popular material.
Magnetic Material Saturation Defined
To standardize the definition of saturation, several unique points on the B-H loop are defined, as shown in
Figure 2-28.
B
:: Bi
0 H i1An •
Figure 2-28. Defining the B-H Loop.
The straight line through (H0, 0) and (Hs, Bs) may be written as:
H
The line through (0, B2) and (Hs, Bs) has essentially zero slope and may be written as:
[2-5]
Copyright © 2004 by Marcel Dekker, Inc. All Rights Reserved.

Equations [2-1] and [2-2] together define saturation conditions as follows:
Solving Equation [2-3] for Hs yields:
- [2-7]
Where by definition:
By definition, saturation occurs when the peak exciting current (B) is twice the average exciting current (A)
as shown in Figure 2-29. Analytically, this means that:
[2-9]
B
Magnetizing QCurrent
y — y J
1
i *
i\
Jc^ — N
By definition, saturation occurs when B = 2A
Figure 2-29. Defining the Excitation Current.
Solving Equation [2-1] for HI, we obtain:
A [2.10]
To obtain the pre-saturation dc margin (AH), Equation [2-4] is subtracted from Equation [2-6]:
AH=Hs-Hl = [2-11]
Copyright © 2004 by Marcel Dekker, Inc. All Rights Reserved.

The actual unbalanced dc current must be limited to:
7,fc< [amperes] [2-12]
Where, N is the number of turns
MPL is the mean magnetic path length.
Combining Equations [2-7] and [2-8] gives:
, [amperes] [2-13]
As mentioned earlier, in an effort to prevent core saturation, the drive to the switching power MosFet must
be symmetrical and the power MosFet on resistance Ros(on) must be matched. The effect of core saturation,
using an uncut or ungapped core, is shown in Figure 2-30, which illustrates the effect on the B-H loop
transversed with a dc bias. Figure 2-31 shows typical B-H loops of 50-50 nickel-iron material excited from
an ac source, with progressively reduced excitation; the vertical scale is 0.4 T/cm. It can be noted that the
minor loop remains at one extreme position within the B-H major loop after reduction of excitation. The
unfortunate effect of this random minor loop positioning is that, when conduction begins again in the
transformer winding after shutdown, the flux swing could begin from the extreme ends rather than from the
normal zero axis. The effect of this is to drive the core into saturation, with the production of spikes that
can destroy transistors.
B, (tesla)
H
Figure 2-30. B-H Loop with dc Bias.
Copyright © 2004 by Marcel Dekker, Inc. All Rights Reserved.

Figure 2-31. Typical Square Loop Material with dc Bias.
Test Conditions
The test fixture, schematically illustrated in Figure 2-32, was built to affect comparison of dynamic B-H
loop characteristics of various core materials. Cores were fabricated from various core materials in the
basic core configuration, designated No. 52029 for toroidal cores, manufactured by Magnetics Inc. The
materials used were those most likely to be of interest to designers of inverter or converter transformers.
Test conditions are listed in Table 2-17.
TlSI
Current Probe
-O Gnd-O Vertical,~ Horizontal
Figure 2-32. B-H Loop with dc Bias.
Winding Data were derived from the following:
V 104)N = ^ '—, [turns] [2-14]
4.0BafAc'
Copyright © 2004 by Marcel Dekker, Inc. All Rights Reserved.

Table 2-17. Materials and Test Conditions.
Test Conditions
Core Number*
52029-2A
52029-2D
52029-2F
52029-2H
52029-2K
Trade Name
Orthonol
Sq. Permalloy
Supermalloy
48 Alloy
Magnesil
Bs
Tesla
1.45
0.75
0.75
1.15
1.6
Turns
N
54
54
54
54
54
Frequency
kHz
2.4
2.4
2.4
2.4
2.4
MPL
cm
9.47
9.47
9.47
9.47
9.47
*Magnetics toroidal cores.
The test transformer, represented in Figure 2-32, consists of 54-turn primary and secondary windings, with
square wave excitation on the primary. Normally, switch SI is open. With switch SI closed, the secondary
current is rectified by the diode to produce a dc bias in the secondary winding.
Cores were fabricated from each of the materials by winding a ribbon of the same thickness on a mandrel of
a given diameter. Ribbon termination was affected by welding in the conventional manner. The cores were
vacuum impregnated, baked, and finished as usual.
Figures 2-33 - 2-36 show the dynamic B-H loops obtained for various core materials. In each of these
Figures, switch SI was in the open position, so there was no dc bias applied to the core and windings.
B, (tesla)
-H
-Saturation
- Saturation
H
-B, (tesla)
Figure 2-33. Magnesil (K) B-H Loop, B = 0.5 T/cm, H = 100 ma/cm.
Copyright © 2004 by Marcel Dekker, Inc. All Rights Reserved.

B, (tesla)
Saturation
-Saturation
-B, (tesla)
Figure 2-34. Orthonol (2A) B-H Loop, B = 0.5 T/cm, H = 50 ma/cm.
B, (tesla)
-Saturation
• Saturation
-B, (tesla)
Figure 2-35. Square Permalloy (2D) B-H Loop, B = 0.2 T/cm, H = 20 ma/cm.
Copyright © 2004 by Marcel Dekker, Inc. All Rights Reserved.

B, (tesla)
Saturation
-Saturation
-B, (tesla)
Figure 2-36. Supermalloy (2F) B-H Loop, B = 0.2 I/cm, H = 10 ma/cm.
Figures 2-37 to 2-40 show the dynamic B-H loop patterns obtained for various core materials when the test
conditions are included in a sequence, in which SI was in open condition (A), then in closed condition (B),
and then, opened again, in condition (C). It is apparent from this data that, with a small amount of dc bias,
the minor dynamic B-H loop can traverse the major B-H loop from saturation to saturation. Note that after
the dc bias has been removed, the minor B-H loops remained shifted to one side or the other. Because of
the ac coupling of the integrator to the oscilloscope, the photographs in these figures do not present a
complete picture of what really happens during the flux swing.
B, (tesla)
-B, (tesla)
Figure 2-37. Magnesil (2K) B-H Loop, B = 0.3 T/cm, H = 200 ma/cm.
Copyright © 2004 by Marcel Dekker, Inc. All Rights Reserved.

-H -H+
B, (tesla)
B
I
cH
-B, (tesla)
Figure 2-38. Orthonol (2A) B-H Loop, B = 0.2 T/cm, H = 100 ma/cm.
B, (tesla)
-B, (tesla)
Figure 2-39. Sq. Permalloy (2D) B-H Loop, B = 0.1 T/cm, H = 20 ma/cm.
Copyright © 2004 by Marcel Dekker, Inc. All Rights Reserved.

B, (tesla)
-B, (tesla)
Figure 2-40. Supermalloy (2F) B-H Loop, B = 0.1 T/cm, H = 10 ma/cm.
Magnetic Material Saturation Theory
The domain theory of the nature of magnetism is based on the assumption that all magnetic materials consist
of individual molecular magnets. These minute magnets are capable of movement within the material.
When a magnetic material is in its unmagnetized state, the individual magnetic particles are arranged at
random, and effectively neutralize each other. An example of this is shown in Figure 2-41, where the tiny
magnetic particles are arranged in a disorganized manner. (The north poles are represented by the darkened
ends of the magnetic particles.) When a material is magnetized, the individual particles are aligned or
oriented in a definite direction, as shown in Figure 2-42.
Domains
Toroidal Core
Figure 2-41. Magnetic Domains, Arranged in a Random Manner.
Copyright © 2004 by Marcel Dekker, Inc. All Rights Reserved.

Domains
Toroidal Core
Figure 2-42. Magnetic Domains, Aligned in a Definite Direction.
The degree of magnetization of a material depends on the degree of alignment of the particles. The external
magnetizing force can continue to affect the material up to the point of saturation, the point at which
essentially all of the domains are lined up in the same direction.
In a typical toroidal core, the effective air gap is less than 10~6 cm. Such a gap is negligible in comparison
to the ratio of mean length to permeability. If the toroid was subjected to a strong magnetic field (enough to
saturate), essentially all of the domains would line up in the same direction. If suddenly the field were
removed at Bm, the domains would remain lined up, and be magnetized along that axis. The amount of flux
density that remains is called the residual flux, Br. The result of this effect was shown earlier in Figures 2-
37 through 2-40.
Air Gap Effect
An air gap introduced into the core has a powerful demagnetizing effect, resulting in a "shearing over" of
the hysteresis loop, and a considerable decrease in permeability of high-permeability materials. Direct
current excitation follows the same pattern. However, the core bias is considerably less affected than the
magnetization characteristics by the introduction of a small air gap. The magnitude of the air gap effect
also depends on the length of the mean magnetic path and on the characteristics of the uncut core. For the
same air gap, the decrease in permeability will be less with a greater magnetic flux path, but more
pronounced in a high-permeability core with a low coercive force
Effect of Gapping
Figure 2-43 shows a comparison of a typical toroidal core B-H loop, without and with a gap. The gap
increases the effective length of the magnetic path. When voltage E is impressed across primary winding,
Np, of a transformer, the resulting current, Im, will be small because of the highly inductive circuit, as shown
in Figure 2-44. For a particular core size, maximum inductance occurs when the air gap is minimum.
Copyright © 2004 by Marcel Dekker, Inc. All Rights Reserved.

B, (teslas)
Bmax
{H-HhH-
(a)Without Gap
-Bmax
-B, (teslas) -B, (teslas)
Figure 2-43. Comparing Magnetic Materials with and Without a Gap.
2.4kHzSquare-wave
Tl
54T
SI
54T
R2
CR1
Figure 2-44. Implementing dc Unbalance.
When SI is closed, an unbalanced dc current flows in the secondary, Ns turns, and the core is subjected to a
dc magnetizing force, resulting in a flux density that may be expressed as:
**=- MPL, [tesla] [2-15]
In converter and inverter design, this dc flux is augmented by the ac flux swing, which is:
B =KffAcN
, [tesla] [2-16]
If the sum of Bdc and Bac shifts operations above the maximum operating flux density of the core material,
the incremental permeability, (|iac), is reduced. This condition lowers the impedance and increases the flow
Copyright © 2004 by Marcel Dekker, Inc. All Rights Reserved.

of magnetizing current, Im. This condition can be remedied by introducing into the core assembly an air gap
which causes a decrease in dc magnetization in the core. However, the size of the air gap that can be
incorporated has a practical limitation. Since the air gap lowers impedance, it results in increased
magnetizing current Im, which is inductive. The resultant voltage spikes produced by such currents apply a
high stress to the switching transistors and may cause failure. This stress can be minimized by tight control
of lapping and etching of the gap to keep the gap to a minimum.
From Figure 2-43, it can be seen that the B-H curves depict maximum flux density, Bm, and residual flux,
Br, for ungapped and gapped cores, and that the useful flux swing is designated, AB, which is the difference
between, Bm and Br. It will be noted, in Figure 2-43(a), that Br approaches Bnl, but, in Figure 2-43(b), there
is a much greater, AB, between them. In either case, when excitation voltage is removed at the peak of the
excursion of the B-H loop, flux falls to the Br point. It is apparent that introducing an air gap reduces Br to
a lower level, and increases the useful flux density. Thus, insertion of an air gap in the core eliminates, or
markedly reduces, the voltage spikes produced by the leakage inductance, due to the transformer saturation.
Two types of core configurations were investigated in the ungapped and gapped states. Figure 2-45 shows
the type of toroidal core that was cut, and Figure 2-46 shows the type of C core that was cut. Toroidal cores
are virtually gapless, when conventionally fabricated. To increase the gap, the cores were physically cut in
half, and the cut edges were lapped, acid etched to remove cut debris, and banded to form the cores. A
minimum air gap, on the order of less than 25 urn, was established.
Gap Placement
Figure 2-45. Typical cut Toroidal Core.
As will be noted from Figures 2-47 through 2-50, which show the B-H loops of the uncut and cut cores, the
results obtained indicated that the effect of gapping was the same for both the C cores and the toroidal cores
subjected to testing. It will be noted, however, that gapping of the toroidal cores produced a lowered
squareness characteristic for the B-H loop, as shown in Table 2-18. This data was obtained from Figures 2-
47 through 2-50. AH values extracted from the same figures, as shown in Figure 2-51, are tabulated in
Table 2-19.
Copyright © 2004 by Marcel Dekker, Inc. All Rights Reserved.

Gap Placement
D
Figure 2-46. Typical Middle Cut C Core.
B, (tesla) B, (tesla)\ i
— Uncut
-H H -H
B = 0.5 T/cm, H = 100 ma/cm B = 0.5 T/cm, H = 500 ma/cm
Figure 2-47. Magnesil (K) B-H Loop, Uncut and Cut with Minimum Gap.
B, (tesla) B, (tesla)
H -H
B = 0.5 T/cm, H = 50 ma/cm B = 0.5 T/cm, H = 100 ma/cm
Figure 2-48. Orthonal (A) B-H Loop, Uncut and Cut with Minimum Gap.
Copyright © 2004 by Marcel Dekker, Inc. All Rights Reserved.

B, (tesla) B, (tesla)
H -H
B = 0.2 T/cm, H = 20 ma/cm B = 0.2 T/cm, H = 100 ma/cm
Figure 2-49. Square Permalloy (D) B-H Loop, Uncut and Cut with Minimum Gap.
B, (tesla) B, (tesla)
H -H
B = 0.2 T/cm, H = 10 ma/cm B = 0.2 T/cm, H = 50 ma/cm
Figure 2-50. Supermalloy (F) B-H Loop, Uncut and Cut with Minimum Gap.
Table 2-18.
Comparing
Core Number*
52029-2A
52029-2D
52029-2F
52029-2K
Trade Name
Orthonol
Sq. Permalloy
Superpermalloy
Magnesil
I Br/Bm on Uncut and Cut Cores.Bs
Tesla
1.45
0.75
0.75
1.60
Turns
N
54
54
54
54
Uncut
Br/Bm
0.96
0.86
0.81
0.93
Cut
Br/Bm
0.62
0.21
0.24
0.22
*Magnetics toroidal cores.
Copyright © 2004 by Marcel Dekker, Inc. All Rights Reserved.

B, (teslas) B, (teslas)
(a)Without Gap
- H I 1 1 1 1 1 1 1 1 1 1
AH,op
-B, (teslas) -B, (teslas)
Figure 2-51. Defining AHop and AH.
Table 2-19. Comparing AH and AHop on Uncut and Cut Cores.
Comparing AH and AHop on Uncut and Cut Cores.
Material
*Trade Name
Orthonol
Sq. Permalloy
Supermalloy
Magnesil
Bm
Tesla
1.44
0.73
0.63
1.54
Bac
Tesla
1.15
0.58
0.58
1.23
Bdc
Tesla
0.288
0.146
0.136
0.310
Amp-turns/cm
Uncut
AHop
0.0125
0.0100
0.0175
0.0750
AH
0
0.005
0.005
0.025
Cut
AHop
0.895
0.983
0.491
7.150
AH
0.178
0.178
0.224
1.780
*Magnetics Cores.
A direct comparison of cut and uncut cores was made electrically by means of two different test circuits.
The magnetic material used in this branch of the test was Orthonol. The frequency was 2.4 kHz, and the
flux density was 0.6 T. The first test circuit, shown in Figure 2-52, was a driven inverter operating into a
30-W load, with the power MOSFETs, operating into and out of saturation. Drive was applied
continuously. SI controls the supply voltage to Ql and Q2.
With switch SI closed, transistor Ql was turned on and allowed to saturate. This applied voltage, E-VDs(on),
across the transformer winding. Switch SI was then opened. Then, the flux in transformer, T2, dropped to
the residual flux density, Br. Switch SI was closed again. This was done several times in succession to
catch the flux in an additive direction. Figures 2-53 and 2-54 show the inrush current measured at the
center tap of T2.
Copyright © 2004 by Marcel Dekker, Inc. All Rights Reserved.

Tl
2.4kHzSquare-wave
Rl T2
SOW
Current Probe
Figure 2-52. Inverter Inrush Current Test Fixture.
Figure 2-53. Typical Inrush Current of a Uncut Core in a Driven Inverter.
I
rot
Figure 2-54. Resulting Inrush Current using a Cut Core.
It will be noted, in Figure 2-53, that the uncut core saturated, and the inrush current was limited only by
circuit resistance and power, MOSFETs Ros(on)- Figure 2-54 shows that saturation did not occur in the case
of the cut core. Thus, the high inrush current and transistor stress were virtually eliminated.
The second test circuit arrangement is shown in Figure 2-55. The purpose of this test was to excite a
transformer and measure the inrush current, using a current probe. A square wave power oscillator was
used to excite transformer, T2. Switch, SI, was opened and closed several times to catch the flux in an
additive direction. Figures 2-56 and 2-57 show inrush current for an uncut and cut core, respectively.
Copyright © 2004 by Marcel Dekker, Inc. All Rights Reserved.

2.4kHzSquare-wave
Current ProbeFigure 2-55. Transformer Rectifier Inrush Current Measurement.
I
J3 ^ftp^ W
Figure 2-56. Inrush Current of a Transformer using a Uncut Core.
Figure 2-57. Inrush Current of a Transformer using a Cut Core.
A small amount of air gap, less than 25 ^m, has a powerful effect on the demagnetizing force, but little
effect on the core loss. This small air gap decreases the residual magnetism by "shearing over" the
hysteresis loop, which eliminates the problem of the core tending to remain saturated.
A typical example of the merits of the cut core occurred in the checkout of a Mariner spacecraft. During the
checkout of a prototype science package, a large (8 A, 200 s) turn-on transient was observed. The normal
running current was 0.06 A, fused with a parallel-redundant 1/8-A fuse, as required by the Mariner Mars
design philosophy. With the 8-A inrush current, the 1/8-A fuses were easily blown. This did not happen,
on every turn-on, but only when the core would "latch up" in the wrong direction for turn-on. Upon
inspection, the transformer turned out to be a 50-50 nickel-iron toroid. The design was changed from a
toroidal core to a cut core with a 25 um, air gap. The new design was completely successful in eliminating
the 8-A turn-on transient.
Copyright © 2004 by Marcel Dekker, Inc. All Rights Reserved.

Composite Core Configuration
A composite core configuration has been developed for transformers that combine the protective feature of
a gapped core with the much lower magnetizing current requirement of an uncut core. The uncut core
functions, under normal operating conditions, and the cut core takes over during abnormal conditions to
prevent high switching transients aii'd their potentially destructive effect on the transistors.
This configuration is a composite of cut and uncut cores assembled together concentrically, with the uncut
core nested within the cut core. The uncut core has high permeability, and thus requires a very small
magnetizing current. On the other hand, the cut core has a low permeability and thus requires a much
higher magnetization current. The uncut core is designed to operate at a flux density that is sufficient for
normal operation of the converter. The uncut core may saturate under the abnormal conditions previously
described. The cut core then takes over and supports the applied voltage so that excessive current does not
flow. In a sense, it acts like a ballast resistor in some circuits to limit current flow to a safe level.
Figures 2-58 and 2-59 show the magnetization curves for an uncut core and a composite core of the same
material at the same flux density. The much lower, Br characteristic of the composite compared to the uncut
core is readily apparent.
The desired features of the composite core can be obtained more economically by using different materials
for the cut and uncut portions of the core. It was found that when the design required high nickel (4/79), the
cut portion could be low nickel, (50/50), and because low nickel has twice as high a flux density as high
nickel, the core was made of 66% high nickel, and 33% low nickel.
-H
B, (tesla)
H
-B, (tesla)
Figure 2-58. Uncut Core Excited at 0.2 T/cm.
Copyright © 2004 by Marcel Dekker, Inc. All Rights Reserved.

-H
B, (tesla)
4-
:/
++++ H
-B, (tesla)
Figure 2-59. Both Cut and Uncut Cores Excited at 0.2 T/cm.
Figure 2-60 shows cut and uncut cores that have been impregnated to bond the ribbon layers together. The
uncut core was first trimmed to fit within the inner diameter of the cut core by peeling off a wrap or two of
the ribbon steel. The two cores are assembled into a composite core (Figure 2-61, on the right).
Square Permalloy
Orthonol 50/50
Figure 2-60. Composite Cores Ready for final Assembly.
OD
Orthonol 50/50Square Permalloy 80
ID
Figure 2-61. Composite Cores Assembled in Final Form.
To ensure uniform characteristics for gapped cores, a gap dimension of 50 urn is recommended, because
variations produced by thermal cycling will not affect this gap greatly. In the composite core, the gap is
obtained by inserting a sheet of paper Mylar or Kapton film material between the core ends during banding.
Copyright © 2004 by Marcel Dekker, Inc. All Rights Reserved.

The same protective feature can be accomplished in transformers with laminated cores. When laminations
are stacked by interleaving them one-by-one, the result will be a minimum air gap, as shown in Figure 2-62
by the squareness of the B-H loop. Shearing over of the B-H loop, or decreasing the residual flux, as shown
in Figure 2-63, is accomplished by butt joining half the laminations in the core-cross section, which
introduces a small, additional air gap.
B, (tesla)
-H H
-B, (tesla)Figure 2-62. B-H Loop with Laminations Stacked 1x1 Interleaved.
B, (tesla)
-H H
-B, (tesla)
Figure 2-63. B-H Loop with Laminations Stack Half 1x1 and Half Butt Stack.
Table 2-20 is a compiling of composite cores manufactured by Magnetics Inc., alongside their standard
dimensional equivalent cores. Also, included in Table 2-20, is the cores' area product, Ap, and the core
geometry Kg, which is discussed in Chapter 7.
Copyright © 2004 by Marcel Dekker, Inc. All Rights Reserved.

Table 2-20. Composite Core Listing Along with the Area Product and Core Geometry.
Magnetics Inc. Composite CoresComposite
Number01605-2D01754-2D01755-2D01609-D2
01756-2D01606-2D01761-2D01757-2D
01760-2D02153-2D01758-2D01607-2D
01966-2D01759-2D01608-2D01623-2D01624-2D
Standard Core
Number52000520025207652061
52106520945231852029
52188521815203252026
5203052038520355242552169
AP(cm4)
0.07280.14400.28500.3890
0.43900.60300.77901.0900
1.15201.22001.45502.1800
2.33702.91004.67605.25507.1300
Kg
(cm5)0.001050.001710.006610.00744
0.009480.022100.026000.02560
0.051200.040700.043100.08740
0.063500.140000.206000.262000.41800
Ac = 66% Square Permalloy 4 / 79.Ac = 33% Orthonol 50 / 50.lg = 2 mil Kapton.
Summary
Low-loss tape-wound toroidal core materials, that have a very square hysteresis characteristic, (B-H loop),
have been used extensively in the design of spacecraft transformers. Due to the squareness of the B-H
loops of these materials, transformers designed with them tend to saturate quite easily. As a result, large
voltage and current spikes, which cause undue stress on the electronic circuitry, can occur. Saturation
occurs when there is any unbalance in the ac drive to the transformer, or when any dc excitation exists.
Also, due to the square characteristic, a high residual flux state, (high Br), may remain when excitation is
removed. Reapplication of excitation in the same direction may cause deep saturation, and an extremely
large current spike, limited only by source impedance and transformer winding resistance, can result. This
can produce catastrophic failure.
With the introduction of a small, (less than 25 um), air gap into the core, the problems described above can
be avoided while retaining the low-loss properties of the materials. The air gap has the effect of "shearing
over" the B-H loop of the material so that the residual flux state is low and the margin between operating,
Copyright © 2004 by Marcel Dekker, Inc. All Rights Reserved.

flux density, and saturation, flux density is high. The air gap thus has a powerful demagnetizing effect upon
the square loop materials. Properly designed transformers, using cut toroid or C core square-loop materials,
will not saturate upon turn-on, and can tolerate a certain amount of unbalanced drive or dc excitation.
It must be emphasized, however, that because of the nature of the material and the small size of the gap,
extreme care and control must be taken in performing the gapping operation. Otherwise, the desired
shearing effect will not be achieved, and the low-loss properties will be lost. The cores must be very
carefully cut, lapped, and etched to provide smooth, residue-free surfaces. Reassembly must be performed
with equal care.
Copyright © 2004 by Marcel Dekker, Inc. All Rights Reserved.