chapter 2 spatial data input - national centre of...
TRANSCRIPT

Workshop/Training on “Earthquake Vulnerability and Multi- Hazard Risk Assessment: Geospatial Tools for Rehabilitation and Reconstruction Efforts” held at National Centre of Excellence in Geology, Peshawar, Pakistan from 13 to 31 March 2006
Ch2-p29
Associated Institute
Chapter 2
SPATIAL DATA INPUT
Analysis and modeling in a GIS requires input of relevant data. The data consist of two types: spatial data representing geographic features (points, lines and areas) and attribute data (descriptive information). Data input should be done with utmost care, as the results of analyses heavily depend on the quality of the input data. In ILWIS data can be entered by: − Digitizing, if you want to use data from analog (paper) maps;
− Keyboard entry, for entering tabular data;
− Scanning, if you want to use paper prints of satellite images, aerial photographs, maps and pictures;
− Importing existing data files from other sources.
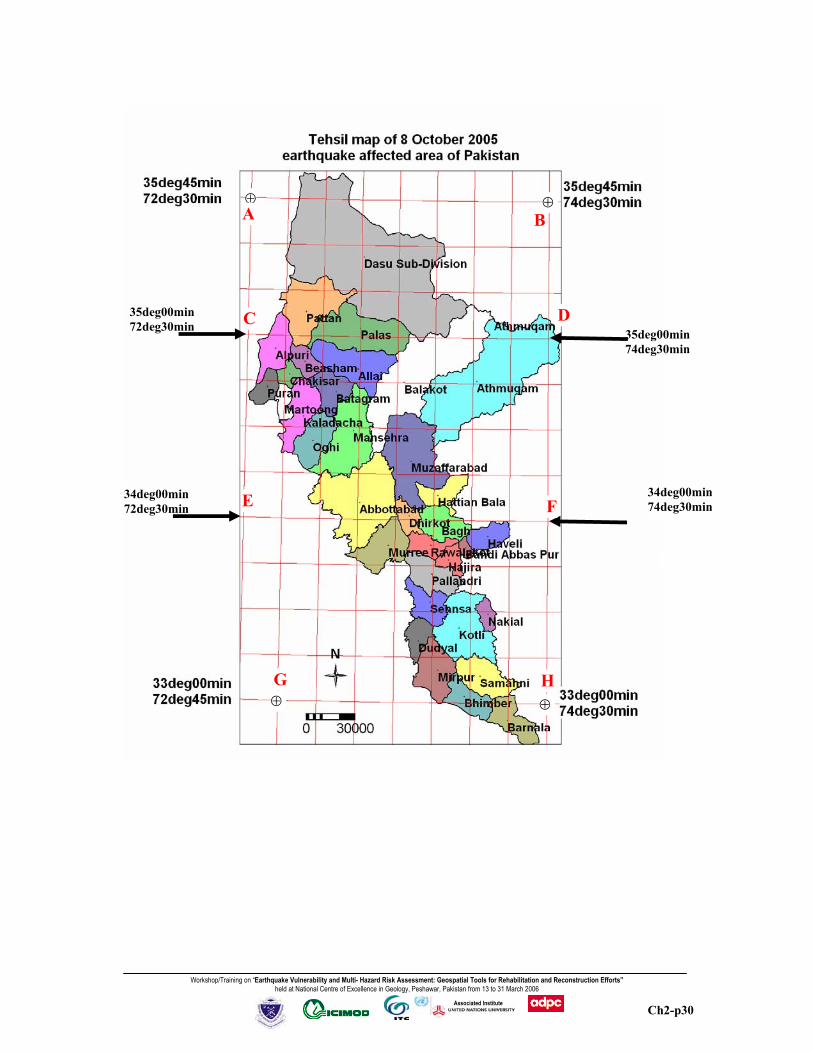
1.1 MAP COORDINATE SYSTEM Before you start digitizing, you should know the coordinate system of the topographic maps. There are several topographic maps of Pakistan is available. For this exercise you will be using map covering some of Tehsils (a level of administrative unit smaller than district level) of earthquake affected areas of northern Pakistan. The source of the map is not known. The projection parameters and the map extent of the maps are known and we will be using that parameter as follows:
− Projection: UTM
− Ellipsoid: WGS84
− Datum: WGS84
− Zone: 43
− Hemisphere: Northern (N)
− Minimum X: 231755.000
− Minimum Y: 3651647.000
− Maximum X: 498575.000
− Maximum Y: 3981467.000
− [Ellipsoid parameters: a=6378137.000, 1/f=298.257223563]
Workshop/Training on “Earthquake Vulnerability and Multi- Hazard Risk Assessment: Geospatial Tools for Rehabilitation and Reconstruction Efforts” held at National Centre of Excellence in Geology, Peshawar, Pakistan from 13 to 31 March 2006
Ch2-p30
Associated Institute
⊕
⊕ ⊕
⊕
34deg00min74deg30min
35deg00min74deg30min
35deg00min 72deg30min
34deg00min 72deg30min
A B
C D
E F
G H

Workshop/Training on “Earthquake Vulnerability and Multi- Hazard Risk Assessment: Geospatial Tools for Rehabilitation and Reconstruction Efforts” held at National Centre of Excellence in Geology, Peshawar, Pakistan from 13 to 31 March 2006
Ch2-p31
Associated Institute
1.2 IMPORTING A SCANNED MAP INTO A RASTER MAP
The hard copy of topographic map can be scanned and saved in tiff or bmp format. The tiff or bmp format image is then imported in the Ilwis format and then geo-referenced which is provided to you for the exercise. (For importing the tiff or bmp file and geo-reference, please refer to the ILWIS User’s Guide manual.) To import the tiff or bmp format digital map into ILWIS, use the pulldown menu, File>Import>ViaGeoGateway and use option convert to ILWIS data format, give output name and show option. If the map imported from tiff or bmp format map on which you are going to digitized is not georeferenced, you have to georeference it first. You can find out by calculating the tie point values using ILWIS pull down menu Operations>Vector Operations>Coordinates>Transform Coordinates Select LatLongWGS84 as input Coordinate System, select utm43wgs84 for Output Coordinate System, enter the required values in Input Coordinate, and you will get values in Output Coordinate system which you can use it. The X and Y values for the points A, B, C, D, E, F, G, H, etc. in the provided map in the “utm43wgs84” coordinate system are: Tiepoints
LatLongWGS84 UTM43WGS84
Latitude Longitude X Y A 35deg45min 72deg30min 273948 3959102 B 35deg45min 74deg30min 454794 3956335 C 35deg00min 72deg30min 271845 3875899 D 35deg00min 74deg30min 454373 3873157 E 34deg00min 72deg30min 269102 3764973 F 34deg00min 74deg30min 453825 3762268 G 33deg00min 72deg45min 289792 3653535 H 33deg00min 74deg30min 453291 3651397

Workshop/Training on “Earthquake Vulnerability and Multi- Hazard Risk Assessment: Geospatial Tools for Rehabilitation and Reconstruction Efforts” held at National Centre of Excellence in Geology, Peshawar, Pakistan from 13 to 31 March 2006
Ch2-p32
Associated Institute
For GeoReferencing the imported scanned map, refer to exercise on Image Processing. For GeoReferencing : File> Create> GeoReference, give GeoReference Name tehsilmapfordigitization, choose GeoRef Tiepoints, select Coordinate System “utm43wgs84”, Background Map “tehsilmapfordigitization” the rastermap to be georeferencing. In the GeoReference Editer, enter the tiepoint values as given in the above table. After entering those eight tiepoints, you should reach the Sigma very close to 0 pixel. Close the GeoReference window. Now the raster scanned map “tehsilmapfordigitization” is ready to be used for digitizing segment maps.
Workshop/Training on “Earthquake Vulnerability and Multi- Hazard Risk Assessment: Geospatial Tools for Rehabilitation and Reconstruction Efforts” held at National Centre of Excellence in Geology, Peshawar, Pakistan from 13 to 31 March 2006
Ch2-p33
Associated Institute
1.3 DIGITIZATION The most common method of entering spatial data in ILWIS is digitizing. Features on a paper map or other analog documents (e.g. a photo-interpretation on a piece of tracing film) can be digitized. This can be done using a device called a digitizing tablet, or digitizing table, or simply digitizer. A digitizer contains a pointing device (digitizer cursor) to trace spatial features. The position of the digitizer cursor is registered electronically to a precision of fractions of a millimeter. This is done through a fine grid of wires embedded in the digitizer. In these days the wide availability of hardware and software as well as the high capacity of hardware and advanced software made screen digitizing more popular and reliable.
This section explains how to digitize in the screen from the scanned maps.
Before you start with the exercises, you should start up ILWIS and change to the subdirectory \ EVMHRAGTRRE\Chapter2, where the data files is stored.
• Double-click the ILWIS program icon on the desktop. • Use The Navigator to go to the working directory
\EVMHRAGTRRE\Chapter2. Digitizing a segment map
Before you continue with digitizing a segment map, it may be good to explain first a little about how points, segments and polygons are digitized. Points, segments and polygons are three types of spatial features used in ILWIS. An individual point is defined by a pair of X and Y coordinates. A segment is composed of a series of intermediate points, connected by straight lines, with a starting and ending node. A polygon is a closed area consisting of one or more segments. All segments forming a polygon have to be connected at intersections. Each intersection or end connection of segments has a node (figure 2.1). When you digitize a polygon, the boundary lines of this polygon should be connected. The connection of one line to another is called snapping. Snapping always takes place at a node (the end of a line). Snapping is needed for polygons, and for segment maps that represent a network (e.g. a drainage network, or a road network). Snapping is not required for other segment maps, such as a contour map. When you digitize a contour map, you can only snap lines that have equal altitude.

Workshop/Training on “Earthquake Vulnerability and Multi- Hazard Risk Assessment: Geospatial Tools for Rehabilitation and Reconstruction Efforts” held at National Centre of Excellence in Geology, Peshawar, Pakistan from 13 to 31 March 2006
Ch2-p34
Associated Institute
Intermediate point
a node
A polygon
a point
a segment
You can digitize a line, by holding down the cursor button and simultaneously moving the cursor on the line (digitizing in stream mode). The line coordinates are recorded at regular time intervals. The disadvantage is that many points are needed to define the segment. Many of these points do not improve the accuracy of the line and are considered redundant.
You can also digitize a line, by pressing the cursor button only when a point in the segment needs to be digitized (digitizing in point mode). In this way coordinates are only recorded if the button is pressed. The number of points used to store a segment depends on the complexity of the line, and on the accuracy of the person digitizing.
To reduce the number of coordinates defining a segment, a data reduction procedure called tunneling is carried out automatically (Figure 2.2). The necessity of each coordinate is evaluated by connecting the adjacent coordinates by a line or tunnel with a pre-defined width. When the evaluated coordinate lies inside the tunnel, it is considered redundant, and is removed. If it lies outside the tunnel, it is kept and the same operation is carried out for the next coordinate. In this exercise, a segment map which contains information about the Tehsil boundary will be created.
If you chose the option Class in the Domain type Domain Class will open, it is possible to write the names of the domain items in the domain editor directly in case of Class domain. You will, however, create the names in case of class domain during digitizing.
Figure 2.1: Presentation of points, segments and polygons in ILWIS

Workshop/Training on “Earthquake Vulnerability and Multi- Hazard Risk Assessment: Geospatial Tools for Rehabilitation and Reconstruction Efforts” held at National Centre of Excellence in Geology, Peshawar, Pakistan from 13 to 31 March 2006
Ch2-p35
Associated Institute
Tunnel width = 2.5
a
b
digitized segment
Tunnel width = 3.5
dc
dcb
a
dcb
a
dcb
a
dc
a
phase 1 phase 2
phase 1 phase 2
Figure 2.2: The process of tunneling using two different tunnel widths. See text for explanation Close the Domain Class. You are back in the Create Segment map dialog box. Click OK. The Display Options- Segment Map dialog box is opened. Click OK.
The Segment Editor and the Add Segments command box are opened. The Segment Editor works in Select Mode, Move Points Mode, Split/Merge and Insert Mode.
The Add Segment command window shows the position of the digitizer cursor and the commands. The commands in this window are:
Zoom in Before you start digitizing a part of the map, we recommend you to zoom in on that area, so that you can digitize as detailed as possible. This is especially important when you are going to connect segments. You can zoom in by using the mouse pointer. In that case, click the Zoom in button and define the area you want to zoom in.
Digitizing segments In each segment has a value code. This is only used here so that we can explain better how to digitize. To digitize the line segment:

Workshop/Training on “Earthquake Vulnerability and Multi- Hazard Risk Assessment: Geospatial Tools for Rehabilitation and Reconstruction Efforts” held at National Centre of Excellence in Geology, Peshawar, Pakistan from 13 to 31 March 2006
Ch2-p36
Associated Institute
The Edit code dialog box is opened. In this box you can type the value to enter a new value for the digitized segment or for the segment, which will be digitized. Here the values are entered. In case of Class domain, name, a code and a color for the digitized segment can be entered. The colors defined here will be used to display the segments in the map window. It is optional to give codes to segments.
You digitize different lines for different features like administrative boundary drainage, road, ridges, etc you have to decide to give different code values with good logic so that it of useful in the later phases of data management and analysis.
! In case of Class Domain, it is advised to enter codes (letters or numbers), especially, when the class names are long and you intend to use the map for further MapCalc operations. The codes can be used in the map calculation formula instead of the class names.
Screen Digitize
Screen digitizing is the process of creating and/or editing a segment or point map while an existing raster map is displayed as a background in a map window. The raster map can be for instance a band of a satellite image, a color composite, a scanned map, or a scanned photograph. By using the mouse, you can directly digitize elements of interest on the background map. The background map should be georeferenced first, for this, please go through the section 4.4 Geometric corrections and image referencing.
Before digitizing a segment map, to assign domain as value or unique ID of the segment, it is necessary to understand what and why (purpose of the data development) you are entering the data.
1. Display the background map:
From the File menu in the Map window Select Create and choose Segment Map or Point Map. The Create Segment Map or the Create Point Map dialog box appears. Type a map name, specify a domain and optionally type a description. Accept the coordinate system and map boundaries, which are already filled out.
To edit an existing segment or point map, choose the Edit Other Map command from the Edit menu of the map window, then select the desired editor and select a map.
The Segment editor or the Point editor is opened. You can now add, edit and delete segments or points by using the mouse as usual.
Workshop/Training on “Earthquake Vulnerability and Multi- Hazard Risk Assessment: Geospatial Tools for Rehabilitation and Reconstruction Efforts” held at National Centre of Excellence in Geology, Peshawar, Pakistan from 13 to 31 March 2006
Ch2-p37
Associated Institute
When your background map uses a georef direct linear, you may see that an edited segment or point does not exactly appear at the position of the pencil pointer: this is a measure of the quality of your georeference in the area. Errors will usually be larger along the edges of a photograph.
• When the deviation is small, your georeference is good enough
• When the deviation is large, you can check the number, even distribution and quality of the tiepoints in your georeference, the quality of your DTM, etc.;
! Before screen digitizing please go through the Geometric corrections and image referencing.
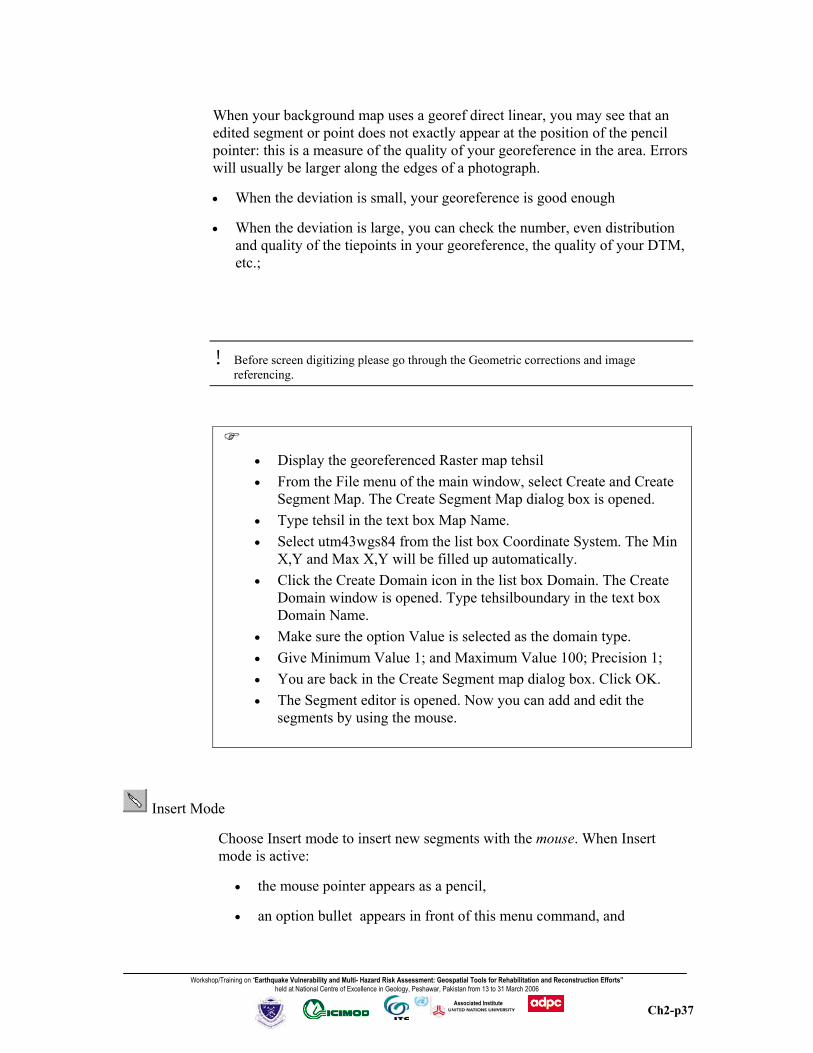
• Display the georeferenced Raster map tehsil • From the File menu of the main window, select Create and Create
Segment Map. The Create Segment Map dialog box is opened. • Type tehsil in the text box Map Name. • Select utm43wgs84 from the list box Coordinate System. The Min
X,Y and Max X,Y will be filled up automatically. • Click the Create Domain icon in the list box Domain. The Create
Domain window is opened. Type tehsilboundary in the text box Domain Name.
• Make sure the option Value is selected as the domain type. • Give Minimum Value 1; and Maximum Value 100; Precision 1; • You are back in the Create Segment map dialog box. Click OK. • The Segment editor is opened. Now you can add and edit the
segments by using the mouse.
Insert Mode
Choose Insert mode to insert new segments with the mouse. When Insert mode is active:
• the mouse pointer appears as a pencil,
• an option bullet appears in front of this menu command, and

Workshop/Training on “Earthquake Vulnerability and Multi- Hazard Risk Assessment: Geospatial Tools for Rehabilitation and Reconstruction Efforts” held at National Centre of Excellence in Geology, Peshawar, Pakistan from 13 to 31 March 2006
Ch2-p38
Associated Institute
• the Insert mode button in the toolbar appears down.
! Tips:
• In Insert mode, you can use AutoSnap. When Autosnap is active, the system automatically snaps to nodes and splits when necessary, i.e. there is less need to use the Shift or Ctrl keys as described below. You can turn Autosnap on and specify a snap tolerance in the Segment editor : Customize dialog box.
• During the insertion of segments by mouse (but also when using the digitizer), automatic tunneling is applied to reduce the amount of coordinates that need to be stored in the segment map. The so-called tunnel tolerance can be specified in the Customize dialog box of the segment editor (File menu).
After you finished inserting a new segment, an Insert/Edit dialog box will usually appear asking for the class name, ID, or value of the new segment.
To insert a new segment:
• position the mouse pointer on the location where you want to start a new segment;
• press the left mouse button to start the segment (begin node);
• hold the left mouse button down and move the mouse to automatically insert segment coordinates (stream mode), or
• click at the positions at which you want to insert intermediate points;
• double-click or press the space bar to end the segment with a loose end (end node).
• Zoom in on the part of the map where you want to digitize. It is
always recommended to digitize with higher zoom in the area you are digitizing.
• Select Insert Mode (Pen Tool). The cursor change into (Pen).
Workshop/Training on “Earthquake Vulnerability and Multi- Hazard Risk Assessment: Geospatial Tools for Rehabilitation and Reconstruction Efforts” held at National Centre of Excellence in Geology, Peshawar, Pakistan from 13 to 31 March 2006
Ch2-p39
Associated Institute
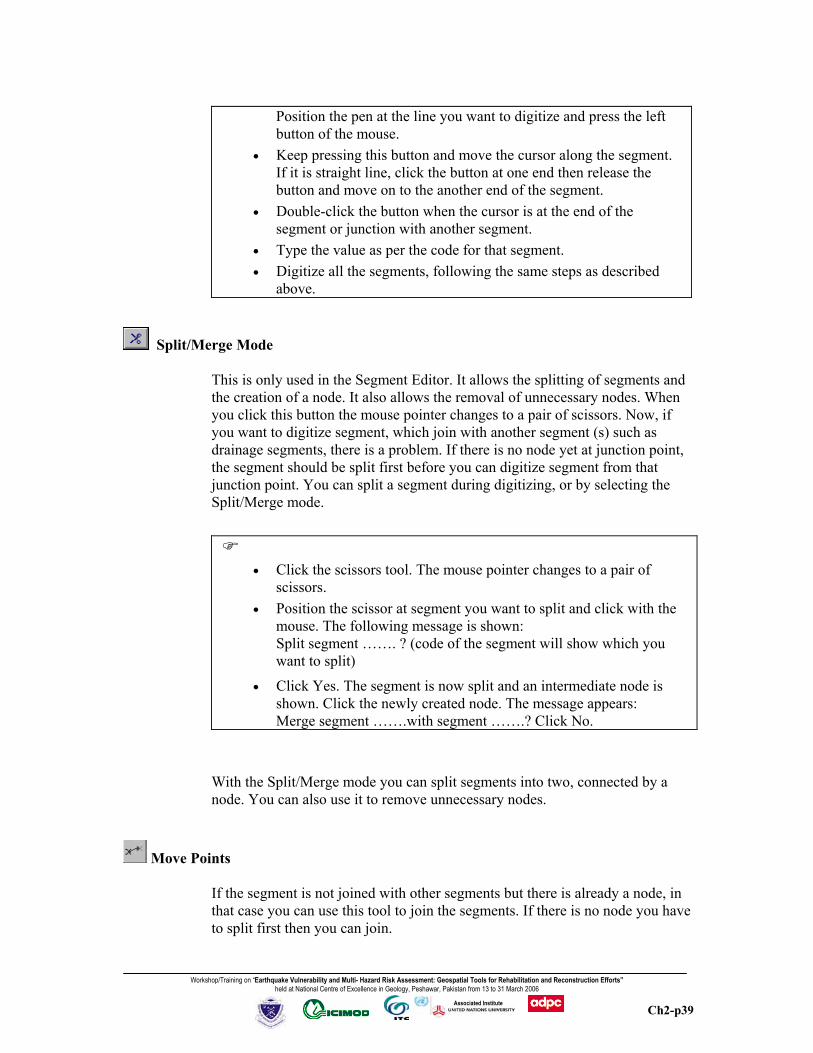
Position the pen at the line you want to digitize and press the left button of the mouse.
• Keep pressing this button and move the cursor along the segment. If it is straight line, click the button at one end then release the button and move on to the another end of the segment.
• Double-click the button when the cursor is at the end of the segment or junction with another segment.
• Type the value as per the code for that segment. • Digitize all the segments, following the same steps as described
above.
Split/Merge Mode
This is only used in the Segment Editor. It allows the splitting of segments and the creation of a node. It also allows the removal of unnecessary nodes. When you click this button the mouse pointer changes to a pair of scissors. Now, if you want to digitize segment, which join with another segment (s) such as drainage segments, there is a problem. If there is no node yet at junction point, the segment should be split first before you can digitize segment from that junction point. You can split a segment during digitizing, or by selecting the Split/Merge mode.
• Click the scissors tool. The mouse pointer changes to a pair of
scissors. • Position the scissor at segment you want to split and click with the
mouse. The following message is shown: Split segment ……. ? (code of the segment will show which you
want to split)
• Click Yes. The segment is now split and an intermediate node is shown. Click the newly created node. The message appears: Merge segment …….with segment …….? Click No.
With the Split/Merge mode you can split segments into two, connected by a node. You can also use it to remove unnecessary nodes.
Move Points
If the segment is not joined with other segments but there is already a node, in that case you can use this tool to join the segments. If there is no node you have to split first then you can join.

Workshop/Training on “Earthquake Vulnerability and Multi- Hazard Risk Assessment: Geospatial Tools for Rehabilitation and Reconstruction Efforts” held at National Centre of Excellence in Geology, Peshawar, Pakistan from 13 to 31 March 2006
Ch2-p40
Associated Institute
• Click the Move Point tool. The mouse pointer changes to a
tweezers. • Position the tweezers at the square, which you want to move the
segment and press button. • Click the tweezers tool at the end of the segment, which is
represented as a small square. If the segment is selected the segment color changes, then drag the square and drop where you want to snap it. If it is connected there will be only one square.
Select Mode You might have to change the code values of the segments or delete the segments you have digitized, which might be necessary due to mistakes in entry of code value while digitizing.
• Press the Select Mode button (Hand tool) with the mouse pointer. • Position the mouse pointer on one of the segment for example
drainage and click the mouse to select it. • Press the Shift key and put the mouse pointer on another drainage
segment and select it. This way you can select multiple drainage segments. You can use Delete button of the Keyboard to delete it.
• If you have to change the code value, click the right mouse button, to open the Context-sensitive menu and select Edit. The Edit dialog box is opened.
• Check whether the code value you have entered is correct, if not so, type the correct code values for those segments according to your code value you have developed.
• Click OK or Press Enter when OK is selected. The code value of the segments can also be changed by double-clicking the segment.
• Double-click one of the segment you have digitized (Tehsil
boundary line). • The code value of the selected segment will appear. And you can

Workshop/Training on “Earthquake Vulnerability and Multi- Hazard Risk Assessment: Geospatial Tools for Rehabilitation and Reconstruction Efforts” held at National Centre of Excellence in Geology, Peshawar, Pakistan from 13 to 31 March 2006
Ch2-p41
Associated Institute
correct it if your earlier entered value is wrong and press Enter. As you have seen, the connection of one segment to another is done via snapping. This is to ensure that the segments are linked precisely through the nodes. Snapping only succeeds if a point exists within the snapping tolerance distance. A beep warns if this is not the case. Reposition the cursor near the point you want to snap and try again. The snap command only functions when you snap to the starting or ending point of a segment. To snap to an intermediate point, the segment has to be split and then snapped. The snap tolerance is a distance within which the program will accept a node to snap to it. You can define the snap tolerance yourself in the Customize Segment Editor dialog box.
• From the File menu of the map window, select Customize. The
Customize Segment Editor dialog box is opened. • You can do practice by reducing Snap tolerance and Tunnel
tolerance by10 times.
Within the Customize Segment Editor dialog box you can see that the default value for the snap tolerance is 510 meters. This means that if you want to connect two segments, and the cursor is less than 510 meters from a node, this node will be used to connect the two segments. The snap tolerance is defined by the system when you start the Segment Editor, based on the coordinate boundaries (and the scale) of your map. The user may enter another value if needed. A large value for the snap tolerance will make the map less accurate. A very small value for the snap tolerance will make the digitizing difficult, since you have to zoom in a lot before you can snap.
Note also another value in the Customize Segment Editor: The tunnel tolerance. This value (in this case 51) defines the width of corridor between the first and last of three points (see Figure 2.2). If the second point falls within this corridor, it will not be used as intermediate point, and therefore not stored. If it falls outside of the corridor, it will be used as intermediate point. So by selecting the tunnel tolerance you can influence the detail of the lines that you digitize. If you increase the tunnel tolerance, the segments will be digitized rather coarsely, with only a few intermediate points. If you make the tunnel tolerance very small, many intermediate points will be stored and the size of your segment map will become large. Note also that the default setting for AutoSnap in the Customize Segment Editor is: Selected. This means that when you end a segment with the mouse, the system will automatically try to snap it.

Workshop/Training on “Earthquake Vulnerability and Multi- Hazard Risk Assessment: Geospatial Tools for Rehabilitation and Reconstruction Efforts” held at National Centre of Excellence in Geology, Peshawar, Pakistan from 13 to 31 March 2006
Ch2-p42
Associated Institute
Now you will practice some more with snapping segments.
• Click OK in the Customize Segment Editor dialog box. • Edit rest of the segments, snap or split and snap them where
necessary. To codify the segments, follow your legend. You can also use Move point mode to correctly snap nodes.
• If there are several segments junction at same node and one of them is wrong.
• Zoom in on the area around node you want to move. • Choose the correct one. • Pick it up from the tweezers tool. • Drag and drop it to the correct node of the segment. It will appear
as a single quadrangle.
Deleting a segment An incorrectly digitized segment can be deleted. Suppose any segment was incorrectly digitized, and you want to delete it:
• Zoom in on the area of that segment which was incorrectly
digitized and you want to delete. • Choose with the mouse pointer the Select Mode. Select that
segment. • Click Delete on the Key board
A deleted segment can be undeleted. If the some segment was deleted by mistake and you want to undelete it:
• Click on the edit menu and select Undelete segments • The deleted segments will be displayed in the map window with a
different color. Select the segment is enough to undelete it. • Click on the Edit menu again and deselect Undelete Segments.

Workshop/Training on “Earthquake Vulnerability and Multi- Hazard Risk Assessment: Geospatial Tools for Rehabilitation and Reconstruction Efforts” held at National Centre of Excellence in Geology, Peshawar, Pakistan from 13 to 31 March 2006
Ch2-p43
Associated Institute
Deleted segments are shown in a different color, which can be changed in the Customize Segment Editor dialog box. If you want to remove the deleted segments completely, you can select the option Pack from the File menu.
Displaying segments in different colors If you are digitizing several types of segments like administrative boundary, drainage line, road, etc. with different values, you can quickly see how many classes exist in a segment map, by displaying the segments in different colors or in the colors defined in a Representation.
• Give one each segment with values 1,2,3,4. • Open the Context-sensitive menu in the map window by clicking
the right mouse button, and select Customize. The Customize Segment Editor dialog box is opened. From this box you can choose to display the segments in Normal color, colors defined in the representation (Domain), or in primary colors. It will be easy to edit the code values, when the segments display one color for one value.
• Select Primary colors from this box. Click OK.
• If you are done, click the (Exit Editor). The segment map is displayed. The segment map is automatically saved. Close the map window.
• Give the correct values for all the segments you have changed
earlier.
The final part of segment digitizing is the checking of the segments. The items that are checked are intersections of lines without a node, dead ends in segments, self overlapping segments and consistency of the codes.
Digitizing a point map

Workshop/Training on “Earthquake Vulnerability and Multi- Hazard Risk Assessment: Geospatial Tools for Rehabilitation and Reconstruction Efforts” held at National Centre of Excellence in Geology, Peshawar, Pakistan from 13 to 31 March 2006
Ch2-p44
Associated Institute
Now you will create a point map called tehsil. The points in the map show the location of the tehsils in the map, which will be used as the ID for the polygon of tehsils to be created from the segment map.
• Open the tehsil segment map with the background rastermap
tehsil from which you have digitized tehsil administrative boundary segments.
• From the File menu of the Map window, select Create and Create Point Map. The Create Point Map dialog box is opened.
• Type tehsil in the text box Map Name. • Type for the Description: Points indicating the ID of the tehsil • Accept the Coordinate system and extension of Min X,Y and
Max X, Y • Click the Create button next to the Domain list box. The Create
Domain dialog box is opened. • Type tehsil in the Domain Name. • Select the option Identifier • Type 100 in the Nr of items (Tentative number of tehsils, or
maximum number of tehsils), and Tehsil_ in the Prefix. It is not necessary to put the Prefix. Since the Tehsil names does not repeat it is unique ID. We can choose class domain only for the objects which does repeat at different places within the map such as land cover types, geological units, etc.
• Click OK. The Domain Identifier is opened.
As explained in the previous section, service objects such as a Domain and a Coordinate System, are needed to create a map (data object). A list of IDs or classes, or the value ranges and the precision used to codify elements in a map, are defined in a Domain. The domain contains all possible names or values that may occur in a map. For more information about domains, see in the Help using search option. The domain type Identifier (ID) is selected for this point map, because each point in the map is identified by a unique number. Selecting the domain type Identifier, a text box with the default value 0 appears. Optionally, you can use the text box to define the number of items in the domain. It is also possible to give each item a prefix (e.g. nr, or point or Tehsil_). The editor can be used to add, change or delete items in the domain. When you digitize you can either:

Workshop/Training on “Earthquake Vulnerability and Multi- Hazard Risk Assessment: Geospatial Tools for Rehabilitation and Reconstruction Efforts” held at National Centre of Excellence in Geology, Peshawar, Pakistan from 13 to 31 March 2006
Ch2-p45
Associated Institute
First describe all domain items before you digitize, or; Define the domain items while you digitize. The point IDs will be entered during digitizing.
• Close the Domain Identifier. You are now back in the Create Point Map dialog box.
Note that the domain tehsil, which you just created, is indicated in the list box Domain.
• Click OK in the Create Point Map dialog box. The Point Editor is
opened.
The Point Editor window is opened over the Segment map. The Point Editor windows consists same as the segment editor window:
Button : Select point : Allows you to select the point to delete.
Button : Move point: Allows you to move a point.
Button : Insert point: For digitizing a new point.
Button : Exit Edit : Allows you to Exit from the Edit mode and saves the file automatically.
The following buttons on the button bar of an ILWIS Editor window are shortcuts to select different modes and to exit the Editor: Select Mode: this allows selection of one or more existing features (points, segments, polygons or pixels) in the Editor. When you click the Select Mode button the mouse cursor appears as a little hand. In this mode you can select a feature by clicking it. Move Point Mode: this allows you to select a point (or a point within a segment) and drag it to a new position. When you click the Move Point Mode button, the mouse pointer appears as a pair of little tweezers.

Workshop/Training on “Earthquake Vulnerability and Multi- Hazard Risk Assessment: Geospatial Tools for Rehabilitation and Reconstruction Efforts” held at National Centre of Excellence in Geology, Peshawar, Pakistan from 13 to 31 March 2006
Ch2-p46
Associated Institute
Insert Mode: this allows you to insert new features. When in the Insert Mode, the mouse cursor appears like a little pencil. Exit the Editor: used to exit the Editor.
Digitizing points
The Point Editor works in the Select, Move Point and Insert Modes. Before digitizing the points in the point map of the Tehsils it is suggested to print the Tehsil segment map, which you had screen digitized. Put names/numbers in the Tehsils.
• Select the Insert Mode, so that the mouse cursor appears like a little
pencil • Position the pencil at the Teshil you want to give name and press the
left button of the mouse • A small box is opened at the digitized point. Type the name of the
Tehsil in this box and press Enter. • Digitize the rest of the points and label them as required.
Editing a point
The label (ID) of a point can be edited or changed if incorrectly entered. To edit or change the label of a point: When you enter the label Abbottabad for the point Bagh which is already entered there earlier for actual point Abbottabad, the Point Editor message box is opened indicating that the label Abbottabad is used for another point. Although the Identifier domain allows for duplicate names, it is not very logical to have two points in an ID domain with the same name. To enter the correct label for this point:
• Double click the wrong number so that a small box with number will appear and enter a new number for this point
• and Enter. Moving a point

Workshop/Training on “Earthquake Vulnerability and Multi- Hazard Risk Assessment: Geospatial Tools for Rehabilitation and Reconstruction Efforts” held at National Centre of Excellence in Geology, Peshawar, Pakistan from 13 to 31 March 2006
Ch2-p47
Associated Institute
During digitization points were incorrectly entered, they can be repositioned afterwards.
• Select Move Points tool , the cursor of the mouse change to a small tweezers.
• Pick the point by the tweezers by pressing the left button of the mouse. Buy pressing the button drag the point and drop in the proper position.
Deleting a point
• Choose with the mouse the Select Mode • Put the mouse pointer on point you want to delete and select it. • Press the right mouse button to open the Context-sensitive menu
and select Delete. You can also press the Delete key on the keyboard.
• Click Yes in the opened Point Editor message box to confirm. • Digitize the point you want again in the right position and rest of all
the points.
Multiple points can be selected by pressing the Shift, or the Ctrl key while you select more points. The digitizing of points is now finished, so you can exit the Point Editor.
• Click the Exit button in the button bar. • The point map is displayed. The point map is automatically saved. • Close the map window.
Creating a polygon map
Now you will see how to create a polygon map. A polygon map can be created using the following steps: − Digitizing the boundaries of the polygons as segments in the Segment
Editor;
− Checking the segments in the Segment Editor;
− Digitizing the labels of the polygons as a point map in the Point Editor;

Workshop/Training on “Earthquake Vulnerability and Multi- Hazard Risk Assessment: Geospatial Tools for Rehabilitation and Reconstruction Efforts” held at National Centre of Excellence in Geology, Peshawar, Pakistan from 13 to 31 March 2006
Ch2-p48
Associated Institute
− Polygonizing the segments using the point map as labels in the Segment Editor.
The digitizing of segments is not treated here anymore. This was already explained in the earlier section. You will start with a segment map that might contain a number of errors, which will be detected and corrected during the checking of the segments.
• Click the segment map tehsil with the right mouse button and select
Edit from the context-sensitive menu. • The segment Editor: map is displayed in the map window.
The Segment Editor and the Add Segments command box are opened.
Checking segments
After the segments in the map are connected by snapping, you can check whether this has been done correctly. The most important errors that may occur during digitizing are shown in Figure 2.4: − Dead end in segment. The segment is not connected to another segment.
This is shown in example 1.
− Intersection without node. The segment overlays another segment without a node. Several examples are shown in 2 and 3.
− The same segment is digitized twice. This may happen in large files, or in files you obtain from someone else.
− Self Overlap. The segment crosses itself.
Figure 2.4: Different types of digitizing errors that are detected during the checking of segments. See text for explanation

Workshop/Training on “Earthquake Vulnerability and Multi- Hazard Risk Assessment: Geospatial Tools for Rehabilitation and Reconstruction Efforts” held at National Centre of Excellence in Geology, Peshawar, Pakistan from 13 to 31 March 2006
Ch2-p49
Associated Institute
Before the map can be polygonized it should be checked whether the segments have been digitized in an appropriate way. This check is done using the option Check Segments from the File menu of the Segment Editor map window. It can also be done when you select the option Polygonize from the File menu.
• From the File menu of the map window, select Check Segment and
Self Overlap. The Check Segments dialog box is opened. Click OK.
• The map is now checked for segments that overlap themselves. The program checks and will give an error message: Zoom in on error? Click Yes.
• Segment … (code value) crosses itself. Remove false polygon?
• Click No. • Split Segment….. (code value). Click No. • Zoom in on the part where the error occurs, indicated with a red
box. The situation might be as shown in figure 5 (a). As you can see the segment crosses itself. To correct it automatically, there are two possibilities: − Remove the false polygon (shown in figure 2.5 (b)).
− Split the segment (shown in figure 2.5 (c)).
Figure 2.5: An example of Self overlap error. A: Original situation showing the overlap. B: Situation after automatic removal of false polygon. C: Situation after automatic splitting segments

Workshop/Training on “Earthquake Vulnerability and Multi- Hazard Risk Assessment: Geospatial Tools for Rehabilitation and Reconstruction Efforts” held at National Centre of Excellence in Geology, Peshawar, Pakistan from 13 to 31 March 2006
Ch2-p50
Associated Institute
• Correct the segment. • From the File menu of the map window, select again Check
Segment and Self Overlap. The Check Segments dialog box is opened. Click OK.
• The program will give an error message: Zoom in on error? Click Yes.
• Segment …(code value) crosses itself. Remove false polygon? . • Click No. • Split the Segment (code value) Click No. • If the red box is not visible. Redraw the map window and zoom in
on the area with the red box. Compare the result with your map. Check that there is an error.
It is in general not advisable to use the automatic editing options (such as Remove false polygon, or Split Segment), since this may lead to many small polygons (if you use the Split segment option), or to unwanted generalization of the segment (if you use the Remove false polygon option). Instead it is often better to edit the error manually using the Move Point Mode.
• Again from the File menu in the map window, select Check Segment and Self Overlap. The Check Segments dialog box is opened.
• Select the check box Start at Number. The number of the last checked segment is shown. Click OK. The checking is resumed.
• The map is now checking further on segments that overlap themselves. The program checks and will give an error message: Zoom in on error? Click Yes.
• Segment …. crosses itself. Remove false polygon? now again for the same point.
• If you click No. Now the message: Split segment ………? appears. • Click No. The editor changes to the Move Points mode and the
place of the error is indicated by a small quadrangle. • Zoom in on the area around that point and use the mouse pointer,
that is now in the form of little tweezers, to move the intermediate points of the segment, until they no longer overlap. Click the Entire map button when finished.
• Continues the procedure to check the segments which have self overlap until you made the corrections well, no other self overlapping segments are found. The segment Editor dialog box

Workshop/Training on “Earthquake Vulnerability and Multi- Hazard Risk Assessment: Geospatial Tools for Rehabilitation and Reconstruction Efforts” held at National Centre of Excellence in Geology, Peshawar, Pakistan from 13 to 31 March 2006
Ch2-p51
Associated Institute
shows OK: Segments are not overlapping themselves. Click OK.
The next check that will be made is on dead ends in segments (see Figure 2.6) for those segments only which are useful for making map. You have to use the option mask while check segment.
• From the File menu in the map window, select Check Segments and Dead Ends. The Check Segments dialog box is opened.
• Select the Mask option, and type in the text box the segment code values required for making polygon map (your code values of segment lines which will be used for making polygon).
• Click OK. The map is now checked for segments that are not connected to others (dead ends). An error message will appear: Dead end in segment …... . Zoom in or error dialog box appears. The location of the point is indicated by a red box, when there is dead end.
• Click Yes and the editor changes to the Move Points mode. • Zoom in on the quadrangle near that point in the map. Pick the end
of the segment and move it so that it connects with the other one. • Display the entire map. • From the File menu in the map window, select Check Segments
and Dead Ends. The Check Segments dialog box is opened. • Select the check box Start at Number. The number of the last
checked segment is shown. Click OK. The checking is resumed. If again an error are found, correct them.
Figure 2.6: An example of Dead ends in segments.
• You can have situation that there are some segments necessary to
join at a point but are not properly connected. In such situation you

Workshop/Training on “Earthquake Vulnerability and Multi- Hazard Risk Assessment: Geospatial Tools for Rehabilitation and Reconstruction Efforts” held at National Centre of Excellence in Geology, Peshawar, Pakistan from 13 to 31 March 2006
Ch2-p52
Associated Institute
have to correct it. • Zoom in on the area and use the mouse pointer to move the nodes
of the segments until they connect. Click the Entire map button when finished.
• From the File menu of the map window, select Check Segments and Dead Ends. The Check Segments dialog box is opened. Use Mask option.
• Select the check box Start at Number. The number of the last checked segment is shown. Click OK. The checking is resumed. Again an error message will appear, if there are dead ends.
• Correct the error at those points and resume checking dead ends. Continue checking dead ends until no more error messages appear. The segment Editor dialog box shows OK: No segments found with dead ends. Click OK.
An example of intersections without nodes (see Figure 2.7 A and B).
• Display the entire map. • From the File menu of the map window, select Check Segments
and Intersections. The Check Segments dialog box is opened. Click OK. The map is now checked for segments that are intersecting without a node.
• An error message will appear: Intersection without node in segment ….. Split segment? In a location where there is intersection of segment without node.
• Click No and zoom in on the area.
Figure 2.7: An example of Intersection without node. A: Original situation. B: Situation after automatic correction

Workshop/Training on “Earthquake Vulnerability and Multi- Hazard Risk Assessment: Geospatial Tools for Rehabilitation and Reconstruction Efforts” held at National Centre of Excellence in Geology, Peshawar, Pakistan from 13 to 31 March 2006
Ch2-p53
Associated Institute
• From the File menu in the map window, select again Check
Segments and Intersections. Click OK. • An error message will appear: Intersection without node in segment
…. Split segment? Referring again to the same location point. Don’t accept automatic correction and select No.
The automatic correction will result as shown in Figure 2.7 (b). As you can see, it is not always advisable to use the automatic editing option since this may lead to many small polygons. Instead it is often better to edit the error manually using the Move Point Mode.
• Display the entire map. • Zoom in on the area around the point where you have to edit
and use the mouse pointer to move the nodes of the segments so that the two segments no longer intersect. Click the Entire map button when finished.
• From the File menu in the map window, select Check Segments and Intersections. The Check Segments dialog box is opened. Select the check box Start at Number. The number of the last checked segment is shown. Click OK. If you corrected the previous errors well, no more errors are found with the Segment Editor dialog box with OK: No intersections found without nodes. Click OK.
There is one more option to check segments: Code consistency. This is useful only in situations where you want only segments with the same code to be connected. For example, in the case of contour lines, where only lines with the same altitude code should be connected. In the example of the segment map Soi_rol this is not a useful option, since several code values can join at same node.
The segments of the map tehsil are now error free, and you can proceed with the creation of the polygon map.
Creating the polygon map
When you create a polygon map, the best procedure is to digitize the boundary lines of the segments in a segment map, and the labels or names of the polygons as points in a point map. Now you will digitize a point map, containing the identifier of the glaciers in the map for glaciers. Now that the segments are checked and you have a label point file, you can proceed with the polygonization.

Workshop/Training on “Earthquake Vulnerability and Multi- Hazard Risk Assessment: Geospatial Tools for Rehabilitation and Reconstruction Efforts” held at National Centre of Excellence in Geology, Peshawar, Pakistan from 13 to 31 March 2006
Ch2-p54
Associated Institute
• Activate the Segment Editor of the map tehsil. • From the File menu in the map window, select Polygonize. The
Polygonize Segment Map dialog box is opened. • Mask values of the segments you want to use to make polygon
map. The Topology box should be selected. At this point you have the possibility to polygonize the map using a point map with labels (containing the name of the polygons), to use a domain, or to Auto identify the polygons (in which default names will be assigned to the polygons).
• Select the option Label points and select the point map tehsil. • Type tehsil for Output polygon Map, if it is not automatically
filled. • Type: Polygon map of Tehsil for Description. Select Show and
click OK. The segments are checked again and the map is now polygonized. The Display Options - Polygon Map dialog box is opened.
• Click OK. The polygon map is shown. Click the units to find out their names.
• Activate the Segment Editor, displaying the segment map tehsil and click the Exit Editor button. The segment map is shown. Close the segment map tehsil. Close also the polygon map tehsil.
The polygon map is now created. The last step is to edit the polygons. If you have to edit the polygon map, in order to be able to edit it, you should first break the dependency link between the polygon map tehsil and the segment map tehsil.
• Click polygon map tehsil with the right mouse button and select
Properties from the Context-sensitive menu. The Properties dialog box is opened. Click the Dependency then Break Dependency Link button and confirm with Yes.
• Click polygon map tehsil with the right mouse button and select Edit from the Context-sensitive menu. You can delete and rename the Polygon. Exit from the Polygon Editor and Close the Polygon Map.