chapter 2 status of regional integration in africa · chapter 2 status of regional integration in...
TRANSCRIPT
13
Chapter 2
Status of Regional Integration in Africa
This focuses on the major shifts in African regional in-tegration since ARIA VI, published in 2013.1 The chapter covers developments in trade, macroeconomic policy and financial integration, free movement of persons, in-frastructure integration, mining, agriculture, peace and security, and health.
Much of the quantitative analysis in this chapter is based on data collected for the Africa Regional Integration In-dex, a joint project between the African Development Bank, the African Union Commission and the Economic Commission for Africa (ECA). Full details on the index are available from the publication The Africa Regional Integration Index (edition I), and its website, from which the entire dataset of the index can be downloaded. The index is designed to measure African countries’ progress in meeting their commitments under Africa’s regional integration frameworks, such as Agenda 2063, the Trea-ty Establishing the African Economic Community (the Abuja Treaty) and the Boosting Intra-African Trade initi-ative of the African Union, among others. The indicators for the index include:
• Trade integration, including sub-dimensions on tar-iff liberalization and on trade facilitation and logis-tics.
• Productive integration (that is, integration into re-gional value chains).
• Macroeconomic policy convergence.
• Free movement of persons and labour markets, in-cluding sub-dimensions on implementation of free movement of persons protocols and on general measurement of movement of persons.
• Regional infrastructure and interconnections, in-cluding sub-dimensions on transport, energy and information and communications technology (ICT).
The review in this chapter largely tracks these dimen-sions.
During the period under review, Africa’s commitment to regional integration was tested by such challenges as the Ebola virus disease outbreak in some countries of West Africa, intensified terrorist activities in Somalia, Nigeria and Kenya, and conflicts in Burundi, the Central African Republic and South Sudan. The chapter shows that despite these challenges, African countries contin-ue to make progress in integrating their economies.
Trade integration
Trade integration plays a major role in enhancing struc-tural transformation and inclusive growth across the continent (ECA, 2015). All eight regional economic communities recognized by the African Union—AMU, the Community of Sahel-Saharan States (CEN-SAD), COMESA, EAC, ECCAS, ECOWAS, the Inter-Governmen-tal Authority on Development (IGAD) and SADC2—con-sider the free movement of goods and services to be a priority area for integrating their member countries. Trade is also included in the African Union Minimum In-tegration Programme (2009) and Agenda 2063 (2015), with free movement of goods and services and greater intra-African trade among the objectives.
This section examines trends in formal trade followed by a review of intra-African trade data and progress on liberalizing tariffs, on facilitating trade, and on remov-ing non-tariff barriers. It also briefly looks at regional value chains, at trade in services, and at Africa’s trade with the rest of the world.
Formal trade arrangements
Since ARIA VI, Africa’s regional economic communities have made further advances in liberalizing trade.
AMU
At the time of writing (October 2015), AMU has nearly concluded negotiations on the AMU Free Trade Area but still has to finalize provisions on rules of origin. Working groups from AMU member States are discussing how to harmonize national customs nomenclatures and proce-
14
dures, trade regulations and norms, and standards for goods and services. In December 2014, AMU Ministers of Trade created a working group on the Boosting In-tra-Africa Trade initiative and on AMU member States’ negotiations for the Continental Free Trade Area (AMU, 2015).
ECOWAS
The ECOWAS customs union, which came into force in January 2015, applies a common external tariff at the following rates:
• Zero per cent on essential social goods, covering 85 tariff lines.
• 5 per cent on goods of primary necessity, raw ma-terials, capital goods and specific inputs, covering around 2,100 tariff lines.
• 10 per cent on intermediate goods, covering around 1,400 tariff lines.
• 20 per cent on final consumer goods and goods not specified elsewhere, covering 2,200 tariff lines.
• 35 per cent on specific goods for economic devel-opment, covering 130 tariff lines (Kwakye, 2015; ECOWAS Commission, 2015a).
ECOWAS has created mechanisms to ensure that mem-ber States implement the common external tariff:
• A customs valuation mechanism, to ensure that all member States apply the same system of customs valuation.
• Regulations to ensure that inputs for the manufac-ture of zero-rated products do not face tariffs signif-icantly above those placed on the final product.
• Safeguard, trade, defence and anti-dumping meas-ures. These include supplementary protection measures allowing member States to deviate from the common external tariff for a maximum of 3 per cent of the tariff lines identified in it.
The ECOWAS Commission has built capacity in member States to help implement this tariff (ECOWAS Commis-sion, 2015a). By the end of April 2015, eight of ECOW-
AS’s 15 member States had begun (ECOWAS Commis-sion, 2015b).3
COMESA
As part of the conclusion of negotiations on the Tripar-tite Free Trade Area (box 2.1) between COMESA, EAC and SADC, the Democratic Republic of the Congo and Ethiopia committed to join COMESA’s Free Trade Area in the next three years.
Box 2.1.
The Tripartite Free Trade Area Agreement
A key advance was that representatives of most of the 26 member States of COMESA, EAC and SADC, with a combined GDP of $1.2 trillion in 2013 (UNC-TADStat, 2015), signed the Tripartite Free Trade Area Agreement on 10 June 2015 in Sharm-el-Sheikh, Egypt. It aims to liberalize 100 per cent of tariff lines (with general, specific and security exceptions). Six-ty to 85 per cent of tariff lines are to be liberalized upon entry into force of the Agreement, while the remaining 15 to 40 per cent will be negotiated over five to eight years. The Agreement has several other notable features:
• While tariff offers have not yet been finalized for all countries, the five members of EAC and five members of the Southern African Customs Un-ion, along with 10 members of COMESA, made tariff offers of 100 per cent liberalization on a re-ciprocal basis.
• Existing COMESA, EAC and SADC mechanisms for removing non-tariff barriers will be consolidated into a single mechanism.
• Rules of origin determine which products qualify for tariff preferences and will form a list of rules specific to particular products under the provi-sions of the Tripartite Free Trade Area. Rules of origin for 25 per cent of product types have al-ready been agreed on.
• The Agreement includes anti-dumping, coun-tervailing and safeguard measures to address dumping, subsidies and import surges. The tech-nical details will be finalized by mid-2016.
• The Agreement provides for a dispute settlement body and specifies its powers, which include es-tablishing panels and an appellate body and
Continued

15
Four of the eight major regional economic communi-ties have free trade areas in operation (COMESA, EAC, ECOWAS and SADC) and two, customs unions (EAC and ECOWAS). ECCAS has a free trade area but implemen-tation has yet to hit full throttle: ECCAS member States have on average reduced only 34 per cent of tariff lines on intra-ECCAS tariffs to zero and the region has the lowest share of intra-regional trade in terms of gross domestic product (GDP) of any of Africa’s five subre-gions (ECA and African Union Commission, 2015a; UNC-TADStat, 2015). Implementation of COMESA’s customs union is similarly limited. According to the Abuja Treaty, all regional economic communities should establish REC-level Free Trade Areas and customs unions by the end of 2017.
Continental Free Trade Area
June 2015 also saw the formal launch of negotiations for the Continental Free Trade Area. Negotiations are ex-pected to last until the end of 2017 and will cover trade
in goods and services, investment, intellectual property rights and competition policy (Luke and Sodipo, 2015). African Union member States have set out the objec-tives for the negotiations:
• An agreement to address the challenges posted by multiple and overlapping memberships of regional economic communities.
• Reservation of the acquis (building on what has al-ready been agreed through existing agreements).
• Variable geometry (different countries may reduce tariffs at different speeds), flexibility and special and differential treatment.
• Most-favoured-nation treatment (countries must extend the preferences that they grant under the Continental Free Trade Area to all African countries equally).
monitoring implementation of their rulings and recommendations.
• Quantitative restrictions on imports (quotas) will be eliminated.
• The Agreement includes commitments to trade facilitation and facilitation of transit trade; pro-tection of infant industries; and balance-of-pay-ments–related provisions.
• It has provisions for enhancing cooperation be-tween national customs authorities.
• The second phase of the negotiations will last un-til June 2017 and will cover services, competition policy, intellectual property rights, movement of business persons and other trade-related matters.
• The Agreement will enter into force after the re-maining technical steps have been completed and it has been ratified by at least 14 member States. This is expected to occur during 2016.
Potential economic gains from the Tripartite Free Trade AreaRecent ECA analysis (Mold and Mukwaya, 2015) sug-gests that the Tripartite Free Trade Area will have sub-stantial effects on intra-regional trade within Eastern
and Southern Africa, possibly with gains of around $8.5 billion, or a one-third increase from its current level. Most of the gains would come via improved terms of trade in industrial goods, which promise to boost industrial productivity, because African man-ufacturing firms usually show substantial increases in productivity after they begin to export. The paper also forecasts welfare increases of around $2.4 billion. These estimates do not include potential gains if the Tripartite Free Trade Area were to be extended to cov-er trade in services—COMESA, EAC and SADC mem-ber States are negotiating that aspect.
Many commentators expected a more ambitious trade liberalization outcome through the Tripartite Free Trade Area, particularly on the tariff reductions that are yet to be finalized. Much work, including that on rules of origin, has to be finalized to put the agree-ment into effect. Still, June’s signing is a huge step to rationalizing Africa’s regional trade arrangements and promoting freer trade between African countries, and a key milestone for Africa’s integration (Luke and Ma-buza, 2015).
Box 2.1.
The Tripartite Free Trade Area Agreement (continued)

16
• National treatment (once import tariffs have been paid, goods and services from other African coun-tries will be treated the same as domestic goods and services by domestic regulations and internal taxes).
• Reciprocity.
• Decisions in the negotiations to be taken by consen-sus (unanimity).
• Adoption of a detailed Indicative Roadmap on the Negotiation and Establishment of the Continental Free Trade Area.
The African Union Commission has mobilized around $18 million to support the negotiations, including funds for a dedicated Continental Free Trade Area Unit with the required expertise. The African Union Commission is coordinating an assessment of how member States and regional economic communities need to develop their negotiating capacity (African Union, 2015, 2015a). As shown in ARIA V, the Continental Free Trade Area is expected to bring wide economic benefits to Africa, via deeper regional integration and higher incomes and GDP (ECA, African Union Commission and African De-velopment Bank, 2012).
Intra-African trade in goods
To measure trade integration of African countries, an obvious starting point might be the absolute value of a country’s trade in goods with other African countries, but this is not perfect because populous countries, with large economies, may trade heavily with the rest of Afri-ca but the volume may be only a small fraction of their total trade—they trade because of their size, not open-ness. For this reason, the ratios of intra-African imports and exports to GDP are examined as primary indicators of trade openness.
Intra-African trade as a share of GDP is low relative to that of other regions: intra-continental imports are esti-mated to be 4.3 per cent of Africa’s GDP, against 6.7 per cent in the Americas, 17.9 per cent in Asia and 21 per cent in Europe (UNCTADStat, 2015). Still, intra-African trade in goods as a share of GDP has risen sharply since around 2000 (info 2.1).
A high level of intra-African exports and imports indi-cates that a country has taken important steps to keep
trade barriers with other African countries low (see info 1 and figures 2.1 and 2.2). Otherwise, the cost of trading would tend to render the country’s products uncompet-itive in other African markets and to reduce the propor-tion of a country’s income spent on imports from the rest of Africa.
Countries in southern Africa appear to have the highest shares of intra-African trade in GDP: the nine with the highest shares of intra-African imports to GDP are all members of SADC, although this could be due to their proximity to South Africa and because they are mem-bers of the SADC Free Trade Area, which generates trade with South Africa as the regional hegemon.
To investigate whether this is true, the African Trade Policy Centre at ECA examined the proportion of these countries’ intra-African trade accounted for by trade with South Africa. It found that, for some of the coun-tries with the highest shares of intra-African exports to GDP (such as Swaziland, Lesotho and Zimbabwe), most of these exports were indeed to South Africa. However, for some of the other SADC member countries with sim-ilarly high shares on this metric, such as Namibia and Zambia, this was not the case, suggesting that trade between SADC countries and South Africa partly, but not entirely, explains the strong performance of SADC countries in intra-African exports.
ECA also examined SADC countries’ scores vis-à-vis South Africa in the UNCTAD merchandise trade com-plementarity index, which measures how closely the distribution of exports of the exporting country (across various product lines) matches the imports of the im-porting country. A higher score indicates a higher de-gree of complementarity that should contribute to greater trade between the two countries. Here it found that the complementarity between SADC countries’ exports and South Africa’s imports is not particularly high, suggesting that the complementarity of SADC countries’ exports with South Africa’s imports may not explain the high degree of trade between the two sides.
On SADC countries’ imports from South Africa as a share of their GDP, many of the countries with the highest shares of intra-African imports to GDP (such as Lesotho, Swaziland, Namibia, Botswana, Zimbabwe and Zambia) have the majority of those imports coming from South Africa. Furthermore, the complementarity of SADC countries’ imports with South Africa’s exports, as meas-

17
Intra-REC imports as a share of GDP, 1995–2014
Info 2.1—Intra-African trade
Intra-African trade as a share of GDP is low relative to that of other regions. Intra-continental imports are estimated at 4.3 per cent of Africa’s GDP, against 6.7 per cent in the Americas, 17.9 per cent in Asia and 21 per cent in Europe. Still, intra-African trade in goods as a share of GDP has risen sharply since around 2000.
Among the eight AU-recognized RECs, SADC consistently has the highest share on intra-REC imports, even though it does not have the lowest intra-REC average applied tariffs. Thus other factors, such as trade complementarity, may explain the pattern of trade within SADC.
Source: ECA.
Growth in share of intra-African trade in Africa’s GDP, 1995–2013
5.0%
1995 1996 1997 1998 1999 2000 2001 2002 2003 2004 2005 2006 2007 2008 2009 2010 2011 2012 2013
4.5%
4.0%
3.5%
3.0%
2.5%
2.0%
1.5%
1.0%
0.5%
0.0%
Source: ECA. Calculations based on UNCTADStat, 2015.
1995 1996 1997 1998 1999 2000 2001 2002 2003 2004 2005 2006 2007 2008 2009 2010 2011 2012 2013 2014
6%
5%
4%
3%
2%
1%
0%
AMU
COMESA
IGAD
EAC
ECCAS
ECOWAS
CEN-SAD
SADC
Intra-African imports Intra-African exports

18
Figure 2.1.
Intra-African exports as a share of GDP, including re-exports, 2013
Source: ECA calculations based on UNCTADStat (2015).
Figure 2.2.
Intra-African imports as a share of GDP, including re-exports, 2013
Source: ECA calculations based on UNCTADStat (2015).

19
ured through the above UNCTAD index, is relatively high, which could indicate that Southern Africa’s high performance on intra-African imports stems from SADC countries’ imports from South Africa, in turn due to the complementarity between South African exports and SADC countries’ imports.
Intra-regional economic community trade
Some of Africa’s regional economic communities per-form strongly against other regional integration blocs worldwide (figure 2.3). SADC in particular, with intra-re-gional imports of 6.6 per cent of GDP, has the fifth-high-est ratio worldwide among 32 regional blocs. Others, however, perform quite poorly and can be found in the bottom third of the regional blocs considered on this measure.
Among the eight African Union-recognized region-al economic communities, SADC has consistently the highest share on this metric (see info 1), even though it does not have the lowest intra-regional economic com-munity average applied tariffs. Thus other factors, such
as trade complementarity (above), may explain the pat-tern of trade within SADC.
Tariff liberalization
Tariffs are an important determinant of intra-region-al trade because they increase the price of imported goods. Through frameworks like Agenda 2063 and the BIAT initiative, African countries are committed to reducing tariffs on African products, among regional economic communities and at continental level. Where a country has a low share of intra-regional imports in GDP despite low tariffs on intra-regional imports, this may point to low demand for other regional countries’ goods or non-tariff barriers, or both.
This review begins by examining the average applied tariffs on intra-regional economic community imports, calculated using data (on preferential tariffs on such imports disaggregated at six-digit product level and by partner country) from the International Trade Cen-tre’s Market Access Map database. A weighted average of these tariffs is then created using bilateral import
Figure 2.3.
Intra-regional imports as a share of regional GDP, 2013
0 5 10 15 20
European Free Trade AssociationMelanesian Spearhead Group
Economic Community of Central African StatesOrganization of Eastern Caribbean States
Intergovernmental Authority on DevelopmentSouth Asian Association for Regional Cooperation
Arab Maghreb UnionAndean Community
Economic Cooperation OrganizationCommon Market for Eastern and Southern Africa
Community of Sahel-Saharan StatesMERCOSUR (Mercado Común Sudamericano)
East African CommunityUnion of South American Nations
Gulf Cooperation CouncilEconomic Community of West African States
Latin American Integration AssociationBlack Sea Economic Cooperation
Asia-Paci�c Trade AgreementLeague of Arab States
Central-European Free Trade AreaCommonwealth of Independent States
Caribbean CommunityCentral American Common Market
North American Free Trade AgreementOrganisation of the Islamic Conference
Southern African Development CommunityFree Trade Area of the Americas
Organization of American StatesAssociation of South-East Asian Nations
Asia-Paci�c Economic CooperationEuropean Union 19,7%
14,5% 12,0% 6,7% 6,7% 6,6% 5,5% 5,4% 5,3% 4,8% 4,7% 4,5% 4,3% 4,2% 4,0% 3,1% 3,0% 3,0% 3,0% 2,7% 2,1% 2,1% 2,0% 1,7% 1,6% 1,2% 0,9% 0,9% 0,7% 0,5% 0,4%0,2%
Source: ECA calculations based on UNCTADStat (2015).

20
data (also disaggregated at the six-digit level) from UN Comtrade to weight each tariff according to its share in the country’s imports from the regional economic com-munity in question. The data here refer to the most re-cent year that both tariff and trade data were available for a given country.
Libya consistently applies a zero tariff on imports from the regional economic communities of which it is a member.4 Mauritius also applies zero tariffs on imports from SADC and an almost-zero tariff on imports from COMESA. All EAC members have a zero average applied tariff on imports from other members of that grouping. The large variations in average applied tariffs between different regional economic communities may reflect which regional economic communities have estab-lished Free Trade Areas and the extent of tariff liberal-ization (info 2).
Even within the regional economic communities that have Free Trade Areas (such as COMESA, ECCAS, ECOW-AS and SADC) many tariff lines are not yet fully liberal-ized. Info 2.2 displays the proportion of fully liberalized tariff lines (a zero-rated tariff) in seven of the eight re-gional economic communities.5
Non-tariff barriers and gains in trade facilitation
Recent literature argues that removing non-tariff bar-riers and implementing trade facilitation reforms in Africa will greatly boost trade integration and growth (ECA, African Union Commission and African Develop-ment Bank, 2012b; ECA and African Union Commission, 2015b; ECA and African Union Commission, 2015c; ECA, 2014). Such reforms include simplifying customs proce-dures, harmonizing the opening hours of border posts, introducing one-stop border posts and removing road blocks along intra-regional transport routes.
The following extract from ECA and African Union Com-mission (2015) details some of the progress in eliminat-ing non-tariff barriers in regional economic communities:
At the latest update, under its NTB [non-tariff barrier] time-bound elimination programme, EAC [EAC] had removed 78 NTBs (though 4 new ones had been added). On average, only 4.2 NTBs [non-tariff barriers] remain per EAC [EAC] member country (EAC, 2015).
Within COMESA, at the last count the REC had removed 220 out of 225 reported NTBs (COME-SA, 2015a).
More broadly within the Tripartite [Agreement], the Tripartite Non-Tariff Barriers Reporting, Monitoring and Elimination Mechanism had, at the latest count, resolved 406 out of a total of 492 registered complaints about non-tariff bar-riers (Tripartite, 2015).
[S]ixteen out of nineteen COMESA countries use the [Automated System of Customs Data Man-agement] electronic customs system (COMESA, 2015b).
Within UMA, progress in trade facilitation and removal of non-tariff barriers appears to be lim-ited and there could be further progress (ECA, 2013).
The Tripartite and ECOWAS have made signifi-cant progress in implementing transport facil-itation measures. Within ECCAS progress has been more limited.
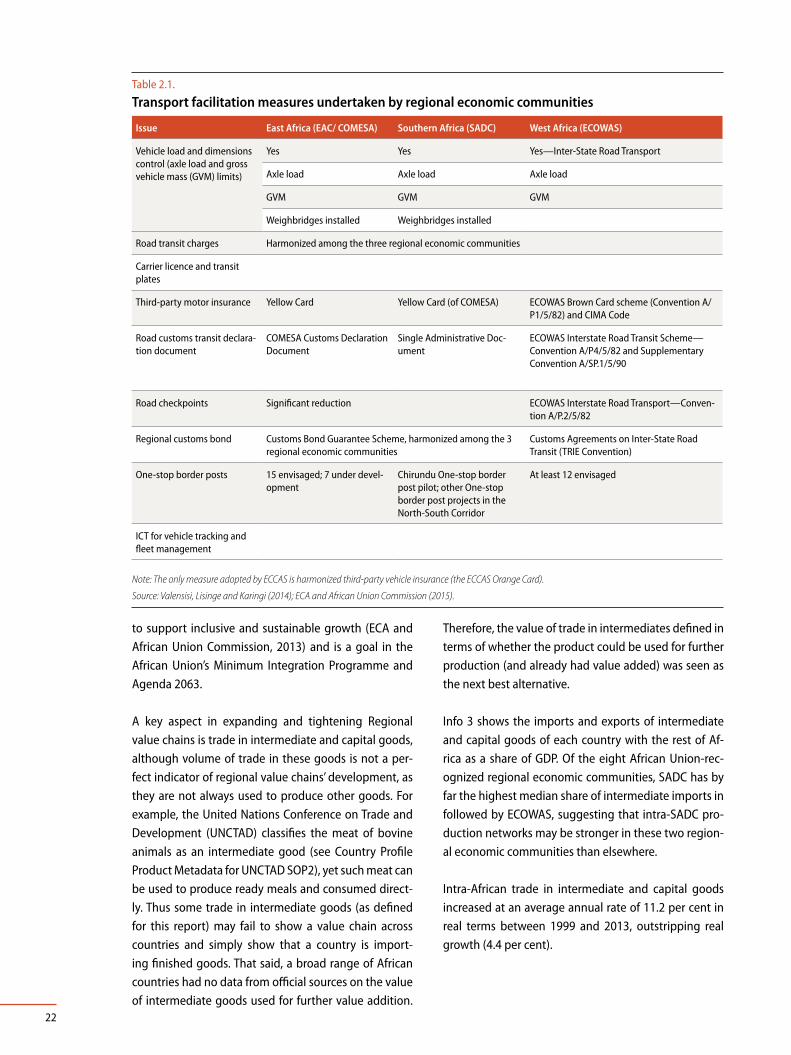
Transport facilitation measures adopted at regional economic community level for goods and persons have moved ahead (table 2.1).
On the ease of trading across borders in 2015 (taken from the World Bank’s Doing Business indicators), Mau-ritius and Morocco scored the highest among African countries. (Swaziland was the highest-scoring land-locked African country.)
Regional value chains
Stronger regional value chains help Africa to realize its economic aspirations, particularly structural transfor-mation and inclusive growth (ECA, 2015), allowing it to retain more value added in its production processes. Because higher value-added activities are often associ-ated with faster productivity growth and enhanced ex-port competitiveness, this may lead to a virtuous circle: greater productive integration boosting competitive-ness, intensifying exports to countries outside of Africa, leading to greater demand for the same intermediate inputs from Africa, leading to further productivity gains … and so on. Industrial development has been shown

21
Info 2.2—Applied tariffs across RECs
All EAC members have a zero average applied tariff on imports from other members of that grouping. The large variations in average applied tariffs between different RECs may reflect which RECs that have established free trade agreements and the extent of tariff liberalization.
Even within RECs that have free trade agreements—such as COMESA, ECCAS, ECOWAS and SADC—many tariff lines are not yet fully liberalized.
Average applied tariff by REC members on imports from other members of that REC
Share of fully liberalized tariff lines (%)
Source: ATPC calculations based on ITC, 2015; UNSD, 2015.
Source: ECA and AUC, 2015.
EAC0.0%
IGAD1.8% AMU
2.6%
ECOWAS5.6%
SADC3.8%
CEN-SAD7.4%
ECCAS1.86%
COMESA1.89%
COMESA
55%
IGAD
22%
SADC
15%
ECOWAS
10%
AMU
49%
ECCAS
34%
EAC
100%
22
to support inclusive and sustainable growth (ECA and African Union Commission, 2013) and is a goal in the African Union’s Minimum Integration Programme and Agenda 2063.
A key aspect in expanding and tightening Regional value chains is trade in intermediate and capital goods, although volume of trade in these goods is not a per-fect indicator of regional value chains’ development, as they are not always used to produce other goods. For example, the United Nations Conference on Trade and Development (UNCTAD) classifies the meat of bovine animals as an intermediate good (see Country Profile Product Metadata for UNCTAD SOP2), yet such meat can be used to produce ready meals and consumed direct-ly. Thus some trade in intermediate goods (as defined for this report) may fail to show a value chain across countries and simply show that a country is import-ing finished goods. That said, a broad range of African countries had no data from official sources on the value of intermediate goods used for further value addition.
Therefore, the value of trade in intermediates defined in terms of whether the product could be used for further production (and already had value added) was seen as the next best alternative.
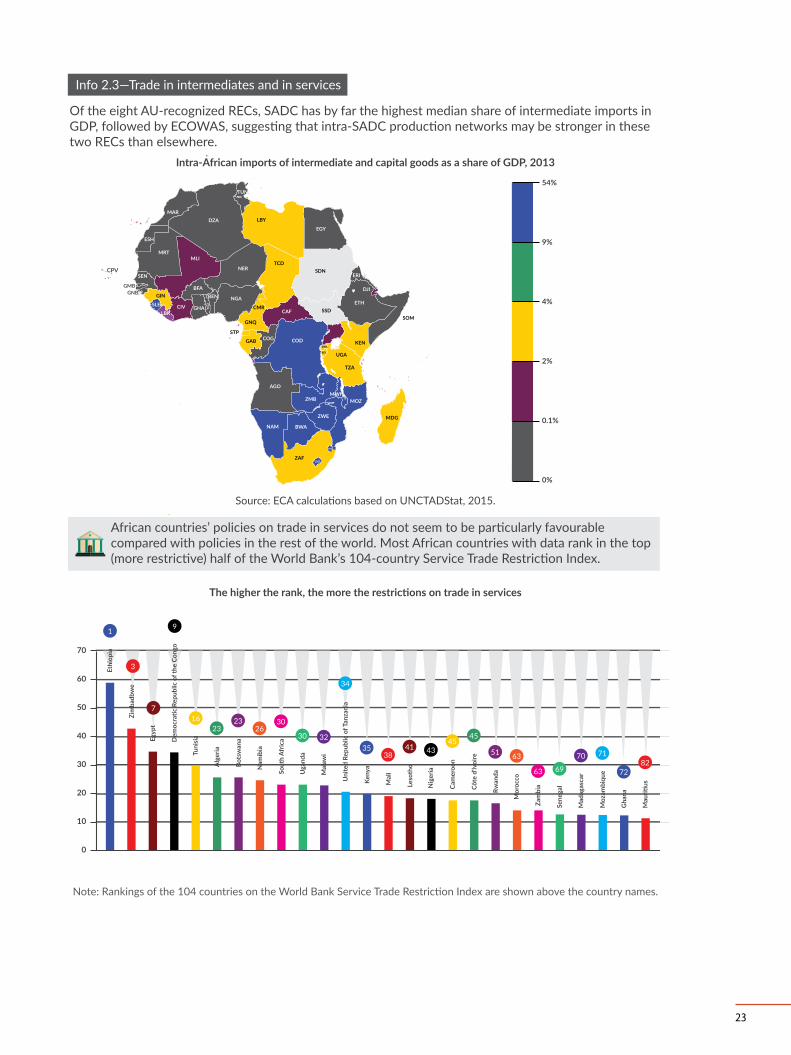
Info 3 shows the imports and exports of intermediate and capital goods of each country with the rest of Af-rica as a share of GDP. Of the eight African Union-rec-ognized regional economic communities, SADC has by far the highest median share of intermediate imports in followed by ECOWAS, suggesting that intra-SADC pro-duction networks may be stronger in these two region-al economic communities than elsewhere.
Intra-African trade in intermediate and capital goods increased at an average annual rate of 11.2 per cent in real terms between 1999 and 2013, outstripping real growth (4.4 per cent).
Table 2.1.
Transport facilitation measures undertaken by regional economic communities
Issue East Africa (EAC/ COMESA) Southern Africa (SADC) West Africa (ECOWAS)
Vehicle load and dimensions control (axle load and gross vehicle mass (GVM) limits)
Yes Yes Yes—Inter-State Road Transport
Axle load Axle load Axle load
GVM GVM GVM
Weighbridges installed Weighbridges installed
Road transit charges Harmonized among the three regional economic communities
Carrier licence and transit plates
Third-party motor insurance Yellow Card Yellow Card (of COMESA) ECOWAS Brown Card scheme (Convention A/P1/5/82) and CIMA Code
Road customs transit declara-tion document
COMESA Customs Declaration Document
Single Administrative Doc-ument
ECOWAS Interstate Road Transit Scheme—Convention A/P4/5/82 and Supplementary Convention A/SP.1/5/90
Road checkpoints Significant reduction ECOWAS Interstate Road Transport—Conven-tion A/P.2/5/82
Regional customs bond Customs Bond Guarantee Scheme, harmonized among the 3 regional economic communities
Customs Agreements on Inter-State Road Transit (TRIE Convention)
One-stop border posts 15 envisaged; 7 under devel-opment
Chirundu One-stop border post pilot; other One-stop border post projects in the North-South Corridor
At least 12 envisaged
ICT for vehicle tracking and fleet management
Note: The only measure adopted by ECCAS is harmonized third-party vehicle insurance (the ECCAS Orange Card).
Source: Valensisi, Lisinge and Karingi (2014); ECA and African Union Commission (2015).
23
Intra-African imports of intermediate and capital goods as a share of GDP, 2013
Info 2.3—Trade in intermediates and in services
Source: ECA calculations based on UNCTADStat, 2015.
54%
9%
4%
2%
0.1%
0%
CPV
TUN
DZAMAR
ESH
MRTMLI
SEN
GMBGNB GIN
SLELBR
CIV
BFABEN NGA
NERTCD
CMR
GNQ
GAB COGSTP
CAF
CODRWA
BDI UGA
KEN
TZA
MWIZMB
AGO
MDG
ETH
SOM
DJI
EGY
LBY
SDN
SSD
ERI
COM
MOZ
ZWE
BWANAM
ZAF
SWZ
LSO
TGO
GHA
Of the eight AU-recognized RECs, SADC has by far the highest median share of intermediate imports in GDP, followed by ECOWAS, suggesting that intra-SADC production networks may be stronger in these two RECs than elsewhere.
African countries’ policies on trade in services do not seem to be particularly favourable compared with policies in the rest of the world. Most African countries with data rank in the top (more restrictive) half of the World Bank’s 104-country Service Trade Restriction Index.
The higher the rank, the more the restrictions on trade in services
Note: Rankings of the 104 countries on the World Bank Service Trade Restriction Index are shown above the country names.
Ethi
opia
Zim
badb
we
Egyp
t
Tuni
sia
Alg
eria
Bots
wan
a
Nam
ibia
Sout
h Af
rica
Uga
nda
Mal
awi
Keny
a
Mal
i
Leso
tho
Nig
eria
Cam
eroo
n
Côte
d'lv
oire
Rwan
da
Mor
occo
Zam
bia
Sene
gal
Mad
agas
car
Moz
ambi
que
Gha
na
Mau
ritius
Uni
ted
Repu
blic
of T
anza
nia
Dem
ocra
tic R
epub
lic o
f the
Con
go70
60
50
40
30
20
10
0
1
3
7
9
1623
2326
30
30 32
34
3538
41 4345
45
51 63
63 69
70 71
7282

24
Trade in services
It is hard to make precise inferences about intra-Afri-can trade in services because African countries do not generally publish services trade data disaggregated by partner country, but one can put forward patterns and trends. In 2014, Africa imported $183 billion in ser-vices and exported $106 billion. As imports exceeded exports, Africa must have imported the excess from out-side the continent (otherwise, these flows would have been included in recorded exports). This $77 billion im-ported-services deficit represents business that could be captured by African firms if barriers to intra-African trade in services were lowered. Imports from outside the continent were particularly strong in transport ser-vices, at $41 billion (UNCTADStat, 2015; Luke, 2015).
ECA attempted to estimate an upper bound for in-tra-African trade in services. First, it took Africa’s total reported exports of services and subtracted imports of services from Africa reported by non-African partners. It then performed a similar calculation, taking Africa’s to-tal imports of services and subtracting services exports reported by the continent’s trading partners. The lower of these two estimates—$85 billion in 2013—was con-sidered a rough upper band (Luke, 2015).
African countries’ policies on trade in services do not seem to be particularly favourable compared with poli-cies in the rest of the world. Most African countries with data rank in the top (more restrictive) half of the World Bank’s 104-country Services Trade Restrictions Index (see info 2.3).
Trends in trade with the rest of the world
After negotiating for 12 years, African countries have re-cently made progress towards signing economic part-nership agreements with the European Union, though only a handful have started provisionally applying them.6 Most other countries are still conducting “legal scrubbing”—preparing them for signature before rati-fying them.
The economic partnership agreements are reciprocal but asymmetrical agreements between the European Union and African countries, as the European Union must grant immediately 100 per cent free market access to African countries, whereas African economies are re-quired only to progressively make free of duties not less
than 75 per cent of their imports from the European Un-ion. The agreements are expected to deliver benefits to both sides but the gains for Africa are expected to be concentrated in just a few non-industrial sectors, such as rice, milk, sugar and meat, and to accrue mainly to African non-least-developed countries. Gains for the European Union would be more generalized, largely owing to initial asymmetrical protection structures. The projected increase in Africa’s exports to the European Union would also come at the expense of intra-African trade, and African governments would suffer a sharp drop in tariff revenues (ECA, 2015). Nevertheless, ef-forts from the European Union to provide compensa-tion to African countries under the Economic Partner-ship Agreements Development Programme should be acknowledged. These are expected to offset at least some of the possible costs of the economic partnership agreement reforms.
African countries would, however, be better off if they established the Continental Free Trade Area before fully implementing economic partnership agreement reforms, which would largely preserve the trade gains for Africa and the European Union from the Economic Partnership Agreements. Moreover, possible negative impacts (from the Agreements without the Continental Free Trade Area) would be more than offset. With the Continental Free Trade Area already in place intra-Af-rican trade would expand considerably, especially if trade facilitation measures were adopted and non-tar-iff barriers lowered. Any losses in tariff revenues would be negated thanks to trade gains. The largest share of trade benefits for African economies would be felt in industrial products, offering positive perspectives for Africa’s industrialization and structural transformation (ECA, 2015).
Africa’s imperative to establish the Continental Free Trade Area and tackle non-tariff barriers as fast as possible is further underlined by current negotiations on “mega-regional” trade agreements, such as the Trans-Atlantic Trade and Investment Partnership, the Trans-Pacific Partnership and the Regional Comprehen-sive Economic Partnership, in which no African coun-tries participate. The impact of preference erosion (a major outcome for Africa when these agreements come into force) will probably be softened if the Continental Free Trade Area is already in place (ECA, 2015).

25
Informal trade
The informal sector forms a large portion of African economies (ECA and African Union Commission, 2014). Data, however, are scant, and collection presents mul-tiple challenges. Some African countries have started to produce informal trade statistics, but coverage is still insufficient for meaningful analysis here.
Economic trends
Macroeconomic policy convergence will support Afri-ca’s integration by contributing stability and predict-ability to macroeconomic conditions, reducing com-mercial risk and encouraging cross-border trade and investment. Macroeconomic stability will also reduce the risk of recession, which otherwise could threaten to spill across borders. Once Africa achieves a monetary union, as foreseen in the Abuja Treaty, this aspect will be particularly important (Organization of African Uni-ty, 1991). Several regional economic communities have already agreed to converge their policies.
Over the last two years inflation generally continued to decline in Africa, reflecting prudent monetary policies, decreasing global prices for oil and other commodities, and good harvests, although some countries experi-enced a sharp rise due to currency depreciation and responded with tighter monetary policy.
Inflation in Africa as a whole is projected at 6.9 per cent in 2015 and 6.7 per cent in 2016. In Southern Africa, inflation was 6.2 per cent in 2014 and is projected at 6 per cent in 2015. The equivalent figures for North Afri-ca are 7.2 per cent and 7.1 per cent. Egypt is expected to have the highest inflation in North Africa at 10.1 per cent (ECA, 2015).
Africa’s fiscal deficit widened in 2014 from 2013 on gov-ernment infrastructure spending and lower revenues from oil and other commodities. Several African coun-tries, including Nigeria, Senegal and South Africa, cut non-essential expenditure, inefficiency and waste in the public sector. Revenue collection is expected to in-crease in some countries, such as Ethiopia and Rwanda, as they reform their tax systems. Africa’s fiscal deficit is projected to fall from 2014 to 2015 and to maintain that trend in 2016 (ECA, 2015).
Among subregions, fiscal deficits were expected to nar-row from 2014 to 2015: in North Africa from 6.6 per cent of GDP to 5.8 per cent, in Southern Africa from 4.2 per cent to 3.7 per cent and in West Africa from 5.2 per cent to 4.3 per cent. By country, Botswana’s budget surplus was forecast to be 1.2 per cent of GDP in 2015; Nigeria’s fiscal deficit was projected to be 2.1 per cent of GDP, in part due to lower oil revenues. Senegal’s fiscal deficit was expected to fall from 5.1 per cent of GDP to 4.1 per cent on spending reductions. Egypt, Ghana and Tanza-nia were forecast to have higher fiscal deficits in 2015, with deficits forecast to be 8 per cent (Egypt), 10.7 per cent (Ghana) and 7 per cent (Tanzania). Kenya’s fiscal deficit was projected to decrease (ECA, 2015).
The continent’s current account deficit widened from 2013 to 2014 owing to falling export earnings and ris-ing imports of capital goods. Private capital inflows are expected to have climbed during 2015 due to an im-proved business environment and stronger economic management (ECA, 2015).
Most African currencies were projected to depreciate against the US dollar in 2015, particularly the Kenyan shilling, on global monetary policy tightening, as was the CFA franc. The South African Rand, by contrast, was projected to appreciate (ECA, 2015).
The current economic slowdown in China could pose problems for African countries, given the extent China imports goods from Africa (see, for example, ECA and African Union Commission, 2014). China’s status as the world’s first or second largest economy (depending on the data used) means that its deceleration could also further lower global commodity prices, which hit Afri-can exports more, and thus African currencies, possibly causing difficulties in debt servicing and repayment for African countries with dollar-denominated sovereign bonds.
Financial integration
African financial integration—facilitating financial flows among countries—is an important part of wider integration because it allows finance from across the continent to be allocated to where it is most productive and allows African investors to enhance their returns. As some recent literature on foreign direct investment has shown, financial integration would also support knowledge, technology transfer and innovation among
26
African countries, supporting advances in productivity and spurring development. Agenda 2063, for example, notes that African Union member States aim for an Afri-ca in 2063 with “free movement of…capital… [leading to] significant increases in…investments amongst Afri-can countries” (African Union Commission, 2015a).
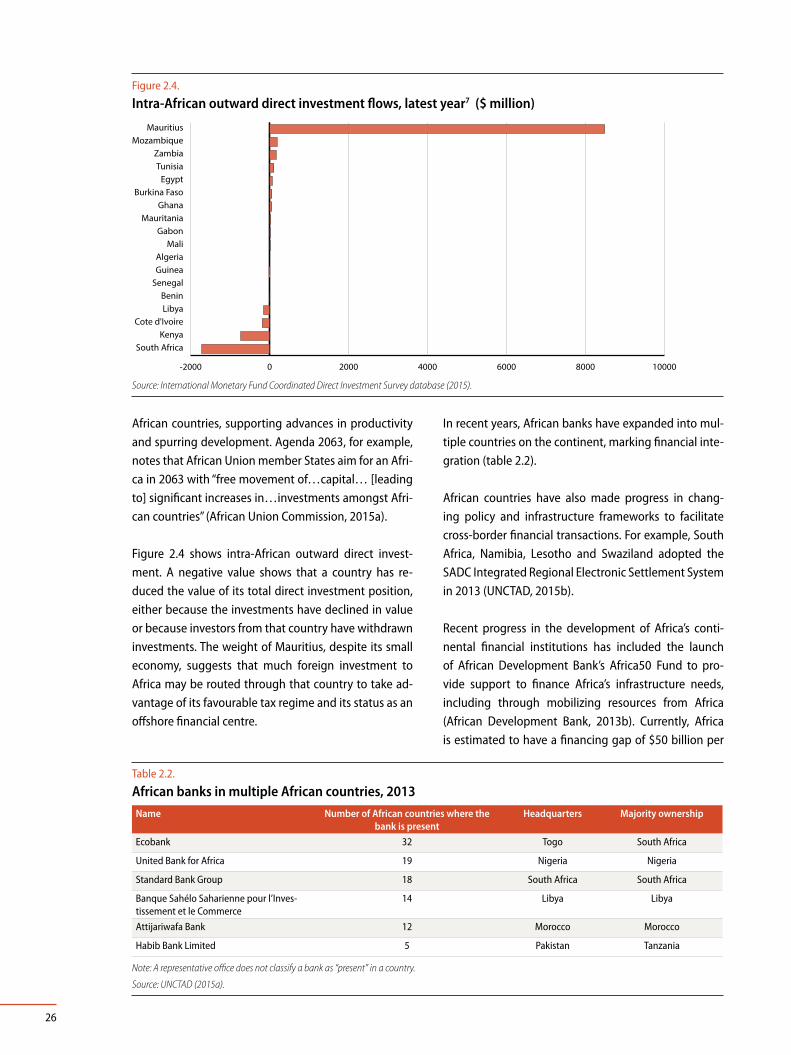
Figure 2.4 shows intra-African outward direct invest-ment. A negative value shows that a country has re-duced the value of its total direct investment position, either because the investments have declined in value or because investors from that country have withdrawn investments. The weight of Mauritius, despite its small economy, suggests that much foreign investment to Africa may be routed through that country to take ad-vantage of its favourable tax regime and its status as an offshore financial centre.
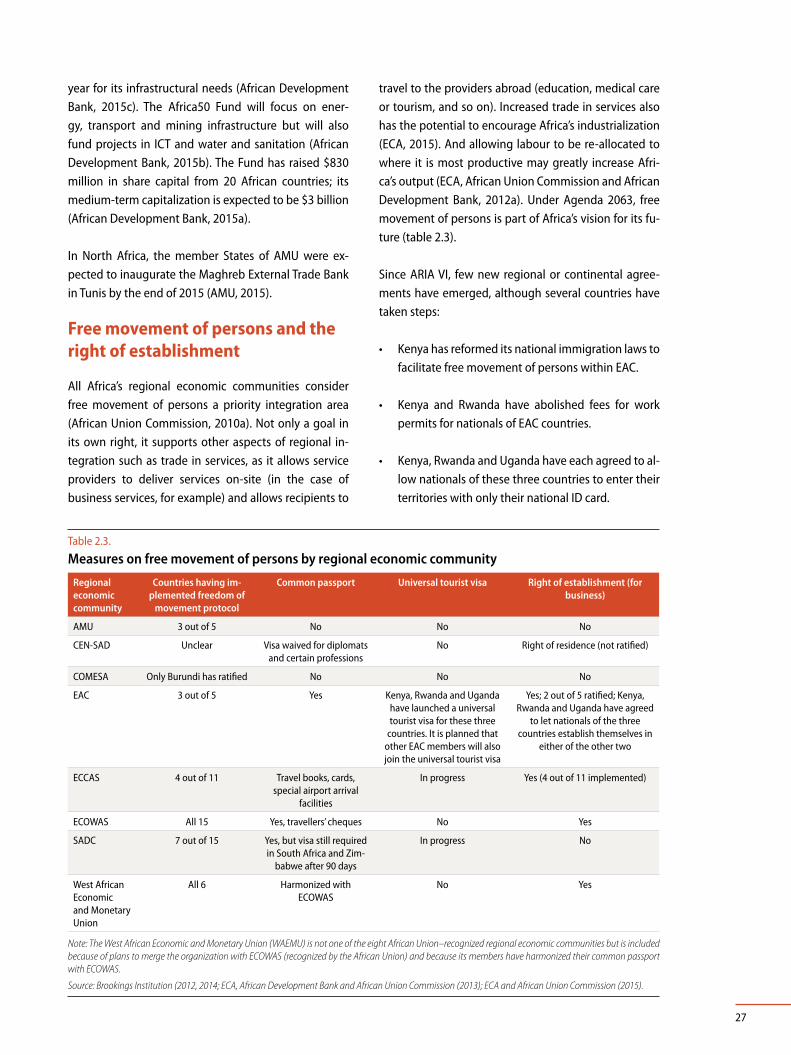
In recent years, African banks have expanded into mul-tiple countries on the continent, marking financial inte-gration (table 2.2).
African countries have also made progress in chang-ing policy and infrastructure frameworks to facilitate cross-border financial transactions. For example, South Africa, Namibia, Lesotho and Swaziland adopted the SADC Integrated Regional Electronic Settlement System in 2013 (UNCTAD, 2015b).
Recent progress in the development of Africa’s conti-nental financial institutions has included the launch of African Development Bank’s Africa50 Fund to pro-vide support to finance Africa’s infrastructure needs, including through mobilizing resources from Africa (African Development Bank, 2013b). Currently, Africa is estimated to have a financing gap of $50 billion per
Figure 2.4.
Intra-African outward direct investment flows, latest year7 ($ million)
-2000 0 2000 4000 6000 8000 10000
South AfricaKenya
Cote d'IvoireLibyaBenin
SenegalGuineaAlgeria
MaliGabon
MauritaniaGhana
Burkina FasoEgypt
TunisiaZambia
MozambiqueMauritius
Source: International Monetary Fund Coordinated Direct Investment Survey database (2015).
Table 2.2.
African banks in multiple African countries, 2013Name Number of African countries where the
bank is presentHeadquarters Majority ownership
Ecobank 32 Togo South Africa
United Bank for Africa 19 Nigeria Nigeria
Standard Bank Group 18 South Africa South Africa
Banque Sahélo Saharienne pour l’Inves-tissement et le Commerce
14 Libya Libya
Attijariwafa Bank 12 Morocco Morocco
Habib Bank Limited 5 Pakistan Tanzania
Note: A representative office does not classify a bank as “present” in a country.
Source: UNCTAD (2015a).
27
year for its infrastructural needs (African Development Bank, 2015c). The Africa50 Fund will focus on ener-gy, transport and mining infrastructure but will also fund projects in ICT and water and sanitation (African Development Bank, 2015b). The Fund has raised $830 million in share capital from 20 African countries; its medium-term capitalization is expected to be $3 billion (African Development Bank, 2015a).
In North Africa, the member States of AMU were ex-pected to inaugurate the Maghreb External Trade Bank in Tunis by the end of 2015 (AMU, 2015).
Free movement of persons and the right of establishment
All Africa’s regional economic communities consider free movement of persons a priority integration area (African Union Commission, 2010a). Not only a goal in its own right, it supports other aspects of regional in-tegration such as trade in services, as it allows service providers to deliver services on-site (in the case of business services, for example) and allows recipients to
travel to the providers abroad (education, medical care or tourism, and so on). Increased trade in services also has the potential to encourage Africa’s industrialization (ECA, 2015). And allowing labour to be re-allocated to where it is most productive may greatly increase Afri-ca’s output (ECA, African Union Commission and African Development Bank, 2012a). Under Agenda 2063, free movement of persons is part of Africa’s vision for its fu-ture (table 2.3).
Since ARIA VI, few new regional or continental agree-ments have emerged, although several countries have taken steps:
• Kenya has reformed its national immigration laws to facilitate free movement of persons within EAC.
• Kenya and Rwanda have abolished fees for work permits for nationals of EAC countries.
• Kenya, Rwanda and Uganda have each agreed to al-low nationals of these three countries to enter their territories with only their national ID card.
Table 2.3.
Measures on free movement of persons by regional economic community
Regional economic community
Countries having im-plemented freedom of
movement protocol
Common passport Universal tourist visa Right of establishment (for business)
AMU 3 out of 5 No No No
CEN-SAD Unclear Visa waived for diplomats and certain professions
No Right of residence (not ratified)
COMESA Only Burundi has ratified No No No
EAC 3 out of 5 Yes Kenya, Rwanda and Uganda have launched a universal tourist visa for these three
countries. It is planned that other EAC members will also join the universal tourist visa
Yes; 2 out of 5 ratified; Kenya, Rwanda and Uganda have agreed
to let nationals of the three countries establish themselves in
either of the other two
ECCAS 4 out of 11 Travel books, cards, special airport arrival
facilities
In progress Yes (4 out of 11 implemented)
ECOWAS All 15 Yes, travellers’ cheques No Yes
SADC 7 out of 15 Yes, but visa still required in South Africa and Zim-
babwe after 90 days
In progress No
West African Economic and Monetary Union
All 6 Harmonized with ECOWAS
No Yes
Note: The West African Economic and Monetary Union (WAEMU) is not one of the eight African Union–recognized regional economic communities but is included because of plans to merge the organization with ECOWAS (recognized by the African Union) and because its members have harmonized their common passport with ECOWAS.
Source: Brookings Institution (2012, 2014; ECA, African Development Bank and African Union Commission (2013); ECA and African Union Commission (2015).

28
• Mauritius, Rwanda and Seychelles have removed visa requirements for nationals of other COMESA member States, while Zambia has waived visas for travellers on official business (Business Daily, 2015).
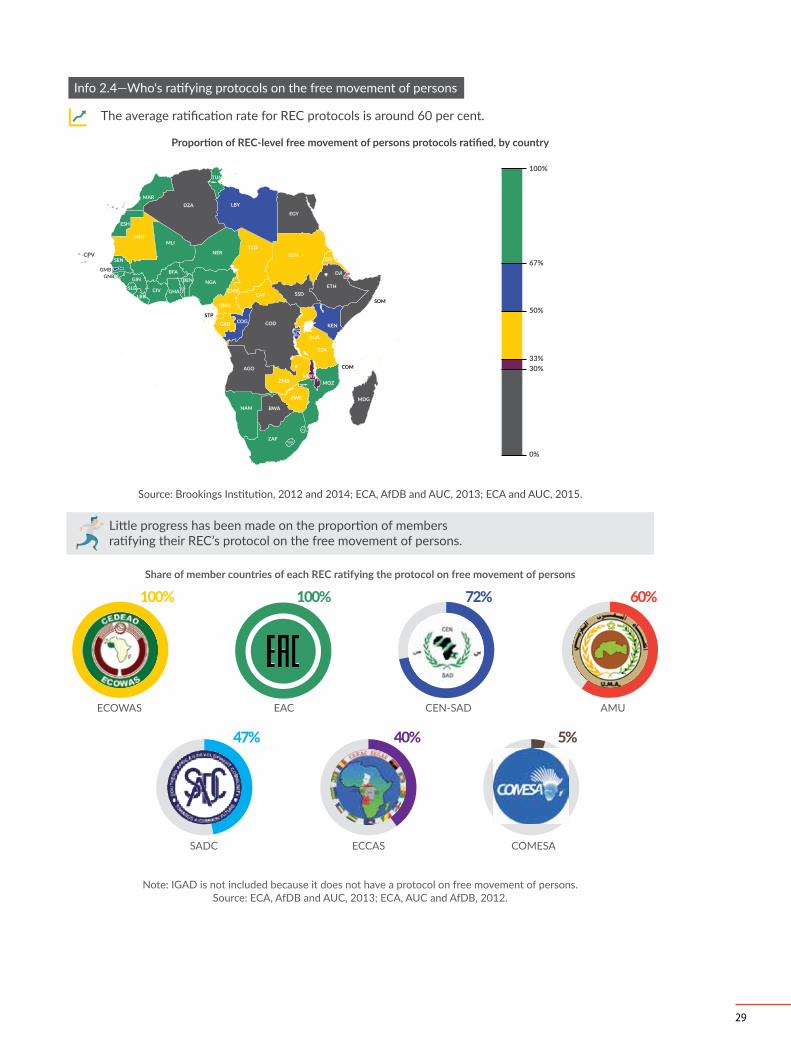
The average ratification rate for regional economic community protocols is around 60 per cent8 among re-gional economic communities (broken down by coun-try in info 2.4).
Little progress has been made on the proportion of members ratifying their regional economic communi-ty’s protocol on free movement of persons.9
Infrastructure integration
Africa’s infrastructure deficits have been estimated to cost the continent up to 2 percentage points of annual economic growth (African Union Commission, 2015b). African leaders committed in Agenda 2063 to speed up action to connect the continent through world-class infrastructure, including interconnectivity between is-land states and the mainland. They also committed to mobilizing financial resources to implement major pro-jects in transport, energy and ICT. These moves are in line with the goals of the Programme for Infrastructure Development in Africa to bring together and merge various continental infrastructure initiatives. (African Union Commission
African countries and regional organizations are in-deed taking steps to accelerate implementation, na-tionally and regionally, in particular in the context of Programme for Infrastructure Development in Africa’s Priority Action Plan. Major challenges are tied to weak national ownership, finance, technical capacity and in-stitutional arrangements.
African countries have made commendable strides to-wards closing the infrastructure deficit, funding nearly half ($46.7 billion out of $99.6 billion) the total in 2013. Most have raised their budget for infrastructure in re-cent years: while overall government budgets in Africa increased by 3 per cent over 2011–2013, those for infra-
structure climbed by 8 per cent. That for energy grew by 5 per cent, for water 11.7 per cent and for ICT and transport 1 per cent. Several countries in 2012 appor-tioned large shares of their budget to infrastructure: Cabo Verde, 44 per cent; Namibia, 39 per cent; Uganda, 28 per cent; and South Africa, 24 per cent (ICA, 2014).
Signs are increasing of high-level political leadership in mobilizing resources for regional infrastructure. For instance, President Macky Sall of Senegal convened the Dakar Financing Summit for Africa’s Infrastructure in June 2014. The Summit aimed to build and strengthen innovative synergies between the public and private sectors for mobilizing pan-African financial investments for infrastructure. The Dakar Agenda for Action, which seeks to leverage public–private partnerships for infra-structure, was the main outcome.
The Summit was a follow-up to a study on mobilizing domestic resources for financing Africa’s development in 2013 undertaken by the Planning and Coordinating Agency of the New Partnership for Africa’s Develop-ment and ECA with other partners. The study provid-ed several options, including promoting infrastructure bonds and African-owned private equity funds, and establishing sovereign wealth funds and public-private partnerships. Such innovative approaches are some of the institutional strategies to close the infrastructure gap (box 2.2).
The New Economic Partnership for Africa’s Develop-ment Presidential Infrastructure Champion Initiative illustrates the increasing level of Africa’s ownership and leadership of its infrastructure projects. PICI was endorsed by the African Union Assembly of January 2011 to accelerate implementation of prioritized sub-regional and regional infrastructure projects—through “political championing.” The Presidential Infrastructure Champion Initiative has nine projects (with champions in brackets):
• Missing Links of the Trans-Sahara Highway (Algeria).
29
Info 2.4—Who's ratifying protocols on the free movement of persons
Proportion of REC-level free movement of persons protocols ratified, by country
Little progress has been made on the proportion of members ratifying their REC’s protocol on the free movement of persons.
Source: Brookings Institution, 2012 and 2014; ECA, AfDB and AUC, 2013; ECA and AUC, 2015.
100%
67%
50%
33%30%
0%
The average ratification rate for REC protocols is around 60 per cent. 60%
CPV
TUN
DZAMAR
ESH
MRTMLI
SEN
GMBGNB GIN
SLELBR
CIV
BFABEN NGA
NERTCD
CMR
GNQ
GAB COGSTP
CAF
CODRWA
BDI UGA
KEN
TZA
MWIZMB
AGO
MDG
COM
ETH
SOM
DJI
EGY
LBY
SDN
SSD
ERI
COM
MOZ
ZWE
BWANAM
ZAF
SWZ
LSO
TGO
GHA
Share of member countries of each REC ratifying the protocol on free movement of persons
EAC
100%
ECOWAS
100%
SADC
47%
ECCAS
40%
COMESA
5%
CEN-SAD
72%
AMU
60%
Note: IGAD is not included because it does not have a protocol on free movement of persons.Source: ECA, AfDB and AUC, 2013; ECA, AUC and AfDB, 2012.
30
• Optic Fibre Link between Algeria and Nigeria via Ni-ger (Algeria).
• Dakar–Ndjamena–Djibouti Road/Rail Project (Sen-egal).
• Nigeria–Algeria Gas Pipeline Project (Nigeria).
• Kinshasa–Brazzaville Bridge (Road/Rail) Project (Re-public of Congo).
• ICT Broadband and Fibre Optic Link to Neighbour-ing States (Rwanda).
• North–South Corridor Road/Rail Project (South Af-rica).
• Navigational Route between Lake Victoria and the Mediterranean Sea (Egypt).
• Lamu Port–Southern Sudan–Ethiopia Transport Corridor Project (Kenya).
The champions have shown leadership by committing or mobilizing financial resources, providing platforms for dialogue among countries and improving the focus of projects. Algeria, Nigeria and Egypt have committed resources for the projects that they are championing. South Africa has undertaken studies to identify gaps in knowledge on the North–South Corridor and, as Chair of the Presidential Infrastructure Champion Initiative, has organized meetings, of senior officials of the coun-tries concerned at technical and political levels, that provide updates on projects. Senegal has prioritized the Dakar–Bamako rail project as the first phase in the Da-kar–Ndjamena–Djibouti Road/Rail project.
On technical capacity, the New Economic Partnership for Africa’s Development Planning and Coordinating Agency established the Programme for Infrastructure Development in Africa Technical Advisory Facility in 2014 to boost capacity among countries and regional economic communities to prepare transnational infra-structure projects. The key mandate is to provide experts to develop Programme for Infrastructure Development in Africa projects to the level where feasibility studies can be undertaken. It focuses on providing small grants to support early project-preparatory activities.
The Abidjan–Lagos Corridor provides a good example of efforts to strengthen legal frameworks and institutional arrangements. The Heads of State and Government of Benin, Côte d’Ivoire, Ghana, Nigeria and Togo signed a treaty for modernizing the corridor in March 2014. This entails expanding the existing road into a six-lane du-al-carriageway linking the five countries. The treaty es-tablishes a supra-national corridor management organ-ization and a $50 million seed fund to accelerate works. The ECOWAS Commission is spearheading efforts.
Roads
Africa has made progress in expanding and improv-ing the quality of its road networks in recent years, al-though this is not generally acknowledged due, partly, to the paucity of data. The size of the road network in Ethiopia, for example, increased from 26,550 km in 1997 to 85,966 km in 2013 (an increase of 224 per cent). As a result, the road density per 100 square km of the coun-try increased from 2.4 km in 1997 to 7.8 km in 2013. The
Box 2.2.
Innovative approaches to financing infra-structure projects
Regional cooperation is emerging across Africa, with the regional economic communities playing a central role. They obtain funds from development partners, notably the African Development Bank, on behalf of member States who sign an intergovern-mental agreement indicating their commitment to push through with a project. The funds support the preparatory phase of projects, including feasibility studies and detailed design. The terms of reference for consultants to undertake studies or advisory ser-vices are approved by all member States concerned. Committees made up of representatives of the mem-ber States are involved in supervising the prepara-tory work and reviewing the reports. This model has been applied successfully by ECCAS, ECOWAS and EAC. It has also been applied by COMESA through the COMESA/EAC/SADC Tripartite Project Prepara-tion and Implementation Unit.
At national level, African governments are adopting innovative approaches. A good example is Kenya where a PPP is financed by domestic banks (with loans guaranteed by the government) and imple-mented by Kenyan firms.
31
CENTRAL EASTERN NORTH SOUTHERN WEST TOTAL
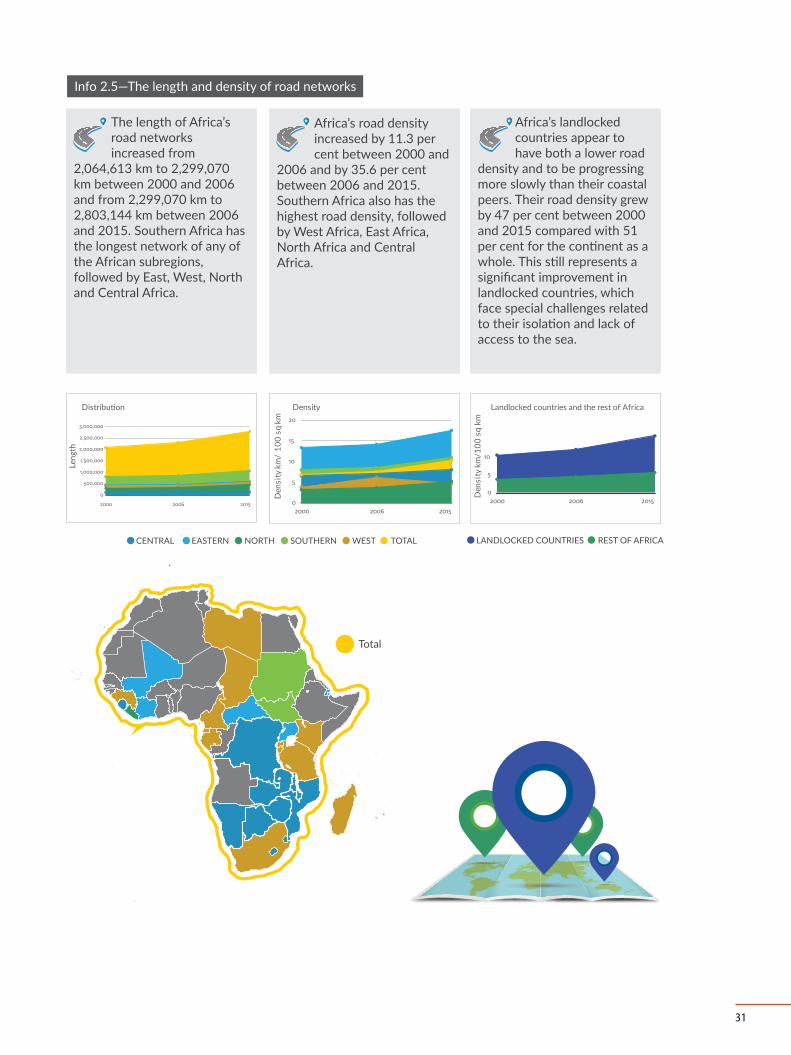
Info 2.5—The length and density of road networks
Density
0
5
10
15
20
2000 2006 2015
Den
sity
km
/ 10
0 sq
km
The length of Africa’s road networks increased from
2,064,613 km to 2,299,070 km between 2000 and 2006 and from 2,299,070 km to 2,803,144 km between 2006 and 2015. Southern Africa has the longest network of any of the African subregions, followed by East, West, North and Central Africa.
Africa’s road density increased by 11.3 per cent between 2000 and
2006 and by 35.6 per cent between 2006 and 2015. Southern Africa also has the highest road density, followed by West Africa, East Africa, North Africa and Central Africa.
Africa’s landlocked countries appear to have both a lower road
density and to be progressing more slowly than their coastal peers. Their road density grew by 47 per cent between 2000 and 2015 compared with 51 per cent for the continent as a whole. This still represents a significant improvement in landlocked countries, which face special challenges related to their isolation and lack of access to the sea.
0
500,000
1,000,000
1,500,000
2,000,000
2,500,000
3,000,000
2000 2006 2015
Leng
th
Distribution
Total
LANDLOCKED COUNTRIES REST OF AFRICA
0
5
10
2000 2006 2015
Den
sity
km
/100
sq
km
Landlocked countries and the rest of Africa
32
proportion of the road network in good condition there also shot up from 22 per cent in 1997 to 70 per cent in 2013. Countries with the highest proportion of paved roads were, in descending order, Lesotho, Zambia, Sey-chelles, Comoros, Egypt and Rwanda.
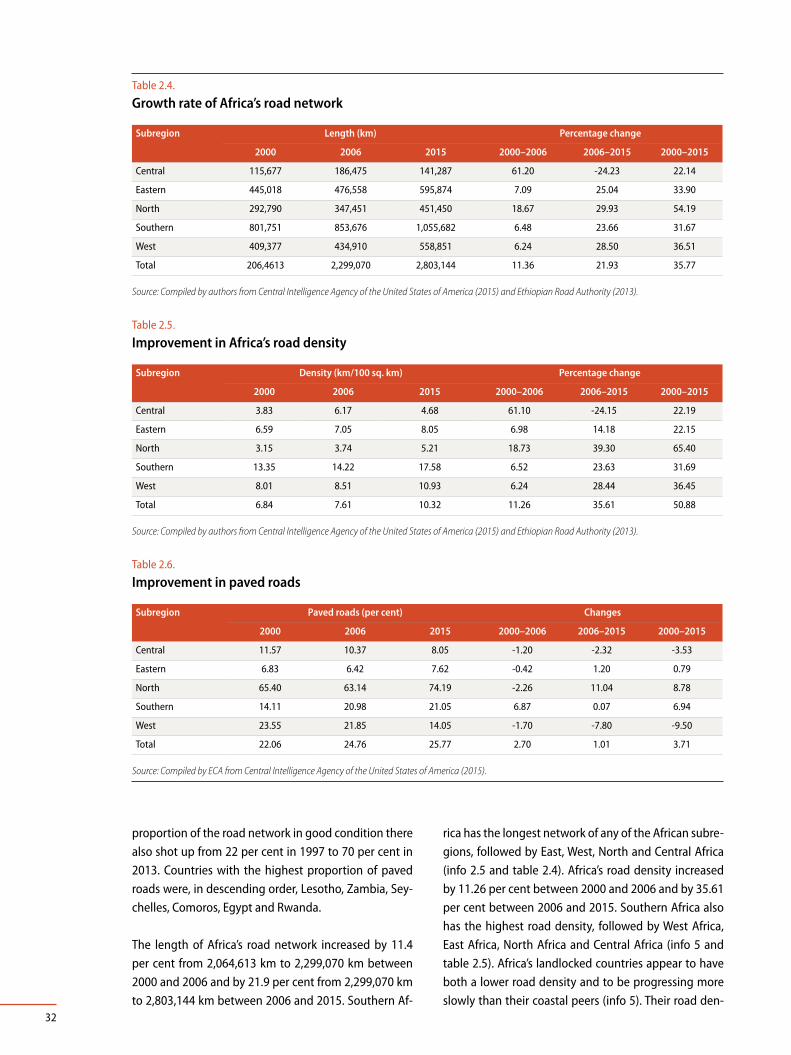
The length of Africa’s road network increased by 11.4 per cent from 2,064,613 km to 2,299,070 km between 2000 and 2006 and by 21.9 per cent from 2,299,070 km to 2,803,144 km between 2006 and 2015. Southern Af-
rica has the longest network of any of the African subre-gions, followed by East, West, North and Central Africa (info 2.5 and table 2.4). Africa’s road density increased by 11.26 per cent between 2000 and 2006 and by 35.61 per cent between 2006 and 2015. Southern Africa also has the highest road density, followed by West Africa, East Africa, North Africa and Central Africa (info 5 and table 2.5). Africa’s landlocked countries appear to have both a lower road density and to be progressing more slowly than their coastal peers (info 5). Their road den-
Table 2.4.
Growth rate of Africa’s road network
Subregion Length (km) Percentage change
2000 2006 2015 2000–2006 2006–2015 2000–2015
Central 115,677 186,475 141,287 61.20 -24.23 22.14
Eastern 445,018 476,558 595,874 7.09 25.04 33.90
North 292,790 347,451 451,450 18.67 29.93 54.19
Southern 801,751 853,676 1,055,682 6.48 23.66 31.67
West 409,377 434,910 558,851 6.24 28.50 36.51
Total 206,4613 2,299,070 2,803,144 11.36 21.93 35.77
Source: Compiled by authors from Central Intelligence Agency of the United States of America (2015) and Ethiopian Road Authority (2013).
Table 2.5. Improvement in Africa’s road density
Subregion Density (km/100 sq. km) Percentage change
2000 2006 2015 2000–2006 2006–2015 2000–2015
Central 3.83 6.17 4.68 61.10 -24.15 22.19
Eastern 6.59 7.05 8.05 6.98 14.18 22.15
North 3.15 3.74 5.21 18.73 39.30 65.40
Southern 13.35 14.22 17.58 6.52 23.63 31.69
West 8.01 8.51 10.93 6.24 28.44 36.45
Total 6.84 7.61 10.32 11.26 35.61 50.88
Source: Compiled by authors from Central Intelligence Agency of the United States of America (2015) and Ethiopian Road Authority (2013).
Table 2.6.
Improvement in paved roads
Subregion Paved roads (per cent) Changes
2000 2006 2015 2000–2006 2006–2015 2000–2015
Central 11.57 10.37 8.05 -1.20 -2.32 -3.53
Eastern 6.83 6.42 7.62 -0.42 1.20 0.79
North 65.40 63.14 74.19 -2.26 11.04 8.78
Southern 14.11 20.98 21.05 6.87 0.07 6.94
West 23.55 21.85 14.05 -1.70 -7.80 -9.50
Total 22.06 24.76 25.77 2.70 1.01 3.71
Source: Compiled by ECA from Central Intelligence Agency of the United States of America (2015).

33
sity grew by 47 per cent between 2000 and 2015 com-pared with 51 per cent for the continent as a whole. This, notwithstanding, still represents a significant im-provement in landlocked countries, which face special challenges related to their isolation and lack of access to the sea.
Africa has the highest risk of death from road traffic in-jury globally (24.1 per 100,000 population); Europe has the lowest (10.3). The African Road Safety Action Plan for 2011 to 2020 was adopted in 2011 to address this challenge in the framework of the United Nations Dec-ade of Action for Road Safety.
Inland waterways
Egypt is spearheading construction of a navigable wa-terway linking Lake Victoria in Uganda and the Medi-terranean Sea through the River Nile, as part of the Presidential Infrastructure Champion Initiative. The pre-feasibility study of the transport corridor has been completed and efforts are considering feasibility stud-ies. Phase 1 of the project will comprise the section from Lake Albert in Uganda to Khartoum in Sudan; the section from Gambela in Ethiopia to the White Nile in South Sudan; and the section from Khartoum to As-wan in Egypt. Phase 2 will cover the section from Lake Victoria to Lake Albert, and the section between the Blue Nile in Ethiopia and the Main Nile in Sudan. One of the project’s components is to establish navigation management training centres in some of the footprint states, based on the Egyptian experience.
Multimodal transport
The corridor approach to regional transport develop-ment is well established in Africa. Multimodal options are increasing, exemplified by the Lamu Port–Southern Sudan–Ethiopia Transport Corridor Project. Its construc-tion was launched in March 2012 at the site of Lamu port in Kenya. The initiative—Lamu Port; the Lamu Port–Southern Sudan–Ethiopia Transport Corridor Pro-ject railway; the Lamu Port–Southern Sudan–Ethiopia Transport Corridor Project highway; oil pipeline; oil refinery; resort cities; and Lamu Airport—has an esti-mated investment cost of $16.4 billion. The detailed engineering designs for three berths and associated infrastructure have been completed for Lamu port and funds are in hand to start construction. About 365 km of the Lamu Port–Southern Sudan–Ethiopia Transport
Corridor Project road in Kenya and Ethiopia has been completed; work is ongoing on several other sections. The construction of the Lamu Port–Southern Sudan–Ethiopia Transport Corridor Project railway is on course, the Kenyan government having signed a memorandum of understanding with the China Civil Engineering Con-struction Corporation in October 2014. The railway’s preliminary design and feasibility study have been completed.
Railways
African countries are revamping their railway networks, including those with a regional dimension. For instance, construction is underway on the Djibouti–Ethiopia rail-way, while Kenya is making progress on the Momba-sa–Nairobi railway, the first phase of a standard-gauge project that will connect Kenya, Uganda, Rwanda and South Sudan (Government of Kenya, 2015). Construc-tion of the 609-km line began in 2013 and is expected to be completed in 2018. The West African Economic and Monetary Union is spearheading the construction of the Dakar–Bamako rail project, part of The Presiden-tial Infrastructure Champion Initiative and at the phase of preliminary studies.
One of the flagship projects of Agenda 2063 is to connect all African capitals and commercial centres through the Africa Integrated High Speed Train Net-work, incorporating existing networks. Many countries have national projects: for example, construction of the Abuja–Kaduna rail line in Nigeria started in 2011 and was completed in 2014, and in Ethiopia, a new railway line is being built between Awash and Woldia, and is ex-pected to be completed in 2015.
Energy
Given the importance of energy access for industriali-zation, and of the latter for regional value chains in Af-rica and ultimately continental development, energy is critical to regional integration. The Programme for Infra-structure Development in Africa supports cooperation on energy infrastructure.
The Programme for Infrastructure Development in Af-rica remains the flagship for revamping and modern-izing infrastructure, including energy, where it aims to provide modern energy for all African households, businesses and industries by developing efficient, reli-
34
able, cost-effective and environmentally friendly infra-structure to help eradicate poverty and ensure vigorous sustainable development. Programme for Infrastruc-ture Development in Africa’s Priority Action Plan has 15 energy projects for a cost of $40.3 billion (excluding the Nigeria–Algeria Gas Pipeline).
Numerous cross-border energy initiatives are driven mainly by regional economic communities or bilater-al agreements between countries. Increasingly, and in response to the international trends, they support re-sponsible and cleaner energy, often renewable or effi-cient sources.
The Africa Clean Energy Corridor initiative aims to in-crease deployment of renewable energy substantially, reducing carbon emissions and dependence on import-ed fossil fuels, and leading to more sustainable and cli-mate-resilient growth. Regional demand for electricity is expected to more than double in the next quarter century. The initiative aims to meet half of total elec-tricity demand from clean, indigenous, cost-effective renewable resources by 2030. Its action agenda was endorsed by ministers representing 19 countries of the Eastern African and Southern African power pools in January 2014. Implementation will enable countries in the initiative to fully consider cost-effective renewable power options and develop enabling frameworks to at-tract investment.
Several African regional economic communities have adopted masterplans on how to increase generation capacity and energy access. For example, the ECOWAS Renewable Energy Investment Initiative—set up by the ECOWAS Centre for Renewable Energy with finan-cial institutions and other private companies—aims to mitigate financial barriers to investment in medium and large renewable energy projects and businesses in ECOWAS. It assists member countries to make use of their renewable energy potential by providing support to develop a technical and economically feasible pipe-line of projects and to attract the interest of investors and financiers. Other regional economic communities have similar initiatives.
Evidence of cooperation among countries on develop-ing oil and gas pipelines is substantial:
• A feasibility study on a pipeline to carry natural gas from Mozambique to South Africa and other neigh-
bouring SADC member countries and to Mozam-bican towns en route (SacOil, 2014).
• Further development of the West Africa Gas Pipeline that transports cheaper and more environmentally friendly gas from Nigeria to Benin, Ghana and Togo (World Bank, 2015; Oil & Gas Financial Journal, 2015).
Box 2.3.
The Grand Ethiopian Renaissance Dam
Ethiopia is constructing a hydroelectric dam to ex-port electricity to other regional countries. The dam will have an installed capacity of 6,000 megawatts and will produce an estimated 15,000 gigawatt hours a year (Salini Impregilo, 2015; Ethiopian Elec-tric Power Company, 2015). This is roughly equal to Ethiopia’s entire current electricity consumption, suggesting that much of this electricity will be ex-ported to other countries, especially as Ethiopia is constructing other hydroelectric power stations (Massachusetts Institute of Technology, 2015b). Dji-bouti and Kenya already have agreements on trade in energy with Ethiopia, and Kenya has committed to purchase 400 megawatts of energy from Ethiopia. Eritrea, South Sudan and Uganda, too, could benefit from the dam’s electricity.
Coordination will be required between Egypt and Ethiopia on the operations of this dam and Egypt’s Aswan High Dam, to ensure equitable access to Nile waters, especially when reservoirs are being filled or drought is prolonged (Massachusetts Institute of Technology, 2015a).
The dam’s financing is unusual: Ethiopia and its di-aspora are financing most of the cost through dias-pora bonds, local bonds and revenues from electric-ity sales (Government of Ethiopia, 2015a; The Africa Report, 2015). China is providing a loan to finance building of power transmission lines from the dam to the town of Holeta (Government of Ethiopia, 2015b).
The Ethiopian government aims to complete con-struction of the main dam by June 2016, while the entire project is scheduled for completion by the end of February 2017 (Government of Ethiopia, 2015a; Salini Impregilo, 2015).

35
• Construction of the Horn of Africa Pipeline that will transport jet fuel, diesel and gasoline from the Port of Djibouti to Ethiopia, expected to be fully op-erational in the first quarter of 2018 (Black Rhino Group, 2015).
• Construction of a heated oil pipeline from Uganda to the Indian Ocean, serving Kenya, South Sudan, Uganda and possibly Ethiopia en route. The project is expected to be completed in 2020 (Kuo, 2015; World Bank, 2015a).
• Work on the Trans-Sahara Gas Pipeline, expected to transport gas from the Niger Delta to Europe (Cor-ner, 2014).
Total net imports of intra-African electricity increased by around 2.5 per cent a year between 2007 and 2011. Based on the most recent data, Morocco, Zimbabwe, Burkina Faso and Libya are the largest net importers per capita. Production-wise, the continent’s capacity (in megawatts) increased by around 3.7 per cent a year between 2007 and 2011. Per capita production capacity rose by around 1 per cent a year on average between 2008 and 2011.10
Communications
Greater internet connectivity allows Africans from across the continent to sell online services to one anoth-er and to support social and cultural integration. Inter-net bandwidth per capita in Africa grew at an average of 57 per cent annually between 1995 and 2013, slow-ing to 39 per cent between 2012 and 2013. Kenya has the largest bandwidth per capita, followed by Morocco, Seychelles, Mauritius and Tunisia.11 In mobile telecoms, African governments are taking steps to reduce the cost of roaming through closer cooperation (box 2.4).
Partners in Africa’s infrastructure
China is the biggest investor in African infrastructure. Its lending to African countries, excluding North Africa, was estimated at $13.4 billion in both 2012 and 2013. Most of this was on transport, particularly railway pro-jects in East Africa. Premier Li Keqiang underscored his country’s interest in a speech at the African Union Commission in May 2014, where he announced Chi-na’s desire to scale up its direct investment in Africa to $100 billion and stressed that China would deepen its involvement in regional infrastructure projects. He also emphasized that China would assist Africa in building the high-speed railway network.
Box 2.4.
Cooperation to reduce roaming charges
Numerous studies have highlighted the positive im-pact that the mobile sector has for economic growth and total factor productivity. In Africa, however, roam-ing charges are high and vary widely. To reduce their cost, governments and regional economic communi-ties are trying out innovative measures to apply the local mobile rate to a user even when abroad. This entails the “home and away” roaming concept that eliminates all international mobile roaming charges for post- and pre-paid customers, and outbound and inbound calls.
Regional frameworks of countries that have agreed to waive or manage roaming charges and other sur-charges for such traffic have been adopted. In 2010, ECCAS launched a project to bring roaming rates clos-er to local rates within the region. In 2014 following
the directives of Head of States, SADC adopted home and away roaming using the “Roam Like at Home” principle (for voice, messaging and data) within the region.
In January 2015, Kenya, Uganda, Rwanda and South Sudan launched the East African “One Area Network” for mobile operators. This seeks to harmonize regional calling rates and lower costs between partner states. East Africa has moved much faster than other subre-gions on this, and the One Area Network’s launch has boosted voice traffic within the region and cut busi-ness costs. Some estimates suggest mobile phone traffic grew 935 per cent in three months after the launch, when calling costs were cut by over 60 per cent. Given this success, policy makers are seeking to extend the arrangement to mobile data and mobile money transfers.

36
Africa’s traditional partners have continued to fund infrastructure projects, but their investment is now nowhere near China’s (table 2.7). In 2013, the Europe-an Union and France committed $1.6 and $2.5 billion, while the United Kingdom and Germany committed $1 billion each. The United States committed $7 billion to the energy sector via its multi-year Power Africa Initia-tive (box 2.5). In 2013, donor commitments to Africa’s regional infrastructure projects were estimated at $3.7
billion, of which $887 million (24 per cent) went to Pro-gramme for Infrastructure Development in Africa pro-jects. That year, the European Union doubled its com-mitments to such projects to $456 million. Similarly, the African Development Bank’s commitment increased by 38 per cent (from $327 million in 2010 to $1.1 billion in 2013) while that of the United Kingdom increased by 50 per cent (the Infrastructure Consortium for Africa, 2014).
Table 2.7.
Top investors in Africa’s infrastructure, 2013
Country/Institution $ million
China 13,443
United States 7,008
World Bank Group 4,533
African Development Bank 3,565
France 2,542
European Commission 1,628
Islamic Development Bank 1,604
Japan 1,515
Development Bank of Southern Africa 1,155
European Investment Bank 1,077
United Kingdom 1,068
Germany 1,031
Banque Ouest Africaine de Développement 876
India 761
Arab Fund for Economic and Social Development 614
Organization of the Petroleum Exporting Countries Fund for International Development 363
Kuwait Fund for Arab Economic Development 360
Saudi Fund for Development 182
Republic of Korea 175
Canada 147
Arab Bank for Economic Development in Africa 102
East Africa Development Bank 92
Abu Dhabi Fund for Development 71
ECOWAS Bank for Investment & Development 60
Source: The Infrastructure Consortium for Africa (2014).
37
Mining and the Africa Mining Vision
Regional economic communities’ efforts to harmonize mining codes have increased, emphasizing the need for transparent regulatory frameworks and efficient admin-istrative systems, including one-stop shops for mineral licensing. Most regional economic communities, nota-bly ECOWAS, SADC and EAC (box 2.6), have taken initial steps towards harmonizing national policies, laws and regulations and to developing common standards to create a uniform business environment for investors.
The ECOWAS Mineral Development Policy, confirmed by ECOWAS Ministers in June 2011, was developed as a regional initiative. It was preceded by the 2009 ECOWAS Mining Directive, which has been gazetted by a number of countries. The Policy envisions exploiting minerals as a key element of industrialization-driven structural transformation. It also accepts the need for far-reaching reforms in overall governance of the mineral economy and greater accountability of firms and governments, as
well as an end to discrimination against artisanal and small-scale mining.
In 2006, SADC adopted a Framework for the Harmo-nization of Mining Policies Standards and Regulatory Frameworks. This comprises policy guidelines in key areas of the SADC mineral economy: mineral develop-ment issues such as mineral rights, value addition and artisanal and small-scale mining; and the macroeco-nomic and business climate (tax, governance, environ-mental management and social issues, and so on).
Challenges for implementation at subregional level in-clude regional economic community secretariats’ lack of capacity to support national roll-out; a grounding in moral suasion, not law; loosely defined time-bound ac-tivities; few national monitoring and evaluation (M&E) frameworks; and generally slow domestication of the Africa Mining Vision. Regional economic communities can build stronger constituencies to support account-ability in pursuing reforms.
Box 2.5.
The United States Power Africa Initiative
The Power Africa Initiative is an effort by the United States government to encourage private investment in Africa’s energy infrastructure via the private sector and technical cooperation with African governments on reforming electricity sector regulations. It aims to increase production capacity by 30,000 megawatts across the continent, focusing on more environmen-tally friendly generation.
The initiative facilitates contracts with the private sector that are expected to add 4,100 megawatts to Africa’s electricity generation capacity. It is working on other projects that could add a further 20,000 mega-watts (United States Agency for International Devel-opment, 2015). The initiative has secured a total com-mitment of around $35 billion to finance investments in Africa’s energy infrastructure, building on an initial commitment of $7 billion from the United States gov-ernment (United States Agency for International De-velopment, 2015). Power Africa also supports regional energy moves, including the West Africa and East Afri-ca power pools United States Agency for International Development.
The African Development Bank ($3 billion), the private sector ($20 billion), the Swedish government ($1 bil-lion) and the World Bank Group ($5 billion) commit-ted the remaining financing (United States Agency for International Development, 2015). That government, through the Swedish International Development Co-operation Agency, is also supporting regional energy cooperation through capacity building and institu-tional support to the Southern Africa Power Pool, East Africa Power Pool, and the Nile Equatorial Lakes Sub-sidiary Action Program United States Agency for Inter-national Development.
In September 2014, the New Economic Partnership for Africa’s Development signed a memorandum of un-derstanding on cooperation with Power Africa, allow-ing them to work together better on the African Power Vision and its regional and other transformational en-ergy projects (United States Agency for International Development, 2015).
38
The Africa Mining Vision advocates a “transparent, eq-uitable and optimal exploitation of mineral resources to underpin broad-based sustainable growth and so-cio-economic development” and was adopted by Af-rican Heads of States and Government in 2009. It pro-vides a strategy for the vital role of mining and minerals in assisting African countries achieve their development goals (box 2.7).
Much progress has been made with the Africa Mining Vision’s roll-out. The African Minerals Development Centre was launched by the African Union Ministers Responsible for Mineral Resource Development in De-cember 2013 to provide strategic operational support for the Africa Mining Vision and its Action Plan. Its mis-sion is to work with member States and their national and regional organizations to promote the transform-ative role of mineral resources in the development of
the continent through increased economic and social linkages.
Using tools such as the Country Mining Vision guide-book,12 the Centre provides technical advice to mem-ber States to improve their mineral-resource policies; establish appropriate institutional, legal and regulatory frameworks; and invest in human resources, research and development (R&D; box 2.8), and geological and geophysical data critical for managing mineral resourc-es well. Its work has achieved several goals:
• Harmonized policies at national, subregional and continental levels;
• Improved capacity of African states and regional economic communities to mainstream minerals sector development into national programmes;
Box 2.6.
Mining in EAC
In its development strategy 2011/2012–2015/2016, the EAC articulated its desire to harmonize mineral policies and mining regimes. The strategy calls upon member States to take measures to promote devel-opment of strategic regional industries/value chains including extractive and mineral processing, petro-chemicals and gas processing, and iron and steel.
The strategy notes that lack of coordination in pro-moting and developing value chains along regional dimensions and the absence of regional frameworks for establishing and supporting investments in strate-gic regional industries hamper development of indus-tries in which the region has a comparative advantage.
Strategic regional industries/value chains, particular-ly in extractive-mineral value-adding industries, are
anticipated to spur growth of downstream industries, build backward and forward linkages across the re-gion, and position the region on the path to sustain-able growth, but policy and legislative frameworks need to be harmonized first.
Having recognized the challenges, the African Mining Development Centre (see main text) is supporting EAC in reviewing these frameworks for its mineral sec-tor. Support includes analysis of the frameworks for EAC member States, and collaboration with member States to review and align their frameworks with the Africa Mining Vision. Kenya and Uganda have already benefited from technical support from the Centre. The United Republic of Tanzania is an Africa Mining Vision country with arrangements to provide continuing technical support.

39
• Enhanced capacity for mineral policy assessment and analysis and for negotiating mineral contracts;
• Strengthened R&D capacity and stronger linkages and diversification in the minerals sector; and
• Enhanced capacity for revenue collection, manage-ment, transparency, accountability and community engagement.
Box 2.7.
The Africa Mining Vision
The Vision describes the features of the future miner-als sector:
• A knowledge-driven African mining sector that ca-talyses and contributes to the broad-based growth and development of, and that is fully integrated into, a single African market through: - Downstream linkages into mineral beneficiation
and manufacturing. - Upstream linkages into mining capital goods,
consumables and services industries. - Sidestream linkages into infrastructure (power,
logistics, communications and water) and skills and technology development.
- Mutually beneficial partnerships between the state, the private sector, civil society, local com-munities and other stakeholders.
- A comprehensive knowledge of its mineral en-dowment.
• A sustainable and well-governed mining sector that effectively garners and deploys resource rents and that is safe, healthy, gender and ethnically in-clusive, environmentally friendly, socially responsi-ble and appreciated by surrounding communities.
• A mining sector that has become a key component of a diversified, vibrant and globally competitive industrializing African economy.
• A mining sector that has helped establish a com-petitive African infrastructure platform, through the maximization of its propulsive local and re-gional economic linkages.
• A mining sector that optimizes and husbands Afri-ca’s finite mineral resource endowments and that is diversified, incorporating both high-value met-als and lower-value industrial minerals at commer-cial and small-scale levels.
• A mining sector that harnesses the potential of artisanal and small-scale mining to stimulate lo-cal and national entrepreneurship, improve live-lihoods and advance integrated rural social and economic development.
• A mining sector that is a major player in vibrant and competitive national, continental and interna-tional capital and commodity markets.
Source: African Union Commission and ECA (2009).
40
Peace and security
African countries have established extensive coopera-tion in peace and security matters:
• Multinational African forces regained control of most of the territory of Somalia from the terrorist group Al-Shabab.
• African countries contribute 45,828 personnel to United Nations peacekeeping operations in Africa (United Nations, 2015).
• African countries have authorized multinational forces to combat Boko Haram, including crossing borders in pursuit of the terrorist group without needing to seek further confirmation.
• IGAD has been the main mediation forum between the parties to civil conflict in South Sudan.
• The African Union has taken over leadership of in-ternational peacekeeping efforts in the Central Af-rican Republic through the African-led International Support Mission there. By the end of February 2014, the force’s African contingent amounted to 6,000 troops (African Union Commission, 2015c).
• Regional leaders helped to persuade leaders of a military coup d’état in Burkina Faso in 2015 to step down and return the country to civilian rule.
• ECOWAS and the African Union achieved joint suc-cess in similar circumstances in Mali in 2012.
African countries are cooperating on health. One ex-ample is the Ebola virus disease outbreak. Once the outbreak was confirmed, a consortium of scientists in Sierra Leone, Nigeria, the United Kingdom and the Unit-ed States quickly sequenced and published the full ge-nome of 98 samples. These data were among the first to signal that the virus was changing or adapting rapidly, a development that could have an impact on diagnosis, treatment and outbreak management (Gire, 2014).
After the International Conference on Africa’s Fight against Ebola, African countries have made commit-ments to support strengthening of health systems in the most affected countries, including human resources and infrastructure (African Union Commission, 2015d).
Box 2.8.
Mintek’s role in R&D
Mintek—the Council for Mineral Technology of South Africa—is a research, development, testing and evaluation public institution active in multi-ple African countries with huge mining operations where its core technologies and services are need-ed. It provides process and control, equipment and technologies, and research on economic and region-al studies. In 2014 alone, Mintek sold products to or provided services to industry in Burkina Faso, Côte d’Ivoire, Ghana, Kenya, Malawi, the United Republic of Tanzania, Zambia and Zimbabwe.
Mining is not environmentally friendly, employing harsh chemicals, consuming huge amounts of ener-gy and excavating massive amounts of land. Mintek has been at the forefront of developing bioleaching technologies for base metals and sulphide ores over the past 30 years, leading to proprietary technol-ogies. These biotechnology-based processes have replaced or reduced the use of some of the most pol-luting chemicals, such as cyanides. Mintek’s current work on mine regeneration, and recovery of polluted land and water from mining, could help ensure sus-tainable use of natural resources.
The hallmark of Mintek’s success is its close collabo-ration with industry, in partnerships forged through highly skilled and experienced staff. The average industrial experience of a scientist at Mintek is four years. To keep its workforce skilled, about 55 mem-bers of staff were enrolled in postgraduate training (master’s degree and higher) in 2013/2014.
41
References
African Development Bank. 2013. “Africa’s Institutions Endorse African Development Bank’s Africa50 Fund to Support Infrastructure Financing.” www.African-DevelopmentBank.org/en/news-and-events/article/africas-institutions-endorse-AfricanDevelopment-Banks-africa50-fund-to-support-infrastructure-financ-ing-12132.
——. 2015a. “Infrastructure: Africa50, a Step Change for Infrastructure Financing and Development in Africa.” www.afdb.org/en/news-and-events/article/infrastruc-ture-africa50-a-step-change-for-infrastructure-financ-ing-and-development-in-africa-14557.
——. 2015b. “Investments.” www.afdb.org/en/top-ics-and-sectors/initiatives-partnerships/africa50/about-us/investments.
——. 2015c. “Objectives.” www.afdb.org/en/top-ics-and-sectors/initiatives-partnerships/africa50/about-us/objectives.
AMU (Arab Maghreb Union). 2015. “Intégration économique maghrébine.” Paper prepared by the AMU Secretariat, undated but sent to ECA on 9 September 2015. Rabat Arab Maghreb Union.
African Union. 2015. “Dedicated Session of Experts and Senior Officials followed by Ministers of Trade on the Continental Free Trade Area 08–15 May 2015 Addis Ababa, Ethiopia: Report of Meeting of Ministers.” Addis Ababa.
——. 2015a. “Decision on the Launch of Continental Free Trade Area Negotiations.” Document number As-sembly/AU/11(XXV). Addis Ababa.
African Union Commission. 2010a. “Minimum Integra-tion Programme 2009–2012.” Addis Ababa.
——. 2015a. Agenda 2063 popular version, Addis Aba-ba: African Union Commission.
——. 2015b. “Program Infrastructure Development for Africa.” http://pages.au.int/infosoc/pages/program-in-frastructure-development-africa-pida.
——. 2015c. Email communication from official with the African Union Commission Defence and Security Di-vision, dated 12.8.2015, subject “RE: Overview report on African peace and security cooperation?”
——. 2015d. “International Conference on Africa’s Fight Against Ebola: “Africa Helping Africans in Eb-ola Recovery and Reconstruction.” http://pages.au.int/ebola/events/international-conference-afri-ca%E2%80%99s-fight-against-ebola-%E2%80%9Cafri-ca-helping-africans-ebola-re.
African Union Commission and ECA (Economic Com-mission for Africa). 2009. The Africa Mining Vision. http://africaminingvision.org.
Black Rhino Group. 2015. “Projects.” http://black-rhinogroup.com/portfolio/horn-of-africa-pipeline.
Brookings Institution. 2012. Accelerating Growth Through Improved Intra-African Trade. Washington, DC: Brookings Institution.
——. 2014. Hearing on “Will there be an African Eco-nomic Community?” www.brookings.edu/research/tes-timony/2014/01/09-african-economic-community-sy.
Business Daily. 2015. “More COMESA members scrap visa requirement for travellers.” http://www.business-dailyafrica.com/More-Comesa-members-scrap-visa-requirement-for-travellers/-/1248928/2641492/-/2vl-nooz/-/index.html.
Central Intelligence Agency of the United States of America. 2015. The World Factbook 2013–14. Washing-ton, DC: Central Intelligence Agency. https://www.cia.gov/library/publications/the-world-factbook/index.html.
Corner, E. 2014. “Africa Pipeline Update: July 2014.” World Pipelines. http://www.energyglobal.com/pipe-lines/business-news/21072014/Africa-pipeline-up-date-July-2014-657.
ECOWAS (Economic Community of West African States) Commission. 2015. “ECOWAS Common External Tariff (CET) and the ECOWAS Trade Liberalization Scheme (ETLS) on the Free Movement of Agricultural Product.” Abuja.

42
——. 2015b. Statement made at the ECOWAS Council of Ministers, May 2015, Accra ECOWAS.
Ethiopian Electric Power Company. 2015. “About Grand Ethiopian Renaissance Dam.” www.eepco.gov.et/about-theproject.php?pid=1.
Ethiopian Roads Authority. 2013. RSDP Performance. Ad-dis Ababa.
Government of Ethiopia. 2015a. “Grand Ethiopian Re-naissance Dam.” Addis Ababa. www.ethiopianconsla.org/Documents/BONDINFORMATION.pdf.
——. 2015b. “Renaissance Dam Power Transmission Project gets $1 Billion USD Loan.” www.mfa.gov.et/news/more.php?newsid=1943.
Government of Kenya. 2015. “Good news Kenya.” www.brandkenya.go.ke/news-and-events2.
The Infrastructure Consortium for Africa. 2014. Infra-structure Financing Trends in Africa—2013. Tunis: The Infrastructure Consortium for Africa Secretariat c/o Af-rican Development Bank.
International Trade Centre. 2015. Market Access Map database. http://www.macmap.org.
Kuo, L. 2015. “Kenya and Uganda are building the world’s longest heated oil pipeline.” Quartz Africa, 13 August. http://qz.com/478773/kenya-and-uganda-are-building-the-worlds-longest-heated-oil-pipeline.
Kwakye, F. 2015. Statement by Felix Kwakye, Senior Offi-cial of the ECOWAS Commission, cited from Leadership, 1 July. http://leadership.ng/business/443946/under-standing-ecowas-common-external-tariff.
Luke, D. 2015. “Contribution of Free Movement of Per-sons to the Continental Free Trade Area.” Presented at the IOM (International Organization for Migration) and ECA (Economic Commission for Africa) Intra-Regional Forum, Accra, 16–18 September, 2015.
Luke, D., and Z. Mabuza. 2015. “The Tripartite Free Trade Area Agreement: A Milestone for Africa’s Regional Inte-gration Process.” Bridges Africa 4(6). International Centre for Trade and Sustainable Development, Geneva. www.ictsd.org/bridges-news/bridges-africa/news/the-tri-
partite-free-trade-area-agreement-a-milestone-for-af-rica%E2%80%99s.
Luke, D., and B. Sodipo. 2015. “Launch of the Continen-tal Free Trade Area: New Prospects for African trade?” Bridges Africa 4(6). International Centre for Trade and Sustainable Development, Geneva. www.ictsd.org/bridges-news/bridges-africa/news/launch-of-the-con-tinental-free-trade-area-new-prospects-for-african.
Massachusetts Institute of Technology. 2015a. “In-ternational Experts Analyze Impacts of Ethiopian Dam.”http://news.mit.edu/2015/grand-ethiopian-re-naissance-dam-report-0422.
——. 2015b. “The Grand Ethiopian Renaissance Dam: An Opportunity for Collaboration and Shared Benefits in the Eastern Nile Basin. An Amicus Brief to the Ripar-ian Nations of Ethiopia, Sudan and Egypt from the In-ternational, Non-Partisan Eastern Nile Working Group Convened at the Massachusetts Institute of Technology on 13–14 November 2014.” http://jwafs.mit.edu/sites/default/files/documents/GERD_2014_Full_Report.pdf.
Mold, A., and R. Mukwaya. “The Effects of the Tripartite Free Trade Area: Towards a New Economic Geography in Southern, Eastern and Northern Africa?” Centre for Research in Economic Development and International Trade paper 15/04. Cited by ECA (Economic Commission for Africa). 2015c. “Tripartite Agreement Could Boost Intra-Regional Trade by One Third.” www.uneca.org/stories/tripartite-agreement-could-boost-intra-region-al-trade-one-third.Kigali: ECA.
Organization of African Unity. 1991. The Treaty Estab-lishing the African Economic Community. Addis Ababa.
Oil & Gas Financial Journal. 2015. “ECOWAS, Penspen to Study Extending Gas Pipeline Network in West Africa.” www.ogfj.com/articles/2015/06/ecowas-penspen-to-study-extending-gas-pipeline-network-in-west-africa.html.
SacOil. 2014. “Joint Development Agreement for Gas Pipeline.” www.sacoilholdings.com/investor-centre/company-announcements/joint-development-agree-ment-for-gas-pipeline/?id=14&entryId=379.
Salini Impregilo. 2015. “Grand Ethiopian Renaissance Dam Project.” www.salini-impregilo.com/en/pro-

43
jects/in-progress/dams-hydroelectric-plants-hydrau-lic-works/grand-ethiopian-renaissance-dam-project.html.
The Africa Report. 2015. “Ethiopia’s Progress and Zeal.” www.theafricareport.com/East-Horn-Africa/ethiopi-as-progress-and-zeal.html.
UNCTAD (United Nations Conference on Trade and De-velopment). 2015a. Economic Development in Africa Re-port 2015. Geneva.
——. 2015b. Economic Development in Africa Report 2015. Geneva.
UNCTADStat. 2014. UNCTADStat database. unctadstat.unctad.org.
UNCTADStat. 2015. UNCTADStat database. unctadstat.unctad.org.
United Nations. 2015. “UN Mission’s Summary Detailed by Country.” www.un.org/en/peacekeeping/contribu-tors/2015/jun15_3.pdf.
ECA (Economic Commission for Africa). 2014. Trade Fa-cilitation from an African Perspective. Addis Ababa.
——. 2015. Economic Report on Africa 2015. Addis Aba-ba.
——. 2015a. “Intra-African Trade and Africa Regional Integration Index.” Report for the ninth session of the Committee on Regional Cooperation and Integration, Economic Commission for Africa, Addis Ababa, Ethiopia.
ECA (Economic Commission for Africa) and African Un-ion Commission (African Union Commission). 2013. Eco-nomic Report on Africa 2013. Addis Ababa.
——. 2014. Economic Report on Africa 2014. Addis Aba-ba.
——. 2015a. “Report on the State-of-Play of Progress Towards Regional Free Trade Areas (FTAs) at regional economic community Level, Both in the Tripartite and Other regional economic communities.” Paper pre-sented to the eighth conference of African Ministers of Trade, Addis Ababa, Ethiopia, 8–15 May 2015.
——. 2015b. “Report on EPAs.” Paper presented to the eighth conference of African Ministers of Trade, Addis Ababa, Ethiopia, 8–15 May 2015.
——. 2015c. “Report on the Emergence of Mega-Re-gional Trade Agreements and Their Implications for Africa’s Continental Integration.” Paper presented to the eighth conference of African Ministers of Trade, Addis Ababa, Ethiopia, 8–15 May 2015.
ECA (Economic Commission for Africa), African Devel-opment Bank (African Development Bank) and African Union Commission (African Union Commission). 2012. Assessing Regional Integration in Africa V: Towards an Af-rican Continental Free Trade Area. Addis Ababa.
——. 2013. Regional Integration in North Africa 2013: Intraregional Trade and Trade Facilitation. Rabat: United Nations.
United Nations Statistics Division. 2015a. UN Comtrade database. http://comtrade.un.org.
——. 2015b. UN data database. http://data.un.org.
United States Agency for International Development. 2015. Power Africa Annual Report, July 2015.www.usaid.gov/sites/default/files/documents/1860/PA_2015_Re-port_V16_TAGGING_508.pdf.
Valensisi, G., T. Lisinge and S. Karingi. 2014. “Towards an Assessment of the Dividends and Economic Benefits of Successfully Implementing Trade Facilitation Measures at the Level of African regional economic communities.” Paper presented at the Post-Bali Trade Facilitation Sym-posium for African least developed countries, 14–16 May 2014, Mwanza, United Republic of Tanzania.
World Bank. 2015. “3A-West African Gas Pipeline (IDA S/UP).” www.worldbank.org/projects/P082502/3a-west-african-gas-pipeline-ida-sup?lang=en.
——. 2015a. “Republic of Uganda: Leveraging Oil and Gas Industry for the Development of a Competitive Private Sector in Uganda.” www-wds.worldbank.org/external/default/WDSContentServer/WDSP/IB/2015/04/20/000442464_20150420122912/Rendered/PDF/ACS-125280REVIS0itive0Private0Sector.pdf.
