chapter 2 the elements - ubc physics & astronomy | ubc...
TRANSCRIPT

Chapter 2
The Elements
2.1 Categorizing atoms – a history
Although elements such as gold, silver, tin, copper, lead and mercury havebeen known since antiquity, the first scientific discovery of an element oc-curred in 1649 when Hennig Brand discovered Phosphorus. During the next200 years, a vast body of knowledge concerning the properties of elements andtheir compounds was acquired by chemists. By 1869, a total of 63 elementshad been discovered. As the number of known elements grew, scientists be-gan to recognize patterns in properties and began to develop classificationschemes.
2.1.1 Law of Triads
In 1817 Johann Dobereiner noticed that the atomic weight of strontium fellmidway between the weights of calcium and barium, elements possessing sim-ilar chemical properties. In 1829, after discovering the halogen triad com-posed of chlorine, bromine, and iodine and the alkali metal triad of lithium,sodium and potassium he proposed that nature contained triads of elementsthe middle element had properties that were an average of the other twomembers when ordered by the atomic weight (the Law of Triads).
This new idea of triads became a popular area of study. Between 1829 and1858 a number of scientists (Jean Baptiste Dumas, Leopold Gmelin, ErnstLenssen, Max von Pettenkofer, and J.P. Cooke) found that these types ofchemical relationships extended beyond the triad. During this time fluorinewas added to the halogen group; oxygen, sulfur,selenium and tellurium were
15

Chapter 2
grouped into a family while nitrogen, phosphorus, arsenic, antimony, andbismuth were classified as another. Unfortunately, research in this area washampered by the fact that accurate values were not always available.
2.1.2 First Attempts At Designing a Periodic Table
If a periodic table is regarded as an ordering of the chemical elements demon-strating the periodicity of chemical and physical properties, credit for the firstperiodic table (published in 1862) probably should be given to a French ge-ologist, A.E.Beguyer de Chancourtois. De Chancourtois transcribed a list ofthe elements positioned on a cylinder in terms of increasing atomic weight.When the cylinder was constructed so that 16 mass units could be writtenon the cylinder per turn, closely related elements were lined up vertically.This led de Chancourtois to propose that ”the properties of the elements arethe properties of numbers.” De Chancourtois was first to recognize that ele-mental properties reoccur every seven elements, and using this chart, he wasable to predict the stoichiometry of several metallic oxides. Unfortunately,his chart included some ions and compounds in addition to elements.
2.1.3 Law of Octaves
John Newlands, an English chemist, wrote a paper in 1863 which classifiedthe 56 established elements into 11 groups based on similar physical prop-erties, noting that many pairs of similar elements existed which differed bysome multiple of eight in atomic weight. In 1864 Newlands published hisversion of the periodic table and proposed the Law of Octaves (by analogywith the seven intervals of the musical scale). This law stated that any givenelement will exhibit analogous behavior to the eighth element following it inthe table. (see Figure 2.1)
2.1.4 Who Is The Father of the Periodic Table?
There has been some disagreement about who deserves credit for being the”father” of the periodic table, the German Lothar Meyer or the RussianDmitri Mendeleev. Both chemists produced remarkably similar results atthe same time working independently of one another. Meyer’s 1864 textbookincluded a rather abbreviated version of a periodic table used to classify theelements. This consisted of about half of the known elements listed in order of
16

The Elements
Figure 2.1: The Law of Octaves arrangement of elements
Figure 2.2: The periodic ordering of elements according to Meyer
their atomic weight and demonstrated periodic valence changes as a functionof atomic weight. In 1868, Meyer constructed an extended table which hegave to a colleague for evaluation. Unfortunately for Meyer, Mendeleev’stable became available to the scientific community via publication (1869)before Meyer’s appeared (1870) (see Figure 2.2 and Figure 2.3).
While writing a textbook on systematic inorganic chemistry, Principlesof Chemistry, which appeared in thirteen editions the last being in 1947,Mendeleev organized his material in terms of the families of the known el-
17

Chapter 2
Mendeleev's Table
Mendeleev noted patterns in the combining ratios of
elements
! The Elements Lithium (Li), Sodium (Na), and Potassium (K) all formed oxides in the ratio of two atoms per
oxygen atom: R2O
! The Elements Beryllium (Be), Magnesium (Mg), and Calcium (Ca) all formed oxides in the ratio of one atom per
oxygen atom: RO
! Boron (B) and Aluminum (Al) formed R2O3
! Carbon (C) and Silicon (Si) formed RO2
Recognizing the patterns of combining ratios or "valency", Mendeleev created a table organized by placing elements
with similar combining ratios in the same group. He arranged the elements within a group in order of their atomic
mass.
In 1869, the Russian
chemist Mendeleev
noted that the
repeating patterns of
behavior could be
arranged in a
sequence of elements
giving rise to the
"Periodic Table" of
the elements.
Special thanks to Dr. Paul Karol's "Intro to Modern Chemistry" for providing much of the information on this page.
http://periodic.lanl.gov/mendeleev.htm (1 of 2) [10/24/2001 5:41:07 PM]
Figure 2.3: The periodic ordering of elements according to Mendeleev. Thespaces marked with blank lines represent elements that Mendeleev deducedexisted but were unknown at the time, so he left places for them in the table.The symbols at the top of the columns (e.g. R2O and RH4) are molecularformulas written in the style of the 19th century
ements which displayed similar properties. The first part of the text wasdevoted to the well known chemistry of the halogens. Next, he chose tocover the chemistry of the metallic elements in order of combining power –alkali metals first (combining power of one), alkaline earths (two), etc. How-ever, it was difficult to classify metals such as copper and mercury which hadmultiple combining powers, sometimes one and other times two. While tryingto sort out this dilemma, Mendeleev noticed patterns in the properties andatomic weights of halogens, alkali metals and alkaline metals. He observedsimilarities between the series Cl-K-Ca , Br-Rb-Sr and I-Cs-Ba. In an effortto extend this pattern to other elements, he created a card for each of the 63known elements. Each card contained the element’s symbol, atomic weightand its characteristic chemical and physical properties. When Mendeleevarranged the cards on a table in order of ascending atomic weight groupingelements of similar properties together in a manner not unlike the card ar-rangement in his favorite solitaire card game, patience, the periodic table was
18

The Elements
Figure 2.4: Mendeleev’s Tabelle II in semi-modern Form: To the moderneye, the 1869/71 formulations lacks any Group 18 rare gases and there arefew f-block elements:
formed. From this table, Mendeleev developed his statement of the periodiclaw and published his work ”On the Relationship of the Properties of theElements to their Atomic Weights” in 1869. The advantage of Mendeleev’stable over previous attempts was that it exhibited similarities not only insmall units such as the triads, but showed similarities in an entire networkof vertical, horizontal, and diagonal relationships. In 1906, Mendeleev camewithin one vote of being awarded the Nobel Prize for his work.
At the time that Mendeleev developed his periodic table the experimen-tally determined atomic masses were not always accurate, so he reorderedelements despite their accepted masses. For example, he changed the weightof beryllium from 14 to 9. This placed beryllium into Group 2 above mag-nesium whose properties it more closely resembled than where it had beenlocated above nitrogen. In all Mendeleev found that 17 elements had tobe moved to new positions from those indicated strictly by atomic weightfor their properties to correlate with other elements. These changes indi-
19

Chapter 2
cated that there were errors in the accepted atomic weights of some elements(atomic weights were calculated from combining weights, the weight of anelement that combines with a given weight of a standard.) However, evenafter corrections were made by redetermining atomic weights, some elementsstill needed to be placed out of order of their atomic weights. From the gapspresent in his table, Mendeleev predicted the existence and properties of un-known elements which he called eka-aluminum, eka-boron, and eka-silicon.The elements gallium, scandium and germanium were found later to fit hispredictions quite well. He was, however, incorrect in suggesting that the ele-ment pairs of argon-potassium, cobalt-nickel and tellurium-iodine should beinterchanged in position due to inaccurate atomic weights. Although theseelements did need to be interchanged, it was because of a flaw in the reasoningthat periodicity is a function of atomic weight.
2.1.5 Discovery of the Noble Gases
In 1895 Lord Rayleigh reported the discovery of a new gaseous element namedargon which proved to be chemically inert. This element did not fit any ofthe known periodic groups. In 1898, William Ramsey suggested that argonbe placed into the periodic table between chlorine and potassium in a familywith helium, despite the fact that argon’s atomic weight was greater thanthat of potassium. This group was termed the ”zero” group due to the zerovalency of the elements. Ramsey accurately predicted the future discoveryand properties of neon.
2.2 Atomic Structure and the Periodic Table
Although Mendeleev’s table demonstrated the periodic nature of the ele-ments, it remained for the discoveries of scientists of the 20th Century toexplain why the properties of the elements recur periodically.
In 1897 J.J. Thomson showed that cathode rays generated by applying alarge voltage across a low density gas – first discovered in 1821 – were neg-atively charged. He found that they could be obtained from the dischargeof any gas while using different materials for the electrodes allowing him tosurmise that the negatively charged particles, now called electrons are con-stituents of all atoms. By studying the amount of deflection of the electronsproduced by electric and magnetic fields, he determined the mass-to-charge
20

The Elements
ratio me/e. Later, Millikan (1909) was able to determine just the charge ofthese electrons from his famous oil-drop experiment.
In 1897 Becquerel found that uranium gave off a radiation that couldblacken a photographic plate even when the plate was separated from thesource of radiation by thick paper. This radiation was separable by a magnetinto two electrically charged beams (α- and β-rays) and a neutral beam calledγ-rays. Rutherford, in 1903, showed that the α-rays were actually a streamof helium ions, He+2, and the β-rays were later determined to be a streamof high-speed electrons. The α-rays were clear evidence that uranium atomshad disintegrated to give off helium. No longer could atoms be considereduncharged particles.
Geiger and Marsden sent the He+2 ions into thin metal foils and foundthat all but a few of the ions passed straight though the foil. The onesthat did not tended to be scatted by large angles. Rutherford explained thisscattering, in 1911, on the basis of the nuclear model of the atom; most ofthe mass of an atoms is concentrated in a positively charged center calledthe nucleus, around which negatively charged electrons moved. Nuclei havediameter of about 10−15 m, where as atomic diameters are about 10−10m —a hundred thousand times larger. Atoms are mostly empty space.
In 1919 Rutherford then discovered that hydrogen nuclei appear to formwhen α particles collide with nitrogen atoms. Subsequently it was shownthat the same thing happened with other elements besides nitrogen. Theseexperiments clearly showed that atomic nuclei had structure and appearedto contain hydrogen nuclei, or protons. In 1930 Bothe and Becker obtainedradiation that easily penetrated many layers of matter when they bombardedberyllium atoms with α particles. In 1932 this radiation was shown to consistof neutral particles with a mass approximately equal to the proton, and tobe generated by many other elements when bombarded with α particles.
So atoms have a nucleus that is made up of neutrons and protons, and sur-rounded by enough electrons to make the atom charge neutral. The atomicnumber, Z, is the number of protons in the nucleus. The mass number isthe total number of protons and neutrons in the nucleus. Sodium (Na), forexample, has an atomic number of 11 and an atomic mass of 23 (11 protonsand 12 neutrons), and is notated as 23
11Na. Due to the discovery, in 1913by Thompson, that atoms of the same element could have several differentatomic masses (isotopes), it became apparent that mass number (or atomicweight) was not the significant player in the periodic law as Mendeleev, Mey-ers and others had proposed, but rather, the properties of the elements varied
21

Chapter 2
periodically with atomic number.The question of why the periodic law exists was answered as scientists
developed an understanding of the electronic structure of the elements be-ginning with Niels Bohr’s studies of the organization of electrons into shells.
2.3 Atomic Spectroscopy
Chemists began studying colored flames in the eighteenth century. Whensodium compounds are sprayed into a flame, the flame burns with a brightyellow color. Potassium gives a violet flame and lithium and strontium givea red flame. A flame test is a simple way to identify an element. Althoughthe red flames of lithium and strontium appear similar, the light from eachcan be separated into distinctly different colors. The red Strontium flamewhen resolved with a prism shows a cluster of red lines and blue lines, whilelithium shows a red line, a yellow line and two blue lines (see Figure 2.5).
Each element has a characteristic line spectrum consisting of a uniqueset of frequencies. Lines appear in the ultraviolet and infrared, as well as inthe visible frequency range, and they form series in which the lines becomemore closely spaced with decreasing wavelength, approaching a series limit atwhich the line spacing converges to zero. These spectra can be used not onlyto identify elements, but also to learn about the element’s internal structure,in particular, the electrons.
The spectroscopists Balmer and Rydberg had been able to fit the fre-quencies of hydrogen, and of some of the simpler spectra, with very accurateempirical formulas. Balmer’s formula for hydrogen was
Frequency = R
(1
4− 1
n2
)
where R is a constant and n is an integer, equal to 3,4, ... This Balmerformula was similar to Rydberg’s formula, which worked for the alkali metalsand some other cases. Rydberg’s formula was
Frequency = R
(const− 1
(n− d)2
)
where n again is an integer, d is a constant, and R is, remarkably enough, thesame constant found in Balmer’s formula. This constant, called the Rydberg
22

The Elements
Figure 2.5: The emission spectra of some elements. The lines correspond tovisible light emitted by atoms.
23

Chapter 2
frequency, equal to≈ 3.29x10¹⁵ Hz, pointed to a far-reaching relation betweenthe spectra of different chemical elements.
In both Balmer’s formula and Rydberg’s formula the frequency appearsas a difference of two quantities, and Ritz, in 1908, showed that this conceptwas a general principle. It was possible to write
Frequency = R
(1
n′2 −1
n2
)(n = n′ + 1, n′ + 2, ...)
where for Balmer and Rydberg’s formula n′ = 2. In the ultraviolet Lymanfound the n′ = 1 series, and Paschen found the n′ = 3 series in the infrared.It was clear that there were discrete sets of lines that were now becoming, atleast for hydrogen, well categorized.
The problem with this scheme was that it seemed to be in violent dis-agreement with the implications of Rutherford’s nuclear atom picture. If onestudies the motion of a charged particle, like the electron, moving accordingto classical mechanics in an inverse-square field such as the nucleus must pro-vide one finds that the electron will continually radiate energy, of a frequencyequal to its rotational frequency about the nucleus. By studying the dynam-ics of a particle moving according to an inverse-square attraction, we easilyfind that the orbit becomes smaller and the frequency of rotation in the orbitgreater, as the energy decreases. If, then, an electron rotating in such an or-bit radiates energy away, it will move into orbits of successively smaller radiiand successively higher frequency of rotation, and will continue to radiatemore and more energy, of higher and higher frequency, until it falls into thenucleus. This catastrophe would have to happen to a classically constructedatom consisting of a nucleus and electrons. It clearly cannot be happeningwith atoms of our experience; they radiate fixed frequencies, sharp spectrallines, and have permanent existence. What prevents the catastrophe?
In 1913 Niels Bohr produced a set of hypotheses which circumvented theabove objection and which enabled him to derive the Rydberg formula forthe spectrum of hydrogen. Bohr made three basic assumptions:
1. The electrons move in circular orbits about the center of mass of theatom
2. The only allowed orbits are such that the angular momentum of theatom about its center of mass is an integral multiple of h/2π.
24

The Elements
3. Radiation occurs only when an electron ”jumps” from one of the al-lowed orbits to one of lower energy. The difference in energy ∆E isthen radiated as a photon of frequency ν = ∆E/h.
In addition, Bohr pointed out that the hydrogen atom evidently containsonly one electron, a fact not so obvious then as it is now.
Following these assumptions it is possible to calculate the radius of eachallowed orbit,
rn =4πε0n2!2
mZe2,
and then calculate the energy, which is a sum of the kinetic energy of the nu-cleus and the electron plus the negative electrostatic potential energy. (Thisis all done in exactly the same way that planetary orbits are calculated usingthe center of mass concept.)
En =−mrZ2e4
32π2ε20n
2!2,
where mr is the reduced mass of the two particle system (electron and nu-cleus).
In the Bohr picture, therefore, the possible energies of a hydrogen atommay be represented by an energy level diagram like that of Figure 2.6, whichshows the energy corresponding to the various values of n. Arrows on thediagram indicate transitions from one level to another, leading to emissionof photons which produce the spectral lines.
The lowest level E1 is the level which is normally occupied by the electron,and its energy is therefore equal in magnitude to the energy required to freethe electron from the proton. This energy, in electron volts, is numericallyequal to the ionization potential, in volts, of atomic hydrogen. The energylevels merge into a continuum for positive values of E; these are energy levelsof the free electron, which are not restricted to discrete values.
The energy equation above describes the spectrum of any one-electronsystem – for example, 2H (or deuterium, D), 3H (or tritium, T), singly ionizedhelium, doubly ionized lithium. The lines of deuterium differ from the linesof ordinary hydrogen only because of the difference in the reduced mass mr.Furthermore, we should note that Bohr’s assumptions explained many otherobservations as well. For example, it is clear from his theory (and Figure2.6) why the frequencies of emission and absorption lines are observed to bethe same. We can also understand why not all emission lines are observed in
25

Chapter 2
Figure 2.6: Energy levels of the hydrogen atoms, according to Bohr, showingtransitions which give rise to the Lyman, Balmer ,and other series of spectrallines.
absorption: in a cold gas, the atoms will all be found in their ground states,and therefore only those frequencies can be absorbed which correspond totransitions from the ground state up to some excited states.
The Bohr model was eventually found to have some significant limitations.The largest one for the single electron hydrogen atom was the lack of finestructure that was seen in the emission line spectra. Of larger significance wasthe inability of the model to explain much of the emission spectra for multi-electron atoms. The resolution of these issues fell into place with the fullquantum mechanical treatment (particle/wave duality) of the constituentsof the atom. The full solution of the Schrodinger equation for the hydrogenatom is one of the canonical problems of a Quantum Mechanics course, andwe will not repeat it here. We will simply use the results to finish the storyof the atomic spectroscopy and help understand the categorization schemeof the periodic table.
Using wave mechanics, every electron in an atom is characterized by fourquantum numbers. The size, shape, and spatial orientation of an electron’sprobability density are specified by three of these quantum numbers. Bohrenergy levels separate into electron subshells, and quantum numbers dictatethe number of states within each subshell. Shells are specified by a principle
26

The Elements
quantum number n, which may take on integral values beginning with unity;sometimes these shells are designated by the letters K, L, M , N , O and so on,which corresponds respectively, to n =0, 1, 2, ,3, 4, 5, .... Note also that thisquantum number, and it only, is also associated with the Bohr model. Thisquantum number is related to the distance of an electron from the nucleus.
The second quantum number, l, signifies the subshell, which is denotedby a lowercase letter – an s, p, d, or f ; it is related to the shape of theelectron subshell. In addition, the number of these subshells is restricted bythe magnitude of n. l < n, so the number of subshells available is n − 1.The number of energy states for each subshell is determined by the thirdquantum number, ml. ml can take on values from −l to l, so for a given lthere are 2l + 1 energy states available. For an s subshell, there is a singleenergy state, where as for p, d, and f subshells, three, five and seven statesexist, respectively. In the absence of an external magnetic field, the stateswithin each subshell are identical. However, when a magnetic field is appliedthese subshells states split each state assuming a slightly different energy.
Associated with each electron is a spin moment, which must be orientedeither up or down. Related to this spin moment is the fourth quantumnumber, ms, for which two values are possible (+1/2 and −1/2), one foreach of the spin orientations.
A schematic energy level diagram for the various shells and subshells usingthe quantum mechanical model is shown in Figure 2.7. Several features of thediagram are worth noting. First, the smaller the principle quantum number,the lower the energy level; for example, the energy of a 1s state is less thanthat of a 2s state. Second, within each shell, the energy of a subshell levelincreases with the value of the l quantum number. Finally, there may beoverlap in the energy of a state in one shell with states in an adjacent shell,which is especially true of the d and f states; for example, the energy of the3d state is greater than that for the 4s.
The discussion up to this point has dealt primarily with electron states –values of energy that are permitted for electrons. To determine the mannerin which these states are filled with electrons, we use the Pauli exclusionprinciple, another quantum mechanical concept. This principle stipulatesthat no two electrons can have the same set of quantum numbers. This meansthat each electron state (a specific n, l, and ml set of quantum numbers) canhold no more than two electrons, which must have opposite spins (so thatms is not the same). This, s, p, d and f subshells may each accommodate,respectively, a total of 2, 6, 10 and 14 electrons.
27

Chapter 2
Figure 2.7: Schematic representation of the relative energies of the electronsfor the various shells and subshells
Of course, not all possible states in an atom are filled with electrons.The electrons fill up the lowest possible energy states in the electron shellsand subshells, two electrons (having opposite spin) per state. When all theelectrons occupy the lowest possible energies in accord with the foregoingrestrictions, an atom is said to be in its ground state. However, electrontransitions to higher energy states are possible, and are responsible for elec-trical and optical properties of a material. The electron configuration of anatom represents the manner in which these states are occupied. In the con-ventional notation the number of electrons in each subshell is indicated bya superscript after the shell-subshell designation. For example, the electronconfigurations for hydrogen, helium and sodium are, respectively, 1s1, 1s2
and 1s22s22p63s1.
At this point, comments regarding these electron configurations are nec-essary. First, the valence electrons are those that occupy the outermost shell.
28

The Elements
These electrons are extremely important as they participate in the bondingbetween atoms to form atomic and molecular aggregates. Furthermore, manyof the physical and chemical properties of solids are based on these valenceelectrons.
In addition, some atoms have what is termed stable electron configura-tions; that is, the states within the outermost or valence electron shell arecompletely filled. Normally this corresponds to the occupation of just thes and p states for the outermost shell by a total of eight electrons, as inneon, argon, and krypton; on exception is helium, which contains only two1s electrons. These elements are the inert, or noble, gases which are virtuallyunreactive chemically.
With this knowledge of electron configuration, it is possible to arrangethe elements into a periodic table with increasing atomic number, in sevenhorizontal rows called periods (connected to the principle quantum numbern). The arrangement is such that all elements arranged in a given columnor group have similar valence electron structures, as well as chemical andphysical properties. These properties change gradually, moving horizontallyacross the period and vertically down each column.
2.4 The Modern Periodic Table
The modern explanation of the pattern of the periodic table is that theelements in a group have similar configurations of the outermost electronshells of their atoms: as most chemical properties are dominated by theorbital location of the outermost electron. The last major changes to theperiodic table resulted from Glenn Seaborg’s work in the middle of the 20thCentury (see Figure 2.8). Starting with his discovery of plutonium in 1940,he discovered all the transuranic elements from 94 to 102. He reconfiguredthe periodic table by placing the actinide series below the lanthanide series.In 1951, Seaborg was awarded the Nobel Prize in chemistry for his work.Element 106 has been named seaborgium (Sg) in his honor.
The elements positions in Group 8A (or sometimes called Group 0), therightmost group, are the inert gases, which have filled electron shells andstable electron configurations. Group VIIA and VIA are one and two elec-trons deficient, respectively, from having stable structures. The Group VIIAelements (F, Cl, Br, I and At) are sometimes termed the halogens.1 The
1The term halogen originates from 18th century scientific French nomenclature based
29

Chapter 2!"#$%&$'()*+,"(%-(./"(0,"1"2.3(
!"#$
%&'(&)*+#,(&-
%.,)/)0#*-#1)#-
4(5%,$&
%&'(&)/#*#(1,2*+#,(&-
3441*+#,(&-
6#
7$89$&
51(/-),)4/*+#,(&-
"4/+#,(&-
:(;*3
6(/,2(/)0#*-#1)#-
"47&#*8(-#-
)'
5<2./".$'
!9
:%;1)8)/(&
<:::%
!
!*
=>0148#/*
!?@@ABC*
:
!
D!E
!C
!F
!G
!A
D*
=#&)H+*
C?@@DG@D*
:"
DI
::%
:::%
:<%
<%
<:%
<::%
D
E*
6),2)H+*
G?BC!*
7$
D*!C*
J#1>&&)H+*
B?@!D!9D*
6"
D*D
F*
J414/*
!@?9!!*
6
D EG*
K(174/*
!D?@!@A*
4
D CA*
"),148#/*
!C?@@GAC*
=
D F9*
;L>8#/*
!F?BBBC*
>
D GB*
M&H41)/#*
!9?BB9C@ED*
?
D A!@*
"#4/*
D@?!ABA*
="
D*9
I*6
E
!!*
N40)H+*
DD?B9BAA@*
=*
D*9*!
!D*
O(8/#-)H+*
DC?E@F@*
@A
D*9*D
EC
FG
A9
B!@
!!
!D
!E*
%&H+)/H+*
DG?B9!FE9*
B,
D 9 E
!C*
N)&).4/*
D9?@9FF*
5$
D 9 C
!F*
324-P241H-*
E@?BAEAG!*
!
D 9 F
!G*
NH&QH1*
ED?@GG*
5
D 9 G
!A*
K2&41)/#*
EF?CFE*
4,
D 9 A
!9*
%184/*
EB?BC9*
B#
D*9*9
I*6*
O
:::J
:<J
<J
<:J
<::J
<:::J
:J::J
C
!B*
34,(--)H+*
EB?@B9E*
C
D*9*9*!
D@*
K(&.)H+*
C@?@A9*
4*
D*9*9*D
D!*
N.(/0)H+*
CC?BFFB!@*
5'
D*9*B*D
DD*
5),(/)H+*
CA?9GA*
)$
D*9*
!@*D
DE*
<(/(0)H+*
F@?BC!F*
D
D*9*
!!*D
DC*
K214+)H+*
F!?BBG!*
4#
D 9!E !
DF*
O(/8(/#-#*
FC?BE9@CB*
@2
D 9!E D
DG*
:14/*
FF?9CFA*
?"
D 9!C D
DA*
K47(&,*
F9?BEED@@*
4%
D 9!F D
D9*
").'#&*
F9?GBEC*
=$
D 9!G D
DB*
K4PP#1*
GE?FCG*
49
D*9*
!9*!
E@*
R)/.*
GF?C@B*
E2
D 9!9 D
E!*
S(&&)H+*
GB?ADE*
;*
D 9!9 E
ED*
S#1+(/)H+*
AD?GC*
;"
D 9!9 C
EE*
%1-#/).*
AC?BD!G@*
B3
D 9!9 F
EC*
N#&#/)H+*
A9?BG*
5"
D 9!9 G
EF*
J14+)/#*
AB?B@C*
6#
D 9!9 A
EG*
I1>P,4/*
9E?AB9*
C#
D*9*
!9*9
I*6*
O*"
F
EA*
TH7)0)H+*
9F?CGA9*
F+
D*9*
!9*9*!
E9*
N,14/,)H+*
9A?GD*
5#
D*9*
!9*9*D
EB*
U,,1)H+*
99?B@F9F*
G
D*9*
!9*B*D
C@*
R)1.4/)H+*
B!?DDC*
E#
D*9*
!9*
!@*D
C!*
")47)H+*
BD?B@GE9*
=+
D*9*
!9*
!D*!
CD*
O4&>70#/H+*
BF?BC*
@%
D 9!9!E !
CE*
5#.2/#,)H+*
VB9W*
)'
D 9!9!E D
CC*
TH,2#/)H+*
!@!?@A*
F9
D 9!9!F !
CF*
T240)H+*
!@D?B@FF@*
F/
D 9!9!G !
CG*
3(&&(0)H+*
!@G?CD*
!&
D 9!9!9 @
CA*
N)&X#1*
!@A?9G9D*
BA
D*9*
!9*
!9*!
C9*
K(0+)H+*
!!D?C!!*
4&
D 9!9!9 D
CB*
:/0)H+*
!!C?9!9*
H2
D 9!9!9 E
F@*
5)/*
!!9?A!@*
52
D 9!9!9 C
F!*
%/,)+4/>*
!D!?AG@*
5+
D 9!9!9 F
FD*
5#&&H1)H+*
!DA?G@*
)"
D 9!9!9 G
FE*
:40)/#*
!DG?B@CCA*
H
D 9!9!9 A
FC*
Y#/4/*
!E!?DBE*
I"
D*9*
!9*
!9*9
I*6*
O*"*
;
G
FF*
K#-)H+*
!ED?B@FCF*
43
D*9*
!9*
!9*9*!
FG*
J(1)H+*
!EA?EDA*
6*
D*9*
!9*
!9*9*D
FA*,4*A!
AD*
=(Q/)H+*
!A9?CB*
:-
D*9*
!9*
ED*
!@*D
AE*
5(/,(&H+*
!9@?BCAB*
)*
D*9*
!9*
ED*
!!*D
AC*
5H/8-,#/*
!9E?9C*
J
D 9!9ED!D D
AF*
T2#/)H+*
!9G?D@A*
F"
D 9!9ED!E D
AG*
;-+)H+*
!B@?DE*
>3
D 9!9ED!C D
AA*
:1)0)H+*
!BD?D!A*
H#
D 9!9ED!F D
A9*
3&(,)/H+*
!BF?@A9*
!.
D 9!9ED!A !
AB*
S4&0*
!BG?BGGFF*
B9
D*9*
!9*
ED*
!9*!
9@*
O#1.H1>*
D@@?FB*
:A
D 9!9ED!9 D
9!*
52(&&)H+*
D@C?E9EE*
),
D 9!9ED!9 E
9D*
6#(0*
D@A?D*
!+
D 9!9ED!9 C
9E*
J)-+H,2*
D@9?B9@E9*
6$
D 9!9ED!9 F
9C*
34&4/)H+*
VD@BW*
!%
D 9!9ED!9 G
9F*
%-,(,)/#*
VD!@W*
B.
D 9!9ED!9 A
9G*
T(04/*
VDDDW*
F2
D*9*
!9*
ED*
!9*9
I*6*
O*"*
;*3
A
9A*
M1(/.)H+*
VDDEW*
?#
D*9*
!9*
ED*
!9*9*!
99*
T(0)H+*
VDDGW*
F*
D*9*
!9*
ED*
!9*9*D
9B*,4*!@E
!@C*
TH,2#1Q410)H+*
VDG!W*
F-
D*9*
!9*
ED*
ED*
!@*D
!@F*
ZH7/)H+*
VDGDW*
K+
D*9*
!9*
ED*
ED*
!!*D
!@G*
N#(7418)H+*
VDGGW*
5A
D 9!9EDED!D D
!@A*
J421)H+*
VDGCW*
6/
D 9!9EDED!E D
!@9*
=(--)H+*
VDGBW*
:3
D 9!9EDED!C D
!@B*
O#),/#1)H+*
VDG9W*
@.
D 9!9EDED!F D
!!@*
Z(1+-,(0,)H+*
VDA!W*
K3
D 9!9EDED!A !
!!!*
T4#/,8#/)H+*
VDADW*
FA
D*9*
!9*
ED*
ED*
!9*!
!!D*
[/H/7)H+*
VD9FW*
L9+
D 9!9EDED!9 D
!!E*
[/H/,1)H+*
VD9CW*
L9.
!!C*
[/H/\H(0)H+*
VD9BW*
L98
!!F*
[/H/P#/,)H+*
VD99W*
L9M
!!G*
[/H/2#L)H+*
VDBDW*
L9/
!!A*
[/H/-#P,)H+*
**L93
!!9*
[/H/4.,)H+*
**L9%
I*6*
O*"*
;*3*
]
%,4+).*+(--#-*)/*P(1#/,2#-#-*(1#*,24-#*4Q*,2#*+4-,*-,(7&#*41*.4++4/*)-4,4P#?
Z#-)8/*K4P>1)82,*^*!BBA*O).2(#&*Z(>(2*V+).2(#&_0(>(2?.4+W?*2,,P`aa$$$?0(>(2?.4+aP#1)40).a?*
"4,#`*52#*-H7814HP*/H+7#1-*
!b!9*$#1#*(04P,#0*)/*!B9C*7>*
,2#*:/,#1/(,)4/(&*[/)4/*4Q*3H1#*
(/0*%PP&)#0*K2#+)-,1>?*52#*
/(+#-*4Q*#&#+#/,-*!!Db!!9*
(1#*,2#*6(,)/*#\H)X(&#/,-*4Q*
,24-#*/H+7#1-?*
FA*
6(/,2(/H+*
!E9?B@FF*
7*
D*9*
!9*
!9*B*D
F9*
K#1)H+*
!C@?!!G*
4"
D*9*
!9*
!B*B*D
FB*
31(-#40>+)H+*
!C@?B@AGF*
!#
D 9!9D! 9 D
G@*
"#40>+)H+*
!CC?DC*
=&
D 9!9DD 9 D
G!*
314+#,2)H+*
V!CFW*
!1
D 9!9DE 9 D
GD*
N(+(1)H+*
!F@?EG*
51
D 9!9DC 9 D
GE*
cH14P)H+*
!F!?BGC*
09
D 9!9DF 9 D
GC*
S(04&)/)H+*
!FA?DF*
;&
D*9*
!9*
DF*B*D
GF*
5#17)H+*
!F9?BDFEC*
)+
D 9!9DA 9 D
GG*
Z>-P14-)H+*
!GD?F@@*
K<
D 9!9D9 9 D
GA*
=4&+)H+*
!GC?BE@ED*
:%
D 9!9DB 9 D
G9*
c17)H+*
!GA?DFB*
0#
D 9!9E@ 9 D
GB*
52H&)H+*
!G9?BECD!*
)1
D 9!9E! 9 D
A@*
U,,#17)H+*
!AE?@C*
G+
D 9!9ED 9 D
A!*
6H,#,)H+*
!AC?BGA*
79
D*9*
!9*
ED*B*D
9B*
%.,)/)H+*
VDDAW*
B'
D*9*
!9*
ED*
!9*B*D
B@*
5241)H+*
DED?@E9!*
)/
D*9*
!9*
ED*
!9*
!@*D
B!*
314,(.,)/)H+*
DE!?@EF99*
!*
D 9!9EDD@ B D
BD*
[1(/)H+*
DE9?@D9B!*
L
D 9!9EDD! B D
BE*
"#P,H/)H+*
VDEAW*
=M
D 9!9EDDD B D
BC*
3&H,4/)H+*
VDCCW*
!9
D 9!9EDDC 9 D
BF*
%+#1).)H+*
VDCEW*
B1
D 9!9EDDF 9 D
BG*
KH1)H+*
VDCAW*
41
D*9*
!9*
ED*
DF*B*D
BA*
J#1'#&)H+*
VDCAW*
6N
D 9!9EDDA 9 D
B9*
K(&)Q41/)H+*
VDF!W*
4-
D 9!9EDD9 9 D
BB*
c)/-,#)/)H+*
VDFDW*
03
D 9!9EDDB 9 D
!@@*
M#1+)H+*
VDFAW*
?1
D 9!9EDE@ 9 D
!@!*
O#/0#&#X)H+*
VDF9W*
@&
D 9!9EDE! 9 D
!@D*
"47#&)H+*
VDFBW*
=%
D 9!9EDED 9 D
!@E*
6($1#/.)H+*
VDGDW*
7#
D*9*
!9*
ED*
ED*B*D
Figure 2.8: Modern periodic table, (from www.dayah.com/periodic)
30

The Elements
alkali2 and alkaline earth3 metals (Li, Na, K, Be, Mg, Ca, etc...) are labeledas Groups IA and IIA, having, respectively, one and two electrons in excessof stable structures. The elements in the three long periods, Group IIIBthrough IIB are termed the transition metals, which have partially filled delectron states and in some cases one or two electrons in the next higherenergy shell. Groups IIA, IVA and VA (B, Si, Ge, As, etc.) display char-acteristics that are intermediate between metals and nonmetals by virtue oftheir valence electron structures.
2.4.1 Group naming schemes
There are three ways of numbering the groups of the periodic table, oneusing Hindu-Arabic numerals and the other two using Roman numerals. TheRoman numeral names are the original traditional names of the groups; theArabic numeral names are those recommended by the International Unionof Pure and Applied Chemistry (IUPAC) to replace the old names in anattempt to reduce the confusion generated by the two older, but mutuallyconfusing, schemes.
There is considerable confusion surrounding the two old systems in use(old IUPAC and CAS) that combined the use of Roman numerals with letters.In the old IUPAC system the letters A and B were designated to the left (A)and right (B) part of the table, while in the CAS system the letters A andB were designated to main group elements (A) and transition elements (B).The former system was frequently used in Europe while the latter was mostcommon in America. The new IUPAC scheme was developed to replace bothsystems as they confusingly used the same names to mean different things.
The periodic table groups are as follows (in the brackets are shown theold systems: European and American):
• Group 1 (IA,IA): the alkali metals or hydrogen family/lithium family
on erring adaptations of Greek roots; the Greek word halos meaning ”salt”, and genesmeaning ”production” referring to elements which produce a salt in union with a metal.
2The word ”alkali” is derived from Arabic Al Qaly = ”the calcined ashes”, referring tothe original source of alkaline substances. Ashes were used in conjunction with animal fatto produce soap, a process known as saponification.
3The alkaline earth metals are named after their oxides, the alkaline earths, whose old-fashioned names were beryllia, magnesia, lime, strontia and baryta. These oxides are basic(alkaline) when combined with water. ”Earth” is an old term applied by early chemiststo nonmetallic substances that are insoluble in water and resistant to heating–propertiesshared by these oxides.
31
Chapter 2
• Group 2 (IIA,IIA): the alkaline earth metals or beryllium family
• Group 3 (IIIA,IIIB): the scandium family
• Group 4 (IVA,IVB): the titanium family
• Group 5 (VA,VB): the vanadium family
• Group 6 (VIA,VIB): the chromium family
• Group 7 (VIIA,VIIB): the manganese family
• Group 8 (VIII): the iron family
• Group 9 (VIII): the cobalt family
• Group 10 (VIII): the nickel family
• Group 11 (IB,IB): the coinage metals (not an IUPAC-recommendedname) or copper family
• Group 12 (IIB,IIB): the zinc family
• Group 13 (IIIB,IIIA): the boron family
• Group 14 (IVB,IVA): the carbon family
• Group 15 (VB,VA): the pnictogens (not an IUPAC-recommended name)or nitrogen family
• Group 16 (VIB,VIA): the chalcogens or oxygen family
• Group 17 (VIIB,VIIA): the halogens or fluorine family
• Group 18 (Group 0): the noble gases or helium family/neon family
32

The Elements
2.5 Trends through the periodic table
2.5.1 Atomic radii
Atomic radius tends to decrease on passing along a period of the periodictable from left to right, and to increase on descending a group, see Figure 2.9.The electrons in an atom are arranged in shells which are, on average, furtherand further from the nucleus, and which can only hold a certain number ofelectrons. Each new period of the periodic table corresponds to a new shellwhich starts to be filled up, and so the outermost electrons are further andfurther from the nucleus as a group is descended. Passing along a periodfrom left to right, the nuclear charge increases while the electrons are stillentering the same shell: the effect is that the physical size of the shell (andhence of the atom) decreases in response.
The increasing nuclear charge is partly counterbalanced by the increasingnumber of electrons in a phenomenon that is known as shielding, which iswhy the size of atoms usually increases as a group is descended. However,there are two occasions where shielding is less effective: in these cases, theatoms are smaller than would otherwise be expected.
Lanthanide contraction
The electrons in the 4f -subshell, which is progressively filled from cerium (Z= 58) to lutetium (Z = 71), are not particularly effective at shielding theincreasing nuclear charge from the sub-shells further out. The elements im-mediately following the lanthanides have atomic radii which are smaller thanwould be expected and which are almost identical to the atomic radii of theelements immediately above them. Hence hafnium has virtually the sameatomic radius (and chemistry) as zirconium, and tantalum has an atomicradius similar to niobium, and so forth. The effect of the lanthanide con-traction is noticeable up to platinum (Z = 78), after which it is masked by arelativistic effect known as the inert pair effect.
d-Block contraction
The d-block contraction is less pronounced than the lanthanide contractionbut arises from a similar cause. In this case, it is the poor shielding capacity ofthe 3d-electrons which affects the atomic radii and chemistries of the elements
33

Chapter 2
Figure 2.9: Periodic table of empirically measured atomic radius in picome-tres (pm) (from www.dayah.com/periodic).
immediately following the first row of the transition metals, from gallium (Z= 31) to bromine (Z = 35).
2.5.2 Ionization energy
The ionization energy I is defined as the energy that must be supplied inorder to completely remove an electron from an atom. The first ionizationenergy is the energy required to remove one electron from the neutral parentatom. The second ionization energy is the energy required to remove a secondvalence electron from the univalent ion to form the divalent ion, and so on.Successive ionization energies increase.
As can be seen from Figure 2.10 The decrease in atomic radius also causesthe ionization energy to increase when moving from left to right across aperiod. The more tightly bound an element is, the more energy is requiredto remove an electron. Group I elements have low ionization energies becausethe loss of an electron generates an ion with a stable closed shell. Workingdown a group, each successive element has a lower ionization energy because
34

The Elements
Figure 2.10: Periodic table of measured first ionization energies in kJ/mol(1kJ/mol = 0.010364 eV/atom (from www.dayah.com/periodic)
it is easier to remove an electron since the atoms are less tightly bound.Note the ionization energy of hydrogen is 13.6 eV. The energy of the 1s statediscussed earlier.
There are two exceptions to the general trends. The first is that theenergy to remove the first electron to fill the p subshell is less than theenergy to remove the last electron to fill the s subshell. For example, thefirst ionization energy of Be is greater than that of B. The second is that afterall the p subshell orbitals have been filled with one electron (which requires3 electrons) the addition of the fourth electron will be to a state that alreadyhas an electron of opposite spin. The electron-electron repulsion of this pairedstate makes it easier to remove the outermost, paired electron (this is Hundsrule, which we cover in the magnetism chapter). This last exception holdsfor periods 2, 3 and 4.
2.5.3 Electron affinity
Electron affinity, A, reflects the ability of a neutral atom to accept an elec-
35

Chapter 2
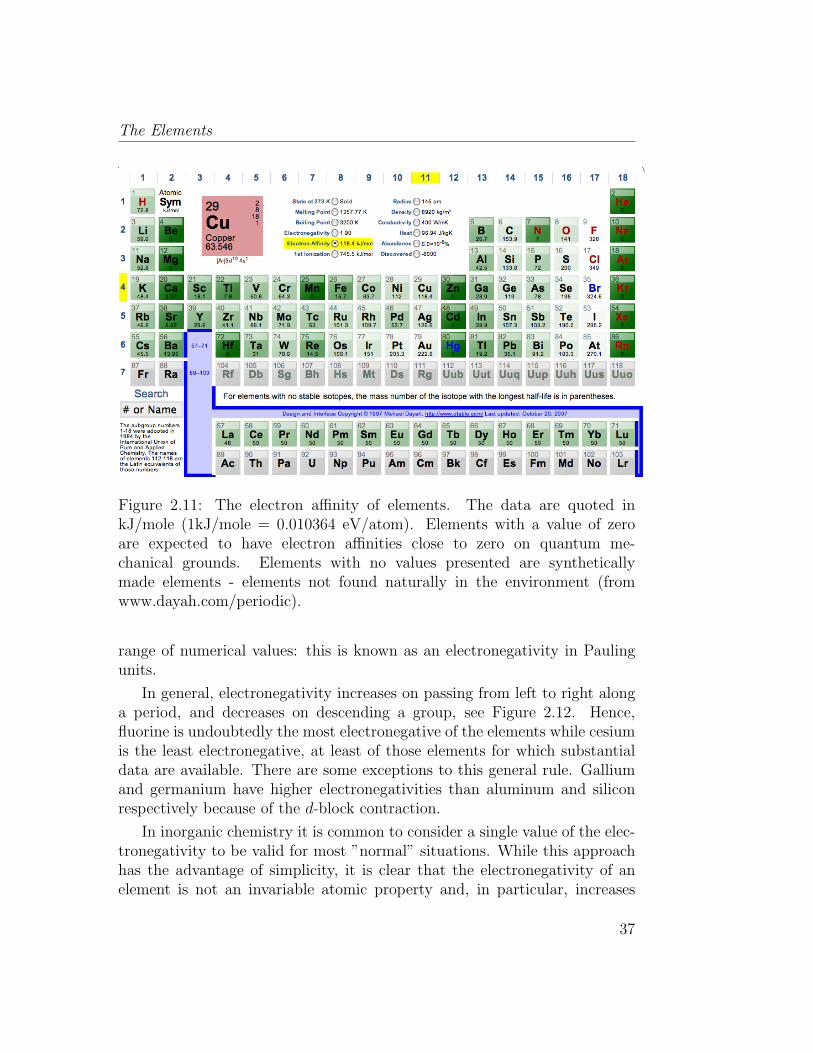
tron. It is the energy change that occurs when an electron is added to agaseous atom. Atoms with stronger effective nuclear charge have greaterelectron affinity. Some generalizations can be made about the electron affini-ties of certain groups in the periodic table, see Figure 2.11. The GroupIIA elements, the alkaline earths, have low electron affinity values. Theseelements are relatively stable because they have filled s subshells. GroupVIIA elements, the halogens, have high electron affinities because the ad-dition of an electron to an atom results in a completely filled shell. GroupVIII elements, noble gases, have electron affinities near zero, since each atompossesses a filled shell and will not accept an electron readily. Elements ofother groups have low electron affinities.
As for ionization potential, there are two exceptions to the general trends.The first is that the Groups 13-17 the elements in the first period have lowerelectron affinities than the elements below them in their respective groups.The second is that elements with particularly stable electron configurations,filled or exactly half filled subshells (Be, Mg, Mn Tc, Zn, Cd, N, etc...) alsohave very low electron affinity.
2.5.4 Electronegativity
Electronegativity is a chemical property which describes the power of anatom in a molecule to attract electrons towards itself. Electronegativity is notstrictly an atomic property, but rather a property of an atom in a molecule:the equivalent property of a free atom is its electron affinity. It is to beexpected that the electronegativity of an element will vary with its chemicalenvironment, but it is usually considered to be a transferable property, thatis to say that similar values will be valid in a variety of situations.
First proposed by Linus Pauling in 1932, electronegativity cannot be di-rectly measured and must be calculated from other atomic or molecular prop-erties. Several methods of calculation have been proposed and, althoughthere may be small differences in the numerical values of the electronegativ-ity, all methods show the same periodic trends between elements.
The most commonly used method of calculation is that originally pro-posed by Pauling. This gives a dimensionless quantity, commonly referredto as the Pauling scale, on a relative scale running from 0.7 to 4.0 (hydrogen= 2.2). When other methods of calculation are used, it is conventional (al-though not obligatory) to quote the results on a scale which covers the same
36
The Elements
Figure 2.11: The electron affinity of elements. The data are quoted inkJ/mole (1kJ/mole = 0.010364 eV/atom). Elements with a value of zeroare expected to have electron affinities close to zero on quantum me-chanical grounds. Elements with no values presented are syntheticallymade elements - elements not found naturally in the environment (fromwww.dayah.com/periodic).
range of numerical values: this is known as an electronegativity in Paulingunits.
In general, electronegativity increases on passing from left to right alonga period, and decreases on descending a group, see Figure 2.12. Hence,fluorine is undoubtedly the most electronegative of the elements while cesiumis the least electronegative, at least of those elements for which substantialdata are available. There are some exceptions to this general rule. Galliumand germanium have higher electronegativities than aluminum and siliconrespectively because of the d-block contraction.
In inorganic chemistry it is common to consider a single value of the elec-tronegativity to be valid for most ”normal” situations. While this approachhas the advantage of simplicity, it is clear that the electronegativity of anelement is not an invariable atomic property and, in particular, increases
37

Chapter 2
Figure 2.12: Periodic table of electronegativity using the Pauling scale
with the oxidation state of the element. Allred used the Pauling methodto calculate separate electronegativities for different oxidation states of thehandful of elements (including tin and lead) for which sufficient data wasavailable. However, for most elements, there are not enough different cova-lent compounds for which bond dissociation energies are known to make thisapproach feasible. This is particularly true of the transition elements, wherequoted electronegativity values are usually, of necessity, averages over severaldifferent oxidation states and where trends in electronegativity are harder tosee as a result.
2.5.5 Other Periodic Tables
Since 1869, numerous table designs have been proposed to demonstrate theperiodic law. I have collected a couple here.
• Physicists Periodic TableFigure 2.13 shows Timmothy Stowe’s physicists periodic table. Thistable depicts periodicity in terms of the four quantum numbers. As youmove down the planes, the principle quantum number, n, increases. In
38

The Elements
Figure 2.13: The physicists periodic table, by Timmothy Stowe.
each plane the color depicts l and the direction in and out of the pagedepicts ml (which is labeled m in the legend. ml = 0 is the only choicefor l = 0 or s subshell. For the d subshell (pinkish color in the table)ml = −2,−1, 0, 1, 2. The left and right direction depict ms which islabeled as s in the caption. Notice that you can only ever have 2 valuesof ms for any other set of quantum numbers, so for any given plane(n) and color (l), and front to back position (ml) there are only twoelements indicated, each with a different ms.
• Triangular Periodic TableFigure 2.14 shows an example is based on the work of Emil Zmaczynskiand graphically reflects the process of the construction of electronicshells of atoms.
39

Chapter 2
Figure 2.14: The triangular periodic table by Emil Zmaczynski
• Spiral Periodic TableFigure 2.15 was devised by Theodor Benfey and depicts the elementsas a seamless series with the main group elements radiating from thecenter with the d- and f-elements filling around loops.
• The Mayan Periodic TableFigure 2.16, named for its similarity to the ancient Mesoamerican cal-endar, is based on electron shells. The shells are shown as concentriccircles. Each row in the tabular form is shown as a ring.
The noble gases are in the vertical column above the center of the chart.The elements to the right of a noble gas have one extra electron, theelements directly on the left need one electron to fill their outer shell.
What does this chart show better then the traditional table? (1) Thereactivity of the elements. The elements closest to the noble gases areso close to becoming a noble gas they can taste it. This makes themmore eager, more reactive, since all they need is to gain or lose oneelectron. As you move away from the noble gases along the concentriccircles, the elements get less and less reactive, since they are so far frombeing a noble gas, they don’t really think it is worth the effort. (2) Theproportions of compounds. The proportion of elements can be guessedby looking at the ’hops’ that an element must take to get to the noble
40

The Elements
Figure 2.15: Spiral periodic table.
gases. The guideline is that for elements to combine, one should befrom the left and one from the right. The number of hops an atomtakes to get to the vertical line must equal the number its partner onthe other side takes, since one is gaining an electron and one is losingone. Aluminum needs three hops left to get vertical, and Oxygen needsjust two. Since the number of hops needs to be the same on bothsides, we need two Aluminum atoms to make the journey and threeOxygen to make it equal. This implies Al(2)O(3) is a good possibilityfor a compound. This guideline only works for elements fairly near thenoble gases. This chart is a only a rough guide since the inner shells ofelements are not always filled before the outer shells.
41

Chapter 2
Figure 2.16: Mayan Periodic Table. Radioactive elements are underlined inred. Synthetic elements are underlined in blue. The Noble gases are in bold.
42