chapter 2 the importance of undergraduate education
TRANSCRIPT

Chapter 2
Undergraduates in Science
THE IMPORTANCE OF UNDERGRADUATE EDUCATION . . . . . . . . . + . .. .. .. .. ......13The Supply of College-Level Science and Engineering Students ● 14Student Interest in Science and Engineering . 16Trends in Degrees: Field Differences ● . 25
SCIENCE AND ENGINEERING STUDENTS . . 27Blacks, Hispanics, and Native Americans . . . . . 28Asians 33Women . . . . . . . . . . . . . . . . . . . . . . . . . . . . ” 33Academic Quality of Science and Engineering Undergraduates . . . . . . . . . . . . . . . ● .36Retention During College and Career Paths After the Baccalaureate . . . . .......38
FEDERAL ROLES IN UNDERGRADUATE SCIENCE EDUCATION . . .. . . . . . . .. ......38The Effects of Federal R&D Policies on Undergraduate Education . 42Trends in the Federal Role . 43Financial Aid for science and Engineering Students . 45The Effects of Financial Aid . . . . . . . . . . . . . . . 47Non-Federal Support of Higher Education ● ..****.**.**.*.*.***************** 53Targeted Federal Undergraduate Science and EngineeringEducation Programs. . . . . . . . . . . . . . . ● . . . . 58
The Future of Undergraduate Science Education ..*. ..** **. .*. .**. *c** e* e***. 66
INSTITUTIONAL SETTINGS AND INFLUENCES ON CAREERS . . . . . . . . . . . . . . . . . . . . .67A Diversity of Institutions . . . . . . . . . . . . . . . . . . . . . ● ,. ● . . . . . ● . . . ● . . ● ● + ● ● ● + ● ● ● ● 69Undergraduate Origins of Science and Engineering Ph.D.s . . . . . . . . . . . . . . . . . . . . .76
2-22-32-42-52-62-72-82-9
2-1o
Science/Engineering as Percent of All Baccalaureate Degrees,1950-86 " 15
Freshmen Planned Majors, by Science/Engineering Field, 1977-87 .. . . .. . .......20Baccalaureate Degrees, 1950-86 . * * . . . . 26Planned Freshmen Majors, by Field and Race/Ethnicity, Fall 1987 . . . . . ● .. ......30Freshmen Choice of College Major, by Achievement, 1986 . . .. . . . . . . . . . .......37Retention in College, by Freshman Major, 1982 Freshmen in 1986 . . . . . . . . . ● .. ..40Career Paths of 1984 and 1985 Science Baccalaureates in 1986 . *..******.***** 41Sources of Student Aid, in Constant 1980 Dollars, 1976-86 . ● ● ● ● ● ● ● ● ● ● ● . ● ● ‘. ● ● * ● 46Type of Aid Used in College by Science/Engineering Baccalaureates,by Immediate Postcollege Career Path and College GPA, 1984................50
Education Debt of Recent Baccalaureates, by Field andCareer Path, 1984 ● *.. .*. .*. ... o.*. .*** *.*e. ***. *e.. .. . . . . . . . . . . . . . . . . . .52
2-1 Factors Affecting Undergraduates’ Choice of a Science orEngineering Major . . . . . 17
2-2 Planned Majors and Careers of Freshmen at All Institutions,by Sex, Fall 1987 ... ... .e*. *.. ... .*. ... ... ... *.. . o . . * * * * * . . * . * * .*.***.** 22

2-3
2-4
2-52-6
2-7
2-82-92-102-112-122-13
2’14
2-15
Freshmen's Planned Majors and Careers by Type ofInstitution Attended, Fall 1987 . 0 . . . . . . . . . . . . . . . . . . . . . . . . . . . . . . . . . . . . . . . . . 23
Freshmen Interest in Science and Engineering Majors bySelectivity of University Attended and Sex (in Percent), Fall 1987.............24
B.S. Degrees in Science and Engineering, by Race/Ethnicity, 1984..............29Planned Majors and Careers of Freshmen at 4-Year Institutions,by Sex, 1978 and 1986 *.. .*. **. o.*. ... **. ... .*. ... ... .**. +*. ... do..*****. 35
College Student Retention, Entry, and Exit From Natural Scienceand Engineering Majors, by Field, 1981 Freshmen Through1985 Baccalaureates *** . . * . . . . . * * * * * * * * * * * * . . * * . * . * . . . * * * . . . . . * .**.....* 39
State Scholarship Programs, 1986-87 ● **. ... . * e * * * * * . . . * * . . * * * * * . * * **.**..*. 55Corporate Grants to Higher Education, 1986 ● . . . .* .****.* . .***.* .****. .**** 57Foundation Support for science, by Type of Support, 1985 -86 . . . . . . . . . . . . . .. ...59Foundation Support for Science, by Recipient, 1984-86 . . . . . . . . . . . . . . . . . . . . .. .59Current and Past National science Foundation Undergraduate Programs . .......61Factors Affecting the Quality of Undergraduate Scienceand Engineering Education . . . . . . . . . . . . . . . . . . . . . . . . . . . . . . . . . . . . . . . . . . . . . . . 68
Baccalaureates Awarded to Black Students at HBC Us and AllInstitutions, by Field, 1980-81 . . . . . . . . . . . . . . . . . . . . . . . . . . . . . . . . . . . . . . . . . . . . 72
Major Federal Science and Engineering Education Programs forHBCUs and Minority Students . . . . . . . . . . . . . . . . . . . . . . . . . . . . . . . . . . . . . . . . . . . 74
Boxes2-A Handicapped Scientists: The Invisible Minority . . . . . . . . . . . . . . . . . . . . . . . . . . . . . . 822-B Retaining Hispanics and Blacks in Engineering:
California’s Minority Engineering Program .* ..,.* . . . . . . . . . . . . . . . . . . . . . . . . . . 842-C Douglass Project for Rutgers Women in Mathematics and Science . . . . . . . .......862-D The Neal Report *.. .*** ***...*******.*.*******.*****..*..*.***.**.****.. 872-E Undergraduate Research Participation: U.S. Department of
Energy Student Research Program . . . . . . . . . . . . . . . . . . . . . . . . . . . . . . . . . . . . . . . . 882-F Community Colleges: An Alternate Entry Route? ● *..0 ***o ***0 o*O*o 0***..*** 902-G Why Blacks Persist to the Baccalaureate at the University
of South Carolina . . . . . . . . . . . . . . . . . . . . . . . . . . . . . . . . . . . . . ● . * * * . . * . .*****... 93

Chapter 2
Undergraduates in Science
THE IMPORTANCE OF UNDERGRADUATE EDUCATION
A 4-year college degree is the first step toward a career in science or
engineering. 1 For future scientists, college provides an education in the fundamentals of
science and engineering, as well as experiences that help them to choose an appropriate
career direction.
The undergraduate years are critical in shaping students’ career plans. During
college, most students decide on a particular field of study, and whether to go
immediately to graduate school or look for a job. Students' experiences in and out of the
classroom combine with their perceptions of the job market to steer them toward or
away from particular majors. Many students enter college with broad plans — medicine,
engineering, or biology — but rarely with a commitment to a specific career, such as
academic research in virology. For example, the typical high school graduate interested
in engineering may take some courses in mechanical engineering as a freshman, and then
develop a specific interest in designing satellite steering mechanisms.
The quality of education students receive depends upon the resources, priorities,
curricula, staff, fellow students, and ethos of the college they attend — the entire
institutional environment. Given the preparation of entering students, colleges
determine how many students graduate with science or engineering degrees, and the
quality of their preparation for graduate school and entry to the work force.
1. Nearly all scientists and engineers enter and graduate from 4-year colleges.However, over one-half of the 3,300 institutions of higher education are 2-year, orcommunity, colleges. Community colleges fill two major roles related to science andengineering: training technicians and continuing education. Two-year institutions are animportant source of technicians and technologists, who are a vital part of the researchwork force. Another role of community colleges is to help students “catch up” andtransfer to 4-year institutions. Although not a significant source of baccalaureate levelscientists, many 2-year institutions feed talent to engineering colleges. Unless otherwisenoted in this chapter, colleges and universities refer to institutions that award at leastthe baccalaureate degree. See Cheryl Fields, "Community Colleges Discover They are atthe Right Place at the Right Time," Governing, February 1988, pp. 30-35.
13

The Supply of College-Level Science and Engineering Students
American higher education attracts and educates an ample supply of potential
scientists and engineers. Over a million new students enter 4-year colleges each year.
Over one-third of these freshmen are interested in science and engineering. And despite
the large proportion of students abandoning technical majors during college, U.S. colleges
and universities graduate large numbers of baccalaureate scientists and engineers each
year. Natural science and engineering (NSE) have maintained a steady share among
baccalaureate
figure 2-l).
Students
engineering as
degrees, around 20 percent (with ups and
respond well to changing demand in the
downs in various fields) (see
labor market, for science or
well as other fields. For instance, the late-1970s’ boom in engineering and
computer science jobs powered a large, rapid increase in engineering enrollments among
new freshmen as well as students already in college. Several disquieting trends, however,
now challenge the assumption that this baccalaureate largess will continue. By far the
most important, the number of college-age youths in America is dropping and will hit its
lowest point around 1996, with modest increases expected early in the next century.
Most observers anticipate that this foreshadows a substantial dip in college enrollments,
with science and engineering suffering a proportionate drop. This decline might be
compensated in part by aggressive college recruiting of women, members of racial and
ethnic minorities, and the physically handicapped, and, in part, by increasing general
interest in science and engineering (see box 2-A). However, rising student interest in
high-paying business careers and the historic low participation of
in science bode ill for this strategy. Equity of access to college in
and engineering majors in particular remain contentious issues
principle. 2
minorities and women
general and to science
in practice, if not in
2. A host of factors — test scores, grades, extracurricular activities, teacherrecommendations, student interviews — are weighed by colleges to predict freshmenperformance and make admission decisions. The use of standardized tests, the SAT andACT, has been controversial. Critics claim that these tests, normed to the nationalpopulation of college-bound high school seniors, contain systematic biases against all butwhite males. The issue is not the test scores themselves but how they are used inadmissions. A recent report, based on interviews and surveys at seven institutions thatno longer require standardized tests for admission, shows that applications haveincreased with announcement of the new policies. See National Center for Fair and OpenTesting, Beyond Standardized Tests: Admissions Alternatives That Work (Cambridge,MA: FairTest, 1987). Also seeOfficers Make Better Decisions,July 27, 1988, p. A20.
Elizabeth Greene, “SAT Scores Fail to Help AdmissionAnalysts Contend,’ f The Chronicle of Higher Education.
14

35
3 0
2 5
2 0
15
10
5
0
Figure 2–1.– Science/Engineering as Percentof All Baccalaureate Degrees, 1 950–86
“.All S/E a
“.
I I I I I I I
1950 1955 1960 1965 1970 1975 1980 1985
KEY: S/E = science/engineer ing.NSE = natural science and engineering.
alncludes the social sciences.blncludes engineering and the physical, life, mathematical, and
computer sciences, but not social sciences.
SOURCE: Betty M. Vetter and Henry Hertzfeld, “Federal Funding of Scienc e
and Engineering Education: Effect on Output of Scientists and Engineers,1945– 1985, ” OTA contractor report, 1987, based on U.S. Department ofEducation data.
15

The near-term irreversibility of demographic trends and increased “competition"
among careers and curricula for students raise several concerns about the ability of
undergraduate institutions to continue to produce a well-prepared supply of
baccalaureate scientists and engineers. Such concerns include:
● the factors influencing undergraduates’ decisions to major in science or
engineering, and the factors attracting or discouraging them from
pursuing these fields;● the access to college and to technical majors for students of all
backgrounds, for women and men, for Blacks, Hispanics, and Asians as
well as whites (ensuring a broad enrollment base);● the ability of colleges and universities to provide a high-quality and
appropriate undergraduate education for students pursuing technical
jobs or graduate study; and● the effects of the labor market, Federal policies, and college
experiences on students’ decisions to seek careers in science or
engineering.
This chapter looks at each of these areas in turn, focusing on the Federal role in each.
Student Interest
The manyn
in Science and Engineering
motivations underlying the choice of college and major are not well
understood 3 (see table 2-l). Students develop interests early; many science and
engineering students do so before high school. These interests reflect many factors,
including innate aptitude, experiences in and outside of school, and the combined
influences of family, friends, teachers,
In the aggregate, students’ early
declaration of career plans (although
and society. 4
intentions predict actual college enrollments and
individual plans often shift). Students who are
3. See U.S. Congress, Office of Technology Assessment, Educating Scientists andEngineers: Grade School to Grad School, OTA-SET-377 (Washington, DC: U.S.Government Printing Office, June 1988), pp. 23-25, 33-34.4. Factors affecting the development of students! interest in science and engineering,and their preparation for college-level science and engineering, are discussed in U.S.Congress, Office of Technology Assessment, Elementary and Secondary Education forScience and Engineering, SET-TM-41 (Washington, DC: U.S. Government Printing Office,December 1988).
16

Table 2-1.-Factors Affecting Undergraduates’ Choiceof a Science or Engineering Major
Most students have decided on a major by the time they enter college. Innateinterest, school experiences, and teacher influences play a large role. Demographicfactors, particularly socioeconomic advantages, parents’ backgrounds, and education andcareer values associated with certain ethnic groups, confer preferences that are difficultto affect through policy. However, there is substantial readjustment during the collegeyears, as students tackle college-level courses, encounter new subjects, and face theprospect of earning a living. Many students leave science or engineering altogether;some shift among the sciences; and a few enter from nontechnical majors. Variousfactors during the college years encourage students to enter or stay in science orengineering.
Factors that attract students:
● Job market for scientists and engineers
● Academic preparation and achievement in high school (particularly includingcoursework in mathematics; science and computer coursework are alsoimportant)
Factors that reduce attrition (and improve the chances of college graduation in any field,not just in science or engineering):
●
●
●
●
●
●
SOURCE:
University attention to student completion (“institutional nurturing”)
Intervention programs and peer support
Research participation
Good teaching
Financial support
Part-time work or cooperative study
Office of Technology Assessment, 1988.
17

interested in science and engineering early on in high school are more likely to stay with
and graduate in science or engineering.5 Similar ly , freshmen plans, in the aggregate,
have foreshadowed the supply of baccalaureate scientists and engineers in various fields
4 years later. 6 Most science and engineering baccalaureates had a serious interest in
these fields by the time they completed high school, although many changed majors
during college. While students still enter the science and engineering pipeline during the
first 2 years of college, the entry gate is closed for most midway through college because
of the need to choose among courses for any given major.
Entering freshmen also take note of the current job market.
opportunity trends are good lead indicators; rapid rises in starting salaries suggest a
shortage, and students usually respond. Since salaries rarely go down, adequate supplies
or surpluses are usually indicated by little or no real growth in salaries. 8
The influence of Federal policies on undergraduate student interest is remote and
indirect, limited mostly to influence on the job market for scientists and engineers and
high-visibility research and development (R&D) initiatives. While Federal student aid is
instrumental in getting students into college, such aid is given irrespective of major and
does not influence students' choice of field.
5. Kathleen G. Sparrow, “A Profile Differentiating Female College Science MajorsFrom Conscience Majors: A Predictor Set of Variables," presented at the NationalConvention of the National Association for Research in Science Teaching, Washington,DC, April 1987.6. Trend data on B.S. awards and freshmen interest illustrate this relationship. Oneexample is freshmen interest in engineering in the early 1970s. This was a period ofupheaval for technical personnel: in addition to the shutdown of Apollo, Congress haddecided not to fund supersonic transport development, defense contracts were declining,and large numbers of engineers in areas near major aerospace contractors such as Boeing,Hughes, and Lockheed were out looking for work. As the job market for engineers beganto recover in the mid-1970s, so too did freshmen interest in engineering majors. Theincrease in engineering degree awards in the late 1970s correlates almost perfectly withthe trends in freshmen majors in survey data 4 years earlier (see Kenneth C. Green,University of California, Los Angeles, personal communication, 1987). The downturn infreshmen interest in engineering majors and careers that began in 1982 should manifestitself in the last years of the 1980s (indeed, the most recent data show a slight decreasein engineering degree awards).7. U.S. Congress, Office of Technology Assessment, Demographic Trends and theScientific and Engineering Work Force, OTA-TM-SET-35 (Washington, DC: U.S.Government Printing Office, December 1985), pp. 34-40.8. Nestor E. Terleckyj, “Employment of Natural Scientists and Engineers: RecentTrends and Prospects,” presented at the Workshop on the Prospective and ExpectedEconomic Effects of the Changing Age Structure of the U.S. Population, NationalScience Foundation, Washington, DC, July 1987.
18

Changes in social values also affect students’ career plans. According to surveys,
students of the 1980s increasingly value high salaries, career advancement, professional
reputation, and comfortable lifestyles, and place far less importance on community and
environmental activism and self-exploration than did students in the 1960s.9 Majors
leading to highly-paid, visible careers have grown the fastest. Within the sciences,
engineering and computer science majors have grown, while social science majors have
dwindled.
Information on entering college students, and their eventual college performance
and degrees, can help describe who chooses and stays with science. A large proportion of
entering freshman are interested in science and engineering majors. Among incoming
full-time freshman in 4-year institutions, about one-quarter plan to major in NSE, and
slightly over 30 percent over all science and engineering fields. 10
However, student preferences have shifted away from science. The share of
incoming college freshmen interested in NSE has declined slightly, from 27 percent of
first-time, full-time freshmen in 1978, to 24 percent in 1986. During that same period,
interest in all of science and engineering, including the social sciences, declined from 37
percent to 34 percent.11 Figure 2-2 shows the 1977-87 trend in planned majors among
freshmen at 2- and 4- year institutions.l 2
9. Alexander W. Astin et al., The American Freshman: Twenty Year Trends 1966-1985 (Los Angeles, CA: University of California at Los Angeles, CooperativeInstitutional Research Program, January 1987), pp. 14-26, 97.10. The more restrictive definition, natural sciences or engineering, is used throughoutthis section, although science and engineering are often defined broadly to include socialand behavioral sciences.11. The absolute numbers have been declining as well. In the fall of 1986, 246,260students, or 24 percent of first-time, full-time freshmen in the Nationts 4-year collegesand universities, planned to major in natural science or engineering (NSE). In 1978,285,557 entering students (27 percent of the freshmen in 4-year institutions) expressed apreference for NSE majors. Enrollments are surprisingly stable in the Nation’s 4-yearcolleges and universities, considering demographic trends and recent reductions ingovernment-funded student aid. Unless otherwise indicated, all references to studentpopulations refer to the population of first-time, full-time freshmen entering theNationts 4-year colleges and universities each fall, as surveyed by the CooperativeInstitutional Research Program (CIRP), Higher Education Research Institute, Universityof California at Los Angeles. Natural sciences and engineering includes premed majors(in 1986, 3.8 percent of all freshmen). See Green, op. cit., footnote 6. The trend datacited below on freshmen preferences are derived from this source.12. The lack of comparability in the population of institutions, more than the changefrom 1986 to 1987, accounts for the differences reported here. Nevertheless, thedifferences are small.
19

2 0
15
Figure 2–2.–Freshmen Planned Majors,by Science/Engineering Field, 1 977–87
10 -
. ------s----- - - - - - - - - - - -- - - - - - - - - - - - - - -- - - - - - - - - --.Physical sciences/
+
math e m a tics
o I I
1977 1980 1984 1987
SOURCE: Cooperative Institutional Research Program, The American Freshman(Los Angeles, CA: University of California, Los Angeles, annually).
20

The decline has not been steady or consistent. Freshman interest in selected
science and technical majors such as computer science and engineering rose fairly
steadily between 1977 and 1983,13 as students seeking recession-proof careers gravitated
toward high-technology fields. The boom in the semiconductor and computer industries
attracted undergraduates while interest in other science fields dropped correspondingly.
Freshman interest in engineering in 4-year institutions rose from 10.2 to 11.4 percent
between 1978 and 1983, while interest in computer science majors tripled from 1.2 to 4.9
percent during the same period. Beginning in 1984, however, both engineering and
computer science declined sharply in popularity, while interest in social sciences began
to rise. Most shifts occur between related fields, as students already interested in
science in general seek a specialty with healthy job prospects.
Freshman interest in careers, as might be expected, parallels interest in majors.
About one-third of NSE majors plan to be engineers, and nearly one-fifth plan medical
careers. Interest in a research career dropped from 9.5 percent in 1978 to under 7
percent in 1986, although this varies by field. Physical science majors are twice as likely
to be interested in a research career as other NSE majors.
Very few NSE students are interested in teaching: in 1986, just over 1 percent of
these freshmen expressed interest in a career in elementary or secondary school
teaching, compared to 10 percent of students in other majors. The already low
proportion of freshman NSE majors planning teaching careers is only likely to decline
further while these students progress through college; in all likelihood many will be
recruited away from education and encouraged to pursue academic, research, or other
“professional" careers by family, friends, and faculty. Role models are very important in
recruiting undergraduates into careers. "Who is to teach mathematics and science?" has
become a more urgent refrain than "who is to do research?"
Freshmen at different types of institutions tend to have different major and career
preferences (see table 2-2 and table 2-3) Students at private institutions are slightly
more likely to be interested in science, and less likely to go into engineering. And
interest in science and engineering majors is much stronger among freshmen at more
select institutions, particularly for women, as shown in table 2-4.14 Freshmen at the
13. Astin et al., op. cit., footnote 9.14. Ibid., pp. 69-71, 85-86. ‘SelectM is defined as mean SAT scores of freshmen.
21

Table 2-2. — Planned Majors and Careers of Freshmen atAll Institutions, by Sex, Fall 1987
(in percent)
MajorS/E pool
EngineeringSocial sciencesBiological sciencesPre-medicinePhysical sciencesComputer science
Total
29.39.48.15.52.52.21.6
Men
31.712.0
5.66.42.52.92.3
Women
22.62.7
10.54.52.51.50.9
CareerEngineer 8.5 15.2 2.6Scientific researcher 1.5 1.8 1.2
NOTE: Biological sciences includes agriculture and forestry; physical sciences includesmathematical sciences. Total is first-time, full-time freshmen at all institutions,including 2-year institutions. Total number of students in the unweighed sample was209,627; percentages reflect weighted national norms.
SOURCE: Alexander Astin et al., The American Freshman: National Norms for FaZl1987 (Los Angeles, CA: University of California, Los Angeles, Cooperative InstitutionalResearch Program, 1988), pp. 21-22, 37-38, 53-54.
22

MajorS/E pool
Table 2-3. — Freshmen’s Planned Majors and Careers byType of Institution Attended, Fall 1987
(in percent)
EngineeringSocial sciencesBiological sciencesPre-medicinePhysical sciencesComputer science
Allinstitutions(incl. 2-year)
29.3
9.48.15.52.52.21.6
4-Yearcolleges
27.3
6.99.84.02.42.41.8
Alluniversities
40.2
13.810.4
6.64.93.11.4
CareerEngineer 8.5 5.9 12.6Scientific researcher 1.5 1.4 2.4Teacher 8.1 10.9 4.2
NOTE: Biological sciences includes agriculture and forestry; physical sciences includesmathematical sciences. The total unweighed number of institutions (including 2-yearinstitutions) in the sample used for calculating national averages was 390, with anunweighed student population of 209,627. This included 53 universities, with anunweighed student population of 91,993; and 278 4-year colleges, with an unweightedstudent population of 101,221. For sampling and weighting methodology, see sourcebelow, pp. 99-105.
1987 (Los Angeles, CA: University of California, Los Angeles, Cooperative InstitutionalResearch Program, 1988), pp. 21-22, 37-38, 53-54.
23

Table 2-4. — Freshmen Interest in Science and Engineering Majorsby Selectivity of University Attended and Sex, Fall 1987
(in percent)
MenPublic univ. Private univ.Least Mostselect select
S/E Major 45.7 50.8Natural science 16.4 18.8Social science 4.6 9.7Engineering 24.7 22.3
S/E CareerSci . researcher 2 .0 3.4Engineer 21.9 22.6
Least Mostselect select
37.5 56.114.9 17.49.6 14.7
13.0 24.0
1.8 4.511.3 17.9
WomenPublic univ. Private univ.Least Most Least Mostselect select select select
28.6 37.5 29.2 47.112.8 17.6 11.7 17.611.3 15.9 14.6 20.04.5 4.0 2.9 9.5
1.5 2.7 1.3 3.74.5 4.3 2.6 7.8
NOTE: The 53 universities in the unweighted survey sample included 27 public universities,with an unweighed student population of 64,392; and 26 private universities, with anunweighed student population of 27,601. The percentages reflect weighted nationalestimates. Selectivity level of low, medium, or high determined by mean total SAT/ACTscores of freshmen. See source below, p. 103, for details.
SOURCE: Alexander AstinAngeles, CA: UniversityProgram, 1988), pp. 69-71.
of California, Los Angeles, Cooperative Institutional Research
24

most select universities are twice as likely as freshmen at the least select universities to
plan careers as scientific researchers.
Trends in Degrees: Field Differences
Baccalaureate awards in science and engineering have tracked overall degree
awards, maintaining a fairly steady 30 to 32 percent share for the past few decades. This
apparent constancy, however, masks substantial changes in individual fields. Natural
sciences and engineering have shown more variation, ranging from about 16 to 21 percent
in the past decade, with slight increases in recent years.
Scientists and engineers work in a variety of places and use different skills.
Astronomy is dominated by Ph.D.-trained basic researchers in universities, while many
B.S.-trained computer scientists and engineers develop products in high-technology
companies. While the sciences are broadly similar — in the kind of students they attract,
the dynamics of enrollments, degree awards, and job markets — there are significant
differences between fields. Analysis of education and employment patterns, and
interaction of job markets and student interest, are instructive when disaggregated byfield. 15 Since shortages and surpluses occur at the level of the specialty rather than for
●
science and engineering as a whole, looking at this finer level of detail is important.
Science and engineering B.S. awards (following the pattern of all B.S. degrees) rose
rapidly in the 1960s, peaked in 1974, and then plateaued with relatively slight increases
in recent years (see figure 2-3). Physics degrees have been relatively steady, dropping
slightly through the 1970s and increasing again since 1980. In the life sciences, degrees
peaked in 1976. The social sciences went through the most rapid increases into the early
1970s, before flattening out for a decade or so. Engineering has followed a different
pattern, with slow increases until the 1970s, when degree-taking took off in response to
burgeoning job offers and salaries. Most chemists work in industry, and have salaries
higher than most other scientists. Bachelor's degree production has been quite steady
since the mid-1960s, with slight declines in recent years.
15. For a recent review that disaggregates data on science and engineering fields, seeU.S. Congress, Office of Technology Assessment, “Preparing for Science and EngineeringCareers: Field-Level Profiles,’t Staff Paper, January 1987. The National ScienceFoundation prepares occasional data profiles on individual fields, for example, NationalScience Foundation, Profiles — Mechanical Engineering: Human Resources and Funding,NSF87-309 (Washington, DC: 1987).
25

Figure 2–3. -Baccalaureate Degrees, 1950–86
1,200,000
1,000,000
8 0 0 , 0 0 0
6 0 0 , 0 0 0
4 0 0 , 0 0 0
2 0 0 , 0 0 0
.
0
KEY:
T o t a l , ’
I 950 1955 1960 1965 1970 1975 1980 1985
S/E = science/engineering.
SOURCE: Betty M. Vetter and Henry Hertzfeld, “Federal Funding of Scienceand Engineering Education: Effect on Output of Scientists and Engineers,1945– 1985, ” OTA contractor report, 1987, based on U.S. Department ofEducation data.
26

Geological science degrees are closely tied to industrial indicators such as the
world market price of oil. This determines the health, i.e., the hiring and R&D posture,
of principal employers. In the concentrated and cyclical world of natural resources,
there is a surplus of bachelor's- and master’s-level earth scientists who started college
just before the current downturn in the petroleum and mining industries curtailed
exploration and research. As a result, undergraduate enrollments plummeted. B.S.
awards, which had doubled between 1974 and 1984, declined over 20 percent from 1985 to
1986, and 25 percent from 1986 to 1987.16
It is important to look at mathematical and computer sciences degree data
together, since the rapid drop in mathematics degrees during the late 1970s was
accompanied by a boom in computer science degrees (in response to burgeoning industry
demand for computer specialists). By 1983, bachelor% degrees in mathematics had
started rising again. The boom years of computer sciences testify to the ability of
students and universities to respond to market demand; the growth rate in baccalaureate
awards in the late 1970s and early 1980s was 20 and even 35 percent per year (although
many argue this rapid growth stemmed merely from the redesignation of courses,
faculty, and students as “computer science” with little change in actual course content,
faculty expertise, and student preparation).
In the life sciences, the market for physicians influences biological and medical
science undergraduates, since many of them are planning medical rather than scientific
careers. In some sense, medicine and research biology compete for students; when the
market for graduate students is down, more life science graduates go to medical school.
There is a large supply of life scientists, and extended graduate study is necessary to find
a job above the level of technician. But degree awards in the life sciences have been
declining steadily for the past decade and represent a shrinking proportion of science
degrees.
SCIENCE AND ENGINEERING STUDENTS
Although science and engineering students differ from the average college
student — they tend to be higher achieving academically and are much more likely to be
white and male — changes in the size and composition of the college student population
16. Earth sciences degree data based on surveys conducted by the American GeologicalInstitute, cited in Manpower Comments, vol. 23, No. 5, June 1986, p. 18.
27

trickle through to science and engineering. Policies that affect higher education in
general also affect the science and engineering pool, albeit adjusted for the particular
students, universities, and job markets that dominate science and engineering.
Black, Hispanics, and Native Americans
Minorities’ college enrollment and retention to degree in science and engineering
reflects the generally lagging educational success of minorities (see table 2-5).17 The
continuing social barriers that set minorities apart — language and cultural differences,
poverty, political powerlessness, prejudice, and discrimination— are in many cases
exacerbated by the traditional white male dominance of the science and engineering
professions. 18
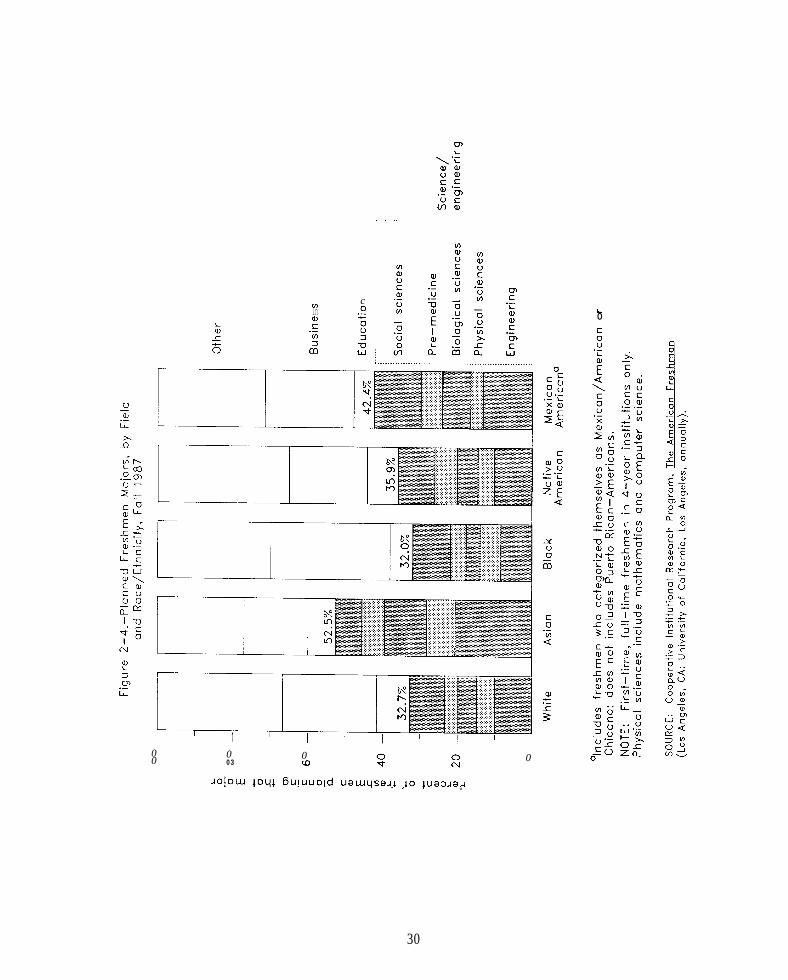
There are relatively few Blacks, Hispanics, and Native Americans in science and
engineering. Asians prefer science and engineering to other majors (see figure 2-4).
Among high-achieving students, according to Cooperative Institutional Research Program
(CIRP), Blacks and Hispanics, as well
majors.
Blacks have made substantial
as Asians, are more interested in NSE than in other
gains in higher education, but their inroads into
science and engineering have been modest, and increases have slowed in recent years.
Those Blacks who do well academically and take many high school mathematics and
science courses are about as likely as their white peers to be interested in science19 Blacks earn about 3 percent of science and engineering baccalaureates, and 6majors.
percent of all baccalaureates. Only in the social sciences do Blacks earn more than 5
percent of the B.S. degrees conferred. Interest in the social sciences was inspired by
early Black leaders in education, sociology, and political change; in the rest of the
sciences and engineering, there are few role models and little cultural tradition which
promote research careers. And in science and engineering more so than in other majors,
17. Linda S. Dix (cd.), Minorities:
Engineering Personnel, National Research Council (Washington, DC: National Academy
Participation and Success (Denver, CO: Education Commission of the States and theState Higher Education Executive Officers, July 1987).18. Lisbeth B. Schorr, Within Our Reach: Breaking the Cycle of Disadvantage (NewYork, NY: Anchor Doubleday Press, 1988).19. Valerie Lee, ~lIdentifying potential Scientists and Engineers: An Analysis of theHigh School-College Transition,n OTA contractor report, 1987.
28

Table 2-5. — B.S.by
Total a
All science/engineering 293,200
Physical sciences/computer sciences/mathematics 62,700
Life/environmentalsciences 54,000
Social sciences/psychology 96,600
Engineering 79,800
Degrees in Science and Engineering,Race/Ethnicity, 1984
Percentminority b Black Hispanic
7.5 9,400 12,300
5.3 1,500 1,700
6.3 1,300 2,000
11.4 5,000 6,000
5.6 1,700 2,700
NativeAmerican
400
100
100
(c)
100
~Includes “other” and no report.““Percent minority” includes only Black, Hispanic, and Native American.C To o few cases to ‘eport.
NOTE: Rounded numbers reported in original source.
SOURCE: National Science Foundation,
29
0
. . . . . . . . . .
CDs.-.c(nIn
a)L0—
v.—L
La)
-cV
rul
00
003
0co 0
, ,, , u
30

Blacks are much more likely to drop out
where women have a stronger showing in
m e n .20
Hispanics are the Nation% fastest
than than whites. Blacks are the only group
science, and particularly in engineering, than
growing minority group in the college-age
population. They are only 4.5 percent of undergraduates, and more than one-half of
these students attend community colleges. The Hispanic population — two-thirds
Mexican-American, 12 percent Puerto Rican, 12 percent Central and South American,
and 5 percent Cuban — is concentrated in California, Texas, Florida, and New York. 21
Hispanics! success in education varies with socioeconomic status and values across these
subcultures, and fares better in some States than in others. Their educational difficulties
are complicated because many of them are recent immigrants with little formal
education. High-achieving Hispanic freshman (with an equivalent of “A” or “A-" high
school grade point average (GPA)) are less likely to be interested in science and
engineering majors, and more likely to be interested in business majors, than all Hispanic
freshmen.22 Hispanic degree-taking in science and engineering fields is low, about 3
percent of baccalaureates. They are more evenly spread among science and engineering
fields than Blacks, with a strong showing in the life sciences.
Native Americans may be the most disadvantaged minority group in the United
States, as measured by their low socioeconomic status and educational and occupational
attainment. They are 0.8 percent of the college-age population, but only 0.2 percent of
20. Another factor is that the armed services compete for minority high schoolgraduates. The armed forces are attracting a greater share of high school graduates. By1985, over 90 percent of Blacks who enlisted were high school graduates, a 25 percentincrease in enlistment from 1980. Solomon Arbeiter, ‘f Black Enrollments: The Case ofthe Missing Students,” Change, vol. 19, No. 3, May/June 1987, p. 17. Also see HollyHexter and Elaine E1-Khawas, Joining Forces: The Militaryts Impact on CollegeEnrollments (Washington, DC: American Council on Education, October 1988).21. “Hispanics: Some Basic Facts,t’ The ChronicZe of Higher Education, Sept. 16, 1987,p. A36. Early in 1987, the newly-founded Hispanic Association of Colleges andUniversities qualified 60 U.S. institutions (mostly community colleges) for membership,based on a criterion of at least 25 percent Hispanic enrollment. By the year 2000, 100institutions are expected to qualify. Cheryl M. Fields, ~tDemographic Changes BringLarge Hispanic Enrollments to Over 60 Institutions,’f
The ChronicZe of Higher Education,Oct. 7, 1987, p. A40.22. Green, op. cit., footnote 6.
31
science and engineering baccalaureates. There is little cause for optimism about
increasing their participation in science and engineering. 23
Intentions of minorities may not be as predictive as they are for white students.
Even though minorities, especially Blacks, may enter college with high (and often
unrealistic) expectations, their usually poorer preparation for technical majors may pave
the way for disappointment in ambitious career and degree plans.
The generally poor precollege preparation of most
particularly telling for science and engineering. On average,
fewer advanced mathematics and science courses than whites,
minority exposure to science and mathematics in high school
Blacks and Hispanics is
Blacks and Hispanics take
Educators claim that low
and excessive reliance on
standardized test scores bars many Blacks from college-level science and engineering.
And the paucity of minority role models for minority children is particularly severe in
science and mathematics; over one-quarter of students in public high schools are Black or
Hispanic, but nearly 90 percent of all teachers and about 93 percent of mathematics and
science teachers are white. 24
What gains minorities have made in science and engineering have derived largely
from broad national higher education policies and full-fledged institutional commitment
to increasing minority access to higher education. Two broad policy strategies have been
applied towards that goal: financial aid (student aid for individuals and institutional aid
for historically Black institutions) and special social and academic intervention programs
for minority students of all levels. Student aid has been particularly important in helping
minorities attend college. Well-organized intervention programs can attract students to
science and engineering careers and significantly increase their likelihood of completing
an undergraduate degree in science or engineering (see appendix A and box 2-B).
23.(Washington, DC: U.S. Department of Education, Office of Educational Research andImprovement, Center for Education Statistics, March 1987). The term ‘f AmericanIndians’ t is also used for this group. The small number of Native Americans has precluded
24. See Office of Technology Assessment, op. cit., footnote 4, ch. 3; data from Iris R.
(Research Triangle Park, NC: Research Triangle Institute, November 1987), table 35.
32

Asians
Recent waves of immigrants to the United States, Asians, have spawned a
generation of educational "superachievers” who are especially prominent in science and
engineering at the undergraduate level. Predominantly Chinese, Korean, and
Indochinese, these children of refugees and of the affluent alike distinguish themselves in
mathematics, as reflected by SAT scores, and by other measures, including high school
grades and time spent on homework.25 Dedication, family support, and hard work drive
many Asian students toward the elite research universities for their undergraduate
education. The 1987 freshman classes at the Massachusetts Institute of Technology
(MIT), the California Institute of Technology (Caltech), and the University of California,
Berkeley, for example, were over 20 percent Asian. They generally have very high
educational aspirations.
Asians are the group most interested
consistently enter science and engineering
group, however, Asians are diverse. While
Asian immigrants include many refugees
in NSE. They also are the only group who
majors while in college. Like any ethnic
many have done well, the newest wave of
from different cultures, often with little
education and few portable skills, and these children have fared more poorly in U.S.
schools. 26
Women
Among freshmen, the proportion of women planning to pursue NSE majors increased
slightly between 1978 and 1986, from 31 to 33.27 However, women are more likely to
drop out of science and engineering majors, and women% degree-taking in science and
engineering overall has plateaued. Although more women start out interested in
scientific majors and careers, their limited career opportunities may be stifling that
interest.
Women planning NSE majors have better high school grades than men. In 1986, 55
percent of these women had "A” to “A-" high school GPAs, compared to 51 percent of the
25. David Brand, “The New Whiz Kids,’t Time, Aug. 31, 1987, pp. 42-51.26. In short, the %uperachiever” or ttmodel minoritytl image is overstated. see office
of Technology Assessment, op. cit., footnote 3, pp. 55-56.
27. Green, op. cit., footnote 6. The proportional increase masks a fall in absolutenumbers.
33

men. However, freshmen men planning NSE majors are more likely to rate themselves as
“above average” than are the women planning these majors. Reports from college
educators are that women students, particularly those in traditionally male majors such
as engineering and the physical sciences, tend to have less self-confidence and drop out
of a course or major much more easily than do men, even though they are just as capable,
performing just as well, and getting the same grades. 28
Among NSE majors, females are more interested in research or medical careers
than their male counterparts, and less interested in engineering; women tend toward
biology, and less towards mathematics-based science and engineering majors (see table 2-
6 ) .2 9
Although women have made inroads the last two decades into science and
engineering, there are still broad gaps in participation (see box 2-C). Women have higher
unemployment rates than men in every field of science, at every degree level, and at all
levels of experience. They also earn less in every employment sector. So although
women% share of degrees in science has increased markedly in the last 15 years, their30 Since 1983, the proportion earning degrees ‘n
opportunities for advancement still lag.
computer science, biological science, and the physical sciences in general have leveled
off. A “chilly climate” for women still prevails in many college classrooms. Continued
gains for women in science are far from assured.31
28. William K. LeBold, ‘tWomen in Engineering and Science: An UndergraduateResearch Perspective,”
Academy Press, 1987). Also see Sheila E. Widnall, ~~AAAS presidenti~ Lecture: VOiCeSfrom the Pipeline,f’ Science vol. 241, Sept. 30, 1988, pp. 1740-1745.29. A related phenomenon is computer phobia among women; even if this fear isovercome, there is evidence that women relate to the machine differently than men.See, for example, Sherry Turkle, ‘~ Computational Reticence: Why Women Fear theIntimate Machine,ft Science for the People, September/October 1988, pp. 6-11.30.
Press, 1983).31. Betty M. Vetter, ‘f Women in Science,tt The American Woman 1987-88: A Report inDepth, D. Shavlik and Judith Touchton (eds.) (Washington, DC: Women% Research andEducational Institute, 1987); OTA, op. cit., footnote 3, pp. 50-53; and Barbara D.
“ ~~ ~ioscimce, VOL 39, February 1989)Webster, I! Opening Doors for Women in Acade ‘1a7pp. 96-98.
34

MajorS/E pool
Table 2-6. — Planned Majors and Careers of Freshmen at 4-YearInstitutions, by Sex, 1978 and 1986
(in percent)
EngineeringSocial sciencesBiological sciencesPre-medicinePhysical sciencesComputer science
Total
36.7
10.29.27.14.54.21.5
1978
Men
45.8
18.06.88.15.45.81.7
Women
29.8
2.911.8
6.15.22.61.2
Total
33.6
10.19.45.53.82.91.9
1986
Men
41.3
17.87.05.83.94.22.6
Women
27.1
3.211.94.93.82.11.2
CareerEngineer 8.9 15.7 2.5 9.0 15.6 3.0Scientific researcher 2.8 3.4 2.2 1.8 2.2 1.4Computer programmer 2.8 3.3 2.4 3.0 4.3 1.8
NOTE: Biological sciences includes agriculture and forestry; physical sciences includesmathematical sciences. Total is freshmen at 4-year institutions only. Total number ofstudents in the unweighed sample was 209,627; percentages reflect weighted nationalnorms.
SOURCE: Kenneth C. Green, University of California, Los Angeles, personalcommunication, 1987.
35

Academic Quality of Science and Engineering Undergraduates
Apart from sheer numbers, the quality of students going into science and
engineering is of prime concern. Quality is difficult to measure, so analysts use proxies
such as grades, test scores, and surveys of faculty opinion. By all of these measures,
science and engineering have been fortunate in attracting, selecting, and keeping many
of the best students.
Entering science and engineering students tend to be higher achieving
academically, continue to have greater academic self-confidence, and have higher degree
aspirations than conscience and engineering students. Nearly one-half of 1986 freshmen
planning NSE majors reported a high school GPA in the "A" to "A-” range, compared to
one-quarter of freshmen planning other majors. NSE majors generally view themselves
as very talented, ranking their own academic and intellectual skills far higher than
average. NSE students also have had more academic coursework coming into college, in
all subjects.
NSE maintains its share of able students, despite fears that more of the best
students are choosing business and other majors (see figure 2-5). “A” to “A-” students
accounted for a slightly larger proportion of all freshman NSE majors in 1986 (4732 In the fall of 1986, almost one-fifth of all freshmenpercent) than in 1978 (43 percent).
planned to pursue the doctorate, twice the rate among other majors. Nearly one-quarter
hoped to complete some type of medical degree. Roughly equal proportions of men and33 As is true with students in other major%women in NSE planned to obtain a doctorate.
the most academically able NSE students are less interested, as freshmen, in teaching
careers.
32. Although science and engineering baccalaureates tend to have about the samecollege grade point averages as other majors (with biological scientists having slightlyhigher and engineers slightly lower grade point averages), much of any difference may bedue to variations in grading practices among courses for different majors. U.S.Department of Education, unpublished Recent College Graduate Survey data.33. Although the gap in doctoral aspirations between natural science and engineering(NSE) and non-NSE fields declines among the high-talent population, academically-ableNSE freshmen in 4-year institutions are still more likely to aspire to the doctorate thantheir peers (23 percent v. 14 percent). However, medicine is much more attractive toacademically-able NSE women (38 percent for women v. 20 percent for men).
36

2–5.–Freshmen Choice of College Major, by Achievement, 1986
—
8 0 – 1 II—
6 0 —
— 47%
4 0
2 0
0
N o n – S / E
Pre–medicine
Social sciences
Biological sciencesComputer sciencePhysical sciences
Engineering
All freshmen High achievers
KEY: S/E = science/engineer ing.
a Freshmen who report their high school grade point average as “A” or “ A - ” .
NOTE: Biological sciences include agriculture and forestry. Physical sciencesinclude mathematics.
SOURCE: Kenneth C. Green, OTA contractor report, 1987, based on data from theCooperative Institutional Research Program, University of California,Los Angeles.
37

Retention During College and Career Paths after the Baccalaureate
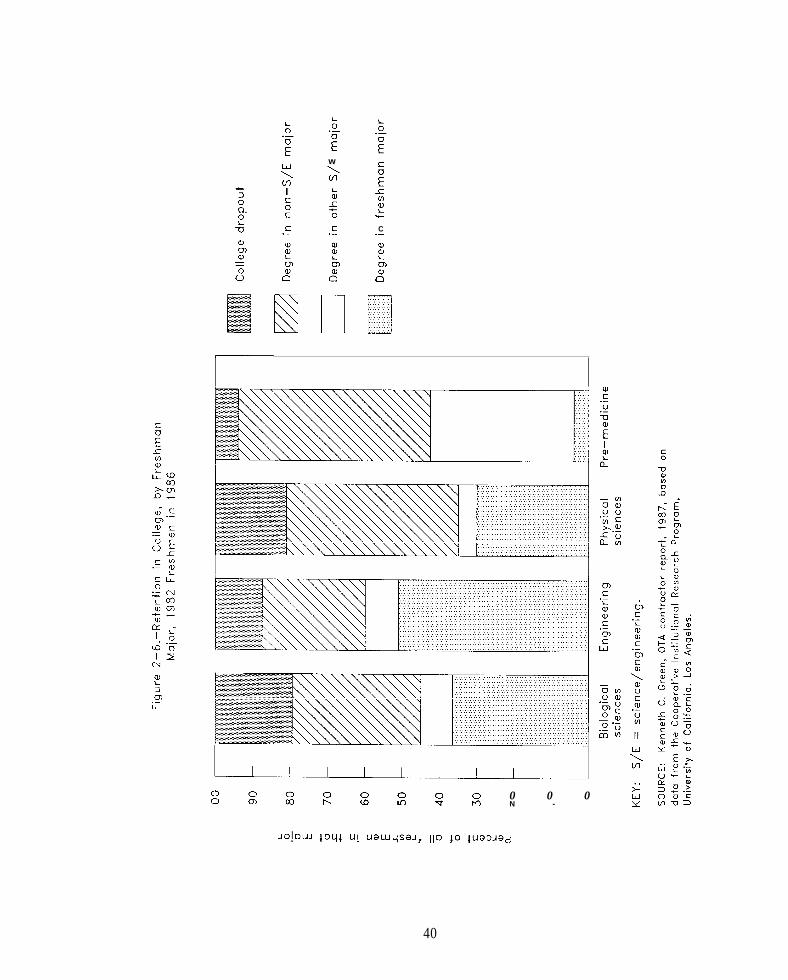
Some students enter science and engineering during college, but more than twice as
many leave (see table 2-7). Some part of this field switching can be attributed to the
higher academic ability of students in natural science and engineering. Attrition rates
change substantially over time, reflecting changes in market conditions and
corresponding student shifts in majors. One study found that NSE lost the most students;
only about one-half of freshmen who planned those majors graduated in them (see figure
2-6). In comparison, about 70 percent of business majors stayed the course in business;
about 65 percent of social science students stayed in their field. Among scientific
majors, engineering retained the most students and physical sciences the fewest. 34
Although most science and engineering baccalaureate recipients enter the work
force upon graduation (see figure 2-7), career paths vary greatly by field. A little under
one-quarter of recent natural and social science baccalaureates, and about 10 percent of3 5 Am o n g e m pl o y ed b a c c a l a u r e a t e s ,engineers, have gone on to full-time graduate study.
most natural scientists and nearly all engineers take jobs in science and engineering,
compared to less than one-third of social scientists. Unlike liberal arts majors, 80 to 90
percent of B.S. recipients in mathematics, computer science, and other physical sciences
feel that their first job out of college was related to their major.36
FEDERAL ROLES IN UNDERGRADUATE SCIENCE EDUCATION
Federal influence on science and engineering undergraduate education is most clear
in general Federal higher education policies. The large Federal education aid and access
programs, with rare exceptions, are not targeted to particular subjects. Student
financial aid and civil rights legislation make college possible for many young people,
shaping the size and makeup of the entire college student population, regardless of
34. Green, op. cit., footnote 6.35. National Science Foundation, Characteristics of Recent Science/EngineeringGraduates: 1986, NSF 87-321 (Washington, DC: 1987).36. Roslyn A. Korb, Occupational and Educational Consequences of a BaccalaureateDegree (Washington, DC: U.S. Department of Education, Office of Educational Researchand Improvement, Center for Education Statistics, March 1987), pp. 1, 7. Estimates arebased on the Department of Education% Recent College Graduate Survey of 1983-84,which surveys students about 1 year after their B.S. A liberal arts major may reflectindecision, or a hedging of one’s bets, over career directions.
38

Table 2-7. — College Student Retention, Entry, and Exit From Natural Scienceand Engineering Majors, by Field, 1981 Freshmen
Through 1985 Baccalaureates
Ratio of defectorsto recruitsin that majora
Biological sciences 1.2Engineering 2.5Computer science 1.6Physical sciences 0.7NSE 1.5Non-NSE 0.8
Percent whostayed with theiroriginal major
246117354957
aA ratio greater than one indicates that more students “defected" from, or left, thatmajor during college than entered during college.
KEY: NSE = natural science and engineering.
SOURCE: Lewis C. Solmon, "Factors Determining and Limiting the Supply of NewNatural Science and Engineering Baccalaureates: Past Experiences and FutureProspects," draft paper presented at the National Science Foundation, July 8, 1986, p. 41,based on data from the Cooperative Institutional Research Program, University ofCalifornia, Los Angeles. Note that attrition is reported as a percent of total students ata particular time, and therefore does not reflect the overall loss of students fromcollege.
39
w
J-
(uL30-lL
n
c.— C.—
0 0N -
0
40

Figure 2-7 . -Career Paths of 1984 and 1985 Science Baccalaureates in 1986
1984 and 1985 science baccalaureates
a in c1 Ud es those not in labor force.
NOTE: Total baccalaureates = 454,000 (1 00?%)Part–time graduate study = 36,900 (8%)
SOURCE: National Science Foundation, Characteristics of Recent Scienceand Engineering Graduates: 1986, NSF 87-321 (Washington, DC: 1987),
pp. 20–22, 50–51 , 54.
major. Institutional aid, particularly for historically Black and land-grant institutions,
improves the ability of institutions to deliver a quality education.
Within this context, R&D policies have spawned some much smaller but potent
science and engineering education programs to address the special needs of
undergraduate science and engineering instruction. Such programs-student research
apprenticeships, faculty development, and equipment and facilities support— enrich
undergraduate education for a few. These supplementary programs are most often
associated with specific R&D goals, and only secondarily affect educational outcomes.
The different goals of education and R&D policies have led to conflicts in
developing and administering the respective programs. Higher education policies embody
broad social goals of improving educational opportunities, particularly for the
underprivileged. Leading-edge R&D has traditionally been a profession of a few high-
achieving people and institutions, and Federal science education has targeted this elite.
The Effects of Federal R&D Policies on Undergraduate Education
Federal R&D programs affect undergraduate science and engineering education in
four major ways, from indirect to direct:
● Federal R&D spending (defense and civilian) shapes the research
agenda and national demand for scientists and engineers, which
strongly influences undergraduates’ choices of fields and careers;● academic R&D grants develop infrastructure for science and
engineering research and education, including institutions,
conferences, facilities, equipment, libraries, faculty, and technicians;● academic research grants and contracts help support and train a very
few undergraduate research assistants (the training component of
research grants, mostly targeted to research universities, focuses on
graduate students); and● research agencies fund a few special programs for undergraduate
instruction, such as research participation, faculty enrichment, and
equipment.
42

The effects of these research-oriented programs are concentrated at the major research
universities. National R&D spending is a major determinant of the supply of
baccalaureate scientists and engineers.37
Federal influence varies greatly by field. In engineering, where most students can
plan on working in industry with a baccalaureate or master's degree, the health of the
economy and perceptions of the job market shape students’ educational choices. In
scientific fields oriented to basic research, the job outlook for undergraduates is more
sensitive to Federal programs that dominate university research agendas and Ph.D.
training.
While demand for scientists and engineers depends fundamentally on R&D spending,
it is also affected by economic, industrial, environmental, regulatory, energy, defense,
and other policies that shape the national need for technological goods, services, and
workers. The Federal Government also creates incentives, such as tax policies favoring
nonprofit educational institutions, tax-free bond issues, and donations to universities and
colleges. Such indirect incentives are difficult to quantify, but they clearly invigorate
higher education. The government plays a symbolic role, too, in reflecting and
reinforcing social attitudes toward education and science.
The National Science Board estimates total national spending for undergraduate
science and engineering education is about $20 billion annually, encompassing student and
institutional aid as well as special science-related programs. From this pool of money,
science and engineering instruction draws about one-half of all spending on
undergraduate education. 38
Trends in the Federal Role
The Federal Government provides about one-third of all revenues of colleges and
universities, and nearly two-thirds of aid to undergraduates (including guaranteed
37. Lewis C. Solmon, “Factors Determining and Limiting the Supply of New NaturalScience and Engineering Baccalaureates: Past Experiences and Future Prospects,”presented at a National Science Foundation workshop, July 24, 1986. Solmon foundnational R&D spending and natural science and engineering salary advantage to be thetop two demand factors that correlate with the supply of new baccalaureate naturalscientists and engineers.38. National Science Board, Task Committee on Undergraduate Science andEngineering Education, Undergraduate Science, Mathematics and Engineering Education,NSB 86-100 (Washington, DC: National Science Foundation, March 1986).
43

loans).39 Through the early-1960s and early-1970s, Federal support of higher education
has been increasing and shifting toward direct support of students. Recently, however,
institutional and research-related support has been growing faster than student aid. In
1967, 65 percent of Federal higher education expenditures were for institutional support
(largely R&D-related), with the rest allocated to student aid. By 1975, growing student
aid accounted for 72 percent, and institutional support only 28 percent. In 1987, student
aid has dropped to less than one-half of Federal aid for higher education. 40
Federal policy influence in undergraduate education has been secondary to all-
purpose financial support, even where Federal financial support has increased. The
Federal role has been stronger in graduate education, where the links are closest to the
labor market, and weaker in elementary and secondary education, where primary
responsibility remains with the States and localities. States have provided most
institutional "mortar and brick" support, which the Federal Government has adorned with
smaller, targeted “carrot and stick” programs. In science, however, the Federal
Government has had a stronger policy role than in other areas, because of its extensive
support of graduate training and university development in science and engineering.
Early Federal science and engineering education policies were linked to other
Federal concerns: agriculture and other practical trades (the Merrill Act of 1863 and
Hatch Act of 1887); health manpower (the National Cancer Institute Act of 1937 and the
Public Health Service Act of 1944); veterans’ benefits (the G.I. Bill of 1944); postwar
scientific development (the National Science Foundation in 1950); national defense (the
National Defense Education Act of 1958); and economic opportunities (the Economic
Opportunity Act of 1964).41 With the increasing Federal involvement in higher
39. National Center for Education Statistics, Undergraduate F inanc ing ofPostsecondary Education: A R e p o r t of the 1987 NationaZ Postsecondary A i d S t u d y(Washington, DC: U.S. Department of Education, June 1988), pp. 23-27. The totalFederal contribution to higher education revenues includes direct support (about 12percent of higher education revenues), and indirect support through student aid andfederally guaranteed loans (about 13 percent of revenues) and intergovernmentaltransfers through State and local governments (about 10 percent of revenues). Theseestimates are based on Lawrence E. Gladieux and Gwendolyn L. Lewis, The FederalGovernment and Higher Education: Tradition, Trends, Stakes, and Issues (New York,NY: College Entrance Examination Board, October 1987), pp. 2-3; U.S. Department ofEducation, Office of Educational Research and Improvement, Digest of EducationStatistics 1987 (Washington, DC: 1987), p. 229. Also see Gwendolyn L. Lewis and JamieP. Merisotis, Trends in Student Aid: 1980 to 1987 (New York, NY: College EntranceExamination Board, 1987).40. Gladieux and Lewis, op. cit., footnote 39.41. Kenneth Green, ‘Government Responsibility for Quality and Equality in Higher
44

education, targeted science and engineering education programs have dwindled in
magnitude and political prominence compared to Federal student aid programs.
Financial Aid for Science and Engineering Students
Student aid is the centerpiece of Federal higher education policy. (States, by
keeping tuition low at public institutions, also subsidize access to higher education.) The
Department of Education administers various grant and loan programs, of which science
and engineering students receive a proportionate share. 42
Federal financial aid for college students was about $15 billion in the 1986-87
academic year; nearly $6 billion in grants, veterans aid, and work-study funds, and over43 Federal aid totals about three-$9 billion in federally financed and guaranteed loans.
quarters of all student aid. The pattern of Federal aid has changed, with loans increasing
in importance (as shown in figure 2-8), and the value of Federal awards relative to
college costs has dropped.44
Periodically there has been discussion of special Federal scholarships for
undergraduates majoring in science and engineering, or in other majors where there is45 Such aid could be awarded on merit as well as (or in lieu of) financialnational need.
need. In the past, the need for such scholarships was not perceived as pressing, given the
large and then-expanding number of college students, and was seen by some as contrary
to the Federal policy of awarding aid based on need. Precedent exists for special Federal
aid for undergraduates planning to teach in areas of national need (and merit-based
Education,’ f
Stauffer (eds.) (New York, NY: Greenwood Press, 1986), p. 88.42. The major research agencies’ smaller, targeted undergraduate and graduateprograms for science and engineering students are discussed separately, and are not partof the “student aid” package.430 Arthur M. Hauptman and Charles J. Andersen, “Background Paper on AmericanHigher Education: Report to the Commission on National Challenges in HigherEducation, t’ prepared for the Commission on National Challenges in Higher Education,Washington, DC, Dec. 16, 1987, p. 12.44.
Research Service, Apr. 22, 1988).45. Task Force on Women, Minorities, and the Handicapped in Science and Technology,Changing America:(Washington, DC: June 16, 1988). During the early years of the National ScienceFoundation, an undergraduate research scholars program was discussed but neverimplemented.
45

Figure 2-8.–Sources of Student Aid, in Constant 1980 Dollars, 1976–86
9 0 0 0
8 0 0 0
7 0 0 0
6 0 0 0
5 0 0 0
4 0 0 0
3 0 0 0
2 0 0 0
1000
01976 1978 1980 1982 1984 1986
NOTE: Data for 1977 and 1979 are interpolated.Data for 1988 are estimated.
SOURCE: Donald A. Gillespie and Nancy Carlson, Trends in Student Aid: 1963to 1983 (Washington, DC: The Washington Office of the College Board, December1983), p. 33; and The Washington Office of the College Board, “Update FromWashington” (Washington, DC: The Washington Office of the College Board,February 1989), p. 7.
1988
46
Federal aid has long been awarded at the graduate level for science and engineering
students). The interest in subsidizing science and engineering graduates may become
more pressing as the college-age population drops. 46
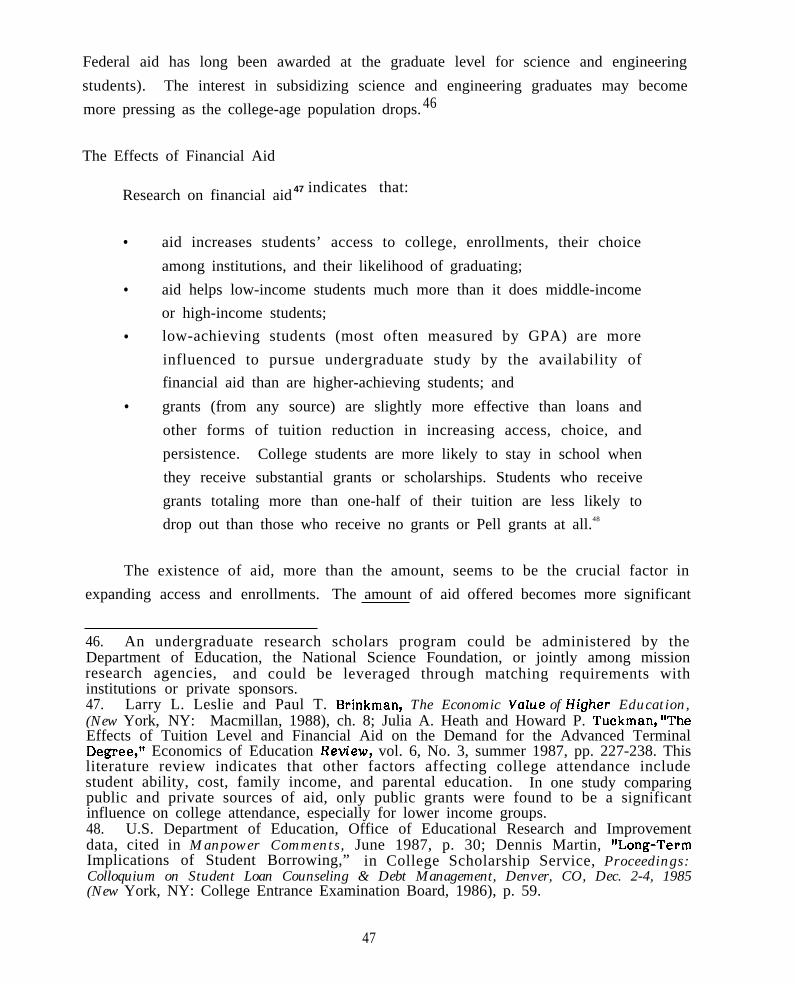
The Effects of Financial Aid
47 indicates that:Research on financial aid
● aid increases students’ access to college, enrollments, their choice
among institutions, and their likelihood of graduating;● aid helps low-income students much more than it does middle-income
or high-income students;● low-achieving students (most often measured by GPA) are more
influenced to pursue undergraduate study by the availability of
financial aid than are higher-achieving students; and● grants (from any source) are slightly more effective than loans and
other forms of tuition reduction in increasing access, choice, and
persistence. College students are more likely to stay in school when
they receive substantial grants or scholarships. Students who receive
grants totaling more than one-half of their tuition are less likely to
drop out than those who receive no grants or Pell grants at all.48
The existence of aid, more than the amount, seems to be the crucial factor in
expanding access and enrollments. The amount of aid offered becomes more significant
46. An undergraduate research scholars program could be administered by theDepartment of Education, the National Science Foundation, or jointly among missionresearch agencies, and could be leveraged through matching requirements withinstitutions or private sponsors.47. Larry L. Leslie and Paul T. Brinkman, The Economic Value of Higher Education,(New York, NY: Macmillan, 1988), ch. 8; Julia A. Heath and Howard P. Tuckman, ‘TheEffects of Tuition Level and Financial Aid on the Demand for the Advanced TerminalDegree,N Economics of Education Rew”ew, vol. 6, No. 3, summer 1987, pp. 227-238. Thisliterature review indicates that other factors affecting college attendance includestudent ability, cost, family income, and parental education. In one study comparingpublic and private sources of aid, only public grants were found to be a significantinfluence on college attendance, especially for lower income groups.48. U.S. Department of Education, Office of Educational Research and Improvementdata, cited in Manpower Comments, June 1987, p. 30; Dennis Martin, !’Long-TermImplications of Student Borrowing,” in College Scholarship Service, Proceedings:Colloquium on Student Loan Counseling & Debt Management, Denver, CO, Dec. 2-4, 1985(New York, NY: College Entrance Examination Board, 1986), p. 59.
47

in students’ choice among institutions, and in keeping them in college through a degree.
Financial aid is becoming more important in students’ decision to go to college, and
where to go.
Concerns over the rising costs of education, the ability of families to pay (parents
and students together pay roughly three-quarters of the total bill for college), and rising
dependence on loans relative to grants (loans represent more than half the total financial
assistance to college students), affects all students. Minorities show no clearcut
differences from whites in how their decisions are affected by financial aid, when
socioeconomic status and ability are statistically controlled. (Because minorities are
much more likely to be low-income, college aid is particularly important for them.)49
Increasing Enrollments
The college population has expanded and diversified with the help of Federal aid,
and science and engineering have shared in this expansion. Federal policies that
encourage college enrollments or fuel the job market increase the number of college-
educated workers, thus expanding the science and engineering talent pool. Programs
specifically aimed at science and engineering training (such as the National Defense
Education Act) or employment (such as the Apollo program) draw students into science
and engineering, although their greatest effect is reallocating talent among some science
and engineering fields.
The Federal program that boosted college attendance the most was the G.I. Bill for
veterans. It increased the number of Americans with college degrees, and as a result
increased the number of those with science and engineering bachelor% degrees. The
education deferment of the draft, legislated in 1951, was also a boon for science and
engineering, again, by increasing enrollments overall. The Vietnam draft gave a much
smaller boost to the male high school graduates entering college during the mid- to late-
1960s, with small derivative benefits for science and engineering. 50 (The majority
49. A general discussion of college financing is beyond the scope of this report. See
NY: College Entrance Examination Board, May 1988); Hauptman and Andersen, op. cit.,footnote 43; Cynthia L. Brown et al., ?’High school and Beyond: student FinancialAssistance, Student Loans, ” prepared for MPR Associates, Inc., June 1987; and RogerThompson, ‘tStudent Aid: Year of Uncertainty, ’t Editorial Research Reports, vol. 1, No.19, May 23, 1986, pp. 371-388.50. U.S. Department of Corn merce, Bureau of the Census, “School Enrollment — Socialand Economic Characteristics of Students: October 1976, ” Current Population Reports,
48

attended 2-year and vocational schools, an option that did not exist for World War II
veterans.) The sharp dropoff in Vietnam veterans after 1976 coincides with a slight
dropoff in the number of male science and engineering graduates.
However, attempting to increase the number of scientists and engineers by simply
increasing enrollments may be a policy of the past. America has the highest
participation rate in higher education in the world; more than 60 percent of high school
graduates attend some college. Women attend college at the same rate as men.
Minorities (except for Asians) attend at lower rates than Whites, for financial and other
reasons, especially their relatively poorer preparation before college. Such factors
suggest that further expansion of enrollments may be more difficult than in the past.
The bottleneck may now be the preparation children get in the schools rather than
college-level assistance; the need for colleges to do more and more remediation is
evidence of this new problem.
Financial Aid and Field Choice
Does availability or use of financial aid vary by major, and have changing patterns
of financial aid affected students choice of major or career plans? There seems to be no
strong, direct correlation. Availability of aid, and reliance on that aid, generally is51 Science and engineeringunrelated to undergraduates’ choice of major or career.
students are more likely to receive grants of all sorts and other campus-based aid (see
figure 2-9). In part this is due to their higher than average academic ability, since much
of this aid is awarded on the basis of merit. However, even when compared with students
of equivalent achievement, science students are still slightly more likely to receive
grants.
Series P-20, No. 319, Feb. 1978, p. 4.51.
March 1983), p. i; and Applied SystemsInstitute, Inc., ‘f Financial Assistance, Education Debt and Starting Salaries of Science andEngineering Graduates: Evidence From the 1985 Survey of Recent College Graduates,t’OTA contractor report, 1987, based on Recent College Graduate Survey data. Financialaid information reported by incoming freshmen in the University of California, LosAngeles’ Cooperative Institutional Research Program survey, while not especiallyreliable, indicates that natural science and engineering (NSE) students are more likelythan students in other majors to receive institutional aid. This is probably due to theirabove-average academic performance in high school (as measured by self-reported gradepoint average). In general, NSE majors have the same financial aid profile as their peersin other majors.
49

(na)%3-01
mLa)-c?5
VIal.—.->.—
E
—QE
w
.“—>.—
+
.
—
G1-0z
-1-
a
50

There have been recent charges that rising student debt may be steering students
inappropriately towards majors leading to more assured jobs and higher-paying
careers .5 2 For example, since engineers’ salaries are higher than average, their ability
to repay their debts is also greater; this might encourage some students to major in
engineering or make them more willing to undertake debt. However, there is no
analytical support for these arguments. Certainly, students' preferences in recent years
have shifted towards such majors — business, prelaw, and engineering in particular. But
a survey of students who were repaying loans revealed that few of them thought that53 And amount of educational debt andtheir loan debt affected their choice of major.
loan status are not strongly related to students’ areas of study or to their average
achievement. 54 Science majors have about the same average loan debt as do other
undergraduates. Students of applied science (mostly engineering and computer science)
are slightly more likely than humanities students to take out loans and more likely to
have higher debt (see figure 2-10).55
52. Kathryn Mohrman, ‘f Unintended Consequences of Federal Student Aid Policies,’t TheBrooh”ngs Review, vol. 5, No. 4, fall 1987, pp. 26-28; American Council on Education,‘tStudent Borrowing Has Implications for Career Choice, ~1 Fact Sheet (Washington> DC:August 1985); and Carnegie Foundation for the Advancement of Teaching, ‘tThe Price ofCollege Shaping Studentst Choices,ff Change, May/June 1986, pp. 27-30.53* National Association of Student Financial Aid Administrators, The Characteristicsof GSL Borrowers and the Impact of Educational Debt, survey of 600 students repayingGuaranteed Student Loans in the spring of 1985, reported in Mohrman, op. cit., footnote52, pp. 27-28; and Martin, op. cit., footnote 48, pp. 45-72.54. Edward P. St. John and Jay Noell, “Student Loans and Higher EducationOpportunities: Evidence on Access, Persistence, and Choice of Major,ff prepared for theNASSGP/NCHELP Research Network Conference, Washington University, June 3, 1987,pp. 17-19, based on High School and Beyond Class of 1980 data; Applied SystemsInstitute, op. cit., footnote 51; and Consortium on Financing Higher Education, op. cit.,footnote 51, pp. i, vii. The Department of Education% National Postsecondary StudentAid Study, completed in 1988, includes extensive aid data by field of study, but field-level data have not been analyzed.55. Consortium on Financing Higher Education, op. cit., footnote 51, p. 8; and AppliedSystems Institute, Inc., op. cit., footnote 51 (based on data from the Department ofEducation% 1985 Recent College Graduate Survey, or RCG). The RCG results are notcontrolled for field differences in socioeconomic status, educational costs, etc. A 1984Carnegie survey of undergraduate students found differences by field in the use ofloans: social sciences, 42 percent; biological sciences, 42 percent; physical sciences, 33percent; and engineering, 26 percent. About 35 percent of 1980 college graduates hadsome debt at graduation, with a median debt of $2,500. Thetopquartile hada debt of$3,600 at public institutions, and $5,000 at independent colleges and universities. SeeNational Center for Education Statistics data cited in National Commission on StudentFinancial Assistance, Signs of Trouble and Erosion: A Report on Graduate Education inAmerica (New York, NY: 1983).
51

Figure 2–10.– Education Debt of Recent Baccalaureates.by Field and Career Path, 1984
WM
All S/E
Engineering
Computer science
Physical sciences
Mathematics
Biological sciences
Social sciences
Non–S/E activities
KEY: S /E =
i
o 20 40 60 80 100Percent of recent bachelor’s graduates with educational debt
science/engineering.
NOTE: Academic-bound are those S/E baccalaureates whograduate study in S/E.
Employment-bound are those S/E baccalaureates whoemployment in S/E.
go on to full
go on to
– t i m e
fu I I – time
Other’s are part–time students or part–time employees in S/E.
SOURCE: Applied Systems Institute, Inc., “Financial Assistance, Education Debtand Starting SaIariesof Science and Engineering Graduates: Evidence Fromthe 1985 Survey of Recent College Graduates, ” OTA contractor report, 1987.

Students do not have to repay loans while they continue in school. Consequently,
more widespread and higher debts might encourage students to go to graduate school —a
desirable outcome from the point of view of science policy. There seems to be some5 6 W he th er h igh a n ti c i p a t ed d e bt
indication, but no good evidence, that this is happening.
is a factor in students’ shift towards higher-paying majors and occupations is impossible
to tell. Many factors are involved in changing student preferences, not only college
financing. 57
Apart from student aid, other Federal education and human resources policies
increase general access and enrollment (e.g., Title IX of the 1972 Education
Amendments) by targeting special populations (women, minorities, the learning disabled,
the foreign-born, or the handicapped). Although these policies have broadened the base
of women and minorities in higher education, their penetration into undergraduate
science and engineering has lagged their entry to the undergraduate population as a
whole.
Non-Federal Support of Higher Education
Government appropriations are much more important to public institutions of
higher education than to private institutions. State and local appropriations supply about
60 percent of public institutions’ revenues, but only about 2 percent of private
institutions’, which rely much more on tuition and somewhat more on private grants and
gifts. Both public and private institutions rely on Federal contracts for 15 to 20 percent
of their revenue.
By far the most important actor in science and engineering higher education is the
university or college itself. For undergraduates, however, institutional aid accounts for58 Almost all institutional aid is based onunder 20 percent of aid from all sources.
financial need. Student aid comes out of the institution's total revenues, and generally is
untraceable to its original source.
56. Jerry S. Davis, Pennsylvania Higher Education Agency, personal communication,April 1988.57* Blacks and Hispanics are more likely than whites to report loans as a major sourceof funds, but they do not report high levels of debt. The amount of debt is not related togender, though women have less support of other types and therefore are more likely toborrow. Heath and Tuckman, op. cit., footnote 47, pp. 25, 27-28.58. Gladieux and Lewis, op. cit., footnote 39; and Jacob O. Stampen, Student Aid andPublic Higher Education (Washington, DC: American Association of State Colleges andUniversities, March 1985), p. 82.
53

States
With State and other support, public institutions have had the fastest growing
enrollments, and many have pushed into the top tier of research universities. Their
substantial and rapidly growing enrollments have been the bulwark of the enrollment base
for undergraduate science and engineering. State-subsidized tuition has made education
available to more students, and institutional and other aid has improved the quality of
education.
Much State support for higher education is subsumed under general instructional
budgets.59 Direct State support targeting science and engineering education is relatively
minor and emphasizes engineering and high technology economic development. Only a
handful of need and/or non-need-based programs target science and engineering; non-
need-based aid includes tuition equalization, scholarships for meritorious students, and
aid for particular fields such as mathematics and science or to particular groups such as
veterans, medical students, or police officers (see table 2-8).
Private Support
Voluntary private support, such as grants and gifts from alumni and other individual
donors, foundations, and corporations ($8.5 billion in 1987), accounts for about 7 percent
of institutional expenditures. Doctorate-granting universities receive about two-thirds
of all gifts (mostly private institutions), and private liberal arts colleges about 20
percent; there are no striking differences in who gives to what kind of institution. Gifts
from individuals are about one-half of all voluntary support; corporations provide for
roughly another one-quarter, and foundations a little less. Voluntary support of higher
education has been increasing (in constant dollars).60 Tax policies have been
instrumental in encouraging private contributions and product and property donations to
universities and colleges.
59. National Commission on Student Financial Assistance, op. cit., footnote 55, p. 67;and Kenneth R. Reeher and Jerry S. Davis, ‘18th Annual Survey Report, 1986-87Academic Year/’ prepared for the National Association of State Scholarship and GrantPrograms, January 1987.60. Liz McMiHen, ‘28-Percent Surge in Alumni Contributions Lifts Givingto Collegesto $8.5 Billion,M The Chronicle of Higher Education, Apr. 13, 1988, pp. 1, A34-A36,reporting data from the Council for Aidto Education. National estimates are basedon aCouncil survey of a sample of 1,174 colleges and universities, together accounting forabout 85 percent of voluntary support to higher education institutions.
54

Table 2-8. —
Need-basedNo. of States:No. of programs:No. of awards:Amt. of awards:
Non-need-based (merit)No. of States:No. of programs:No. of awards:Amt. of awards:
Total amount:
Othera
State Scholarship
Undergraduate
52101
1,353,166$1,399 million
2776
220,000$144 million
$1,543 million
42 States
Programs, 1986-87
Graduate/professional
2237
26,100$27.4 million
1629
5,241$11.8 million
$39.2 million
unknownlots of awards 6,200 awards
$500 million (est.) $8.9 millionb
a This combines National Association of State Scholarship & Grant programs (NASSGP)tables 6 and 7, which are partial reporting. In table 6, NASSGP programs listed includeloans (Guaranteed Student Loan (GSL), PLUS, loan forgiveness for prospective teachersand health services professionals); teacher fellowships; tuition waivers; work-study; andminority programs. Table 7 lists programs administered by non-NASSGP agencies, suchas loans and scholarships to aid veterans, health services students, and tuition waivers tospecial groups (e.g., minorities).
b This figure represents only pro~ams that are exclusively for ~aduate-level ‘tudentseAlmost all monies are reserved for medical and dental students.
NOTE: Undergraduate, combined undergraduate/graduate, and unknown eligibilityprograms are combined under undergraduate for this table. The “other” heading is anunderestimate, since there are additional programs listed that are funded by, forexample, bond financing of unreported amounts, and there are several large (e.g., GSLloan) programs for which amounts are not reported.
SOURCE: Kenneth R. Reeher and Jerry S. Davis, National Association of StateScholarship & Grant Programs 18th Annual Survey Report, 1986-87 Academic Year(Harrisburg, PA: NASSGP, January 1987), pp. 11-33.
55

Corporations. Corporations provide more than 20 percent of the support received
by colleges and universities, in 1985-86 giving about $1.7 billion to higher education. 61
Most is geared toward departmental and research grants, augmented by unrestricted gifts
and a relatively small amount of direct support of students (see table 2-9). Corporate
giving is concentrated in the largest companies, in manufacturing and R&D-intensive
industries such as chemicals, computers, petroleum, transportation, telecommunications,
and pharmaceuticals, and insurance companies and banks. Corporate gifts, like research
contracts, are concentrated in the top research universities. Corporate giving has been
rising steadily, accounting for about 25 percent of all private gifts to education. 62
Direct corporate support of individual science and engineering students with
scholarships is sparse, focused rather on graduate students and on select applied fields
such as engineering, computer science, chemistry, and materials science. Indirect
support of universities and colleges includes:
● jobs for students (most at the graduate level) working on industry
research grants and contracts awarded to individual professors,
departments, and joint university-industry research teams;b employing students for credit or wages in co-op programs (mostly
undergraduate engineering students) and industry-based joint research
projects (mostly graduate students);● science and engineering education projects (e.g., precollege teacher
training, curricula and software development, equipment trials);● employee’s continuing education and training;● surplus products donated as gifts, or access to corporate research or
computing facilities; and● that portion of unrestricted industry contributions used by the
institution for science and engineering education.
Company-established foundations, which manage and distribute contributions for
most large corporations, have been valuable in insulating the flow of charitable
61. Council for Aid to Education, Corporate Support of Education 1986 (New York,NY: February 1988); and ibid., p. A34. National estimates are based on a survey sampleof 372 large companies, mostly Fortune 500 companies, which together account for about37 percent of all corporate charitable contributions.62. Paul R. Miller, Jr., Council for Aid to Education, Business Week (SpecialAdvertising Section), June 22, 1987, p. 104.
56

Table 2-9. — Corporate Grants to Higher Education, 1986
Form of corporatesuppor t
Colleges/universitiesDepartmental grantsUnrestricted operating grantsProject/research grantsCapital grantsEmployee matching giftsStudent financial aidGrants via consortia
IndividualsScholarships/fellowships
Otherc
Total, 370 companies
National Total (estimate)
% of total(in millions)
831812151516
43
Amt. of supporta
$499.1110.4
70.088.287.2 b
98.725.619.0
6 37.1
10 62.7
99d
$599.0
$1,600.0 ($ 1.6 billion)
aAt this level of detail, Council for Aid to Education repOrtS data only for the comPaniesactually surveyed, and does not make national estimates. These 370 companies togetherencompass about 40 percent of all corporate giving.
b]ncludes single gift of property valued at $40 ‘illiOn*
cOther includes the Council for Aid to Educaton categories of grants to education-related organizations, and “other.” Precollege education and economic education (mostlyprecollege) are not included (together just over $50 million). Unallocated funds are notincluded.
d Does not total 100 percent due to rounding errOrO
NOTE: The data above include charitable gifts and grants only, and do not includesubstantial corporate contracts for research and other services. Noncash product andproperty gifts account for 25 to 30 percent of the total.
SOURCE: Council for Aid to Education, Corporate Support of Higher Education 1986(New York, NY: February 1988), p. 5.
57
contributions from the ups and down of profits and
donations of equipment from computer companies
campuses computerize.
business cycles. Tax-encouraged
have been invaluable in helping
Foundations. Foundations gave about $1.5 billion to colleges and universities in
1986-87. 63 Foundation support for science and engineering education is mostly indirect;
such support comes from various sources, including other foundations. They typically
target their support by field or level of interest, e.g., Andrew W. Mellon in the
humanities, Rockefeller in biology, Giles Whiting
dissertations.
Foundations contributed about $280 million for
and Charlotte Newcomb for
natural and social sciences at
colleges and universities in 1985-86, and about $150 million for research institutes (see64 Graduate and undergraduate student fellowships were $37table 2-10 and table 2-11).
million, about 6 percent of total foundation spending in the sciences. Much of the other
money went to develop programs and support research. Although foundations play a
small funding role, they can have an impact in specialized areas. The Howard Hughes
Medical Institute in 1987 launched a large program which includes $30 million in awards
to selected undergraduate colleges for programs to attract students, particularly women
and minorities, to scientific research careers.65
Targeted Federal Undergraduate Science and Engineering Education Programs
The National Science Foundation (NSF) has spearheaded Federal undergraduate
science and engineering education activity, as the only agency with this formal
responsibility, under its broader mission in science and engineering education. Several
mission agencies have small programs, usually linked to their research and laboratories..
The Department of Education strongly supports general undergraduate education but
plays little direct part in science and engineering education.
63. McMillen, op. cit., footnote 60, p. A35.64. The Foundation Center, The Foundation Directory (New York, NY: 1986).65. Liz McMillen, ‘~44 Colleges to Share $30-MiUion to Improve Education in Biology, t’The Chronicle of Higher Education, May 25, 1988, p. A32. The spending is part of aresult of a settlement of a Federal tax dispute. Other Howard Hughes Medical Institute(HHMI) spending will support postdoctoral fellowships, research experience for medicalstudents, and a study of high school science education. A second wave of 5-year HHMIawards, to public and private universities, ranging from $500,000 to $2 million will bemade in spring 1989. See Manpower Comments, vol. 25$ October 1988, p. 26.
58

Table 2-10. — Foundation
Program developmentCapital supportResearchContinuing supportGeneral/operating supportMatching/challenge grantFellowship/scholarshipEndowmentUnspecified------------------------------
Support for Science, by Type of Support, 1985-86
Social sciences Natural sciences(in millions) (in millions)
$167.4 $125.116.5 92.8
103.5 77.290.9 78.950.7 17.321.8 19.425.5 11.424.4 6.713.2 7.0
,-------------------------------------------------------------Total $332.0 $286.0
SOURCE: The Foundation Center, 1987.
Table 2-11. — Foundation Support for Science, by Recipient, 1985-86
Social sciences Natural sciences(in millions) (in millions)
Higher education $129.8 $151.5Private coll/univ 63.4 87.7Public coll/univ 34.0 47.2Graduate school 32.0 15.3Community college 0.4 1.3
School 0.7 3.1Museum/zoo 0.8 38.9Research institute 106.1 49.0Professional society 53.9 25.6Medical facility 1.2 2.4Library 8.7 14.7Other* 66.2 33.8-------------------------------------------------------------------------------------------Total $332.0 $286.0
+Direct service agency, church/temple, community fund, governmental unit, library,performing arts group, and not specified.
SOURCE: The Foundation Center, 1987.
59

Led by NSF, Federal programs have supported institutional capability (equipment,
facilities instrumentation, and technology), student research, college faculty, and to a
lesser extent curricula and course materials. NSF undergraduate programs, like their
other activities, competitively award limited resources to a select few institutions and
students. Most predominantly undergraduate institutions compete for regular NSF
research grants and get most of their NSF money this way. However, NSF (and the
colleges) have felt the need to create special programs for undergraduates and
undergraduate institutions, designed for their needs (which differ from those of the
research universities — see below).
NSF and Undergraduate Education
NSF undergraduate programs target 4-year colleges that are unlikely to have strong
research infrastructures (research opportunities, equipment, and faculty). Since there
are more undergraduate institutions than full-fledged research universities, this has
allowed NSF to spread its money widely in making research accessible to
undergraduates.
NSF spending on undergraduate science and engineering education generally has
paralleled its total education budget, peaking in 1965 and dropping steadily through the
early 1980s. Through the 1960s and early 1970s, NSF spent about $30 million per year
(over $100 million in 1987 dollars) on undergraduate science education. There is no
observed correlation between spending and the number or proportion of undergraduate
scientists and engineers produced. However, this is not surprising, as NSF programs have
emphasized quality rather than quantity. Some past and current NSF undergraduate
programs are listed in table 2-12.
In addition to NSF’S undergraduate education programs, a portion of its regular
research funds supports undergraduate research assistants. Of particular relevance to
undergraduate education are research funds that go to nondoctoral institutions; in 1987,
$40 million from regular research programs, $14 million under Research in
Undergraduate Institutions, and $1.6 million from Research Opportunity Awards.66
The National Science Board in 1985-86 charged a committee with reviewing needs
and priorities in undergraduate science and engineering education. The committee
66. Richard Quinn and Lola Rogers, National Science Foundation, personalcommunications, June 1988.
60

Table 2-12. — Current and Past National Science Foundation Undergraduate Programs
CURRENT PROGRAMS
(coordinated by theUndergraduate Science, Engineering, and Mathematics Education Division,
Science and Engineering Education Directorate,National Science Foundation (NSF))
This l ist includes NSF programs that provide significant resources to predominantlyundergraduate institutions, the undergraduate components of other institutions, and/orundergraduate students.It should be noted that undergraduate institutions and facultyget most of their NSF money by competing for funds under general NSF research andother programs.Regular research support awarded $40 million in 1987 to undergraduateinstitutions, and $1.5 million for research opportunity awards.
EquipmentCollege Science Instrumentation Program (CSIP, 1985+)● (1 987 awards were $9.5 million)● 2-year, matching grants for instructional instrumentation.Instructional and Laboratory Improvement● The umbrella under which CSIP is included, this effort also contains a
component to support lab equipment for large doctorate-granting institutionsto use in their undergraduate programs.
ResearchResearch in Undergraduate Institutions (RUI, 1982+)● (1987 was $14.3 million)● Research and research equipment funds for investigators at
undergraduate insti tutions.About three-quar ters goes topredominantlybachelor’s and
master’s level institutions, the rest to Ph.D.-level institutions that offer 10 orless Ph.D.s a year.
FacultyUndergraduate Faculty Enhancement Program (UFEP, 1988-})● (1988 budget was $3 million)● Supports seminars, workshops, etc. , to keep current undergraduate faculty
current in their field of instruction.
Student research experienceResearch Experiences for Undergraduates (REU, 1987+)● (1 987 was $11.9 million)● ongoing grant supplements for one or two undergraduate research assistants,
and site awards for developing a research program for 5-10 undergraduates.● Open to all institutions; about 10%, or approximately $2 million, went to
undergraduate institutions; the rest went to Ph.D.-granting universities.
CurriculumUndergraduate Curriculum Development Program (1988+)● Supports efforts to stimulate significant changes in
of undergraduate instruction in engineering andinclude extending the program to other disciplines.
Institutional Development—
the content and structurecalculus. Future plans
ACCESS - Career Access Program for Women, Minorities, and the Disabled● Supports comprehensive r e g i o n a l c e n t e r s t o c o v e r u n d e r g r a d u a t e a n d
precollege educational activities for women and minority students.
61

Table 2-12 (continued)
PAST PROGRAMS
EquipmentCollege Research Instrumentation Program (1983-1985)
Forerunner to the CSIP (see above).Instructional Scientific Equipment Program (ISEP, 1961-1981)● Provided matching funds for instruments for instructional laboratories. Open
to all institutions.
FacultyCollege Teacher Workshops and Seminars (1956-1975)● Supported summer conferences for undergraduate faculty.
Research Participation for College Teachers (1959-1970, and thereafter)● Supported summer research for college faculty from small colleges.
Science Faculty Fellowships (1957-1981)● Provided awards to faculty for sabbatical leave-type activity, for study and
for research.
Student research participationUndergraduate Research Participation Program (URP, 1959-1981)● Provided full-time summer support plus part-time academic year support for
undergraduates to work with faculty on specially designed research projects.● At its peak in 1966 URP, supported 6,500 students with $6.8 million ($23
million in 1987 dollars).
CurriculumScience Curriculum Improvement Program (SCIP, 1958-1972, and thereafter)
Local Course Improvement (LOCI)● Supported development of specific courses by individual faculty.
Institutional development and planningCollege Science Improvement Program (COSIP, 1967-1973)● Provided institutional planning for predominantly undergraduate colleges and
consortia; one component for consortia of 2-year colleges and universities,another for minority institutions.
Comprehensive Assistance to Undergraduate Science Education (CAUSE, 1976-1981)● Institutional planning; open to all institutions.
Resource Centers for Science and Engineering (1978-1981)● Four large $2.8 million awards aimed at minorities at all educational levels.
Restructuring Undergraduate Learning Environments (RULE)
SOURCE: National Science Foundation, Undergraduate Science, Mathematics, andNational Science Board, March
1986), pp. 10-12; Lola Rogers and Richard Quinn, National Science Foundation, personalcommunication, May 1988; and Robert Watson, National Science Foundation, personalcommunication, February 1989.
62

reviewed NSF’S history in this area, and made specific program and budget
recommendations for NSF and other actors.67 The Neal Report was well received by
scientists, employers, and universities, and NSF has taken up many of these
recommendations (see box 2-C).
Since publication of the Neal Report, NSF has created a Division of Undergraduate
Science, Mathematics, and Engineering Education (USEME) in the Science and
Engineering Education Directorate, to manage its own and coordinate other
undergraduate-level activities across NSF’s research directorates. This initiative should
increase the attention and money spent on undergraduate education; since the revival of
NSF education activities in 1982-83, most of the spending has been on precollege and
graduate education, with undergraduate education becoming noticeable only in 1987.68
Although programs have come, gone, and changed frequently, undergraduate-level
spending since NSF’s inception has supported three major activities: undergraduate e
research; faculty research, seminars, and other professional enhancement; and
instrumental ion and institutional development at predominantly undergraduate
institutions. Smaller amounts have been spent on curriculum development, educational
technologies, and educational research.
Student Experiences: Undergraduate Research and Cooperative Education
Undergraduate research experience provides students with invaluable first-hand
appreciation of the skills and interests required to be a researcher — socialization that
cannot be gained from classroom lectures. Such experience improves education and
career preparation, and stimulates interest in science and graduate work.
The schools that are most productive of scientists share an emphasis on individual
attention to students and to undergraduate participation in research: Caltech, Harvey
Mudd, MIT, and the private liberal arts colleges. Close faculty-student interaction helps
to compensate, in many cases, for a lack of extensive research facilities. The “five
colleges" (Amherst, Hampshire, Mt. Holyoke, Smith, and the University of
Massachusetts-Amherst) use their unique proximity to share and coordinate facilities.
67. National Science Board, op. cit., footnote 38.68. From 1982 through 1984, very little money was spent on undergraduate educationby the National Science Foundation; since 1985, a growing amount has been spent onprograms for undergraduate student research, and for faculty, research, curriculumdevelopment, and instrumentation.
63

This provides students (and faculty) at any one college access to a much broader array of
faculty, classes, equipment, and research opportunities than would be feasible for any
one college operating independently. 69
The Federal Government also has a role in making undergraduate research possible,
directly through NSF and mission agency programs, and indirectly through avenues such
as research assistantships on individual investigator grants and research assistant add-ens
for minority students. Many undergraduates participate in independent research outside
of regular class laboratories (see box 2-D). At MIT and Caltech, nearly every
undergraduate does research and/or a senior thesis.
Another variation on the theme of undergraduate research is cooperative
education, in which students work for pay and college credit. Although less than 2
percent of undergraduates do formal co-ops, this mechanism is particularly important for
students in engineering and business, and to a lesser extent science. Co-op alumni are
more likely to receive job offers and earn higher salaries, and say that co-op education
gave them a head start on workplace skills. 70 The
co-op education with institutional support mandated
Education Amendments. 71
Faculty
Federal Government helped expand
by Titles IV and VIII of the Higher
At all levels of education, and in all sorts of institutions, students need competent,
enthusiastic, accessible teachers. Teachers include faculty and graduate teaching
assistants, and even fellow undergraduate tutors. 72 The quality of teaching in large part
depends on the institutional environment, whether it encourages and rewards
undergraduate teaching via release time for faculty to develop curricula and course
materials, tenure review on teaching as well as publications, awards and recognitions for
teaching, and matching good teachers to lower level courses.
69. ‘tFive Colleges Conference on Cooperation in Undergraduate Science Education, tt
Amherst, MA, Nov. 13-15, 1986.70. American Chemical Society, Survey of Chemistry Co-op Alumni, winter 1985.71. J o h n Dromgoole et al., Change Management in Cooperative Education: TheExpansion and Development of Title VIH Comprehensive Large Scale Co-op Programs(Weston, MA: National Commission for Cooperative Education, n.d.). Co-op engineeringeducation is discussed in ch. 4.72. James H. Zumberge, “From Specialist to Generalist: The Role of the GraduateSchool in Strengthening Undergraduate Education, ” Vital Speeches of the Day, vol. 52,No. 10, Mar. 1, 1986, pp. 300-303.
64

NSF’s special faculty programs have concentrated on predominantly undergraduate
institutions. Faculty at undergraduate institutions usually have sparse research resources
in the way of equipment or graduate students to assist in research and teaching; at a
small department with few colleagues, and with most of their time devoted to teaching,
most have little time for research. This is not to say that undergraduate teaching at
research universities is not just as vital and in need of attention, but that some parts are
easier to “fix” — equipment, faculty experiences, and other tangibles — than others.
NSF’s current programs offer stipends for research, conferences, short courses, and
summer professional development activities: Research in Undergraduate Institutions;
research and equipment support for faculty in predominantly undergraduate institutions;
Research Opportunity Awards, which fund undergraduate faculty to work with NSF grant
recipients; and the recently instituted Undergraduate Faculty Enhancement, which funds
seminars and workshops for undergraduate faculty. Other agencies have small, more
informal programs, often as part of the link between laboratories and local colleges and
universities. Faculty also benefit from institutional awards. 73
Institutional Capability
A large part of institutional awards go to equipment, facilities, and libraries.
Currently, equipment and facilities refurbishing, renovation, and replacement are
considered the top priority not only for institutional health, but for the health of
undergraduate and graduate teaching as well. Research and instructional equipment
costs are much higher for science and engineering than for other fields. NSF has had
several versions of equipment programs; its current effort is the Instrumentation and
Laboratory Improvement Program (College Science Instrumentation Program). Such
programs are important because it is very difficult for institutions to purchase large,
high-cost equipment on regular grants or through indirect cost recovery, which goes
mostly to operations and some maintenance.
Many of the formal government science and engineering education programs target
minority institutions, particularly historically Black colleges and universities (HBCUs)
73. In the words of one report: ‘tStudent needs, we believe, should be addressed by NSFprimarily through support for equipment and faculty needs.” American Council onEducation, Towards a National PoZicy for Undergraduate Science Education: With theRecommendations of the N a t i o n a l Higher Educat ion Assoc ia t ions Task Force(Washington, DC: n.d.), p. 17. Admittedly, their vested interest is institutional, notstudents per se.
65

below). Some programs target the few institutions that have mostly Hispanic
enrollments. Most of these programs fund both undergraduate and graduate education,
and many are reserved for HBCUs offering graduate degrees. As with many general
university programs it is difficult to separate out the effects of such programs on
undergraduates.
Minority institutions have needs similar to others, except in many cases the needs
are more pressing. The National Science Board identified the most pressing problems as
scientific equipment, followed by faculty support, development, and recruitment. 74
These institutions also have special difficulties — high dependence on government funds,
relatively poor students who cannot bring in high tuition or alumni donations, and
difficulty recruiting the best Black students and faculty in competition with nationally-
known universities and employers trying to meet minority recruitment goals.
NSF programs include supplements for research assistants on regularly awarded
grants, Research Minority Centers of Excellence, and Research Improvement in Minority
Institutions. The National Institutes of Health (NIH) has a sizeable program, supporting
research centers and undergraduate (and graduate) students through its Minority Access
to Research Careers program. In general, mission agencies target minority institutions,
even though they may not have a formal budget to do so (although much of this activity
was spurred by a series of Presidential Executive Orders. ) Such alliances make a unique
contribution to the undergraduate and graduate education of minorities. 75
The Future of Undergraduate Science Education
The structure of “mainstream” higher education has changed little in the past
hundred years: students still congregate on a residential campus, sit in classes taking
notes from lecturers and their assistants, and compete on college sports teams.
However, there have been major changes in the social setting of higher education, and
many have augured significant changes in the structure of universities.
Some particularly substantial changes include mass higher education and the rise of
government student aid, working women and changing family structures, the vast
expansion of knowledge and the questioning of traditional curricula, and new
74. The National Science Board, op. cit., footnote 38, pp. 35-36, 50.75. National Academy of Sciences, “Alliances: An Expanded View,” Report andRecommendations, 1987 Symposium, Sept. 23-25, 1987, unpublished manuscript.
66

technologies, particularly computers. The rise of community colleges and proprietary
institutions is a major innovation in education. Such institutions have a growing clientele
and demand for the occupational skills of their graduates. Most colleges and universities
have yet to act on the recognition that these 2-year institutions are a substantial pool of
students for whom they must compete: the labor market is a powerful magnet.
Computer and information technologies have already made an indelible mark on
campus. Powerful multipurpose workstations, stand-alone computers, data networks,
remote access supercomputers, and computerized recording and analysis equipment
pervade classrooms, dormitories, offices, libraries, and laboratories. In the past 10
years, computers have evolved from novelty to a vital part of university life, relied on by
faculty, administrators, and students. 76 Employers expect newly-graduated scientists
and engineers to be facile in modern computing.
INSTITUTIONAL SETTINGS AND INFLUENCES ON CAREERS
Colleges have a hand in turning students on or off to science. There is evidence
that some institutional settings are more effective than others in selecting and preparing
high-quality undergraduates for graduate study and careers in science and engineering:
Factors found in most institutions that graduate large numbers of future scientists and
engineers include: dedicated teaching; a challenging technical curriculum; the
availability of professional apprenticeships as researchers, teaching assistants, or co-op
students; easy access to high-quality instructional and laboratory facilities; and strong
personal and academic support from faculty and other students (see table 2-13). These
characteristics can be replicated at other institutions, and effective institutions that
provide quality education and encourage students to enter research can be supported and
enhanced. 77
76.on Campus (New York, NY: Cambridge University Press, 1987), esp. ch. 12, on theexperiences of Carnegie-Mellon University, which d id ear ly and extens ivecomputerization of campus, curricula, administration, and student dorms and activities.77. For example, the legacy of the National Science Foundationfs Engineering ResearchCenters and the brand-new Science and Technology Centers may be their socialization ofstudents into the culture of team research. This would be a positive educational effectin the guise of “research” and “innovation. ”
67

Factors
Table 2-13. — Factors Affecting the Quality of UndergraduateScience and Engineering Education
Teaching
● Good faculty
● Good teaching assistants
● Curriculum and materials
Professional apprenticeship
● Research participation(includes conference presentation, etc.)
● Job or cooperative work experience
● Teaching experience (tutoring,teaching assistantships)
Institutional setting and resources
● Quality of equipment (including computers)
● Access to equipment
● Teaching and research facilities
● Libraries, conferences
Personal and academic support
● Intervention programs
● Student peers
● Family
Lead actorsa
C/U, NSF
c / u
C/U, NSF
C/U, NSF, R&D
C/U, ED, PRV
C/U
C/U, NSF, R&D
C/U, NSF, R&D
C/U, NSF, PRV
C/U, NSF
C/U, PRV
C/U
a These organizations have the most direct influence 01’ have had significant programs ‘n
the specified area. Colleges and universities clearly shape the kind of undergraduateeducation they offer, although their programs are often supported by State, foundation,or industry grants; and personnel, facilities, equipment, or other resources.
Key: (The most important actors are in boldface.)C/U - individual college or universityNSF - National Science FoundationR&D - mission R&D agenciesED - U.S. Department of EducationPRV - private foundations or industry
SOURCE: Office of Technology Assessment, 1988.
68
A Diversity of Institutions
Policymaking is complicated by the diversity of American colleges and
universities. Diversity is a strength of American higher education, reflecting the breadth
of students and their career aspirations. America’s 1,500 4-year institutions include
small single-sex colleges, large public universities, world-renowned research universities,
technical and engineering institutions, liberal arts colleges, and historically Black
institutions. These vary in size; curricula; level and field of degrees awarded; emphasis
on research, graduate, and undergraduate education; Federal research support; and
selectivity of admissions. Over 40 percent of all students are enrolled in 2-year colleges,
which are not yet a significant source of scientists and engineers (see box 2-l?).
While the top 100 research universities graduate over 70 percent of science and
engineering Ph.D.s, those same institutions graduate less than one-half of the U.S.
baccalaureates who go on for science and engineering Ph.D.s. There is no single model of
the most effective institution for educating future scientists and engineers.
Research Colleges
The terms “research colleges” and “science intensives” have been used to describe a
group of private liberal arts colleges that encourage undergraduate and faculty research
in the sciences
small colleges
relatively small
In 1985, a
as well as a traditional emphasis on teaching. The environment at these
values teaching, student research, and intimate interaction with a
number of high-quality peers and faculty.
consortium of 50 private liberal arts colleges undertook a self-study that
called attention to their special service to the Nation as a feeder of baccalaureate78 These colleges issued a second report instudents to graduate programs in science.
1986.79 Known as the Oberlin Reports, they presented convincing evidence of these
colleges’ role as “. . . among the most productive centers of high quality [baccalaureate]
education in the sciences. "80 Most of their alumni proceed into graduate study. The
78.
become a recognizable category of institutions, though the term is not embraced even bymember institutions. Another 50 colleges probably share the characteristics of thoseincluded in the Oberlin Reports. See Office of Technology Assessment, op. cit., footnote3, pp. 56-58.79. Sam C. Carrier and David Davis-Van Atta, Maintaining America~s ScientificProductivity: The Necessity of the Liberal Arts CoZleges, Report of the Second NationalConference on “The Future of Science at Liberal Arts Colleges” at Oberlin College(Oberlin, OH: Oberlin College, March 1987).
69

research colleges, in short, are competitive with the major research universities in
preparing undergraduate students for careers in science. But that is only part of the
story.
The strength of the research colleges is, first, their selective student body. They
sample from one end of the distribution, competing with (mostly private) research
universities for “the best and the brightest.” Beyond this incoming talent advantage,
peers are instrumental in the quality of education and in social support. Also key is the
college’s small size — typically fewer than 2,500 students, with low faculty-student
ratios. Third, they cultivate the attitude that education is an investment, and students
pay handsomely for this type of education.
The strengths of the research colleges — small size and limited course offerings —
are also weaknesses. They cannot cater to all students. For instance, while strong in the
natural sciences, few liberal arts colleges offer a major in engineering (though many
offer a "3+2” arrangement with affiliated engineering schools).
The teaching-oriented research colleges receive comparatively little Federal
research support, depending more on private gifts and tuition for revenue. Most Federal
funding for academic science is awarded as research grants to Ph.D.-granting universities
with graduate students and extensive research facilities and staff. No Federal programs
target the “research colleges” exclusively; a few small programs, primarily at NSF, focus
on predominantly undergraduate institutions. The research colleges fare well in these
programs, as do some of the larger comprehensive public universities and some of the
smallest doctorate-granting institutions that are allowed to compete in this category. It
should be noted, however, that research colleges (and other undergraduate institutions)
receive the bulk of their Federal funding through regular competitive grants. 81
80. Ibid., p. 26.81. Recent expansion of undergraduate programs at the National Science Foundationincludes more faculty and institutional support targeted to predominantly undergraduateinstitutions, as well as support for undergraduate students and education at all kinds ofinstitutions. One policy question is whether increased research funding at the researchcolleges (as opposed, for example, to honors programs at State universities) wouldincrease the graduate student population in science and engineering. Rolf Piekarz,National Science Foundation, personal communication, December 1988. Also see ThomasE. Hassan and Jane E. Reynolds, ‘f Working Class Students at Selective Colleges: WhereHave They Gone?" College Bored Review, No. 146, winter 1987-88, pp. 4-9, 30-31.
70

Historically Black Institutions
Minority students tend not to be as well prepared as majority students for
undergraduate study. Perhaps more than other students, they need a supportive
academic and social environment to succeed in college, of the sort found at many
historically Black colleges and universities (HBCUs). Many credit a caring, nonracist
social environment, Black faculty role models, and a critical mass of Black students with
the educational success of HBCUS.82 Federal institutional
and aid high.
One-third of all baccalaureates awarded to Blacks are
they enroll less than 20 percent of Black undergraduates.
aid also has kept tuition low
awarded by HBCUs, although
The HBCUs are particularly
productive of natural science students, granting one-half of the mathematics B.S.
degrees and 40 percent of the biological sciences and physical sciences B.S. degrees
earned by Blacks in the United States (see table 2-14).83 In 1987, however, only six of
the HBCUs offered full engineering curricula.
engineering baccalaureates earned by Blacks.
Some argue that the best investment in
concentrated—HBCUs. However, fewer
HBCUS.84 Some universities are attempting to
environment for Blacks within their mostly
The Federal Government extensively
support and research-related programs
departments. 85 Other Federal programs
82. Howard H. Garrison, “Undergraduate
In 1983-84, they awarded 19 percent of
minority talent is where that talent is
Black college students are attending
develop a supportive social and academic
white campuses (see box 2-F).
supports HBCUs, through general institutional
that target HBCU faculty, students, and
target minority students and faculty in all
Science and Engineering Education for Blacksand Native Americans," in Dix, op. cit., footnote 17, pp. 47=50, 53-54.83. Gail E. Thomas, “Black Students in U.S. Graduate and Professional Schools in the1980s: A National and Institutional Assessment, f? Harvard Educational Review, vol. 57$No. 3, August 1987, pp. 269-270.84. Linda Darling-Hammond, Equality and Excellence: The Educational Status of BlackAmericans (New York, NY: College Entrance Examination Board, 1985), p. 14, statesthat historically Black colleges and universities enrolled more than one-half of all Blackcollege students before 1970, but only 27 percent by 1980. Also see Colleen Cordes,‘f Colleges Try to Attract Women and Minority Students to the Sciences,’ t The Chronicleof Higher Education, Nov. 16, 1988, pp. A33-34.85. Executive Order 12320, Sept. 15, 1981, directed agencies (under the supervision ofthe Department of Education) to work to increasecolleges and universities in all federally sponsoreddevelopment of human potential, to strengthen the
the participation of historically Blackprograms “. . . in order to advance thecapacity of historically Black colleges

Table 2-14. — Baccalaureates Awarded to Black StudentsAt HBCUs and All Institutions, by Field, 1980-81
All Percent of degreesHBCUs institutions awarded at HBCUs
Natural sciences 2,145 4,923 44Engineering 848 2,445 35Social sciencesa 3,109 11,423 26
Total S/E 6,012 18,791 32
All B.S. 60,673 34
aIncludes history, archaeology and cultural ‘tudieso
NOTE: In the South (where all the HBCUs are located), 59% of all bachelor’s degreesawarded to Blacks are from HBCUs, as are 61% of science and engineering bachelor’sdegrees.
Reliable data on degrees granted to minority students at predominantly minorityinstitutions are difficult to secure. That is one reason for the age of the data presentedhere. This is OTA'S best estimate based on data from the U.S. Department ofEducation. In recent years, more Blacks have been enrolling in non-HBCUs; however,their retention rates are still higher at HBCUs.
KEY: HBCUs = historically Black colleges and universities.S/E = science/engineering.
SOURCE: OTA calculations, based on Linda Darling-Hammond, Equality andExceZZence: The Educational Status of 13Zack Americans (New York, NY: CollegeEntrance Examination Board, 1985), p. 18. Also see William T. Trent, “EquityConsiderations in Higher Education: Race and Sex Differences in Degree Attainment andMajor Field From 1976 Through 1981,11 American Journal of Education, vol. 92, May 1984,pp. 280-305.
72

institutions (see table 2-15). Institutional support such as Title III of the Higher
Education Act, insofar as it reduces tuition, helps bring college within the reach of
lower-income students.86
State Colleges and Universities
State colleges and universities, more than 550 public 4-year institutions, enroll 4.8
million students and award two-thirds of the Nation's baccalaureates. 87 Most of higher
education enrollment growth has been in public institutions, whose enrollments have gone
from one-half to more than three-quarters of the national total.88
Many State universities were created in the last century as teacher training
institutes or “normal” schools. The baby boom multiplied their enrollments and shifted
their mission, along with State colleges and universities founded in the 1960s and 1970s,
to comprehensive offerings of undergraduate majors, professional programs at the
master’s level, public service, and research. Some have become full-fledged research
universities. These missions today do not always peacefully coexist.
Public institutions are more dependent on State funds, generally less selective, and
less expensive to attend than private colleges and universities. They also tend to be
larger. Some public institutions, required by State law to admit all resident high school
graduates, reduce classes to manageable sizes by "washing out" large proportions of their
freshman classes. This attrition wastes talent. Evidence suggests that many students,
owing to the sheer size of classes, “fall through the cracks. ,,89 Large introductory
sections of calculus and other gatekeeper courses probably remove science and
and universities to provide quality education, and to overcome the effects ofdiscriminatory treatment.” See 46 Federal Register 180 (Sept. 17, 1981) (and ExecutiveOrder 12232 of Aug. 8, 1980).86. James B. Stedman, “Title III of the Higher Education Act: Provisions and Funding,’t
Congressional Research Service, Library of Congress, Mar. 31, 1987; Robin Wilson,“White House Woos Black Colleges, But Critics Question Motives, tt The Chronicle ofHigher Education, Sept. 16, 1987, p. A27.87. Meredith Ludwig et al., Public, Four-Year Colleges and Universities: A HealthyEnrollment Environment? (Washington, DC: American Association of State Colleges andUniversities, and National Association of State Universities and Land-Grant Colleges,May 1986), p. iii.88. Robert S. Eckley, “Liberal Arts Colleges: Can They Compete?ll The BrookingsReview, vol. 5, No. 4, fall 1987, p. 32.89. Alexander W. Astin, Achieving Educational Excellence: A Critical Assessment ofPriorities in Higher Education (San Francisco, CA: Jossey-Bass, 1985), p. 89.
73

Table 2-15. — Major Federal Science and Engineering Education Programsfor Historically Black Colleges and Universities (HBCUs)
and Minority Students
All agencies target HBCUs in their regular programs and have a range of specialHBCU programs (research funding and collaborative research, faculty enhancement,student internships, guest lectures, equipment access and donations, institutionaldevelopment funding) in response to Presidential Executive Orders. At some agenciesthese programs are gathered under one umbrella program, such as the EnvironmentalProtection Agency’s (EPA) Minority Institutions Assistance Program or the Departmentof Defense's (DoD) Historically Black Colleges (HBC) Council.
This list includes all higher education, both undergraduate and graduate. Majoragencies are in boldface.
Key to type of programu - Undergraduate studentsG - Graduate studentsF - FacultyI - Institutional
Major Programs Targeting Minority Institutions
National Institutes of Health (NIH)●
●
DoD●
●
Minority Biomedical Research SupportResearch Centers in Minority Institutions
HBC CouncilNavy DANTES (Defense Activity for Non-Traditional Education Support)
National Science Foundation (NSF)●
●
U.S.●
U.S.●
b●
U.S.●
●
Research Improvement in Minority InstitutionsMinority Research Centers of Excellence
Department of Agriculture1890 institutionsa
Department of Education (ED)Minority Institutions Science Improvement ProgramHoward UniversityStrengthening Developing Institutions
(Title III of the Higher Education Amendments of 1965)(not targeted to science/engineering, but a major program)
Department of Energy (DOE)Minority Institutions Research Travel Program FNuclear Energy Training Program
%l?he 1890 institutions are 16 predominantlyunder the 1890 Second Merrill Act to provideBlacks were denied access to State land-grantAct of 1862.
U,G, F
Black land-grant universities, establishedfor land-grant institutions in States whereinstitutions established by the first Merrill
74

Table 2-15 (continued)
● Laboratory-HBCU joint programs (student internships,joint research, faculty exchange, facility access)
EPA● Minority Institutions Assistance Program
includes minority student fellowships
National Institute of Standards and Technology (NIST)(formerly the National Bureau of Standards)
● Graduate Engineering for Minorities G
Major Federal Programs Targeting Minority Students or Facultyat All Institutions
Minority institutions also win agency support through other competitions. AllFederal agencies, particularly DoD, vigorously recruit and hire at HBCUs, both on theirown initiative and as part of the Federal Equal Opportunity Recruitment Program. Manyregular Federal university, research, and fellowship programs make special efforts andachieve high minority participation, without formal set-asides or targets for minorityinstitutions, students, or faculty.
Health and Human Services/NIH● NIH Minority Access to Research Careers● National Institute of Mental Health Minority Fellowships
DoD● Office of Naval Research Minority Research Grants
NSF● Research Careers for Minority Scholars● Engineering Supplements● Minority Graduate Fellowships● Minority Research Initiation● ACCESS — Career Access Opportunities for Women, Minorities,
and the Disabled
National Aeronautics and Space Administration (NASA)● Graduate Student Researcher Program, minority focus
ED● Graduate Professional Opportunities Program (Javits Fellowships)
Agency ConsortiumNational Physical Sciences Consortium for Graduate Degreesfor Women and Minorities (NPSC) (DOE, NIST, NASA)
U,G,FG
G
uuGF
G
G
G
SOURCE: Office of Technology Assessment, 1988.
75

engineering students from the pipeline prematurely.While not attrition per se, such
experiences dash hopes of a career in science or engineering.
Thus, while the quality of incoming students to State colleges and universities is
diluted, these institutions appear to commit two kinds of errors — flunking out students
who are capable of earning a baccalaureate degree and discouraging students from
pursuing a science or engineering major.These errors are more visible in institutions
that admit large freshman classes that include many students only marginally prepared —
academically and emotionally—to succeed. Data on attrition, by type of institution and
major, would go far to refine or correct such perceptions of "error" in the squandering of
human talent.
Research Universities
One hundred or so research universities house the vast majority of academic
science and engineering research.The superb resources of research universities —many
excellent faculty, graduate students, researchers, facilities, libraries, and equipment —
can be a boon to undergraduates if they have access to them, and if the university
emphasizes undergraduate teaching along with graduate training.However, in many
universities, the commitment to research and graduate education may divert attention
from undergraduate education.‘ 0 In a few cases, undergraduates constitute less than
one-half of the students.Despite the preeminence of the top research universities in
academic science and engineering and their dominance of graduate training, l i t t le
evaluation has been done of undergraduate education at these elite institutions.
Undergraduate Origins of Science and Engineering Ph.D.s
One way to investigate the effect of undergraduate settings on science and
engineering careers is to look at what types of undergraduate institutions produce the91 O T A c o n d u c t e d a nmost people who go on to get science and engineering Ph.D.s.
90. ‘Research Univers i t ies Urged to Upgrade Teaching,w The Chronicle of HigherEducation, Nov. 4, 1987, p. A19; and Roger L. Geiger, ‘Research Universities: TheirRole in Undergraduate Ed~ation/t Contexts f o r Learn ing :The M a j o r S e c t o r s ofAmerican Higher Education (Washington, DC:National Institute for Education, 1985),pp. 74-97.91. Previous studies include:National Research Council, Doctorate Recipients FromUnited States Universities, Summary Report 1984 (Washington, DC: National AcademyPress, 1986), pp. 10-24; Todd C. Hanson, Baccalaureate Originsof Ph.D.s, 1920-1980: ANew Study (Ashland, VA: Randolph-Macon College, 1986); Carol H. Fuller, An AnaZysisofLeading Undergraduate Sources of Ph.f).’s, Adjusted for Institutional Size (Ann Arbor,
76

analysis of institutions’ “productivity” of science and engineering Ph.D.s, and also looked92 Some highlights are Presentedat trends in this institutional productivity over time.
below; appendix A contains a fuller discussion of this analysis and various lists of the
productive institutions.
As might be expected, the large degree-granting institutions graduate the largest
numbers of baccalaureates that goon for science or engineering Ph.D.s. However, their
success in undergraduate education fades somewhat when the size of study body is taken
into account. Some small institutions send much higher proportions of their bachelors
graduates on for Ph.D.s. than do many of the largest institutions.93
MI: Great Lakes College Association, August 1986); M. Elizabeth Tidball, “BaccalaureateOrigins of Recent Natural Science Doctorates,ft Journa2 of Higher Education, vol. 57, No.6, November/December 1986, pp. 606-620; Davis-Van Atta et al., op. cit., footnote 78;and James N. Spencer and Claude H. Yoder, “Baccalaureate Origins of College andUniversity Chemistry Faculty in the United States,” Journal of Chemical Education, vol.61, September 1984, pp. 802-803. An essential element in any such analysis is controllingstatistically for differences in incoming student quality or other relevantcharacteristics. Disentangling attributes that predispose individuals to academicachievement from organizational characteristics that reinforce those predispositions,however, is far easier said than done.92. Betty Maxfield, ‘f Institutional Productivity: The Undergraduate Origins of Scienceand Engineering Ph. D.s, ” OTA contractor report, 1987. Baccalaureate degree data foracademic years 1950-51, 1955-56, 1960-61, and 1965-66 (hereafter referred to in tablesas 1950, 1955, 1960, and 1965) were extracted from the National Center for EducationStatistics annual publications, U.S. Department of Health, Education, and Welfare,National Center for Education Statistics, Earned Degrees Conferred (Washington, DC:U*S. Government Printing Office, 1950-51, 1955-56, 1960-61, and 1965-66).(Baccalaureate reference points beyond 1975 would have been unreliable because a highpercentage of graduates who pursued doctoral studies would still be in the Ph.D.pipeline.)
Two other data sources were used: the National Research Council’s DoctorateRecord File (DRF) and the Survey of Doctorate Recipients (SDR) file. The DRF is basedon the annual Surveys of Earned Doctorate (SED). The SED is done in cooperation withthe graduate departments of Ph.D.-granting institutions for the National ScienceFoundation. New Ph.D. recipients complete questionnaires that provide information onthe new doctorate’s demographic characteristics and employment plans. The SDR is abiennial survey of a sample of Ph.D.s in the sciences, engineering, and humanities. Thesample has been studied longitudinally, and includes information on doctorates from 1930to 1986. The SDR was designed to follow the employment patterns of Ph.D.s overtime.The active survey sample includes doctorates for the most recent 42-year time span. Forexample, the first SDR, in 1973, included a sample of doctorates from 1930 to 1972. The1985 survey, however, includes doctorates from 1942 to 1984. The SDR questionnaireconsists of questions on the Ph. D.fs field of employment, type of employment, primarywork activity, and salary.93. The unknown, of course, is the relative quality of the graduates from thesedifferent undergraduate environments. Their specialization by discipline, research area,and post-baccalaureate experiences are also of analytical interest.
77

A d j u s t i n g f o r s i z esignificantly changest h e l i s t o f t h e m o s t p r o d u c t i v e
insti tutions. For instance, Harvey Mudd College, a small engineering-intensive liberal
arts college in California, ranked 207th when the number of its graduates who went on to
earn science and engineering Ph.D.s were compared to other baccalaureate granting
institutions, yet its productivity based on the proportion of its graduates who obtained
science and engineering Ph.D.s placed it second overall in rank.
Productivity ratios reflect the emphasis that undergraduate institutions put on
science and engineering among their bachelor’s degrees, as well as the aggregate quality
of the undergraduate population.Institutions such as Harvey Mudd or Caltech, which
focus on science and engineering, could be expected to send much larger proportions of
their baccalaureates on for science and engineering Ph.D.s than could other high-quality
institutions with more diverse curricula.
Most of the more productive baccalaureate institutions (adjusted for size) are
pr iva te . Only three women's colleges and none of the traditionally Black institutions
were in the top 100. Fourteen ‘technical institutions" and 31 private l iberal arts
research colleges were in the top 100. OTA earmarked several groups of institutions fo
special analysis: technical institutions, l iberal arts colleges, women’s colleges, and
historically Black colleges and universities.
Productive Institutions
Among the most productive of all institutions (adjusted for size) are technical
schools with undergraduate curricula focusing on engineering and the physicalsciences. 94 As might be expected from their emphasis on the physical sciences, all but 1
of a group of 15 of these selected for analysis were among the 100 undergraduate
institutions most productive of students who earned science and engineering Ph.Ds. Two
institutions stood out as particularly productive: Caltech and MIT. During the years
94. The institutions were: California Institute of Technology, Carnegie-Mellon, CaseWestern Reserve, Colorado School of Mines, Illinois Institute of Technology, Lehigh,Massachusetts Institute of Technology, New Mexico Institute of Mining and Technology,Polytechnic Institute of New York, Rensselaer Polytechnic Institute, Rose-HulmanInstitute of Technology, South Dakota School of Mines and Technology, Stevens Instituteof Technology, Webb Institute of Naval Architecture, and Worcester PolytechnicInstitute. See Fuller, op. cit., footnote 91.
78

selected for analysis, 44 percent of Caltech and 21 percent of MIT baccalaureates went
on to earn science and engineering Ph.D.s.
Institutions that serve special populations do not provide a large proportion of
science and engineering Ph.D.s. For example, only 34 of the 120 women’s colleges
analyzed had more than 1 percent of baccalaureates obtain doctorates. Three (Radcliffe,
Bryn Mawr, and Wellesley) were in the top 100 baccalaureate sources of science and
engineering Ph.D.s. For most of these 120 colleges, an average of five graduates per95 Similarly, Black colleges andyear went on to earn science and engineering Ph.D.s.
universities, in general, had very few graduates who went on to complete science and
engineering Ph.D.s. 96 Two percent of the baccalaureates from the top-ranked Black
colleges went on to earn Ph.D.s in these fields.
Trends in Institutional Productivity
Trends in students' propensity to complete sciences and engineering Ph.D.s
indicates a link to Federal fellowship and traineeship dollars, and to Federal R&D
spending. OTA analyzed trends in institutional productivity of baccalaureates (adjusted
for size) for six time points between 1950 and 1975. The proportion of students going on
for science and engineering Ph.D.s peaked in 1965. Although the analysis was limited to
selected years, this peak generally corresponds to the rise and fall of generous Federal
fellowship support for graduate students. Appendix B provides data on the productivity
ratios of the top 100 undergraduate sources of science and engineering Ph.D.sever time.
During the rapid rise in productivity between 1955 and 1960, nearly 90 percent of
institutions increased or remained stable in their productivity ratios. The most
noteworthy change occurred from 1965 to 1970, when 89 percent of the top 100
institutions had a decrease in their productivity ratios.
95. For comparison, see Tidball, op. cit., footnote 91.96. While historically Black colleges enroll 20 percent of Black students, 40 percent ofBlacks who pursue graduate study come from the historically Black institutions. SeeWillie Pearson, Jr., and LaRue C. Pearson, !!Baccalaureate origins of Black AmericanScientists: ACohort Analysis$l JournaZ of Negro Education, vol. 54,N0. 1, 1985,pp.24-34; and Willie Pearson, Jr., flThe Role of colleges and Universities in Increasing BlackRepresentation in the Scientific Profession,M Toward Black Undergraduate StudentEquality in American Higher Education, M. Nettles and A.R. Theony (eds.) (Greenwich,CT: Greenwood Press, 1988), ch.6.
79

The same pattern was exhibited by all types of institutions. However, the 10 most
productive and the technical institutions exhibited the strongest rise and fall in
productivity; the liberal arts, women's, and Black colleges a more modest peak. While
not mirroring the pattern of distribution of Federal funds, the magnitude of differences
in productivity among institutional types is not surprising. Most Federal R&D and
fellowship dollars go to the elite research universities and doctorate-granting technical
institutions.
Baccalaureate Origins of Research Scientists and Engineers
Only some science and engineering Ph.D.s go on to become productive
researchers. What factors influence the decisions and preparation of those few who do
continue in research careers? To understand the educational path for successful research
scientists and engineers, it is important to look not just at Ph.D. production but to
identify institutional settings that encourage students who continue beyond the Ph.D. to
become active researchers.
The OTA analysis identified the undergraduate origins of Ph.D.s who join the
science and engineering work force, looking at science and engineering Ph.D.s working in
any science and engineering-related job, and at a more select group engaged in
research. 97
Looking beyond the Ph.D. to employment in science or engineering generates
different information about productive educational environments than measures of Ph.D.
productivity. Some key differences result from comparing institutions’ “researcher
productivity” rather than ‘f Ph.D. productivity”:
● Ph.D. recipients from highly-productive undergraduate institutions are
likely to stay in science and engineering.
97. Maxfield, op. cit., footnote 92. Those surveyed in 1985 had received their Ph.D.sfrom 1 to more than 20 years previously. The analysis was limited to categories ofundergraduate institutions (top 100, liberal arts, technical, women’s, historically Black)rather than individual institutions. To identify science and engineering Ph.D.s working inresearch, and trace their educational history, a group of Ph.D.s was identified from theNational Research Council’s (NCR’s) Survey of Doctorate Recipients file. These werethen matched with the NRC% Doctorate Records file, which follows a weighted sampleof Ph.D. recipients and contains information on work. The two surveys are based ondifferent data sets and are not completely comparable. Methodological information isavailable in the contractor report.
80
● About 30 percent of Ph.D.s from these highly-productive
undergraduate institutions stayed in basic or applied research.● Baccalaureate graduates from technical institutions were more likely
than graduates from other types of undergraduate institutions to
pursue research careers after completing their Ph.D. degrees. Alumni
of liberal arts colleges and the top 100 were comparable.● Ph.D.s from women’s and Black undergraduate institutions were much
less likely to select research careers.
Tracing the educational paths of successful Ph.D. researchers from highly-
productive undergraduate institutions reveals that active researchers come from
graduate study at a small number of top research universities. These elite research
universities, however, draw on a broader base— the successful graduates of highly-
productive undergraduate institutions. The career decisions made by Ph.D. recipients are
influenced as much by their college experiences as by their graduate schools.
81

Box 2-A. — Handicapped Scientists: The Invisible Minority
The physically handicapped — for example, deaf, blind, and those
wheelchair — are an invisible minority in science and engineering.
confined to a
In 1984 they
represented a work force of 92,000, or 2.2 percent of U.S. scientists and engineers. 1 In
the view of some: “Progress has been made in the cases where the package is ‘different, ’
women and minorities, but much remains to be done . . . when the package is ‘faulty ’.” 2
The problem of underutilized talent is also a problem of low expectations of
teachers and stereotypical views of what a disabled person can and cannot do.3
Individuals without any knowledge of what it means to be disabledmake major decisions for us in the light of what they think a handicappedperson is capable of doing. It starts in precollege education where someteachers discourage the disabled from attempting a career in science andcontinues and continues and continues. We, the handicapped, wind up in abox, the dimensions of which are not set by the inherent limitations in thevision and understanding of influential and not-so-influential educators. Thissquandering of human resources is an injustice second only to theconcomitant exclusion of capable and competent individuals from fullparticipation in the academic field of their choice. 4
Since 1975, colleges and universities that receive Federal funding must make
science and other courses available to handicapped undergraduates. Under the National
Science Foundation's program on Research Experiences for Undergraduates, various
campuses around the United States provide disabled students with summer introductions
to research, encouraging them to pursue careers in science.
Programs such as that hosted by the Science Institute for the Disabled at East
Carolina University, in Greenville, NC, have succeeded in improving educational
opportunities, access to laboratories, and employment in science and technology for
1. This estimate is from a National Science Foundation survey, cited by John J. Gavin,Engineering and Economics Research, Inc., testimony, Subcommittee on science,Research, and Technology, Committee on Science, Space, and Technology, U.S. House ofRepresentatives, Women, Minorit ies , und the Disabled in Science and Technology(Washington, DC: U.S. Government Printing Office, June 28, 1988), p. 131.2. Ibid., p. 132.3. Virginia Stern, Project on Science, Technology and Disability, Office ofOpportunities in Science, American Association for the Advancement of Science,testimony, in Subcommittee on Science, Research, and Technology, op. cit., footnote 1,pp. 92-93.4. Gavin, op. cit., footnote 1, p. 133. Later in his testimony he observes the ironythat: ‘fMany universities appear tosomewhat slow academically, butphysically limited.”
exploit the physical abilities of athletes who may b~not the mental capabilities of those who may be
82

handicapped students. The emphasis has been on raising the awareness of teachers and
counselors and linking handicapped students and educators through various networks. a
Out-of-school “informal” education programs based in science centers and museums
augment campus-based programs of formal instruction sensitive to the needs of the
handicapped. For example, the Disabled Access program of the Exploratorium in San
Francisco, begun in 1986, has been expanded through partnership with the San Francisco
Volunteer Center’s Youth Quest Internship Program. Youth Quest is an experimental
education and community service project for middle school adolescents. An internship
program trains volunteers on how to make 600 Exploratorium exhibits accessible to
visitors with mobility, hearing, and vision impairments. Disabled mentors and students
speak with the interns, heightening their awareness that disabilities do not diminish
curiosity. 6
Programs that bring handicapped students (of all ages) together in educational
settings with scientists (disabled and others) are needed to erase stereotypes and present
opportunities that create and sustain interest in research careers. Such programs bring
new meaning to the familiar words “recruitment" and “retention."
5. Michael Heylin, ‘ tHands-On Research for Disabled Students,” Chemica2 &Engineering News, Aug. 15, 1988, p. 25.6. Ellen Lieber, ‘tYouth Quest Interns Assess Exploratorium Exhibits forAccessibility,” ASTC Newsletter, November/December 1988, pp. 9-10.
83

Box 2-B. — Retaining Hispanics and Blacks in Engineering:
California’s Minority Engineering Program
The California Minority Engineering Program (MEP) has dramatically improved the
retention of Black and Hispanic students in engineering majors in California public.
universities and colleges. 1 Not only are MEP students much more likely to stay with
engineering than are minorities students not in MEP, but they even outperform majority
engineering students (see table below). MEP began at one institution in 1973. In 1982,
the State funded the expansion of MEP to most other California university campuses. In
1986-87, about 2,500 students were in MEP.
Crucial elements of MEP — and crucial to most intervention programs — are:● peer support, tutoring, and community building among minority
students;● academic support through science and mathematics workshops; and● professional and personal support through
organizations, summer jobs, internships,
activities.
participation in student
and career awareness
The founder of MEP, Raymond B. Landis, emphasizes the particular importance of
helping students through the freshman year, usually the most difficult phase of academic
and social adjustment for minorities. His relatively low-cost programs includes in-depth,
formal university and academic orientation, clustering MEP students in the same classes
so they can work together on the same assignments, upper-class mentors, and a 24-hour
student study center. Regular classes are supplemented with both prefreshmen bridge
programs and workshops. MEP also facilitates employment and career development
through summer jobs, internships, and career presentations.
1. California Postsecondary Education Commission, “Retention of Students inEngineering: A Report to the Legislature in Response to Senate Concurrent Resolution16 (1985 ),” unpublished draft, December 15, 1986; Raymond B. Landis, ‘f The Case forMinority Engineering Programs,” Engineering Education, vol. 78, No. 8, May 1988, pp.756-761; and Cheryl M. Fields, ‘tWhat Works: California’s Minority EngineeringProgram, ’t The ChronicZe of Higher Education, Sept. 30, 1987, p. A33. See also NationalAction Council for Minorities in Engineering, Improving the Retention and Graduation ofMinorities in Engineering (New York, NY: 1985).
In 1984-85, 19 California public institutions enrolled over 31,000 engineeringundergraduates and awarded 5,391 engineering baccalaureates, about 7 percent ofnational enrollments and degree awards.
84
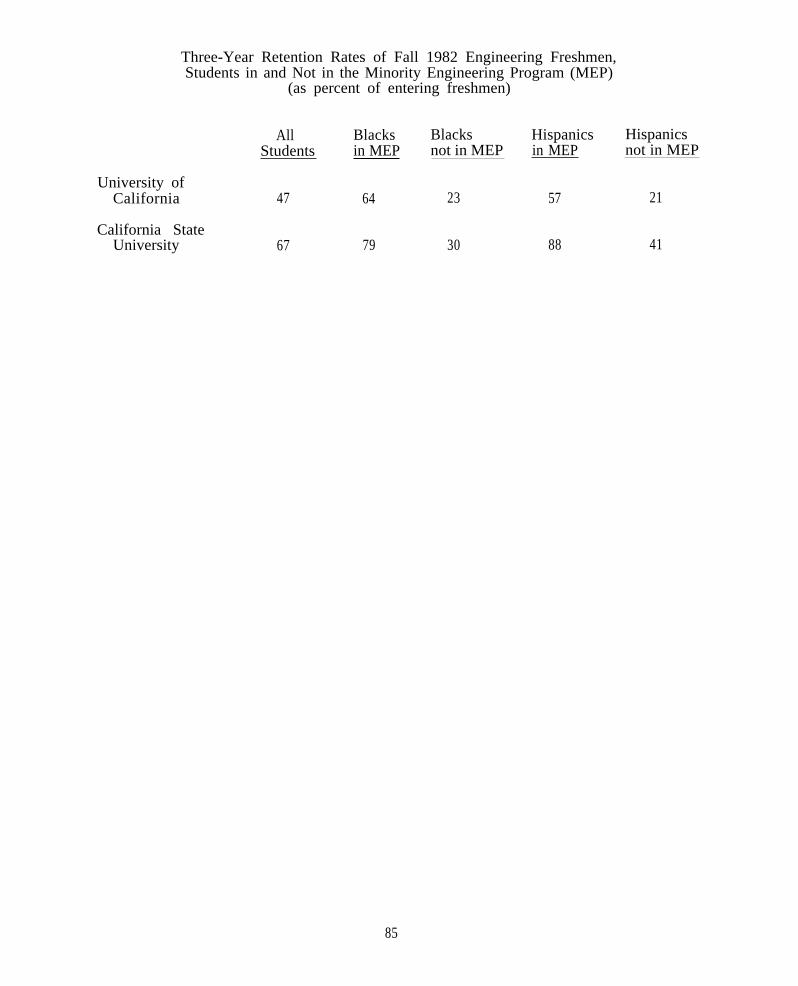
Three-Year Retention Rates of Fall 1982 Engineering Freshmen,Students in and Not in the Minority Engineering Program (MEP)
(as percent of entering freshmen)
All Blacks Blacks Hispanics HispanicsStudents in MEP not in MEP in MEP not in MEP
University ofCalifornia 47 64 23 57 21
California StateUniversity 67 79 30 88 41
85

Box 2-c. — Douglass Project for Rutgers Women in Mathematics and Science
The Douglass Project at Rutgers University’s Douglass College was launched in
September of 1986 to increase the number of female students in mathematics and
science. The project is open to all women on the New Brunswick campus. 1
The project sponsors peer study groups, career planning workshops, and a mentor
program that includes seminars with presentations by role models in academia and
industry. Target audiences are high school students, teachers, and parents. Grants are
also sought for an on-campus summer institute. Douglass coordinators consider this
outreach component to be the most crucial of the project because of the 9th and 10th
grade science and mathematics "gatekeeper" function. Director Ellen Mappan is working
with Arlene Chasek at Futures Unlimited, a support program targeting female high
school students interested in science and mathematics, in developing the precollege
program.
Although the
enthusiastic. Over
suggested ideas for
Douglass Project is relatively new, the response has been
100 students participated in the first-semester activities and
future Douglass Project components. Thematic study groups are
especially popular. The interest generated by the project literature has even resulted in
the establishment of a residence house for undergraduates. The Douglass Project is
funded by a 3-year, $123,500 grant from the New Jersey Department of Higher
Education’s Fund for the Improvement of Higher Education. Contributions have also
come from the Associate Alumnae of Douglass, the Ellis and Adrienne Anderson Science
Enrichment Fund, the Provost's Excellence Fund, and the Joe and Emily Lowe
Foundation.
1. Doris Kulman, “DC Project Encouraging Women in Math, Science," RutgersNewsletter, Dec. 5, 1986.
86

Box 2-D. — The Neal Report
In 1986 the National Science Board concluded an in-depth study of undergraduate.
science and engineering education. 1 The report of the Task Committee identified three
areas of undergraduate science and engineering education needing particular attention:● • equipping laboratories and making laboratory instruction and research
an important and vibrant part of undergraduate education;● Ž upgrading the qualifications of faculty; and● improving courses, curricula, and the quality of instruction.
The committee called upon all major actors — universities and colleges, States,
corporations and foundations, and mission agencies — to do their part in each of these
three areas. The special roles and needs of 2-year and minority institutions, and the
importance of institutional diversity, were also noted. The committee recommended
that the National Science Foundation (NSF) spend an additional $100 million each year on
laboratory instruction, faculty enhancement, curriculum development (particularly in
mathematics and engineering), research participation, instructional equipment, and
minority institutions. 2 These funds and programs could be highly leveraged through
matching as well as by “setting examples” for universities, States, and industry. Noting
that Federal agencies and corporations focused their attention and spending on research
and research-linked graduate education, the committee recommended that NSF, mission
agencies, and other research sponsors find new ways to involve undergraduates and
undergraduate faculty in research.
1. National Science Board, Task Committee on Undergraduate Science andEngineering Education, Undergraduate Science, Mathematics and Engineering Education,NSB 86-100 (Washington, DC: National Science Foundation, March 1986), known as theNeal Report after the chair of the Task Committee.2. Since the publication of the report, continuing deterioration of conditions hasincreased cost estimates. National Science Foundation Director Bloch secured a promiseto double the budget of his Agency by 1992. While congressional appropriations in fiscalyears 1988 and 1989 were disappointing, in the context of a $2.2 to $3.0 billion budget,the Task Corn mittee’s price tag attached to their recommendations seems modest.
87

Box 2-E.— Undergraduate Research Participation:
U.S. Department of Energy Student Research Program
The Department of Energy (DOE), as part of its mission to develop scientists and
engineers in fields relevant to DOE’s mission, supports undergraduate student research.
The Student Research Participation program (SRP) each year provides about 1,200
talented college juniors and seniors the opportunity to do summer research at DOE
laboratories. This mentored research provides students a unique opportunity for hands-on
experience as part of a research team at sophisticated facilities.
The SRP program is effective; its alumni go on to higher degrees, do research, and
excel in science, engineering, and medicine. Students gain not only a professional.
understanding of research and career paths, but self-confidence as well.1 Some
representative comments reflect the enthusiasm of SRP students for the experience, and
the lasting impact it had on their careers:
“My participation in research efforts in immunology at Argonne was
pivotal in my choice of career and contributed greatly to subsequent
research efforts. ”
“My appointment resulted in my attending grad school rather than
becoming a medical technologist — which was my original career plan. ”
“To date, I still feel that my summer with Brookhaven was the most
exciting, and perhaps, most important event in my professional career.”
1. Frank M. Vivio and Wayne Stevenson, U.S. Department of Energy Student ResearchParticiputkm Program: Profile und Survey of J979-1982 Participants (Washington, DC:U.S. Department of Energy, January 1988). In 1987 the Department of Energy (DOE)evaluated the Student Research Participation program, looking particularly at the long-term impact on students’ choice of fields and decision to go on for a graduate degree andwork in research. The evaluation also investigated to what extent students’ choice ofdegrees and research areas supported DOE’S mission research. The evaluation surveyed asample of students who had been in the program between 1979 and 1982, thus allowing 5or more years for long-term effects to be seen, and for transitory effects to disappear.As with all such “people development” programs, it is difficult to tell how much of thesuccess of alumni is due to their high ability and interest coming into the program, andhow much is due to the additional boost the program may give them. What is clear,however, is that the whole program, from selection of students to the researchexperience itself, generates a cadre of research-oriented, high-caliber scientists andengineers.
88

Women’s decisions about the attractiveness of graduate school and their degree
aspirations were much more affected by SRP than were those of men. However, the SRP
group still reflects national patterns: women are much less likely than their male
counterparts to plan a Ph. D., and less likely to work in the physical sciences or
engineering or at a university. The SRP program also has a high proportion of minority
participants, particularly Blacks.
89

Box 2-F. — Community Colleges: An Alternate Entry Route?
The 1,300 U.S. community colleges enroll over one-half of first-time freshman — 2
million in 1985. They fill several niches in science and engineering education. First,
they provide an alternate educational route into the science and engineering pipeline for4
some students, by preparing them for transfer to B. S.-granting colleges.1 Second, and
most important to the overall research and development effort, they train technicians
and technologists. Third, a growing part of community college services is customized
retraining, primarily for industry technicians. Many community colleges have a regular
contract training agreement with local companies; over one-quarter of students receive
employer-subsidized job-related training. 2 In some cases State funding is prorated to
provide more money for students in vocational courses, in the interest of economic
development and work force training. Another, smaller role of community colleges is
providing high school students with courses unavailable in their schools.
One estimate is that 5 to 15 percent of all community college students transfer to3 About 40 percent of community college graduates transfer. 4
4-year institutions.
Transfer of students into engineering from community colleges almost compensates for
attrition of freshmen and sophomores at baccalaureate-granting institutions. It is
unclear, however, whether students who transfer in as sophomores or juniors from
community colleges are more likely to complete a B.S. than are students who entered as
freshmen.
1. G.R. Kissler, ‘tThe Decline of the Transfer Function,” Improving Articulation andTransfer Relationships, F.C. Kintzer (cd.) (San Francisco, CA: Jossey-Bass, 1982);Western Interstate Commission for Higher Education, Improving theArticulation/Transfer Process Between Two- and Four-Year Institutions (Boulder, CO:1985); and Arthur M. Cohen and Florence B. Brawer, The Collegiate Function ofCommunity Colleges (San Francisco, CA: Jossey-Bass, 1987).2. Cheryl M. Fields, “Many Aggressive Community Colleges Focusing on TrainingWorkers for Fast-Growing Fields,” The Chronicle of Higher Education, Feb. 25, 1987, p.21.3. Richard C. Richardson, Jr. and Louis W. Bender, Students in Urban Setting:Achieving the Baccalaureate Degree, Association for the Study of Higher Education,cited in “Vocational Focus of 2-Year Colleges in Urban Areas Helps to Perpetuate SocialInequality, Report Says,l’ The Chronicle of Higher Education, Apr. 2, 1986, p. 15. (If the30 percent rule — of all B.S. degrees earned, 30 percent are in science and engineering —holds for transfers in, a 10 percent transfer rate means that about 60,000 (20 percent) ofbaccalaureate scientists and engineers each year hail from community college origins.This estimate seems high, or optimistic, depending on one’s perspective.40 Daviel D. Savage, IICOM Munity Colleges open Door to EducationSt’ New YorkTimes, Feb. 2, 1987, letter.
90

This transfer opportunity is particularly important for minorities, since those
Blacks and Hispanics who continue their education beyond high school are much more
likely than whites to enter community colleges. The disproportionately large number of
minority students who begin their collegiate careers at community colleges makes the5 However, in a national perspective communitytransfer function socially imperative.
colleges are not "helping" the educationally disadvantaged towards 4-year degrees.
Blacks and Hispanics are much less likely to transfer out of community colleges than are
whites.
A key policy question is how to help make community colleges a
environment for minorities. States with large minority populations,
fertile educational
such as California
and Florida, have established student assessment and placement programs in cooperation
with 4-year institutions to prepare those who wish to transfer in pursuit of the
baccalaureate. 6
Community colleges provide an alternate, "late entry" route to the main education
pipeline. Given the high percentage of minority students in community colleges and the
dearth of minorities in science and engineering, this alternate route to a science or
engineering degree, and therefore teaching as well as research, must be explored. 7
States and Congress in recent years have paid increasing attention to the role of
community colleges in high-technology training. Congress directed the National Science
Foundation (NSF) to expand eligibility for several college assistance programs to
community colleges. Legislation has proposed that NSF support and guide technician
training. 8 However, programs to encourage the use of community colleges as a stepping-
stone to higher degrees are much rarer.
5. J.G. Avilaet al., Petition to Increase Minority Transfer From Community Collegesto State Four-Year Schools (San Francisco, CA: Mexican American Legal Defense andEducational Fund, Inc.; and Public Advocates, Inc., 1983L6. See, for example, Cheryl Fields, ~lcommunity Colleges Discover They Are at theRight Place at the Right Time/t Governing, February 1988, pp. 30-35.7. For example, see Martin Haberman, I!Alliances Between 4-Year Institutions and 2-Year Colleges Can Help Recruit More Minority Students into Teaching,n The ChronicleofHigher Education, July27, 1988, p.A28.8. H.R. 2134, introduced in April 1987 by Rep. Doug Walgren, requires the directorofthe National Science Foundation to carry out an advanced technician training program,making matching grants to community and technical colleges to provide training instrategic fields. The bill was referred to the House Committee on Education and Labor.
91

The success of transfer programs is difficult to assess, in large part because of lack
of information. Data that trace the educational paths taken by community college
students would be useful to determine whether funding mechanisms might be put into
place to reward community colleges for transferring students to 4-year institutions. 9
9. Jim Palmer, “Bolstering the Community College Transfer Function:’ An ERICReview,’t Community College Review, vol. 14, No. 3, winter 1986/1987, pp. 58-60.
92
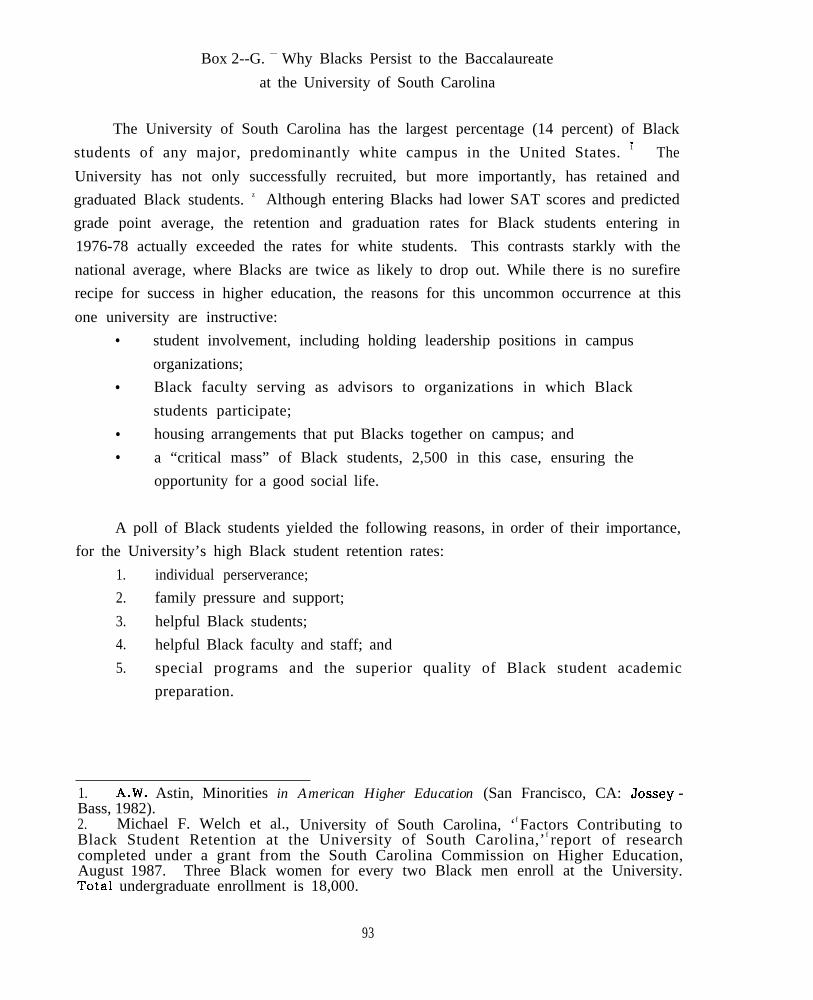
Box 2--G. — Why Blacks Persist to the Baccalaureate
at the University of South Carolina
The University of South Carolina has the largest percentage (14 percent) of Black.
students of any major, predominantly white campus in the United States. 1 The
University has not only successfully recruited, but more importantly, has retained and
graduated Black students. z Although entering Blacks had lower SAT scores and predicted
grade point average, the retention and graduation rates for Black students entering in
1976-78 actually exceeded the rates for white students. This contrasts starkly with the
national average, where Blacks are twice as likely to drop out. While there is no surefire
recipe for success in higher education, the reasons for this uncommon occurrence at this
one university are instructive:● student involvement, including holding leadership positions in campus
organizations;● Black faculty serving as advisors to organizations in which Black
students participate;● housing arrangements that put Blacks together on campus; and● a “critical mass” of Black students, 2,500 in this case, ensuring the
opportunity for a good social life.
A poll of Black students yielded the following reasons, in order of their importance,
for the University’s high Black student retention rates:
1. individual perserverance;
2. family pressure and support;
3. helpful Black students;
4. helpful Black faculty and staff; and
5. special programs and the superior quality of Black student academic
preparation.
1. A.W. Astin, Minorities in American Higher Education (San Francisco, CA: Jossey -Bass, 1982).2. Michael F. Welch et al., University of South Carolina, ‘f Factors Contributing toBlack Student Retention at the University of South Carolina,’ f report of researchcompleted under a grant from the South Carolina Commission on Higher Education,August 1987. Three Black women for every two Black men enroll at the University.Total undergraduate enrollment is 18,000.
93

A study concluded that Blacks enjoy a campus climate of acceptance that is
relatively free of racial discrimination, especially in the classroom. They also
participate in a special freshman orientation course to help them adjust to campus
life.3
3. Ibid., p. 39. This course has led to the establishment of the National Center for theStudy of the Freshman Year Experience on Campus. Elizabeth Greene, ‘tSouth CarolinatsGardner: Self-Appointed Spokesman for the ‘Largest Educational Minorityt — Freshmen,tt
The Chronicle of Higher Education, Oct. 7, 1987, pp. A41-43. For an evaluation of thecourse, see Mark G. Shanley, University of South Carolina, “An Exploratory LongitudinalStudy of Retention, Persistence, and Graduate Rates ofParticipants and Non-Participants at the University of South1979 -1986,” doctoral dissertation, 1987.
94
Freshman Se-minar- CourseCarolina During the Period