chapter 2: tools for healthy eating - napa valley college 103/blake lectures/ch 2.pdf · chapter 2:...
TRANSCRIPT

Chapter 2 Lecture
Chapter 2:
Tools for Healthy
Eating
© 2017 Pearson Education, Inc.

© 2017 Pearson Education, Inc.
Objectives for Chapter 2
• Describe the three key principles of a healthy diet and
the tools you can use to help guide you.
• Explain what the DRIs are and the differences between
the EAR, AI, RDA, UL, and AMDR.
• Describe the principles in the Dietary Guidelines for
Americans.
• Explain the concept of MyPlate and name the five food
groups and the typical foods represented in each group.
• Identify the required components of a food label and how
to use it.
• Explain the role of functional foods in the diet.

© 2017 Pearson Education, Inc.
What Is Healthy Eating and What Tools Can
Help?
• Key principles of healthy eating:
• Balance
• Variety
• Moderation
• Undernutrition: state of inadequate nutrition
• Overnutrition: excess nutrients and/or calories
in diet
• Malnourished: long-term outcome of
consuming a diet that doesn't meet nutrient
needs
• Can result from both under- and overnutrition

© 2017 Pearson Education, Inc.
What Is Healthy Eating and What Tools Can
Help?, Continued
• Tools to help avoid under- and overnutrition:
• Dietary Reference Intakes (DRIs)
• Nutrient recommendations
• Dietary Guidelines for Americans
• General dietary and lifestyle advice
• MyPlate
• Food recommendations based on DRIs and the
advice from the Dietary Guidelines
• Daily Values on the Nutrition Facts panel of
food labels

© 2017 Pearson Education, Inc.
Dietary Recommendations and
Implementation Tools
Figure 2.1

© 2017 Pearson Education, Inc.
What Are the Dietary Reference Intakes?
• DRIs tell you how much of each nutrient you
need to consume to:
• Maintain good health
• Prevent chronic diseases
• Avoid unhealthy excesses
• Issued by U.S. National Academy of Sciences'
Institute of Medicine
• Updated periodically based on latest scientific
research

© 2017 Pearson Education, Inc.
DRIs Encompass Several Reference Values
• Estimated Average Requirement (EAR)
• Average amount of a nutrient known to meet
the needs of 50 percent of individuals of
same age and gender
• Starting point for determining the other values
• Recommended Dietary Allowance (RDA)
• Based on the EAR, but set higher
• Average amount of a nutrient that meets the
needs of nearly all individuals (97 to 98
percent)

© 2017 Pearson Education, Inc.
DRIs Encompass Several Reference Values,
Continued
• Adequate Intake (AI)
• Used if scientific data to determine EAR and
RDA are insufficient
• Next best estimate of amount of nutrient
needed to maintain good health
• Tolerable Upper Intake Level (UL)
• Highest amount of nutrient that is unlikely to
cause harm if consumed daily
• Consuming amount higher than the UL daily
may cause toxicity

© 2017 Pearson Education, Inc.
DRIs Encompass Several Reference Values,
Continued-1
• Acceptable Macronutrient Distribution Range
(AMDR)
• Recommended range of intake for energy-
containing nutrients
• Carbohydrates: 45 to 65 percent of daily caloric
intake
• Fat: 20 to 35 percent of daily caloric intake
• Proteins: 10 to 35 percent of daily caloric intake

© 2017 Pearson Education, Inc.
DRIs Encompass Several Reference Values,
Continued-2
• Estimated Energy Requirement (EER)
• Amount of daily energy needed to maintain
healthy body weight and meet energy needs
• Different approach than RDAs or AIs
• Takes into account age, gender, height,
weight, and activity level

© 2017 Pearson Education, Inc.Table 2.1
How Many Calories Do You Need Daily For
Males?
Table 2.1 How Many Calories Do You Need Daily?
The amount of calories you need daily is based upon
your age, gender, and activity level.*
Age Sedentary
Moderately
Active Active
16-18 2,400 2,800 3,200
19-20 2,600 2,800 3,000
21-25 2,400 2,800 3,000
26-30 2,400 2,600 3,000
31-35 2,400 2,600 3,000
36-40 2,400 2,600 2,800
41-45 2,200 2,600 2,800
46-50 2,200 2,400 2,800
Source: U.S. Department of Agriculture. 2015. Dietary Guidelines for Americans advisory committee.
*Note: These calorie levels are based on the Institute of Medicine’s Estimated Energy Requirements from the Dietary Reference Intakes:
Macronutrients Report, 2002.
Sedentary: Partaking in less than 30 minutes a day of moderate physical activity in addition to daily activities.
Moderately Active: Partaking in at least 30 minutes and up to 60 minutes a day of moderate physical activity in addition to daily activities.
Active: Partaking in 60 or more minutes a day of moderate physical activity in addition to daily activities.

© 2017 Pearson Education, Inc.Table 2.1
How Many Calories Do You Need Daily For
Females?
Table 2.1 How Many Calories Do You Need Daily?
The amount of calories you need daily is based upon
your age, gender, and activity level.*
Age Sedentary
Moderately
Active Active
16-18 1,800 2,000 2,400
19-20 2,000 2,200 2,400
21-25 2,000 2,200 2,400
26-30 1,800 2,000 2,400
31-35 1,800 2,000 2,200
36-40 1,800 2,000 2,200
41-45 1,800 2,000 2,200
46-50 1,800 2,000 2,200
Source: U.S. Department of Agriculture. 2015. Dietary Guidelines for Americans advisory committee.
*Note: These calorie levels are based on the Institute of Medicine’s Estimated Energy Requirements from the Dietary Reference Intakes:
Macronutrients Report, 2002.
Sedentary: Partaking in less than 30 minutes a day of moderate physical activity in addition to daily activities.
Moderately Active: Partaking in at least 30 minutes and up to 60 minutes a day of moderate physical activity in addition to daily activities.
Active: Partaking in 60 or more minutes a day of moderate physical activity in addition to daily activities.

© 2017 Pearson Education, Inc.
DRIs
Dietary Reference Intakes (DRIs) are specific
reference values for each nutrient issued by
the United States National Academy of
Sciences, Institute of Medicine. They identify
the amounts of each nutrient that one needs
to consume to maintain good health.
DRIs FOR MOST NUTRIENTS
EAR The Estimated Average Requirement
(EAR) is the average daily intake level
estimated to meet the needs of half the
people in a certain group. Scientists use
it to calculate the RDA.
RDA The Recommended Dietary
Allowance (RDA) is the average daily intake
level estimated to meet the needs of nearly
all people in a certain group. Aim for this
amount!
AI The Adequate Intake (AI) is the average
daily intake level assumed to be adequate. It
is used when an EAR cannot be determined.
Aim for this amount if there is no RDA!
UL The Tolerable Upper Intake Level (UL) is
the highest average daily intake level likely to
pose no health risks. Do not exceed this
amount on a daily basis!
Figure 2.2

© 2017 Pearson Education, Inc.
How to Use the DRIs
• To plan a quality diet and make healthy food
choices
• Goal:
• Meet the RDA or AI for all nutrients
• Do not exceed the UL
• Consume the energy-yielding nutrients within the
ranges of the AMDR

© 2017 Pearson Education, Inc.
Table 2.2
The Do’s and Don’ts of the DRIs
Table 2.2 The Do’s and Don’ts of the DRIs
The Reference Values
and Their Meaning When Planning Your Diet
Estimated Average Requirement (EAR) Don’t use this amount.
Recommended Dietary Allowance (RDA) Do aim for this amount!
Adequate Intake (AI) Do aim for this amount if an RDA isn’t available.
Tolerable Upper Intake Level (UL) Don’t exceed this amount on a daily basis.
Acceptable Macronutrient Distribution
Ranges (AMDR)
Do follow these guidelines regarding the
percentage of carbohydrates, protein, and fat in
your diet.
Source: Institute of Medicine of the National Academies, “The Do’s and Don’ts of the DRIs” from
Dietary Reference Intakes: Applications in Dietary Planning. Reprinted with permission from the National
Academies Press. Copyright © 2003, National Academy of Sciences.

© 2017 Pearson Education, Inc.
DRI Determination

© 2017 Pearson Education, Inc.
What Are the Dietary Guidelines for
Americans?
• The Dietary Guidelines for Americans reflect the
most current nutrition and physical activity
recommendations.
• Set by the USDA and Department of Health
and Human Services
• Updated every five years
• Allow healthy individuals over the age of 2 to
maintain good health and prevent chronic
disease

© 2017 Pearson Education, Inc.
Dietary Guidelines for Americans at a
Glance
• Two overarching concepts:
• Maintain calorie balance over time to achieve
and sustain healthy weight
• Consume more nutrient-rich foods and
beverages
• Key recommendations:
• Balance calories to manage weight
• Improved eating habits, increased physical activity
• Reduce some food components
• Limit sodium, saturated fat, trans fat, sugars,
refined grains, alcohol

© 2017 Pearson Education, Inc.
Dietary Guidelines for Americans at a
Glance, Continued
• Increase some foods and nutrients
• More fruits and vegetables, whole grains, fat-free
dairy, lean meats, seafood, oils instead of solid fats
• Choose foods with potassium, fiber, calcium,
vitamin D
• Build healthy eating patterns
• Select eating pattern that meets nutrient needs over
time
• Account for all foods and beverages consumed and
assess how they fit within a healthy eating pattern
• Follow food safety recommendations when
preparing and eating foods to avoid foodborne
illness

© 2017 Pearson Education, Inc.
What Are MyPlate and ChooseMyPlate.gov?
• MyPlate is the most recent food guidance system
for Americans, released by the USDA in 2011
• Food guidance systems: visual diagrams
providing variety of food recommendations to
help create a well-balanced diet
• Many countries create these based on their food
supply, cultural food preferences, and the nutritional
needs of their population
• Part of Web-based initiative,
ChooseMyPlate.gov
• Shows variety of food groups

© 2017 Pearson Education, Inc.
Healthy Eating around the World
Figure 2.3

© 2017 Pearson Education, Inc.
MyPlate
Figure 2.4
© 2017 Pearson Education, Inc.
MyPlate and ChooseMyPlate.gov Emphasize
Changes in Diet, Eating Behaviors, and
Physical Activity
• Promote proportionality, moderation, variety, and
personalization
• Proportionality: the relationship of one entity to another
• Devote more than half of the plate to low-calorie fruits
and vegetables. Should crowd out higher calorie
grains and protein food choices
• The foundation of your diet should be nutrient dense
foods from each group
• Provide more nutrients per calorie
• Little solid fats and added sugars
• Energy density refers to foods that are high in energy
but low in weight or volume; more calories per gram

© 2017 Pearson Education, Inc.
Which is the Healthier Way to Enjoy Your
Potatoes?
Figure 2.5

© 2017 Pearson Education, Inc.
Nutrient-Dense Food Choices
Figure 2.6
© 2017 Pearson Education, Inc.
Mix Up Your Choices within Each Food
Group
Figure 2.7
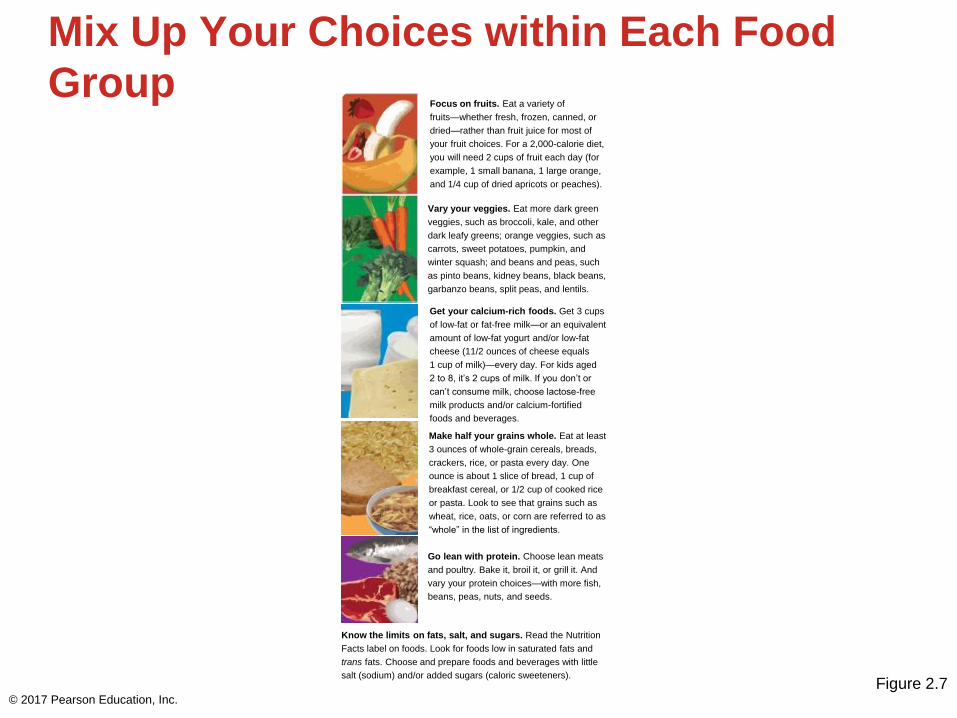
Focus on fruits. Eat a variety of
fruits—whether fresh, frozen, canned, or
dried—rather than fruit juice for most of
your fruit choices. For a 2,000-calorie diet,
you will need 2 cups of fruit each day (for
example, 1 small banana, 1 large orange,
and 1/4 cup of dried apricots or peaches).
Vary your veggies. Eat more dark green
veggies, such as broccoli, kale, and other
dark leafy greens; orange veggies, such as
carrots, sweet potatoes, pumpkin, and
winter squash; and beans and peas, such
as pinto beans, kidney beans, black beans,
garbanzo beans, split peas, and lentils.
Get your calcium-rich foods. Get 3 cups
of low-fat or fat-free milk—or an equivalent
amount of low-fat yogurt and/or low-fat
cheese (11/2 ounces of cheese equals
1 cup of milk)—every day. For kids aged
2 to 8, it’s 2 cups of milk. If you don’t or
can’t consume milk, choose lactose-free
milk products and/or calcium-fortified
foods and beverages.
Make half your grains whole. Eat at least
3 ounces of whole-grain cereals, breads,
crackers, rice, or pasta every day. One
ounce is about 1 slice of bread, 1 cup of
breakfast cereal, or 1/2 cup of cooked rice
or pasta. Look to see that grains such as
wheat, rice, oats, or corn are referred to as
“whole” in the list of ingredients.
Go lean with protein. Choose lean meats
and poultry. Bake it, broil it, or grill it. And
vary your protein choices—with more fish,
beans, peas, nuts, and seeds.
Know the limits on fats, salt, and sugars. Read the Nutrition
Facts label on foods. Look for foods low in saturated fats and
trans fats. Choose and prepare foods and beverages with little
salt (sodium) and/or added sugars (caloric sweeteners).

© 2017 Pearson Education, Inc.
How to Use MyPlate and
ChooseMyPlate.gov
• ChooseMyPlate.gov gives you the number of
servings to eat from each food group based on
daily calorie needs
• Calorie needs are based on age, gender, and
activity level

© 2017 Pearson Education, Inc.
NutriTool: Build-A-Meal
PLAY Build A Meal

© 2017 Pearson Education, Inc.
NutriTool: Build-A-Salad
PLAY Build A Salad

© 2017 Pearson Education, Inc.
How Much Should You Eat from Each Food
Group?
Table 2.3 How Much Should You Eat from Each Food Group?
The following are suggested amounts to consume daily from each of the basic five food
groups and healthy oils based on your daily calorie needs. Remember that most of your
choices should contain little solid fats and added sugar.
Calorie
Level
Vegetables
(cups)
Fruits
(cups)
Grains
(oz eq)
Protein
(oz eq)
Dairy
(cups)
Oil*
(tsp)
1,600 2 1.5 5 5 3 5
1,800 2.5 1.5 6 5 3 5
2,000 2.5 2 6 5.5 3 6
2,200 3 2 7 6 3 6
2,400 3 2 8 6.5 3 7
2,600 3.5 2 9 6.5 3 8
2,800 3.5 2.5 10 7 3 8
3,000 4 2.5 10 7 3 10
3,200 4 2.5 10 7 3 11

© 2017 Pearson Education, Inc.
How Much Should You Eat from Each Food
Group?, Continued
Vegetables: Includes all fresh, frozen, canned, and dried vegetables, and vegetable juices. In general, 1 cup
of raw or cooked vegetables or vegetable juice, or 2 cups of raw leafy greens, is considered 1 cup from the
vegetable group.
Fruits: Includes all fresh, frozen, canned, and dried fruits, and fruit juices. In general, 1 cup of fruit or 100%
fruit juice, or ½ cup of dried fruit, is considered 1 cup from the fruit group.
Grains: Includes all foods made with wheat, rice, oats, cornmeal, or barley, such as bread, pasta, oatmeal,
breakfast cereals, tortillas, and grits. In general, 1 slice of bread, 1 cup of ready-to-eat cereal, or ½ cup of
cooked rice, pasta, or cooked cereal is considered 1 ounce equivalent (oz eq) from the grains group. At least
half of all grains consumed should be whole grains such as whole-wheat bread, oats, or brown rice.
Protein: In general, 1 ounce of lean meat, poultry, or fish, 1 egg, 1 tablespoon peanut butter, ¼ cup cooked dry
beans, or ½ ounce of nuts or seeds is considered 1 ounce equivalent (oz eq) from the protein foods group.
Dairy: Includes all fat-free and low-fat milk, yogurt, and cheese. In general, 1 cup of milk or yogurt, 1½ ounces
of natural cheese, or 2 ounces of processed cheese is considered 1 cup from the dairy group.
Oil: Includes vegetable oils such as canola, corn, olive, soybean, and sunflower oil, fatty fish, nuts, avocados,
mayonnaise, salad dressings made with oils, and soft margarine.
*Oils are not considered a food group but should be added to your diet for good health.
Source: U.S. Department of Agriculture. 2015. Dietary Guidelines for Americans advisory committee.

© 2017 Pearson Education, Inc.
What's a Serving? Eat with Your Hands!
Figure 2.8

© 2017 Pearson Education, Inc.
How Solid Fats and Added Sugars Fit into a
Healthy Diet
Figure 2.9

© 2017 Pearson Education, Inc.
Table 2.4
Choose Right!
Table 2.4 Choose Right!
As you can see, your daily food plan could provide a fair amount of solid fats and added
sugars, depending on your food selections.
Choosing … Over … Will Cost You
Whole milk (1 cup) Fat-free milk (1 cup) 65 calories of solid fats
Roasted chicken thigh with
skin (3 oz)
Roasted chicken breast,
skinless (3 oz)70 calories of solid fats
Glazed doughnut, yeast type
(3 ¾” diameter)English muffin (1 muffin)
165 calories of solid fats
and added sugars
French fries (1 medium order) Baked potato (1 medium) 299 calories of solid fats
Regular soda (1 can, 12 fl oz) Diet soda (1 can, 12 fl oz) 150 calories of added sugars
Source: Adapted from U.S. Department of Agriculture, MyPlate, “Empty Calories: How Do I Count the
Empty Calories I Eat?” Available at www.ChooseMyPlate.gov.

© 2017 Pearson Education, Inc.
Practical Nutrition Tips Video: Portion Size

© 2017 Pearson Education, Inc.
A Healthy Daily Food Plan
Figure 2.10

© 2017 Pearson Education, Inc.
Table 2.5
A Combination of Good Food
Table 2.5 A Combination of Good FoodMany of the foods you eat are probably mixed dishes that contain servings from multiple food groups. The following list should help you
estimate the servings from each food group for some popular food items. Because the preparation process can vary greatly among recipes,
these are only estimates.
Food and Sample Portion
Vegetables
Group
(cups)
Fruits
Group
(cups)
Grains
Group
(oz eq)
Protein
Group
(oz eq)
Dairy
Group
(cups)
Estimated
Total
Calories
Cheese pizza, with extra vegetables thick crust ½ 0 3 0 3/4 380
Macaroni and cheese (1 cup, made from packaged mix) 0 0 2 0 1/4 335
Burrito with beans, cheese, onions, & salsa,
meatless (1 small) 1/4 0 2 2 1¼ 340
Chicken fried rice (1 cup)
1/4
0 1½ 1 0 330
Double cheeseburger, with catsup, pickles,
& onions on bun
1/4
0 2½ 2 1/8 450
Tuna salad sandwich
1/4
0 2 2 0 290
Peanut butter and jelly sandwich (1) 0 0 2 1½ 0 335
Apple pie (1 slice) 0 1/4 2 0 0 335–355
Source: U.S. Department of Agriculture. Counting Calories in Mixed Dishes. Available at www.ChooseMyPlate.gov.

© 2017 Pearson Education, Inc.
When a Portion Isn't a Portion
• A portion is the amount of food eaten in one
sitting
• The FDA defines serving size as a standard
amount of food that is customarily consumed
• Standardizing allows for consistency and
helps consumer get a ballpark idea of what a
typical serving should be
• The restaurant industry has appealed to your
desire to get the most food for your money by
expanding restaurant portion sizes, especially of
inexpensive foods, such as fast foods

© 2017 Pearson Education, Inc.
When a Portion Isn't a Portion, Continued
Comparison of Portion Sizes of Common Foods
Food
Typical
Portion
Recommended
Serving Size
FDA
Label
Cooked pasta 2.9 cups 0.5 cup 1.0 cup
French fries 5.3 oz 10 fries 2.5 oz
Bagel 4.4 oz 1.0 oz 2.0 oz
Muffin 6.5 oz 1.5 oz 2.0 oz
Cookie, chocolate chip 4.0 oz 0.5 oz 1.1 oz
Source: Data from L. R. Young and M. Nestle, “ Expanding Portion Sizes in the U.S. Marketplace:
Implications for Nutrition Counseling,” Journal of the American Dietetic Association 103 (2003): 231-234.

© 2017 Pearson Education, Inc.
When a Portion Isn't a Portion, Continued-1
Controlling Portion SizeWhen You Are: Do This:
At Home Measure your food until you develop an “eye” for correct portion sizes.
Use smaller plates so portions appear larger.
Plate your food at the counter before sitting down at the table or in front of the television.
Store leftover foods in portion-controlled containers.
Don’t eat snacks directly from the box or bag; measure a portion first, then eat only that amount.
Cook smaller quantities of food so you don’t pick at the leftovers.
Eating Out Ask for half orders when available.
Order an appetizer as your main entrée.
Don’t be compelled to “clean your plate”; stop eating when you’re full and take the rest home.
Food Divide a package of snacks into individual portion sizes and consume only one portion at any one sitting.
Shopping Be aware of the number of servings in a package; read the labels.
Buy foods in preportioned servings such as a 1-ounce sliced cheese or snack and 100-calorie microwave popcorn.

© 2017 Pearson Education, Inc.
ABC News Video: Experiment Shows
Portion Control is the Key to Healthy Eating

© 2017 Pearson Education, Inc.
Does the Time of Day You Eat Impact Your
Health?
• Eating breakfast means more energy and fewer
calories throughout the day
• Eating more during evenings and weekends can
lead to overconsumption of calories
• Recommendations:
• Start your day with nutrient-rich breakfast
• Choose breakfast foods that are satisfying
and improve appetite control throughout the
day
• Control calorie intake on nights and
weekends

© 2017 Pearson Education, Inc.
Does the Time of Day You Eat Impact Your
Health?, Continued

© 2017 Pearson Education, Inc.
ABC News Video: Fast-Paced Movies,
Television Shows May Lead to More
Snacking

© 2017 Pearson Education, Inc.
What Is a Food Label and Why Is It
Important?
• The food label tells you what's in the package
• To help consumers make informed food choices
• Food and Drug Administration (FDA) mandates
that every packaged food be labeled with:
• Name of the food
• Net weight
• Name and address of manufacturer or
distributor
• List of ingredients in descending order by
weight
• Nutrition facts panel

© 2017 Pearson Education, Inc.
What Is a Food Label and Why Is It
Important?, Continued
• The label must also contain:
• Serving sizes that are uniform among similar products
• How a serving of food fits into an overall daily diet
• Uniform definitions for descriptive labels terms such as
"fat-free" and "light"
• Health claims that are accurate and science-based
• Presence of any of the eight common allergens
• Foods exempt from nutrition labeling:
• Plain coffee/tea, spices, flavorings, bakery foods, ready-
to-eat foods prepared and sold in restaurants or
produced by small businesses

© 2017 Pearson Education, Inc.
Reading Labels

© 2017 Pearson Education, Inc.
Practical Nutrition Tips Video: Food Label
Nutrition Tip

© 2017 Pearson Education, Inc.
What Is a Food Label and Why Is It
Important?, Continued-1
• The food label can help you make healthy food choices
• Nutrition Facts panel: area on food label that provides
uniform listing of specific nutrients obtained in one
serving
• Calories and calories from fat
• Total fat, saturated fat, and trans fat
• Cholesterol
• Sodium
• Total carbohydrate, dietary fiber, and sugars
• Protein
• Vitamin A, vitamin C, calcium, and iron

© 2017 Pearson Education, Inc.
The Food Label Provides Valuable
Consumer Information
Figure 2.11

© 2017 Pearson Education, Inc.
Understanding the Nutrition Facts Panel and
Proposed New Changes
Figure 2.12

© 2017 Pearson Education, Inc.
ABC News Video: Changes Coming to
Nutrition Labels

© 2017 Pearson Education, Inc.
What Is a Food Label and Why Is It
Important?, Continued-2
• Daily Values (DVs): established reference
levels of nutrients, based on 2,000-calorie diet,
listed on the food label
• Given as percentages
• Based on older reference levels; not as
current as DRIs
• There are no DVs listed on the label for trans fat,
sugars, and protein

© 2017 Pearson Education, Inc.
What Is a Food Label and Why Is It
Important?, Continued-3
• Three types of label claims:
• Nutrient content claims: describe the level
or amount of a nutrient in food product
• Health claims: describe a relationship
between a food or dietary compound and a
disease or health-related condition
• Structure/function claims: describe how a
nutrient or dietary compound affects the
structure or function of the human body

© 2017 Pearson Education, Inc.
Practical Nutrition Tips Video:
Understanding Food Claims

© 2017 Pearson Education, Inc.
Soup's On!
Figure 2.13

© 2017 Pearson Education, Inc.
Table 2.6
What Does That Labeling Term Mean?Table 2.6 What Does That Labeling Term Mean?
Nutrient Free Low Reduced/Less Light
Calories < 5 calories (cal) per
Serving
≤ 40 cal per serving At least 25 percent fewer
calories per serving
If the food contains
50 percent or more of its
calories from fat, then the
fat must be reduced
Fat < 0.5 grams (g) per
Serving
≤ 3 g per serving At least 25 percent less fat
per serving
Same as above
Saturated Fat < 0.5 g per serving ≤ 1 g per serving At least 25 percent less
saturated fat per serving
N/A
Cholesterol < 2 milligrams (mg) per
Serving
≤ 20 mg per serving At least 25 percent less
cholesterol per serving
N/A
Sodium < 5 mg per serving <140 mg per serving At least 25 percent less
sodium per serving
If the sodium is reduced
by at least 50 percent per
serving
Sugars < 0.5 g N/A At least 25 percent less
sugar per serving
N/A
Note: N/A = not applicable
Source: Data from U.S. Food and Drug Administration, “Guidance for Industry: A Food Labeling Guide. “Revised
January 2013. Available at www.fda.gov. Accessed April 2015.

© 2017 Pearson Education, Inc.
Table 2.6
What Does That Labeling Term Mean?,
ContinuedTable 2.6
Other Labeling Terms
Term Definition
“High,” “Rich in,” or
“Excellent source of”
The food contains 20 percent or more of
the DV of the nutrient in a serving. Can be
used to describe protein, vitamins,
minerals, fiber, or potassium
“Good source of” A serving of the food provides 10–19 percent
of the DV. Can be used to describe meals
or main dishes.
“More,” “Added,”
“Extra,” or “Plus”
A serving of the food provides 10 percent of
the DV. Can only be used to describe vitamins, minerals, protein, fiber, and potassium.
“Lean” Can be used on seafood and meat that contains less than 10 g of fat, 4.5 g or less of
saturated fat, and less than 95 mg of cholesterol per serving.
“Extra lean” Can be used on seafood and meat that contains less than 5 g of fat, less than 2 g of
saturated fat, and less than 95 mg of cholesterol per serving.
Note: N/A = not applicable
Source: Data from U. S. Food and Drug Administration, “ Guidance for Industry: A Food Labeling Guide. “ Revised
January 2013. Available at www.fda.gov. Accessed April 2015.
© 2017 Pearson Education, Inc.
Table 2.7
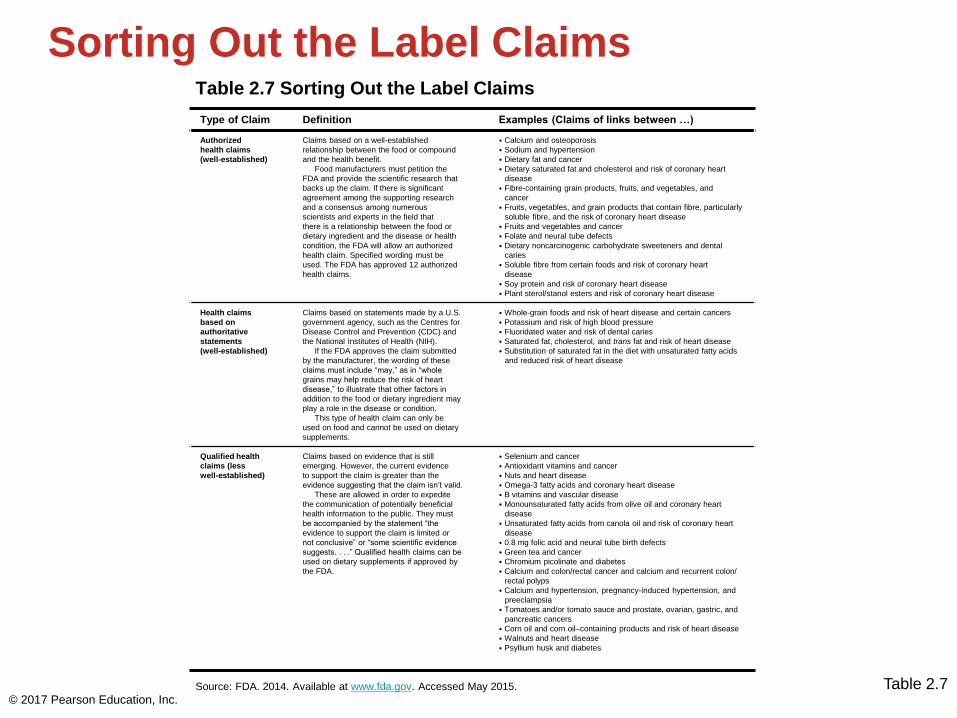
Sorting Out the Label ClaimsTable 2.7 Sorting Out the Label Claims
Type of Claim Definition Examples (Claims of links between …)
Authorized
health claims
(well-established)
Claims based on a well-established
relationship between the food or compound
and the health benefit.
Food manufacturers must petition the
FDA and provide the scientific research that
backs up the claim. If there is significant
agreement among the supporting research
and a consensus among numerous
scientists and experts in the field that
there is a relationship between the food or
dietary ingredient and the disease or health
condition, the FDA will allow an authorized
health claim. Specified wording must be
used. The FDA has approved 12 authorized
health claims.
⦁ Calcium and osteoporosis
⦁ Sodium and hypertension
⦁ Dietary fat and cancer
⦁ Dietary saturated fat and cholesterol and risk of coronary heart
disease
⦁ Fibre-containing grain products, fruits, and vegetables, and
cancer
⦁ Fruits, vegetables, and grain products that contain fibre, particularly
soluble fibre, and the risk of coronary heart disease
⦁ Fruits and vegetables and cancer
⦁ Folate and neural tube defects
⦁ Dietary noncarcinogenic carbohydrate sweeteners and dental
caries
⦁ Soluble fibre from certain foods and risk of coronary heart
disease
⦁ Soy protein and risk of coronary heart disease
⦁ Plant sterol/stanol esters and risk of coronary heart disease
Health claims
based on
authoritative
statements
(well-established)
Claims based on statements made by a U.S.
government agency, such as the Centres for
Disease Control and Prevention (CDC) and
the National Institutes of Health (NIH).
If the FDA approves the claim submitted
by the manufacturer, the wording of these
claims must include “may,” as in “whole
grains may help reduce the risk of heart
disease,” to illustrate that other factors in
addition to the food or dietary ingredient may
play a role in the disease or condition.
This type of health claim can only be
used on food and cannot be used on dietary
supplements.
⦁ Whole-grain foods and risk of heart disease and certain cancers
⦁ Potassium and risk of high blood pressure
⦁ Fluoridated water and risk of dental caries
⦁ Saturated fat, cholesterol, and trans fat and risk of heart disease
⦁ Substitution of saturated fat in the diet with unsaturated fatty acids
and reduced risk of heart disease
Qualified health
claims (less
well-established)
Claims based on evidence that is still
emerging. However, the current evidence
to support the claim is greater than the
evidence suggesting that the claim isn’t valid.
These are allowed in order to expedite
the communication of potentially beneficial
health information to the public. They must
be accompanied by the statement “the
evidence to support the claim is limited or
not conclusive” or “some scientific evidence
suggests. . . .” Qualified health claims can be
used on dietary supplements if approved by
the FDA.
⦁ Selenium and cancer
⦁ Antioxidant vitamins and cancer
⦁ Nuts and heart disease
⦁ Omega-3 fatty acids and coronary heart disease
⦁ B vitamins and vascular disease
⦁ Monounsaturated fatty acids from olive oil and coronary heart
disease
⦁ Unsaturated fatty acids from canola oil and risk of coronary heart
disease
⦁ 0.8 mg folic acid and neural tube birth defects
⦁ Green tea and cancer
⦁ Chromium picolinate and diabetes
⦁ Calcium and colon/rectal cancer and calcium and recurrent colon/
rectal polyps
⦁ Calcium and hypertension, pregnancy-induced hypertension, and
preeclampsia
⦁ Tomatoes and/or tomato sauce and prostate, ovarian, gastric, and
pancreatic cancers
⦁ Corn oil and corn oil–containing products and risk of heart disease
⦁ Walnuts and heart disease
⦁ Psyllium husk and diabetes
Source: FDA. 2014. Available at www.fda.gov. Accessed May 2015.

© 2017 Pearson Education, Inc.
A Structure/Function Label Claim
Figure 2.14

© 2017 Pearson Education, Inc.
Table 2.8
A Summary of Tools for Healthy EatingTable 2.8 A Summary of Tools for Healthy Eating
DRIs
Dietary Guidelines
for Americans MyPlate
Nutrition
Facts Panel Label Claims
What Are
They?
Specific reference
values, for each
nutrient by age and
gender
Reflect the most current
nutrition and physical
activity recommendations
for good health
A representational
icon that depicts five
food groups using
the familiar mealtime
visual of a place
setting
Contains important
nutrition information
to be used to
compare food
products
There are three types of
claims:
1. Nutrient content
claims
2. Health claims
3. Structure/function
claims
How Do
They Guide
You in
Healthy
Eating?
DRIs provide
recommendations to
prevent malnutrition
and chronic diseases
for each nutrient.
The upper level is
designed to prevent
overnutrition or
toxicity.
The Dietary Guidelines
emphasize healthy food
choices, maintaining
healthy weight, and
physical activity.
Guidelines for types of
foods, moderate alcohol
intake, and food safety
are also included.
MyPlate is the
focal point for
the Web-based
ChooseMyPlate.
gov initiative, which
provides information
to build a healthy
diet based on the
Dietary Guidelines for
Americans.
You can use the
Nutrition Facts panel
to compare the
nutrient density of
foods.
You can use these label
terms to help you choose
foods that may contain
a specific amount of a
nutrient or compound to
improve your diet.
What Are
They Made
Up Of?
EARs, RDAs, AIs,
ULs, and AMDRs
The recommendations
are guided by two
overarching concepts:
1. Maintain calorie bal-
ance over time to
achieve and sustain a
healthy weight.
2. Consume more
nutrient-rich foods and
beverages.
Recommendations
are made for physical
activity as well as five
food groups,
plus oils:
1. Vegetables
2. Fruits
3. Grains
4. Protein
5. Dairy
6. Oils
Information is
presented about:
1. Serving size
2. Servings per
package
3. Total calories and
calories from fat
4. Macronutrients
5. Vitamins and
minerals
6. % Daily Values
1. Nutrient content
claims describe the
level or amount of
a nutrient in a food
product.
2. Health claims
describe a relationship
between a food or
dietary compound and
a disease or health-
related condition.
3. Structure/function
claims describe how
a nutrient or dietary
compound affects the
structure or function
of the body.

© 2017 Pearson Education, Inc.
Functional Foods: What Role Do They Play
in Your Diet?
• Functional foods: have a positive effect on
health beyond providing basic nutrients
• Example: broccoli contains beta-carotene, a
phytochemical that protects cells from
damaging substances that increase risk of
chronic diseases (heart disease, cancer)
• Zoochemicals: compounds in animal food
products that benefit health
• Example: omega-3 fatty acids in fatty fish
• Manufacturers also fortify food products with
phyto- or zoochemicals

© 2017 Pearson Education, Inc.
Functional Foods: What Role Do They Play
in Your Diet?, Continued
• Americans spend more than $15 billion each
year on functional foods
• Benefits of functional foods:
• Economical way for health professionals to
treat chronic disease
• Example: cholesterol-lowering oats and/or plant
sterols may be preferable to drugs

© 2017 Pearson Education, Inc.
Functional Foods: What Role Do They Play
in Your Diet?, Continued-1
• Concerns with functional foods:
• Confusion over claims
• Excess consumption may cause problems
• How to use functional foods:
• Consume naturally occurring phytochemicals
and zoochemicals
• Don't overconsume packaged functional
foods
• Get advice from a registered dietitian
nutritionist (RDN)

© 2017 Pearson Education, Inc.
Table 2.9
Functional Foods: What Role Do They Play
in Your Diet?, Continued-2
Table 2.9
Your Guide to Functional FoodsThis Compound Found in This/These Functional Food(s) May Have This Health Benefit
Beta-carotene Carrots, pumpkin, cantaloupe, broccoli Functions as an antioxidant in the body
Lycopene Tomatoes, tomato sauce May lower risk of prostate cancer
Soy protein Tofu, soy milk Lowers risk of heart disease
Beta-glucan Oatmeal, oats, oat bran Lowers blood cholesterol
Plant sterol and stanol esters Fortified margarines, like Benecol spreads Lowers blood cholesterol
Omega-3 fatty acids Salmon, sardines, tuna May reduce the risk of heart disease
Whole grains Whole-wheat bread,
brown rice, popcorn
May reduce the risk of some cancers and heart
disease
Flavanols Dark chocolate,
green apples
May contribute to heart health
Anthocyanins Berries, red grapes,
cherries
Act as antioxidants, may contribute to brain
function
Probiotics Active cultures in fermented dairy products such
as yogurt
Support intestinal health
Source: Based on IFIC, ”International Food Information Council (IFIC) Foundation Functional Foods Component Chart.” Accessed May 2015.

© 2017 Pearson Education, Inc.
ABC News Video: Coconut: How Healthy is
the Superfood?