chapter 22: lean tools and methods …hercherpublishing.com/esw/files/chapter_22_gool_4e...(4)...
TRANSCRIPT
1
CHAPTER 22: LEAN TOOLS AND METHODS SECTIONS Introduction 5S Method Total Productive Maintenance (TPM) Quick Changeovers (SMED) Mistake Proofing Methods (Poka-Yoke Devices) Summary References CHAPTER OBJECTIVES
Show how the 5S method can be used to create a neat and tidy workplace,
Show how TPM (Total Productive Maintenance) methods and techniques can decrease waste, reduce costs, decrease batch sizes, increase production velocity, and increase quality,
Show how SMED (Single Minute Exchange of Dies) methods can be used to reduce changeover times for machines, equipment, and employees to less than 10 minutes per changeover, and
Show how Mistake Proofing (Poke-Yoke in Japanese) methods can be used to eliminate error and mistakes.
INTRODUCTION
Many processes contain waste. It is important to understand the current process to be able to effectively eliminate waste from it. Team members eliminate waste through Lean thinking to create a more efficient and effective process. In practice, “Lean Management” reduces the lead time and the resources (waste) required between the delivery of a service or product and the start time of the process which requires the delivery. Waste can exist in almost any area of an organization. The following list shows common areas in which waste is found in an organization:
Supplier relations,
Plant or facility layout,
Procedures for setting up machines,
Procedures for maintaining equipment,
Training programs,
Inspection protocols,
Measurement systems, and
Work environment, too name few examples of waste. Lean management promotes decreased cycle times, reduced complexity of processes, and lower costs through the elimination of waste (non-value added steps in a process).

2
The aim of this chapter is to lay the groundwork for appreciation of some of the major tools and methods of Lean Management. These tools and methods include:
(1) 5S method, (2) Total Productive Maintenance (TPM), (3) Quick Changeover Techniques (SMED), and (4) Mistake Proofing (Poke-Yoke) devices.
The above tools and methods are used to make the future-state value stream map a reality by: (1) using the 5S method to create a neat and tidy workplace, (2) using TPM to decrease waste, reduce costs, decrease batch sizes, increase production velocity, and increase quality, (3) using quick changeover techniques to drastically reduce the setup time for work stations, and (4) using mistake proofing techniques to create processes that are robust against mistakes and errors. It is important to realize that not all lean tools work on the first attempt. Sometimes, a tool must be tried a couple of times before the user begins to understand how to apply it to a particular situation.
THE “5S” METHODS
INTRODUCTION Team members can reduce waste through promoting housekeeping and reducing complexity. The promotion of housekeeping and the reduction of complexity is a three-step process. The first step is called the 5S method (Gitlow, 2009). It is the mundane, but critical, process of: (1) eliminating unnecessary “things” in the workplace so you can see necessary “things” (for example, get rid of old files, broken copiers, etc.), (2) organizing necessary “things” in the workplace so they can be easily found (for example, place needed files, office suppliers, etc. in their proper place), (3) cleaning and maintaining the necessary “things” in the workplace (for example, wiping away dirt on computer screens, oiling motors, etc.), (4) making a habit of doing the above 3 activities the last 5 minutes of every day, and (5) spreading housekeeping using the 5S methods throughout the organization. The second step is using the SDSA cycle to standardizing a process so that all of the processes’ stakeholders know what to expect from the process; that is, they all view the process as the same flowchart. The third step is to reduce the complexity of the process. Complexity is frequently caused by over reactions to random noise in the work place; that is, treating common causes of variation like special causes of variation. For example, if one employee brings a firearm to work in a 20 year period, requiring all employees to go through a metal detector might add unnecessary complexity to the “going to work” process.
STEP 1: THE 5S METHODS
3
The first step in housekeeping is frequently accomplished using the “5S” method. The 5S method is a simple technique for highlighting and eliminating waste, inconsistency, and unreasonableness from the workplace. Table 22.1 briefly describes each of the 5Ss, followed by detailed explanations.
Table 22.1: Description of the 5Ss
5Ss* Rough Translation Description
Seiri Sort Eliminate unnecessary things (or put them away) and make necessary things visible.
Seiton Order Order essential things so that they can be quickly and easily accessed and put away.
Seiso Clean Clean machines, equipment, and the work environment.
Seiketsu Standardize Develop “best practices” to make the above 3Ss habits.
Shitsuke Self-discipline Get everyone to use the above 4Ss in work every day.
*NOTE: The 5Ss are all named using Japanese words.
Seiri (Sort). Seiri means organizing “things” using specific rules, or putting “things” in order so that everyone can find them. Once an employee has internalized the rules to organize “things,” he or she will quickly be able to find them. For example, an artist’s studio might group paints by type or color. The rule used to group things will best help the artist find the specific paints needed for a particular project. Seiri is not just about organizing. It is also about throwing away unnecessary items, or at least removing them to a place where you can find them when needed. Putting away those things you are not going to use today also means that the ones you are going to use today become more visible and easier to find. In order for Seiri to work, it is important for people to take personal responsibility for organizing their workplace. Seiri requires that team members define the difference between needed items and wanted items; a needed item is an item that has been used within the last year, while a wanted item is an item that has not been used in the past year. Please note that items necessary for legal requirements should be considered needed items. Team members use table 22.2 to classify each “thing” in the workplace as a wanted item or a needed item. It further sub-classifies needed items into useful categories for actions to be discussed later in this book.

4
Table 22.2: Needs/Wants Analysis for All Items in a Workplace Item Needed Regularly Needed Irregularly Wanted
(needed Less Frequently than Yearly)
Not Wanted Needed
Daily Needed Weekly
Needed Monthly
Needed Quarterly
Needed Semi-annually
Needed Yearly
One method for classifying things in a work area into the categories shown in table 22.2 is called the “red tag” strategy. First, team members red tag and remove from the workplace all things that are obviously “not wanted.” The unwanted items are then thrown away or sold. Removal of “not wanted” things makes it easier to see all remaining “wanted” and “needed” things.” Second, team members red tag all “wanted” and “needed irregularly” things using the classifications in table 22.2. These red tagged items are thrown away, sold, or put into remote storage. A list of “needed irregularly” materials or items to be subjected to the red tagging method is shown in table 22.3. It is important to never red tag people, not even as a joke!
Table 22.3: Taxonomy for Red Tagging Things Categories Sub-categories Selected examples of “things” in subcategories
Offices
Documents Memos, e-mails, reports, contracts, estimates, policies
Equipment Faxes, phones, computers, printers
Supplies Desks, chairs, shelves, file cabinets, storage boxes
Stationery Pens, Pencils, Scissors, Tape
Other Reference books, forms, trade magazines
Work Areas
Inventory Raw materials, WIP, component parts, finished items
Equipment Machines, work desks and chairs, tools, jigs, bits
Space Operations areas, rest areas, walkways
Red-tagging promotes the principle of using “only what is needed, in the amounts needed, and only when needed.” Table 22.4 provides a structure for red-tagging the things in a work area.
Table 22.4: Disposition Rules in a Work Area Frequency of Use Description Organization Method
Not wanted things (1) Defective materials and items (2) Things not wanted in your workplace or any other workplace in your organization
Discard or sell
Wanted (but not needed) things
Things used less than once per year (1) Things are transferred to a workplace in your organization that needs them (2) Store in a remote location (3) Discard or sell (may require management approval)
Needed Things
Irregularly
Things used yearly Store in a remote location
Things used semi-annually (1) Store in a remote location (2) Store near process where used
Things used quarterly (1) Store in a remote location (2) Store near process where used
Regularly
Things used every month Store near process where used
Things used every week Store near process where used
Things used every day Store in operation where used
5
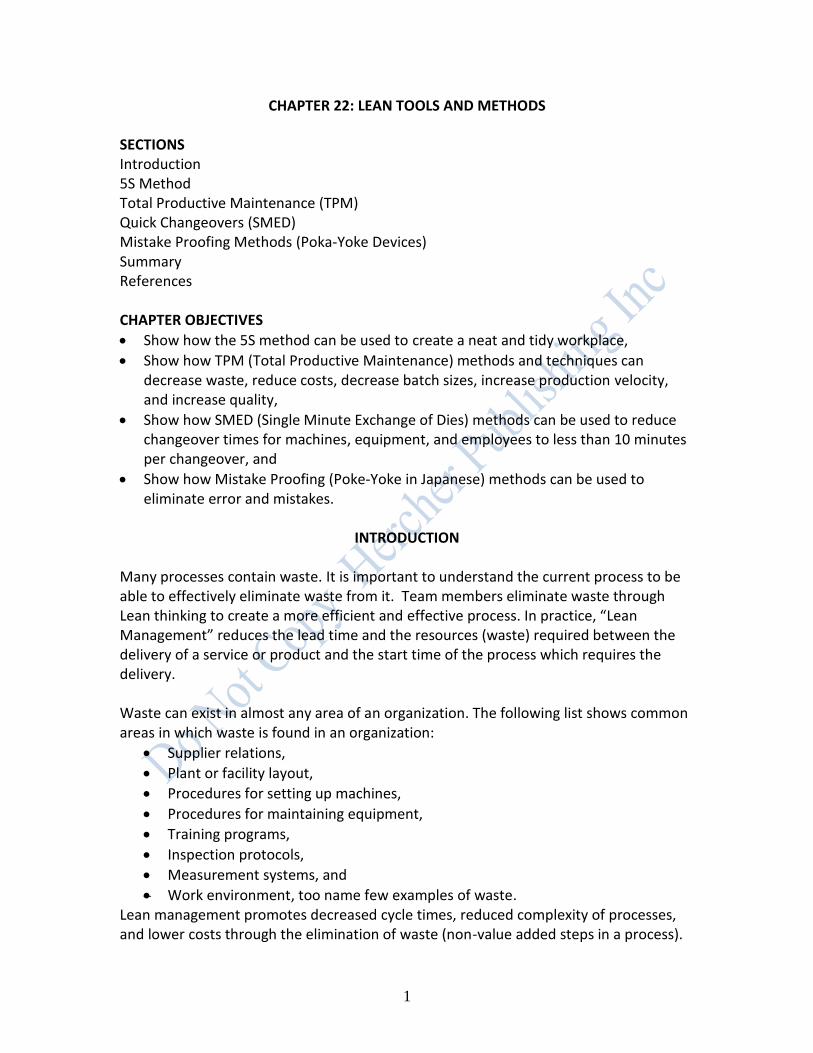
Team members use Table 22.4 to determine the disposition of the things listed in Table 22.3. Figure 22.1 is a photograph of a shelf unit in a work area that has experienced a red tagging session.
Figure 22.1: Red Tags
Source: http://www.gemba.com/uploadedImages/red%20tagging%20is%20the%20first%20step(1).JPG
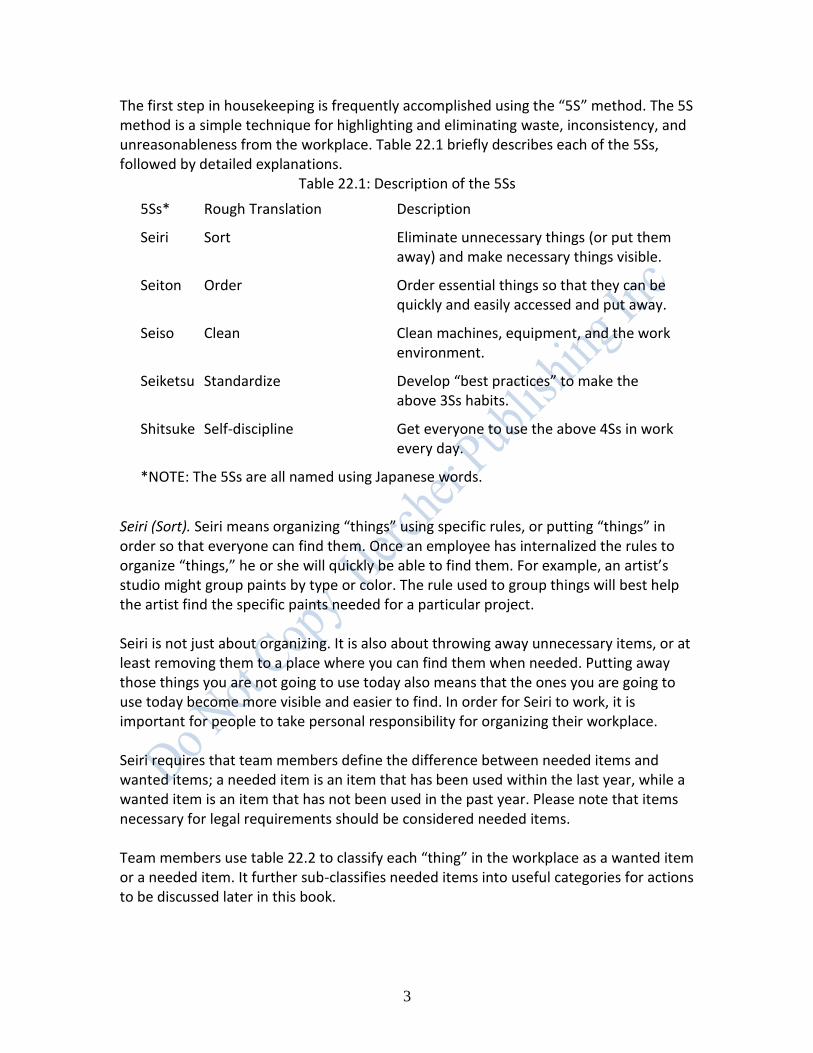
Figure 22.2 shows before and after photographs for 3 work areas in a plastic cup manufacturing process.
Figure 22.2: Before and After Red Tagging Before
After
`

6
Seiton (Order). Seiton means tidily placing “things” in their proper places so anyone can access or put away the item. Individuals must follow 5 rules to put items away:
1. Decide who should put things away. 2. Decide what things should be put away. 3. Decide where things should be put away. 4. Determine when things should be put away. 5. Determine how things should be put away, that is, the layout of things to be put
away. Never attempt to use Seiton (order) without having first used Seiri (sort). The above 5 rules are used to create orderliness for at least 3 categories of “things”:
1. Spaces such as walls, shelves, floors, walkways, and storage areas. 2. Materials and items such as raw materials, component parts, parts to be
machined, in-process inventory, work in process, and finished products. 3. Equipment such as machines, tools, jigs, dies, bits, gauges, carts, conveyance
devices, tables, chairs, and cabinets. Orderliness can be promoted in all 3 of the above categories by using:
(1) Layouts of the workplace, (2) Marks and signs, and (3) Inventory management system.
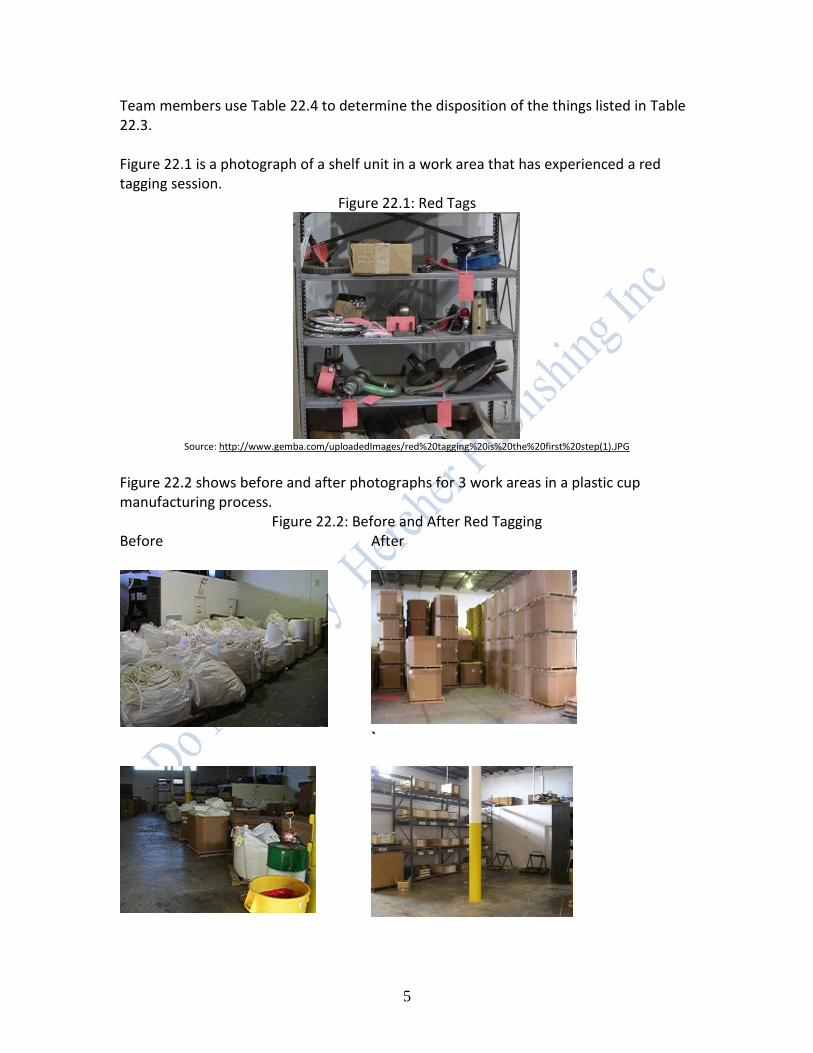
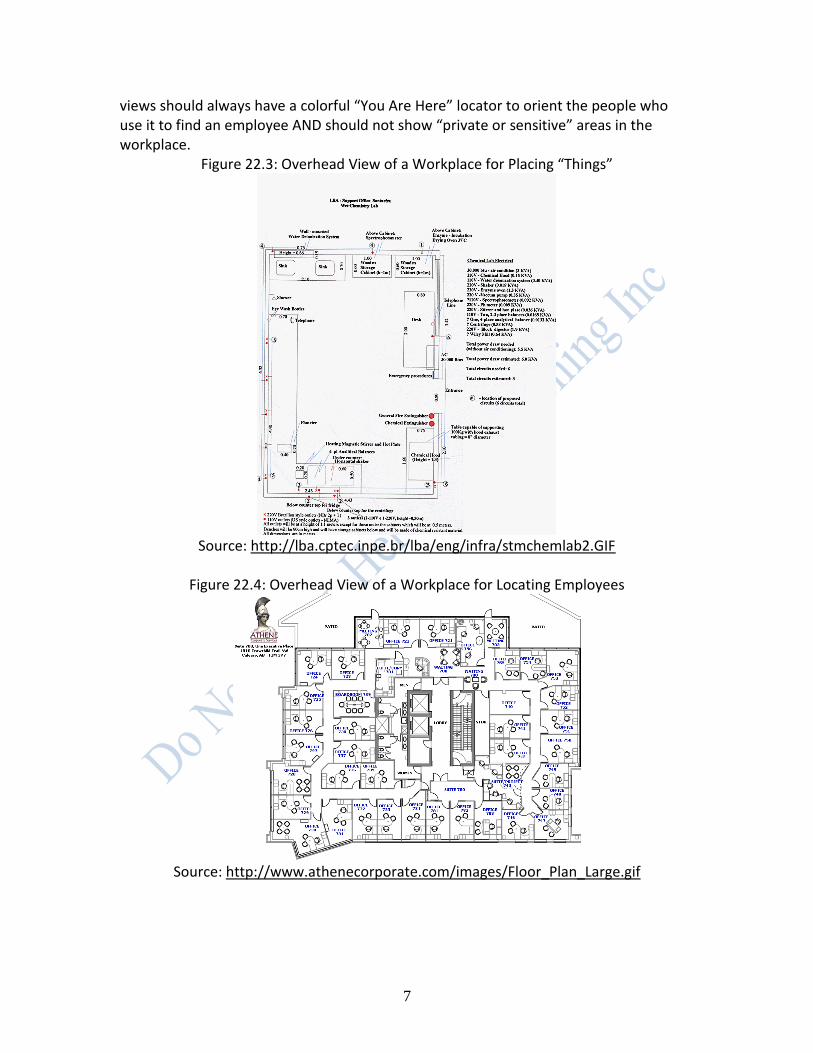
Layouts of the workplace provide an overview for team members and employees to determine where “things” should be kept in the workplace. Marks and signs on walls and floors indicate walkways, working areas, storage areas, special use areas, and so on. An inventory system minimizes the cost of inventory in a work area. Layouts of the Work Area. There are two types of layouts that can be used to promote orderliness (Grout and Downs, pp. 25-33) overhead views and frontal views. Overhead views give team members and employees a sense of what “things” can be stored in which locations (see figure 22.3), as well as who sits in which locations (see figure 22.4). The ultimate goal of overhead views is allowing a visitor to find an employee in the workplace without asking anyone for directions. This application is extremely valuable in workplaces that service customers. Please note that overhead
7
views should always have a colorful “You Are Here” locator to orient the people who use it to find an employee AND should not show “private or sensitive” areas in the workplace.
Figure 22.3: Overhead View of a Workplace for Placing “Things”
Source: http://lba.cptec.inpe.br/lba/eng/infra/stmchemlab2.GIF
Figure 22.4: Overhead View of a Workplace for Locating Employees
Source: http://www.athenecorporate.com/images/Floor_Plan_Large.gif

8
Frontal views of a section of a workplace, such as a desk or file cabinet, indicate where “things” are stored for quick retrieval by employees (see Figure 22.5). A good “rule of thumb” is that all documents should be retrievable in 30 seconds or less by employees.
Figure 22.5: Frontal View of a File Cabinet
Drawer 1 Customer Complaints
(1/1/05-12/31/05)
Drawer 2 Customer Complaints
(1/1/06-12/31/06)
Drawer 3 Customer Complaints
(1/1/07-12/31/07)
Marks and Signs. There are two important “mark and sign” methods that promote orderliness: (1) the painting strategy and (2) the sign board strategy. Both strategies are discussed below. The “painting strategy” involves painting different colored marks and signs on floors and walls to indicate work areas, hazardous areas, rest areas, fork-lift pathways, walkways, and so on. One possible painting strategy for creating orderliness on floors is shown in Table 22.5. Other examples of painting strategies are shown in figures 22.6, 22.7 and 22.8.
Table 22.5: Painting Method for Promoting Orderliness Category Subcategory Color
Paint floors within a work area to indicate the function of a subcategory
Work area Green
Rest area Blue
Walkway Orange
Paint lines on the floor within a work area to indicate the function of a sub-category
Opening and closing radius of a door Yellow broken line
Direction Arrows Yellow arrows
Place marker for WIP White solid line
Place marker for operations Corner white lines
Place marker for defective things Solid red line
Place lines over dangerous areas (e.g., wires over a walkway or a hot motor)
Yellow and Black Tiger Stripe line
Paint lines on the floor between work areas to indicate the separation of the function of a subcategory
Work area boundary Solid yellow line
Entrance and exit to a work area Broken yellow line
Figure 22.6: Warehouse View 1

9
Source: http://prestige.psu.edu/Nomads2004/LeedsAssignments/5S2.JPG
Figure 22.7: Warehouse View 2
Source: http://www.astrooptics.com/assets/images/floor_marking_sm.gif
Figure 22.8: Warehouse View 3
Source: http://www.tmicoatings.com/images/IMG_0537.jpg
One final painting strategy for equipment analyzes how equipment is used to develop “set-up and put-away” rules. Set-up and put-away rules pay particular attention to when and how the “things” are picked up and used, which is a primary driver of how

10
and where they are put away. If something is used 50 times a day, then this multiplies the time wasted in finding the item and taking it to where it needs to be used. Labels and names should be standardized. Write labels and other signs clearly so it can be read at an appropriate distance. Ensure the naming label cannot get lost. Make the item and the storage location match, such as by writing the same name on the item and the storage location. The tool board, as in Figure 22.9, provides a mechanism to store tools by painting their outline on the peg board.
Figure 22.9: Storage Board Using Seiton
Source: http://www.tpslean.com/images/5s1.jpg
The “sign board” strategy involves the proper placement of inventory and machines in easily identifiable work areas. The sign board strategy works hand in hand with the painting strategy. Table 22.6 shows the structure of a sign board strategy.
Table 22.6: Structure for a Sign Board Strategy Categories Strategy Method
Work Areas Location of work areas Overhead (Hanging) sign indicating work area
Machines Location of machine indicator
Overhead sign indicating machine X in work area Y
On-machine sign indicating work area, machine name, operator
Inventory Location of inventory Overhead sign indicating inventory Z in work area Y
Shelf sign indicating inventory Z in work area Y on shelf A
Identification of inventory Sign on inventory item Z with shelf A in work area Y
Placement lines or colors on shelf A for inventory Z in work area Y
Quantity of inventory Lines or colors on shelf A for inventory Z in work area Y that indicates maximum and minimum stacking heights
Figures 22.10, 22.11 and 22.12 are examples of a signboard strategy utilized in a particular work area.

11
Figure 22.10: Signboard for a Work Area
Source:
http://search.aol.com/aol/imageDetails?invocationType=imageDetails&query=%22overhead+sign%22+and+office&img=http%3A%2F%2Fwww.med.umich.edu%2Fmott%2Fimages%2Ftours%2Fmottf4_9.gif&site=&host=http%3A%2F%2Fwww.med.umich.edu%2Fmo
tt%2Fpvguide%2Fexpect_tourf4.html&width=96&height=72&thumbUrl=http%3A%2F%2Fimages-partners-tbn.google.com%2Fimages%3Fq%3Dtbn%3AowOUUeyJBOTcPM%3Awww.med.umich.edu%2Fmott%2Fimages%2Ftours%2Fmottf4_9.gif&b=image%3Fquery%3D%2522overhead%2Bsign%2522%2Band%2Boffice%26page%3D3%26invocationType%3D.image%26click
streamid%3D6364990757223739507
Figure 22.11: Signboard for a Machine
Ceiling Over Machine
Machine Name
Process Name
Employee Acquisition Date
Machine Under Overhead Signboard
Machine Name
Process Name Employee Acquisition Date
12
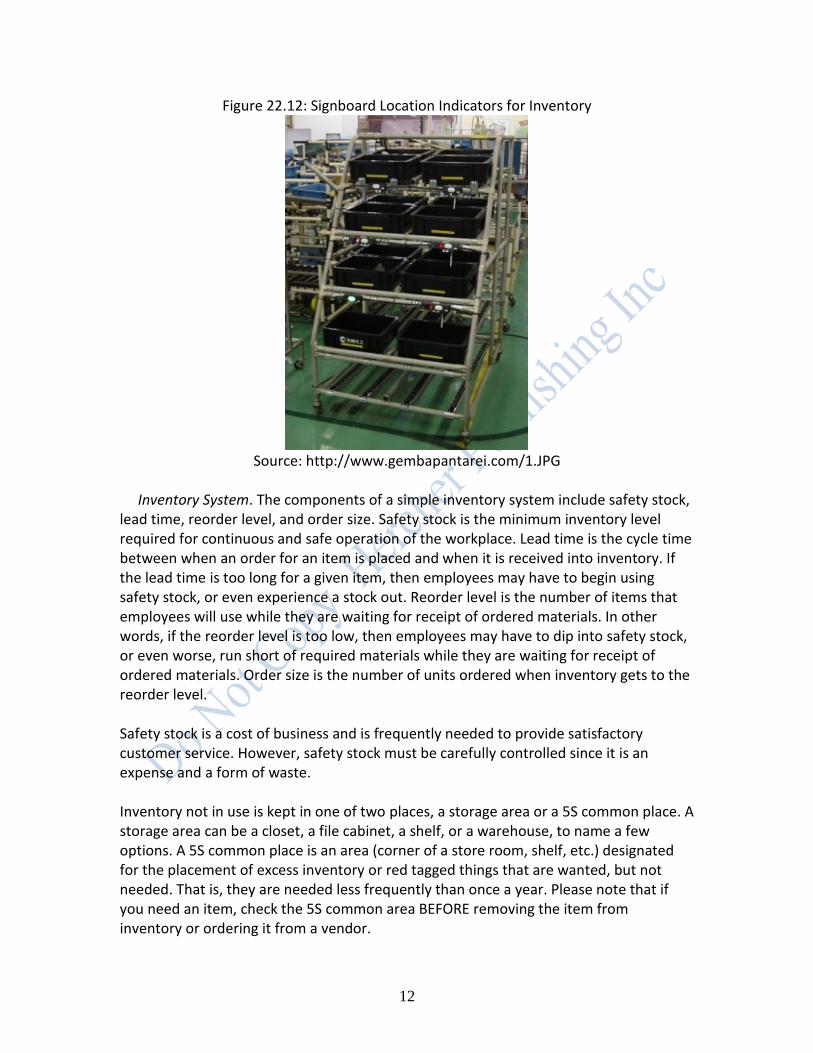
Figure 22.12: Signboard Location Indicators for Inventory
Source: http://www.gembapantarei.com/1.JPG
Inventory System. The components of a simple inventory system include safety stock, lead time, reorder level, and order size. Safety stock is the minimum inventory level required for continuous and safe operation of the workplace. Lead time is the cycle time between when an order for an item is placed and when it is received into inventory. If the lead time is too long for a given item, then employees may have to begin using safety stock, or even experience a stock out. Reorder level is the number of items that employees will use while they are waiting for receipt of ordered materials. In other words, if the reorder level is too low, then employees may have to dip into safety stock, or even worse, run short of required materials while they are waiting for receipt of ordered materials. Order size is the number of units ordered when inventory gets to the reorder level. Safety stock is a cost of business and is frequently needed to provide satisfactory customer service. However, safety stock must be carefully controlled since it is an expense and a form of waste. Inventory not in use is kept in one of two places, a storage area or a 5S common place. A storage area can be a closet, a file cabinet, a shelf, or a warehouse, to name a few options. A 5S common place is an area (corner of a store room, shelf, etc.) designated for the placement of excess inventory or red tagged things that are wanted, but not needed. That is, they are needed less frequently than once a year. Please note that if you need an item, check the 5S common area BEFORE removing the item from inventory or ordering it from a vendor.
13
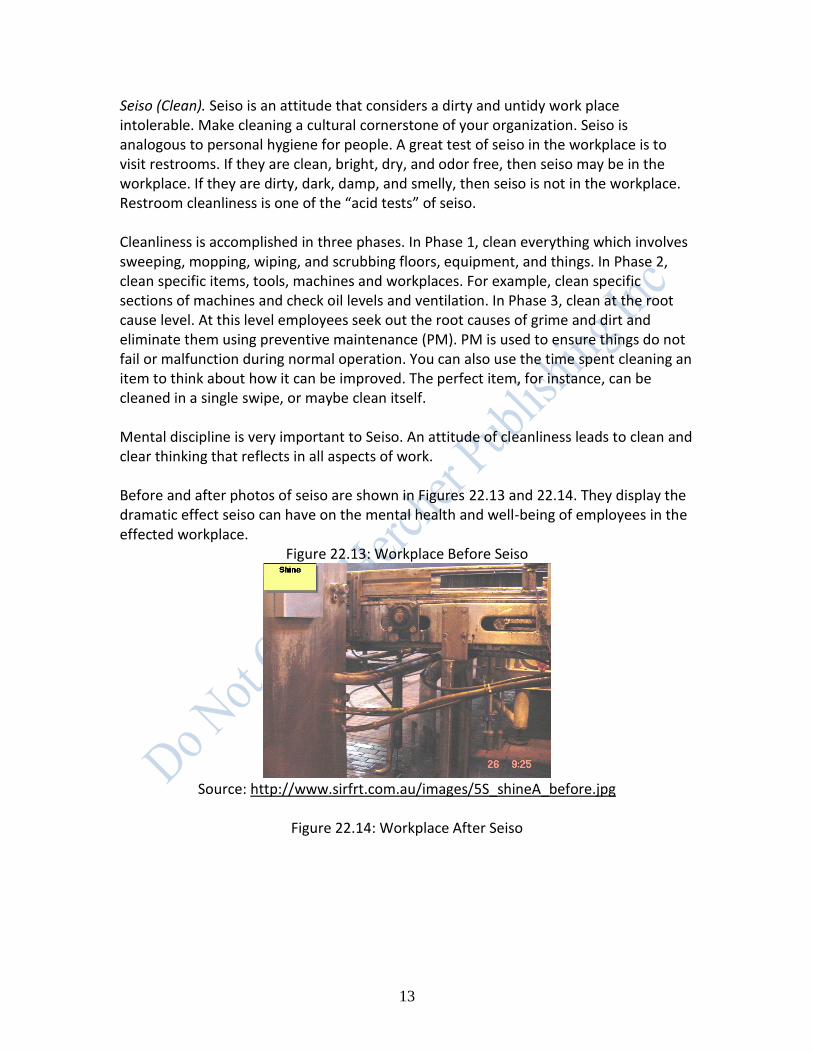
Seiso (Clean). Seiso is an attitude that considers a dirty and untidy work place intolerable. Make cleaning a cultural cornerstone of your organization. Seiso is analogous to personal hygiene for people. A great test of seiso in the workplace is to visit restrooms. If they are clean, bright, dry, and odor free, then seiso may be in the workplace. If they are dirty, dark, damp, and smelly, then seiso is not in the workplace. Restroom cleanliness is one of the “acid tests” of seiso. Cleanliness is accomplished in three phases. In Phase 1, clean everything which involves sweeping, mopping, wiping, and scrubbing floors, equipment, and things. In Phase 2, clean specific items, tools, machines and workplaces. For example, clean specific sections of machines and check oil levels and ventilation. In Phase 3, clean at the root cause level. At this level employees seek out the root causes of grime and dirt and eliminate them using preventive maintenance (PM). PM is used to ensure things do not fail or malfunction during normal operation. You can also use the time spent cleaning an item to think about how it can be improved. The perfect item, for instance, can be cleaned in a single swipe, or maybe clean itself. Mental discipline is very important to Seiso. An attitude of cleanliness leads to clean and clear thinking that reflects in all aspects of work.
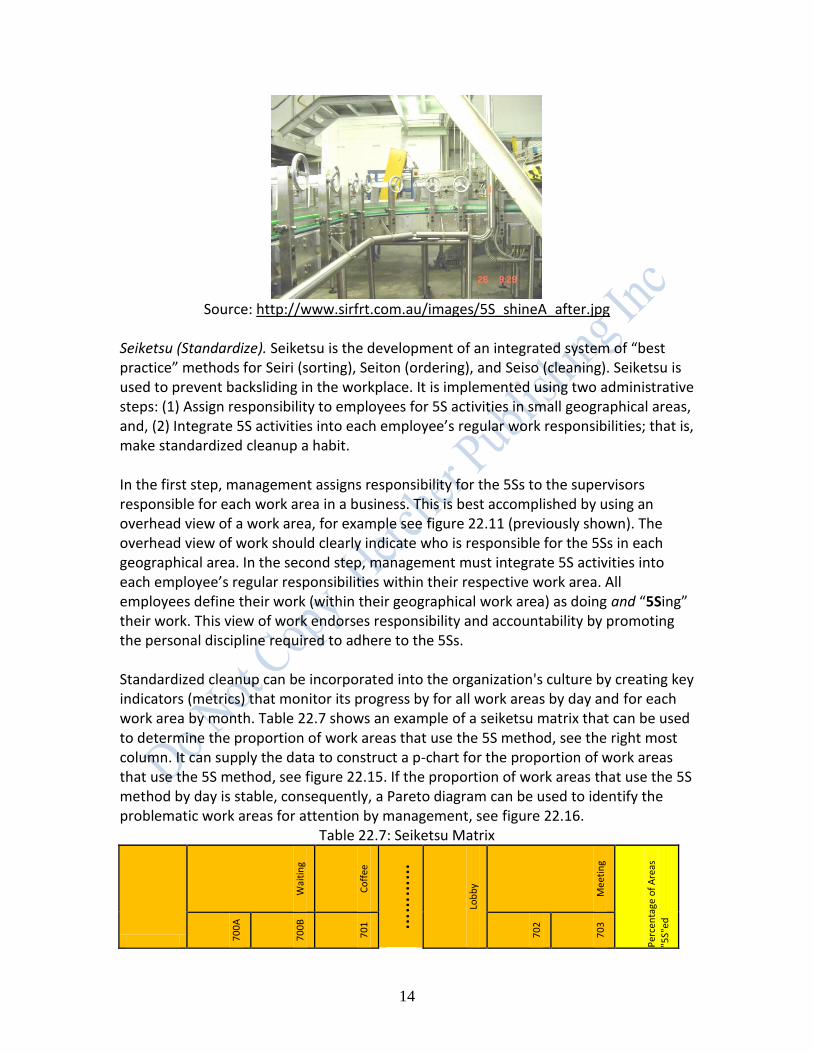
Before and after photos of seiso are shown in Figures 22.13 and 22.14. They display the dramatic effect seiso can have on the mental health and well-being of employees in the effected workplace.
Figure 22.13: Workplace Before Seiso
Source: http://www.sirfrt.com.au/images/5S_shineA_before.jpg
Figure 22.14: Workplace After Seiso
14
Source: http://www.sirfrt.com.au/images/5S_shineA_after.jpg
Seiketsu (Standardize). Seiketsu is the development of an integrated system of “best practice” methods for Seiri (sorting), Seiton (ordering), and Seiso (cleaning). Seiketsu is used to prevent backsliding in the workplace. It is implemented using two administrative steps: (1) Assign responsibility to employees for 5S activities in small geographical areas, and, (2) Integrate 5S activities into each employee’s regular work responsibilities; that is, make standardized cleanup a habit.
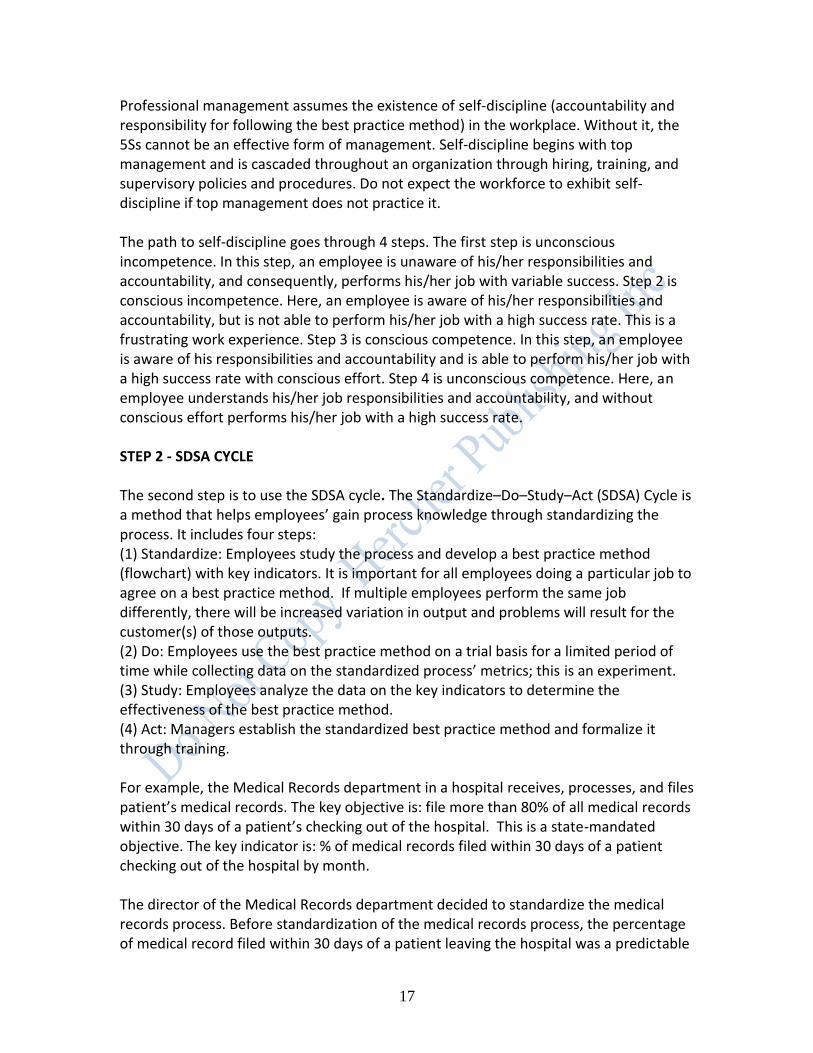
In the first step, management assigns responsibility for the 5Ss to the supervisors responsible for each work area in a business. This is best accomplished by using an overhead view of a work area, for example see figure 22.11 (previously shown). The overhead view of work should clearly indicate who is responsible for the 5Ss in each geographical area. In the second step, management must integrate 5S activities into each employee’s regular responsibilities within their respective work area. All employees define their work (within their geographical work area) as doing and “5Sing” their work. This view of work endorses responsibility and accountability by promoting the personal discipline required to adhere to the 5Ss. Standardized cleanup can be incorporated into the organization's culture by creating key indicators (metrics) that monitor its progress by for all work areas by day and for each work area by month. Table 22.7 shows an example of a seiketsu matrix that can be used to determine the proportion of work areas that use the 5S method, see the right most column. It can supply the data to construct a p-chart for the proportion of work areas that use the 5S method, see figure 22.15. If the proportion of work areas that use the 5S method by day is stable, consequently, a Pareto diagram can be used to identify the problematic work areas for attention by management, see figure 22.16.
Table 22.7: Seiketsu Matrix
Wai
tin
g
Co
ffee
……
……
Lob
by
Mee
tin
g
Per
cen
tage
of
Are
as
"5S"
ed
70
0A
70
0B
70
1
70
2
70
3

15
1/1/2007 Y Y Y Y Y Day 0
1/2/2007 Y N Y Y Y Y 2
1/3/2007 Y Y Y Y Y N 3
1/4/2007 Y Y Y Y Y Y 0
1/5/2007 Y Y Y Y Y Y 2
1/6/2007 Y Y Y Y Y Y 1
1/7/2007 Y Y Y Y Y Y 0
1/8/2007 Y Y Y Y Y Y 2
1/9/2007 Y Y Y Y Y Y 2
1/10/2007 Y Y Y Y Y Y 0
1/11/2007 Y Y Y Y Y N 4
1/12/2007 Y Y Y Y Y Y 0
1/13/2007 Y N Y Y Y Y 2
1/14/2007 Y Y Y Y Y N 3
1/15/2007 Y Y Y Y Y Y 0
1/16/2007 Y Y Y Y Y Y 2
1/17/2007 Y Y Y Y Y Y 1
1/18/2007 Y Y Y Y Y Y 0
1/19/2007 Y Y Y Y Y Y 2
1/20/2007 Y Y Y Y Y Y 2
1/21/2007 Y Y Y Y Y Y 0
1/22/2007 Y N Y Y Y Y 2
1/23/2007 Y Y Y Y Y N 3
1/24/2007 Y Y Y Y Y Y 0
1/25/2007 Y Y Y Y Y Y 2
1/26/2007 Y Y Y Y Y Y 1
1/27/2007 Y Y Y Y Y Y 0
1/28/2007 Y Y Y Y Y Y 2
1/29/2007 Y Y Y Y Y Y 2
1/30/2007 Y Y Y Y Y N 3
1/31/2007 Y Y Y Y Y Y 0
Number of days each area not "5s"ed 0 3 0 0 0 5 43

16
Figure 22.15: p-chart of “5S” process
3128252219161310741
0.16
0.14
0.12
0.10
0.08
0.06
0.04
0.02
0.00
Sample
Pro
po
rtio
n
_P=0.0447
UCL=0.1561
LCL=0
Proportion of Areas Not "5S"ed by day
Figure 22.16: Pareto Diagram of Work Areas Not Using the 5S Method
Number of Days Not "5S"ed 10 10 7 5 4 4 3
Percent 23.3 23.3 16.3 11.6 9.3 9.3 7.0
Cum % 23.3 46.5 62.8 74.4 83.7 93.0 100.0
Work Area 708780704703746773726
40
30
20
10
0
100
80
60
40
20
0
Nu
mb
er
of
Da
ys N
ot
"5S
"ed
Pe
rce
nt
Pareto Chart of Work Area
As you can see, figure 22.16 shows that 7 of the 49 work areas (726, 773, 746, 703, 704, 780, and 708) account for 100% of the areas not using the 5S method. In other words, 14.3% of the work areas account for 100% of the areas not using the 5S method. Team members can now focus on these areas and try to identify the barriers to the 5S techniques, with the hopes of implementing the 5Ss across the entire organization. Shitsuke (self-discipline). Shitsuke makes a habit of the first 4Ss by forging them into a complete systemic disciplined approach to management. Perhaps the most important thing a manager can do to encourage his or her subordinates to take a disciplined approach to work is to model the behavior that is desired. Your workers will listen to you when you tell them how they should behave, and they will watch carefully to see if you are following your own advice. Failure to do so leads to a cynical workforce.
17
Professional management assumes the existence of self-discipline (accountability and responsibility for following the best practice method) in the workplace. Without it, the 5Ss cannot be an effective form of management. Self-discipline begins with top management and is cascaded throughout an organization through hiring, training, and supervisory policies and procedures. Do not expect the workforce to exhibit self-discipline if top management does not practice it. The path to self-discipline goes through 4 steps. The first step is unconscious incompetence. In this step, an employee is unaware of his/her responsibilities and accountability, and consequently, performs his/her job with variable success. Step 2 is conscious incompetence. Here, an employee is aware of his/her responsibilities and accountability, but is not able to perform his/her job with a high success rate. This is a frustrating work experience. Step 3 is conscious competence. In this step, an employee is aware of his responsibilities and accountability and is able to perform his/her job with a high success rate with conscious effort. Step 4 is unconscious competence. Here, an employee understands his/her job responsibilities and accountability, and without conscious effort performs his/her job with a high success rate. STEP 2 - SDSA CYCLE The second step is to use the SDSA cycle. The Standardize–Do–Study–Act (SDSA) Cycle is a method that helps employees’ gain process knowledge through standardizing the process. It includes four steps: (1) Standardize: Employees study the process and develop a best practice method (flowchart) with key indicators. It is important for all employees doing a particular job to agree on a best practice method. If multiple employees perform the same job differently, there will be increased variation in output and problems will result for the customer(s) of those outputs. (2) Do: Employees use the best practice method on a trial basis for a limited period of time while collecting data on the standardized process’ metrics; this is an experiment. (3) Study: Employees analyze the data on the key indicators to determine the effectiveness of the best practice method. (4) Act: Managers establish the standardized best practice method and formalize it through training. For example, the Medical Records department in a hospital receives, processes, and files patient’s medical records. The key objective is: file more than 80% of all medical records within 30 days of a patient’s checking out of the hospital. This is a state-mandated objective. The key indicator is: % of medical records filed within 30 days of a patient checking out of the hospital by month. The director of the Medical Records department decided to standardize the medical records process. Before standardization of the medical records process, the percentage of medical record filed within 30 days of a patient leaving the hospital was a predictable
18
22% per month; that would rarely go above 32% per month or below 12% per month. Recall, the process should never drop below 80% of medical records files in a given month. The SDSA cycle was applied to the Medical Records department. It is described below. Standardize: The director standardized the medical records process in 3 steps. First, s/he trained all of her personnel on how to construct a flowchart. Second, s/he asked each employee to create a detailed flowchart of the medical records process. Third, s/he reviewed all of the flowcharts with her entire staff and created one best practice flowchart. The best practice flowchart incorporated all of the strengths and eliminated all of the weaknesses of each employee’s flowchart. Do: Employees use the best practice method on a trial basis for a limited period of time while collecting data on the standardized process’ metrics. In the case of the medical records department, the director collected baseline data on the key indicator for a period of months. Study: Employees analyzed data on the key indicators to determine the effectiveness of the best practice methods. Again, in the case of the medical records department, the director studied the key indicator data and determined that the percentage of medical record filed within 30 days of a patient leaving the hospital after standardization was a predictable 30% per month that would rarely go above 38% per month or below 22% per month. She knew that this was still woefully inadequate given her state mandated key objective. Act: Managers establish the standardized best practice method and formalize it through training. In the case of the medical records department, the director formalized the best practice method by training all employees in the method and putting it in the department’s training manual for the training of all future employees.
Process knowledge was acquired by standardizing the process, thereby, paving the way for the future acquisition of more knowledge. The director of the Medical Records department continued to work on increasing the percentage of medical records files within 30 days of the patient leaving the hospital using the PDSA cycle. STEP 3 – REDUCTION OF COMPLEXITY Complexity frequently increases the incidence of non-value added steps in a process. Recall, one of the major sources of complexity is the special cause over reaction to common causes of variation, called tampering with a process. This may be why the IRS Code is so convoluted. As discussed earlier in this book, non-value added steps in a process include any step that: (1) customers are not willing to pay for, (2) do not change the product or service,
19
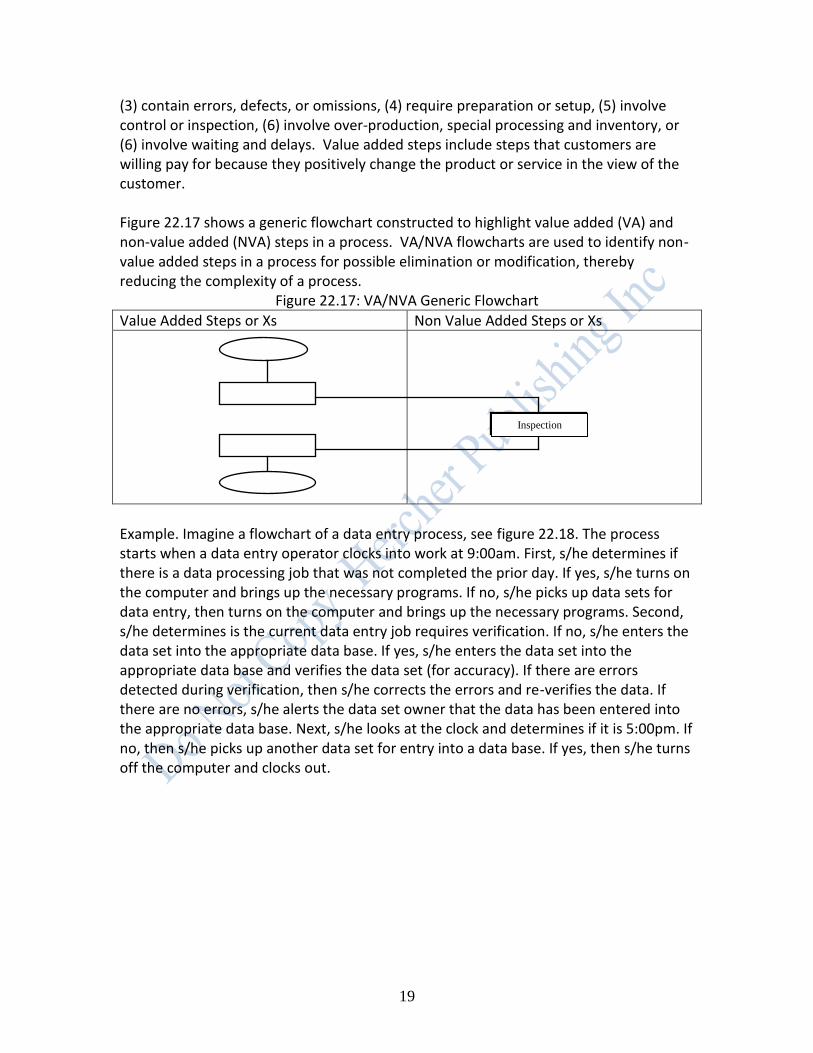
(3) contain errors, defects, or omissions, (4) require preparation or setup, (5) involve control or inspection, (6) involve over-production, special processing and inventory, or (6) involve waiting and delays. Value added steps include steps that customers are willing pay for because they positively change the product or service in the view of the customer. Figure 22.17 shows a generic flowchart constructed to highlight value added (VA) and non-value added (NVA) steps in a process. VA/NVA flowcharts are used to identify non-value added steps in a process for possible elimination or modification, thereby reducing the complexity of a process.
Figure 22.17: VA/NVA Generic Flowchart
Value Added Steps or Xs Non Value Added Steps or Xs
Example. Imagine a flowchart of a data entry process, see figure 22.18. The process starts when a data entry operator clocks into work at 9:00am. First, s/he determines if there is a data processing job that was not completed the prior day. If yes, s/he turns on the computer and brings up the necessary programs. If no, s/he picks up data sets for data entry, then turns on the computer and brings up the necessary programs. Second, s/he determines is the current data entry job requires verification. If no, s/he enters the data set into the appropriate data base. If yes, s/he enters the data set into the appropriate data base and verifies the data set (for accuracy). If there are errors detected during verification, then s/he corrects the errors and re-verifies the data. If there are no errors, s/he alerts the data set owner that the data has been entered into the appropriate data base. Next, s/he looks at the clock and determines if it is 5:00pm. If no, then s/he picks up another data set for entry into a data base. If yes, then s/he turns off the computer and clocks out.
Inspection

20
Figure 22.18: Flowchart of a Data Entry Process
Start
Clock into work at
9.00am
Previous
day’s data
Yes
Pick-up data sets to be entered
into Database
Turn on computer and bring
up programs
Verification of data
entry by data set
Enter data set Enter data set
Verify data set
Error
Clock out from
work at 5.00 pm
Stop
Turn off computer
Alert dataset owner that data
has been completed
Correct errors
No
Yes
No
Yes No
Before 5.00 pm
5.00 pm or later

21
The flowchart in figure 22.18 can re-drawn as a VA/NVA flowchart, see figure 22.19. Figure 22.19: VA/NVA Flowchart of a Data Entry Process
Unnecessary NVA Necessary NVA Steps Steps
VA Steps
Start
Clock into work at
9.00am
Previous day’s data
Yes
Pick-up data sets to be entered
into Database
Turn on computer and bring
up programs
Verification of data
entry by data set
Enter data set Enter data set
Verify data set
Error
Clock out from
work at 5.00 pm
Stop
Turn off computer
Alert dataset owner that data
has been completed
Correct errors
No
Yes
No
Yes No
Before 5.00 pm
5.00 pm or later
22
As you can see from figure 22.19, correcting errors is a non-value added step, that is, customers do not want to pay for extra processing; they want it correct the first time. Interestingly, verifying the data set may be a necessary non-value added step. In this case, it is not clear whether inspection (verification) adds value to the data entry operations, however, we still want to eliminate the waste.
TOTAL PRODUCTIVE MAINTENANCE (TPM) DEFINITION Total Productive Maintenance (TPM) is a method useful for maintaining plants and equipment with total involvement from all employees (Venkatesh, 2005). Its objectives are to dramatically increase production and employee morale by: (1) Decreasing waste, (2) Reducing costs, (3) Decreasing batch sizes, (4) Increasing production velocity, (5) Increasing quality, and (6) Decreasing on-the-job stress caused by poor maintenance and production quotas. TYPES OF MAINTENANCE There are four types of maintenance: breakdown maintenance, preventative maintenance, corrective maintenance, and maintenance prevention. Each type of maintenance is described below. Breakdown maintenance. Breakdown maintenance occurs when employees are reactive to equipment failure and effectuate repairs only after a failure has occurred on a piece of equipment. Frequently, breakdown maintenance requires a maintenance prioritization system. These systems frequently are ineffective due to worker abuse. The nature of the abuse is caused by a worker classifying a needed repair as critical, when it is not, to get breakdown maintenance attention quickly. Breakdown maintenance might make some limited sense when the equipment failure does not significantly affect the operation or production or generate any significant loss other than repair cost. In other words, the piece of equipment is not in any way critical to key objectives on the organizational dashboard. Breakdown maintenance concepts can also be applied to people. It directly translates to an individual who waits for a crisis to strike before taking appropriate action. At the point of crisis, the remedial action is often far more traumatic and expensive that a proactive response. For example, a morbidly obese individual ignores all signs of a diminution in his or her health, until the occurrence of a heart attack. Another example is a manager who ignores increasingly bizarre behavior on the part of one of his or her
23
direct reports until a severely unacceptable event occurs at the work place, for example, a physical conflict. Preventative maintenance. Preventative maintenance is a routine and scheduled process of maintenance (cleaning, inspection, oiling and re-tightening) of plant and equipment. It is used to ensure the proper functioning of plant and equipment and to decrease the incidence of failure of plant and equipment by preventing entropy (deterioration). Entropy (deterioration) can be stopped or reversed through a program of periodic monitoring or equipment condition diagnosis. There are two types of preventative maintenance: periodic maintenance and predictive maintenance.
Periodic maintenance is a routine and scheduled process that includes: (1) inspecting, servicing and cleaning equipment, and (2) replacing parts or equipment to prevent problems.
Predictive maintenance. Predictive maintenance is a process in which failure times of critical parts and equipment is predicted from data, for example, a part lasts 1,000 hours on average with a minimum life of 950 hours. PM would change the part every 950 hours to prevent the part from failing and causing trouble. It is used to extend the serviceable life of plant and equipment toward their theoretical maximum.
Preventative maintenance is also a useful concept for individuals. For example, you can consider the daily ingestion of a drug for high blood pressure as a form of periodic preventative maintenance. Alternatively, if appropriate, you could predict family stress during the Holiday Season and remedial action could be taken to eliminate potential problems. This is an example of preventative predictive maintenance. Corrective maintenance. Corrective maintenance is a process that redesigns equipment, and component parts, so that employees can reliably perform preventive maintenance. Again, corrective maintenance applies to individuals, for example, individuals with acid reflux can redesign the angle of their bed to inhibit the movement of acid up their esophagus. Maintenance prevention. Maintenance prevention is a process of designing new equipment so that it is robust against critical failure modes. Finally, maintenance prevention applies to individuals. For example, individuals may forget to take their daily dosage of medicines (critical failure mode). Consequently, an enterprising organization could redesign the pill taking process to include a phone call to an 800 number indicating that the pills were ingested by the individual at the pre-scheduled time. If the call is not received by the 800 number within 15 minutes of the pre-scheduled ingestion time, a reminder phone call is made to the individual, thereby, dramatically decreasing the incidence of missed medicines. TPM DASHBOARD

24
The TPM dashboard focuses on six key objectives relating to: productivity, quality, cost, delivery, safety, and morale. Some common TPM key indicators and their targets are shown in table 22.8 for each key objective.
Table 22.8: TPM Dashboard Key Objective Key Indicator Common Target
Increase productivity Increase OPE (Overall Production Efficiency) by EPEx 1.5-2x
Increase OEE (Overall Equipment Efficiency) by EPEx 1.5-2x
OEE (Overall Equipment Efficiency ) = A x PE x Q, where Availability of the machine (A) is the proportion of time machine is actually available out of the total time it should be available for a given time period. A = (MTBF – MTTR ) / MTBF, where MTBF = Mean Time Between Failures = Total Running Time)/Number of Failures. MTTR = Mean Time To Repair. Performance Efficiency (PE) = RE x SE, where Rate efficiency (RE): Actual average cycle time is slower than design cycle time because of jams, etc. Output is reduced because of jams Speed efficiency (SE): Actual cycle time is slower than design cycle time machine output is reduced because it is running at reduced speed. Quality (Q) is percentage of good parts divided by the total number of produced parts, sometimes called “yield”.
% of machines operating during lunch by EPEx 100%
Adopt life cycle approach for TPM Adopted by xx/xx/xxxx
Improve quality Decrease customer complaints by EPEx 0
Decrease % defective output by machine by EPEx
Decrease cost Decrease manufacturing cost by month 30% reduction
Improve delivery Increase % of successful deliveries as defined by the customer by month
100%
Improve safety Decrease # or OSHA reportable accidents by month 0
Decrease all accidents by month 0
Decrease unsafe behaviors by month 0
Decrease fires by month 0
Decrease pollution emissions by month Within legal emission standards
Improve morale Increase # of employee TPM suggestions by month 3x number at start of TPM
Increase % of multi-skilled (flexible) workers by month 100%
Increase productivity by month
Increase % of relevant workforce involved in TPM team, overall, by level in the organization, by month
COMPONENTS OF TPM TPM is built on a base of the 5S methods: seiri (sort), seiton (systematize), seiso (clean), seiketsu (standardize), and shitsuke (self-discipline). The 5S methods are discussed in section 22.1 of this chapter. Problems cannot be clearly seen when the work place is unorganized. Making problems visible is the first step to eliminating them. TPM has 7 component parts, they are: jishu hozen (autonomous maintenance), kaizen, planned maintenance, quality maintenance, training, office TPM, and safety, health and environment TPM. Jishu Hozen (JH). Jishu hozen (autonomous maintenance) is a method for developing employees to take care of small maintenance tasks in their work areas, consequently, freeing up time of skilled maintenance employees for more value-added maintenance tasks. The operators are responsible for upkeep of their equipment to prevent it from deteriorating.
25
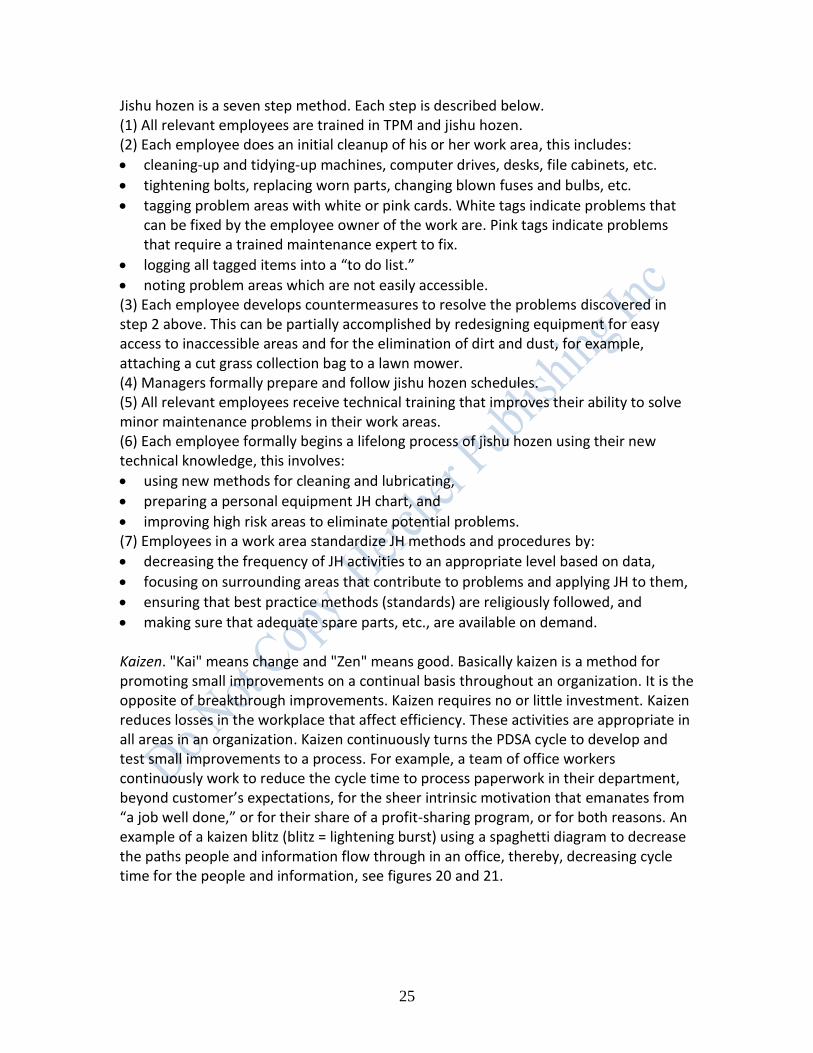
Jishu hozen is a seven step method. Each step is described below. (1) All relevant employees are trained in TPM and jishu hozen. (2) Each employee does an initial cleanup of his or her work area, this includes:
cleaning-up and tidying-up machines, computer drives, desks, file cabinets, etc.
tightening bolts, replacing worn parts, changing blown fuses and bulbs, etc.
tagging problem areas with white or pink cards. White tags indicate problems that can be fixed by the employee owner of the work are. Pink tags indicate problems that require a trained maintenance expert to fix.
logging all tagged items into a “to do list.”
noting problem areas which are not easily accessible. (3) Each employee develops countermeasures to resolve the problems discovered in step 2 above. This can be partially accomplished by redesigning equipment for easy access to inaccessible areas and for the elimination of dirt and dust, for example, attaching a cut grass collection bag to a lawn mower. (4) Managers formally prepare and follow jishu hozen schedules. (5) All relevant employees receive technical training that improves their ability to solve minor maintenance problems in their work areas. (6) Each employee formally begins a lifelong process of jishu hozen using their new technical knowledge, this involves:
using new methods for cleaning and lubricating,
preparing a personal equipment JH chart, and
improving high risk areas to eliminate potential problems. (7) Employees in a work area standardize JH methods and procedures by:
decreasing the frequency of JH activities to an appropriate level based on data,
focusing on surrounding areas that contribute to problems and applying JH to them,
ensuring that best practice methods (standards) are religiously followed, and
making sure that adequate spare parts, etc., are available on demand. Kaizen. "Kai" means change and "Zen" means good. Basically kaizen is a method for promoting small improvements on a continual basis throughout an organization. It is the opposite of breakthrough improvements. Kaizen requires no or little investment. Kaizen reduces losses in the workplace that affect efficiency. These activities are appropriate in all areas in an organization. Kaizen continuously turns the PDSA cycle to develop and test small improvements to a process. For example, a team of office workers continuously work to reduce the cycle time to process paperwork in their department, beyond customer’s expectations, for the sheer intrinsic motivation that emanates from “a job well done,” or for their share of a profit-sharing program, or for both reasons. An example of a kaizen blitz (blitz = lightening burst) using a spaghetti diagram to decrease the paths people and information flow through in an office, thereby, decreasing cycle time for the people and information, see figures 20 and 21.

26
Figure 22.20: Before Spaghetti Diagram
Figure 22.21: After Spaghetti Diagram
Planned Maintenance (PM). Planned maintenance promotes trouble free plants and equipment. There are four types of PM. They were discussed earlier: (1) preventive maintenance, (2) breakdown maintenance, (3) corrective maintenance, and (4) maintenance prevention. Planned Maintenance is a proactive process, as opposed to a reactive process. There are five steps to PM, they are: 1. Evaluate and record the present status of equipment. 2. Repair deterioration in equipment. 3. Develop an information system for storing maintenance data, analyzing
maintenance data, and making maintenance decisions. 4. Install diagnostic equipment and techniques for collecting maintenance data, if
appropriate. 5. Improve the PM process, over and over again. For example, an MRI center performs scans for patients at the request of their physician. The technicians frequently spend much time attempting to adjust the MRI machine so it produces accurate scans. Due to this problem, the technicians create a PM

27
project to develop a process that: (1) evaluates and records the calibration of the equipment against a known standard, (2) establishes temporary guidelines for the recalibration of the equipment. (3) develops an information system for storing maintenance data, analyzing maintenance data, and making recalibration policy decisions, (4) if appropriate, installs diagnostic equipment and techniques for collecting maintenance data, and (5) improves the PM process, over and over again. Quality Maintenance (QM). Quality maintenance promotes customer satisfaction through the delivery of products and services having the features customers’ desire, with little unit-to-unit variation around their designed nominal levels (within specification limits). Quality maintenance activities are accomplished when employees use the PDSA cycle in respect to maintenance issues. For example, a team of maintenance workers use the PDSA cycle to continuously improve the “request for maintenance” process as measured by the length of time between a “request for maintenance” and the “beginning of maintenance”, and the length of time between the “beginning of maintenance” and the “successful completion of the maintenance task.” Training. Training promotes energized, multi-skilled employees who perform all their required functions effectively and efficiently. Employees should “know how” and “know-why" TPM activities are being performed in the workplace. Training can have the following positive benefits:
Improving employee’s knowledge, skills and techniques,
Self-learning based on employee’s needs,
Developing and using effective and efficient curriculum/tools/assessments for employee’s training and development efforts, and
Decreasing employee fatigue and making employee’s work more enjoyable. In the opinion of Quality Management in general, and in the opinions of Dr. W. Edwards Deming and Dr. Kauro Ishikawa in particular, employees are an organization's most important asset. Organizations must make long-term commitments to employees that include the opportunity to take joy in their work. This requires training in job skills. Training in job skills is a system. Effective training changes the skill distribution for a job skill, as shown in figure 22.22. Management must understand the capability of the training process and the current distribution of job skills to improve the future distribution of job skills. Data, not guesswork or opinion, should be used to guide the training plans for employees.

28
Figure 22.22: Distribution of Job Skills Before and After Successful Training
In Quality Management, jobs have two components: doing the job following the best practice methods and improving the best practice methods for the job; this includes training and applying the PDSA cycle to the job. Training is a part of everyone's job and should include formal class work, experiential work, and instructional materials. Training courseware must take into consideration how the trainee learns and the speed at which she learns. It should utilize statistical methods that indicate when an employee reaches a state of statistical control; that is, only common causes of variation are present in the key indicator(s) used to measure the employee’s output. If an employee is not in statistical control with respect to a job characteristic, then more training of the type she is receiving will be beneficial. However if an employee is in a state of statistical control with respect to a job characteristic, then more training of that type will not be beneficial; the employee has learned all that is possible from the training program. Office TPM. Office TPM is started after activating jushi hozen, kaizen, quality maintenance, and planned maintenance. It is used to improve productivity, efficiency in the administrative functions. Office TPM focuses on issues such as:
Inventory reduction of office supplies and materials,
Lead time reduction of critical office processes,
Movement inefficiencies,
Physical space inefficiencies,
Retrieval time reduction,
Work load equalization,
Zero breakdown of office equipment,
Zero stock-outs of office supplies and materials,
Equipment productivity,
Manpower productivity,
29
Mistake reduction in office functions (for example, preparation of checks, bills, invoices, or payroll),
Rejection/rework reduction in office functions,
Cost reductions in office functions (for example, cost of poor communication, cost of poorly maintained machines),
Safety in material handling/stores/logistics, and
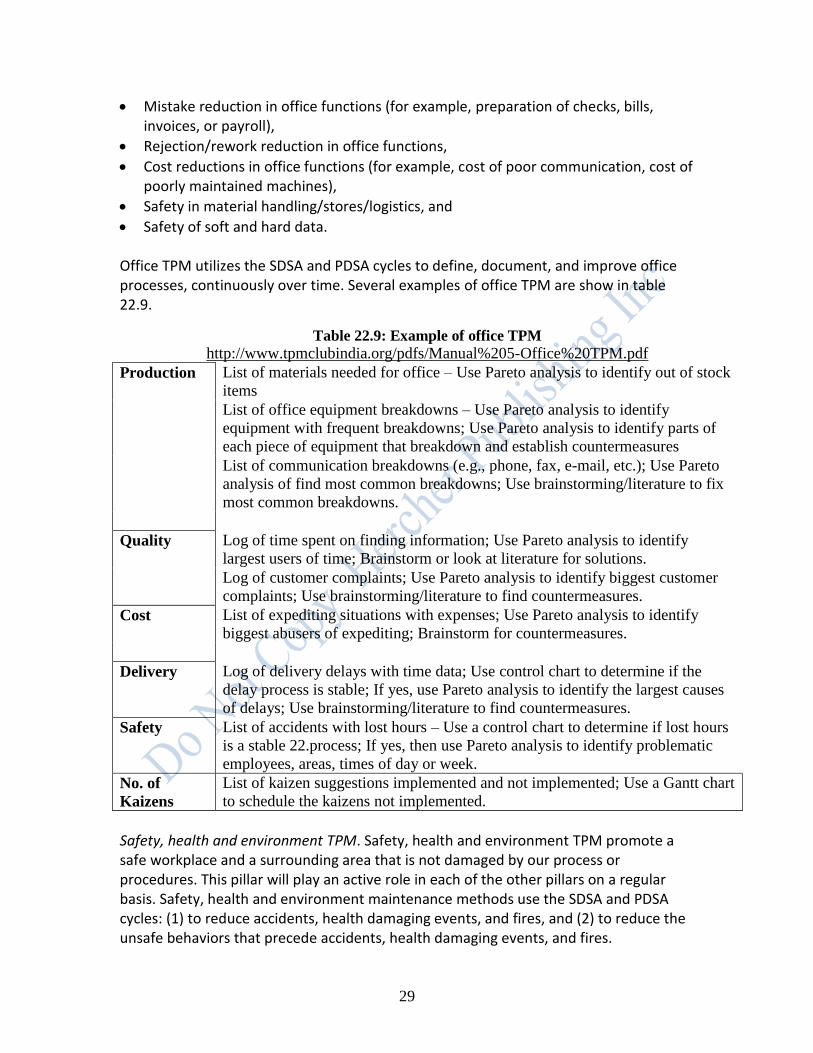
Safety of soft and hard data. Office TPM utilizes the SDSA and PDSA cycles to define, document, and improve office processes, continuously over time. Several examples of office TPM are show in table 22.9.
Safety, health and environment TPM. Safety, health and environment TPM promote a safe workplace and a surrounding area that is not damaged by our process or procedures. This pillar will play an active role in each of the other pillars on a regular basis. Safety, health and environment maintenance methods use the SDSA and PDSA cycles: (1) to reduce accidents, health damaging events, and fires, and (2) to reduce the unsafe behaviors that precede accidents, health damaging events, and fires.
Table 22.9: Example of office TPM
http://www.tpmclubindia.org/pdfs/Manual%205-Office%20TPM.pdf
Production List of materials needed for office – Use Pareto analysis to identify out of stock
items
List of office equipment breakdowns – Use Pareto analysis to identify
equipment with frequent breakdowns; Use Pareto analysis to identify parts of
each piece of equipment that breakdown and establish countermeasures
List of communication breakdowns (e.g., phone, fax, e-mail, etc.); Use Pareto
analysis of find most common breakdowns; Use brainstorming/literature to fix
most common breakdowns.
Quality Log of time spent on finding information; Use Pareto analysis to identify
largest users of time; Brainstorm or look at literature for solutions.
Log of customer complaints; Use Pareto analysis to identify biggest customer
complaints; Use brainstorming/literature to find countermeasures.
Cost List of expediting situations with expenses; Use Pareto analysis to identify
biggest abusers of expediting; Brainstorm for countermeasures.
Delivery Log of delivery delays with time data; Use control chart to determine if the
delay process is stable; If yes, use Pareto analysis to identify the largest causes
of delays; Use brainstorming/literature to find countermeasures.
Safety List of accidents with lost hours – Use a control chart to determine if lost hours
is a stable 22.process; If yes, then use Pareto analysis to identify problematic
employees, areas, times of day or week.
No. of
Kaizens
List of kaizen suggestions implemented and not implemented; Use a Gantt chart
to schedule the kaizens not implemented.
30
Once accidents have been reduced to a low number per month, LSS team members can no longer study accident data to eliminate accidents because there is not enough data. Consequently, they begin to study unsafe behaviors that precede accidents, eliminate them, and thereby, reduce potential accidents. A case study of studying unsafe behaviors to reduce accidents follows (Gitlow, Berkins, and He, 2002). EXAMPLE OF TPM Introduction. Safety sampling is a method by which management studies processes and people with the aim of making them safer. This is done by identifying, detecting and reducing the unsafe behaviors that precede accidents. However, these unsafe behaviors do not always result in accidents. Unsafe behaviors are the acts people exhibit, and the circumstances processes provide, prior to accidents. Trying to reduce future accidents by studying accidents in the past is analogous to driving a car by looking through the rear view mirror. Knowing where you have been is not the best method for getting you to where you want to go. Likewise, understanding past accidents does not provide enough information to prevent future accidents. Background Information. Rochester Electro-Medical, Inc. (REM) is a manufacturing company based in Tampa, Florida. It produces medical products. During the past few months, the management of REM felt the need to improve the safety in the work place to create an improved work environment and lower insurance premiums. Consequently, they began a safety sampling study. Safety-Sampling Plan. A generic 13-step safety-sampling plan is presented below. It is tailored to meet the specific requirements of Rochester-Electro Medical (REM). Step 1. The President and Safety Director of REM established two objectives for their safety-sampling plan. The first objective was to estimate the number of unsafe acts each day to determine if they are stable over time. The second objective was to prioritize the individual unsafe behaviors for corrective action and to remove them from REM’s system of unsafe behaviors. Step 2. The President and Safety Director defined the population under study by the safety-sampling plan. The President and Safety Director of REM identified the entire facility as the subject of the safety-sampling plan. Step 3. The President and Safety Director identified the key indicator(s) for the process under study. The President and Safety Director identified the number of OSHA reportable accidents monthly as the key indicator for the safety-sampling plan. It is assumed that there is a positive relationship between the number of unsafe behaviors per month and the number of accidents per month. At of the time of this study, no
31
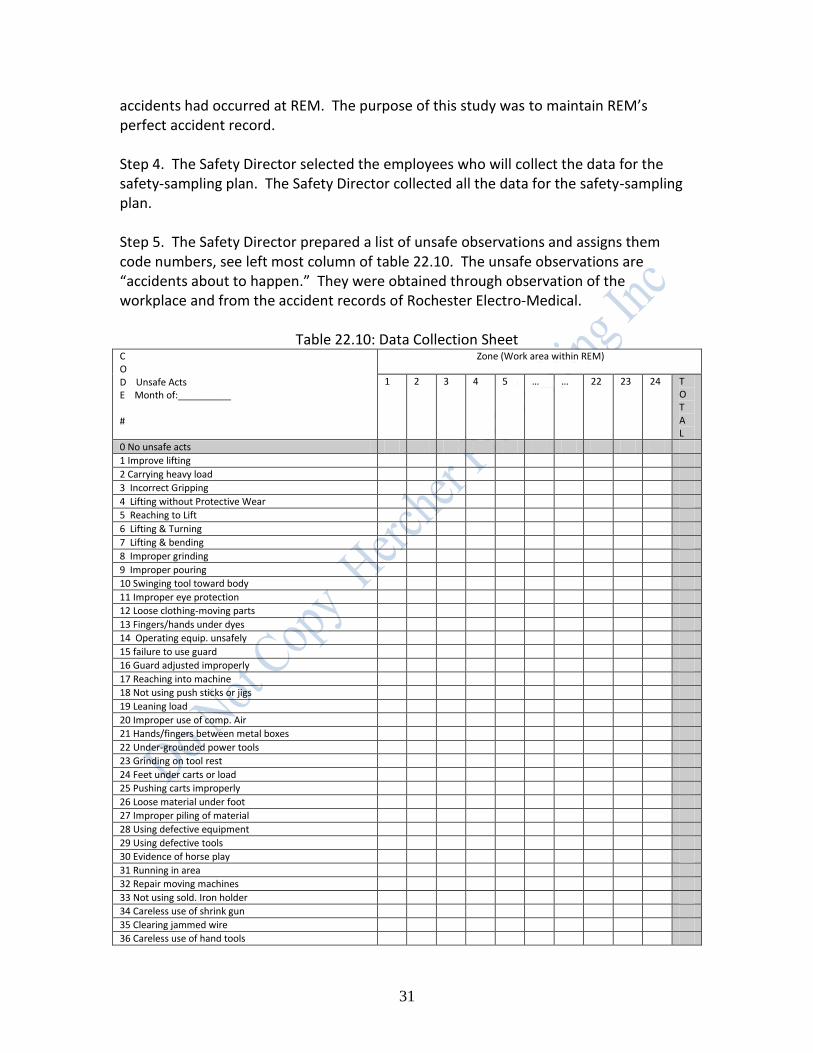
accidents had occurred at REM. The purpose of this study was to maintain REM’s perfect accident record. Step 4. The Safety Director selected the employees who will collect the data for the safety-sampling plan. The Safety Director collected all the data for the safety-sampling plan. Step 5. The Safety Director prepared a list of unsafe observations and assigns them code numbers, see left most column of table 22.10. The unsafe observations are “accidents about to happen.” They were obtained through observation of the workplace and from the accident records of Rochester Electro-Medical.
Table 22.10: Data Collection Sheet C O D Unsafe Acts E Month of:__________ #
Zone (Work area within REM)
1 2 3 4 5 … … 22 23 24 T O T A L
0 No unsafe acts
1 Improve lifting
2 Carrying heavy load
3 Incorrect Gripping
4 Lifting without Protective Wear
5 Reaching to Lift
6 Lifting & Turning
7 Lifting & bending
8 Improper grinding
9 Improper pouring
10 Swinging tool toward body
11 Improper eye protection
12 Loose clothing-moving parts
13 Fingers/hands under dyes
14 Operating equip. unsafely
15 failure to use guard
16 Guard adjusted improperly
17 Reaching into machine
18 Not using push sticks or jigs
19 Leaning load
20 Improper use of comp. Air
21 Hands/fingers between metal boxes
22 Under-grounded power tools
23 Grinding on tool rest
24 Feet under carts or load
25 Pushing carts improperly
26 Loose material under foot
27 Improper piling of material
28 Using defective equipment
29 Using defective tools
30 Evidence of horse play
31 Running in area
32 Repair moving machines
33 Not using sold. Iron holder
34 Careless use of shrink gun
35 Clearing jammed wire
36 Careless use of hand tools

32
37 Loose/tangles power cords
38 Cluttered work bench
39 Work isles blocked or crowd.
40 Improper care of flammables
41 Excessive talking while work.
42
Total Frequency
Total Percentage
Step 6. The Safety Director developed a plan for selecting a randomized start time for each tour of the areas under study by the safety-sampling plan. This ensures that employees can not anticipate the arrival of the investigator and change their pattern of unsafe behaviors. A randomized start time is selected by creating a chart of times of operation (excluding breaks, etc.) with serial numbers, see table 22.11. A random number table is used to select a random serial number, and consequently, a random start time for a tour of the workplace. Time and budgetary constraints prevented a random start time approach at REM. The Safety Director stated that the lack of randomized start times should not introduce a significant measurement effect into the study. The only start times available for safety-sampling tours were 10:00 a.m. and 2:00 p.m. daily.
Table 22.11: List of Work Times with Serial Numbers Time of Day Serial number
08:00 am 00
08:01 am 01
08:02 am 02
08:03 am 03
……………………
05:00 pm
Step 7. The Safety Director created a detailed map of Rochester Electro-Medical from blueprints that indicate every area to be studied by the safety-sampling plan, see figure 22.23. Each work area is assigned a serial number on the map. It is important to create areas such that a data collector can observe the entire area from one physical location. Consequently, a private room in a hospital may not be an acceptable area for a safety-sampling study because an observer cannot see in the bathroom or closet without opening the doors. A route was created which allows the Safety Director to pass every area once on a tour.

33
ASSEMBLY
#3 #4
Figure 22.23: Map of Work Areas at Rochester-Electro Medical, Inc. FABRICATION DRILL LATHE ENTRANCE PRESS #1 SHIPPING
STORAGE STORAGE
SCALE : 1/8” = 1
Step 8. The Safety Director prepared a data collection form, see table 22.10. Rows indicate possible unsafe acts and columns indicate work areas. The form should also include the date, start time for the tour, data collector, and significantly, comments on the conditions in existence at the time of any unsafe behaviors.
02
MILL STORAGE 01
RECEIVING
03
05
WORK ROOM
10 11
12
09
13
14
DESK
WIRE ASSEMBLY
CUTTER #1
15
16
RESEARCH ASSEMBLY
#2 17
18
19 20
04
BATH-
ROOM
MIX
ING
P
RE
-SH
IPP
ING
F
INA
L T
ES
TIN
G
07
08
SIN
K
IN
PR
OC
ES
S M
OL
DIN
G
#5
#6 T
ES
TIN
G M
AC
HIN
E
21
22
2
23
3
AS
SE
MB
LY
24

34
Step 9. The Safety Director informs all employees, both management and hourly, of the ongoing performance of a safety study. A sample memorandum explaining the ongoing safety study is shown below. TO: All employees FROM: President and Safety Director DATE: February 28, 2013 RE: Information concerning a safety study designed to create a safer workplace
1. A continuous safety study will be conducted from now on at Rochester Medical-Electro. The purpose of this study is to understand when and where and why unsafe behaviors occur. It is hoped that this study will improve safety practices and reduce the number of unsafe behaviors, and hence, the number of accidents on the job.
2. No individual’s name will appear on any management report or summary. No time study or appraisal of effort or method will be made from this study. All work areas will be included in this study, both management and hourly.
3. The Safety Director will collect all information. 4. No one will be sampled without knowing that he has been included in the
sampling group. 5. Records of output will be analyzed to make certain that the work sampled is
typical of general work. 6. No worker will be terminated as a consequence of this study!
Step 10. The Safety Director maked several preliminary tours (say 1 per day over a 3 day period for each shift) of the route using a random starting point. S/he observes every area and instantaneously records any unsafe acts by code number on table 22.10. If no unsafe acts are observed in an area, s/he records a 0 in the column for the area on table 22.10. The Safety Director computes the proportion of unsafe acts (p) for all areas from the preliminary tours. Step 11. The Safety Director determines the sample size necessary to estimate the proportion of unsafe acts for each time period under study. There are two points of view on determining the sample size in a safety plan, the classical view and the Quality Management view. The classical view states that the sample size (n = number of observation to be made of individual work areas) is calculated as follows: n = sample size required to estimate the proportion of unsafe acts with 95% confidence and 5% tolerable error (e) in the estimate, p = proportion of unsafe acts estimated in the preliminary tours, n = Z2[p(1-p)]/e2, where Z = 1.96 (95% confidence) and e = .05. = 1.962[p(1-p)]/.052 = 1536.64[p(1-p)]

35
As a practical matter, the sample size derived using the classical view is frequently the subject of bargaining between the Safety Director and the department managers. The number of tours per day is calculated by dividing “n” by the number of areas to be studied (m). For example, if p=.05, then n=72.99, and if m= 24 areas, then the number of tours is 4 (72.99/24=3.04=4). The number of tours is always rounded up to the nearest integer. It is assumed that each observation is a quick unannounced event that employees can not anticipate or change their behavior. The Quality Management view states that there is no statistical theory to quantify the uncertainty in the study of a process, for example, a safety-sampling study. Expert opinion is the best vehicle to understand the magnitude of uncertainty caused by changes to a process (changes from, for example, new equipment, new workers, new tools, new methods, or different operating conditions). Process experts draw judgment samples from a process to study its output. Judgment samples are selected based on an expert's opinion. Generally, if a process is stable, any slice of its output (a set of judgment samples) will be very revealing about the process's behavior in the near future. The REM safety-sampling plan adopted the Quality Management view and set the sample size at one tour. Two judgment samples (tours) were drawn each day. Step 12. The Safety Director collects and records the data, and tabulates “c” (number of unsafe acts) for each sample. REM’s running record of “c” is plotted on Figure 22.24.
Figure 22.24: C-chart of Unsafe Behaviors 02/28-03/13
Step 13. The Safety Director prepares a report for management concerning unsafe acts using the data from figure 22.24. The report assumes a stable work force. The report consists of a c-chart for the monthly number of OSHA reportable accidents and a c-chart for the number of unsafe acts, sample to sample (figure 22.24). If necessary, the above analyses can be further broken down by department. Additional statistical analyses may
Figure 4: C Chart - Unsafe Behaviors 02/28 - 03/13
0
3
6
9
12
15
18
21
24
27
30
33
36
39
No. of Unsafe Behaviors 10 6 6 10 8 12 2 1 23 3 2 8 7 6 6 11 13 9 6 9
Centerline=7.9 7.9 7.9 7.9 7.9 7.9 7.9 7.9 7.9 7.9 7.9 7.9 7.9 7.9 7.9 7.9 7.9 7.9 7.9 7.9 7.9
UCL=16.3 16.3 16.3 16.3 16.3 16.3 16.3 16.3 16.3 16.3 16.3 16.3 16.3 16.3 16.3 16.3 16.3 16.3 16.3 16.3 16.3
LCL=0 0 0 0 0 0 0 0 0 0 0 0 0 0 0 0 0 0 0 0 0
10:00 AM 2:00 PM 10:00 AM 2:00 PM 10:00 AM 2:00 PM 10:00 AM 2:00 PM 10:00 AM 2:00 PM 10:00 AM 2:00 PM 10:00 AM 2:00 PM 10:00 AM 2:00 PM 10:00 AM 2:00 PM 10:00 AM 2:00 PM
2/28 2/29 3/1 3/2 3/6 3/7 3/8 3/9 3/10 3/13
Deficient employee causes this point.

36
be required to develop plans to remove particular unsafe behaviors, overall or by department. The c-chart in figure 22.24 indicates a mean number of unsafe behaviors of 7.9 (UCL = 16.3) with the presence of a special cause of variation on the morning of March 6 at 10:00am (x = 23). Analysis of the log sheet for the morning of March 6 indicated the possibility of a deficient employee on the job. The employee in question was physically in the workplace from February 28 through March 8, but absent from work without leave from March 9 and March 13. He was officially terminated on the morning of March 14. The Safety Director believed that the employee was the cause of the out-of-control situation at 10:00am on March 6. As a result of identifying this special cause of variation, management modified the Employee Handbook to include an improved procedure for selecting and training new employees. Subsequently, the control limits were recalculated without the March 6 data point and the process was found to be stable with a mean number of unsafe acts of 7.1 (UCL = 15.1), see Figure 22.55 (left side before the dashed control limits and mean line). The revised control limits were projected into the near future (see dashed lines on the right side of Figure 22.25).
Figure 22.25: Unsafe Behaviors 02/28 – 03/24
Figure 5: C Chart - Unsafe Behaviors 02/28 - 03/24
0
3
6
9
12
15
18
21
24
27
30
33
36
39
No. of Unsaf e Behavior s 10 6 6 10 8 12 2 1 3 2 8 7 6 6 11 13 9 6 9 6 2 2 3 2 5 1 39 1 3 0 2 4 5 6 0 2 2
Center l ine=7.11 7.11 7.11 7.11 7.11 7.11 7.11 7.11 7.11 7.11 7.11 7.11 7.11 7.11 7.11 7.11 7.11 7.11 7.11 7.11 7.11 7.11 7.11 7.11 7.11 7.11 7.11 7.11 7.11 7.11 7.11 7.11 7.11 7.11 7.11 7.11 7.11 7.11
UCL= 15.11 15.10 15.10 15.10 15.10 15.10 15.10 15.10 15.10 15.10 15.10 15.10 15.10 15.10 15.10 15.10 15.10 15.10 15.10 15.10 15.10 15.10 15.10 15.10 15.10 15.10 15.10 15.10 15.10 15.10 15.10 15.10 15.10 15.10 15.10 15.10 15.10 15.10
LCL = 0.00 0.00 0.00 0.00 0.00 0.00 0.00 0.00 0.00 0.00 0.00 0.00 0.00 0.00 0.00 0.00 0.00 0.00 0.00 0.00 0.00 0.00 0.00 0.00 0.00 0.00 0.00 0.00 0.00 0.00 0.00 0.00 0.00 0.00 0.00 0.00 0.00 0.00
10 AM 2 PM 10 AM 2 PM 10 AM 2 PM 10 AM 2 PM 2 PM 10 AM 2 PM 10 AM 2 PM 10 AM 2 PM 10 AM 2 PM 10 AM 2 PM 10 AM 2 PM 10 AM 2 PM 10 AM 2 PM 10 AM 2 PM 10 AM 2 PM 10 AM 2 PM 10 AM 2 PM 10 AM 2 PM 10 AM 2 PM
2/ 28 2/ 29 3/ 1 3/ 2 3/ 6 3/ 7 3/ 8 3/ 9 3/ 10 3/ 13 3/ 14 3/ 15 3/ 16 3/ 17 3/ 20 3/ 21 3/ 22 3/ 23 3/ 24
Deficient employee on the job.
Deficient employee doesn't show up
for work. Work force is agitated due
to unsafe conditions.
Deficient employee formally terminated. Work
forces calms down due to safer environment.
New policy on safety added to work manual.
All existing and new employees are trained in
its content(PDSA) Process shifted down with
exception of 2:00 pm 3/17; work
force has calmed down due to
safer work environment.
In process of rearranging storage
bins and some work benches.
37
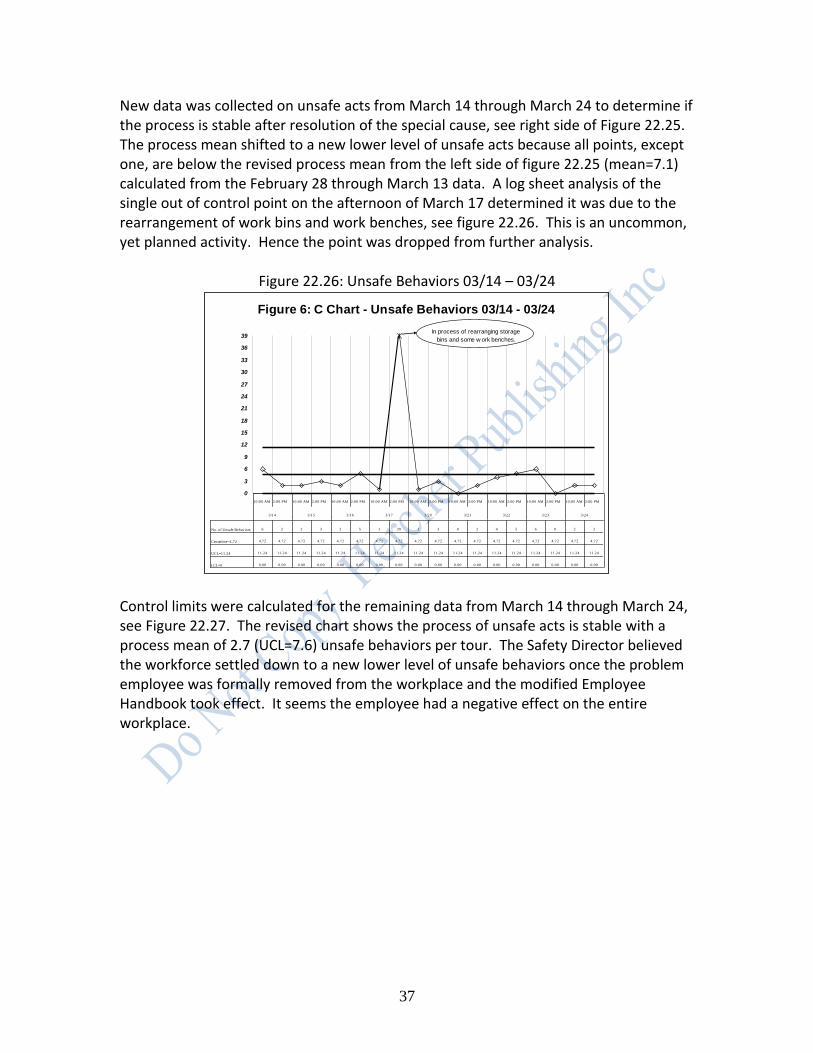
New data was collected on unsafe acts from March 14 through March 24 to determine if the process is stable after resolution of the special cause, see right side of Figure 22.25. The process mean shifted to a new lower level of unsafe acts because all points, except one, are below the revised process mean from the left side of figure 22.25 (mean=7.1) calculated from the February 28 through March 13 data. A log sheet analysis of the single out of control point on the afternoon of March 17 determined it was due to the rearrangement of work bins and work benches, see figure 22.26. This is an uncommon, yet planned activity. Hence the point was dropped from further analysis.
Figure 22.26: Unsafe Behaviors 03/14 – 03/24
Control limits were calculated for the remaining data from March 14 through March 24, see Figure 22.27. The revised chart shows the process of unsafe acts is stable with a process mean of 2.7 (UCL=7.6) unsafe behaviors per tour. The Safety Director believed the workforce settled down to a new lower level of unsafe behaviors once the problem employee was formally removed from the workplace and the modified Employee Handbook took effect. It seems the employee had a negative effect on the entire workplace.
Figure 6: C Chart - Unsafe Behaviors 03/14 - 03/24
0
3
6
9
12
15
18
21
24
27
30
33
36
39
No. of Unsafe Behaviors 6 2 2 3 2 5 1 39 1 3 0 2 4 5 6 0 2 2
Centerline=4.72 4.72 4.72 4.72 4.72 4.72 4.72 4.72 4.72 4.72 4.72 4.72 4.72 4.72 4.72 4.72 4.72 4.72 4.72
UCL=11.24 11.24 11.24 11.24 11.24 11.24 11.24 11.24 11.24 11.24 11.24 11.24 11.24 11.24 11.24 11.24 11.24 11.24 11.24
LCL=0 0.00 0.00 0.00 0.00 0.00 0.00 0.00 0.00 0.00 0.00 0.00 0.00 0.00 0.00 0.00 0.00 0.00 0.00
10:00 AM 2:00 PM 10:00 AM 2:00 PM 10:00 AM 2:00 PM 10:00 AM 2:00 PM 10:00 AM 2:00 PM 10:00 AM 2:00 PM 10:00 AM 2:00 PM 10:00 AM 2:00 PM 10:00 AM 2:00 PM
3/14 3/15 3/16 3/17 3/20 3/21 3/22 3/23 3/24
In process of rearranging storage
bins and some w ork benches.
38
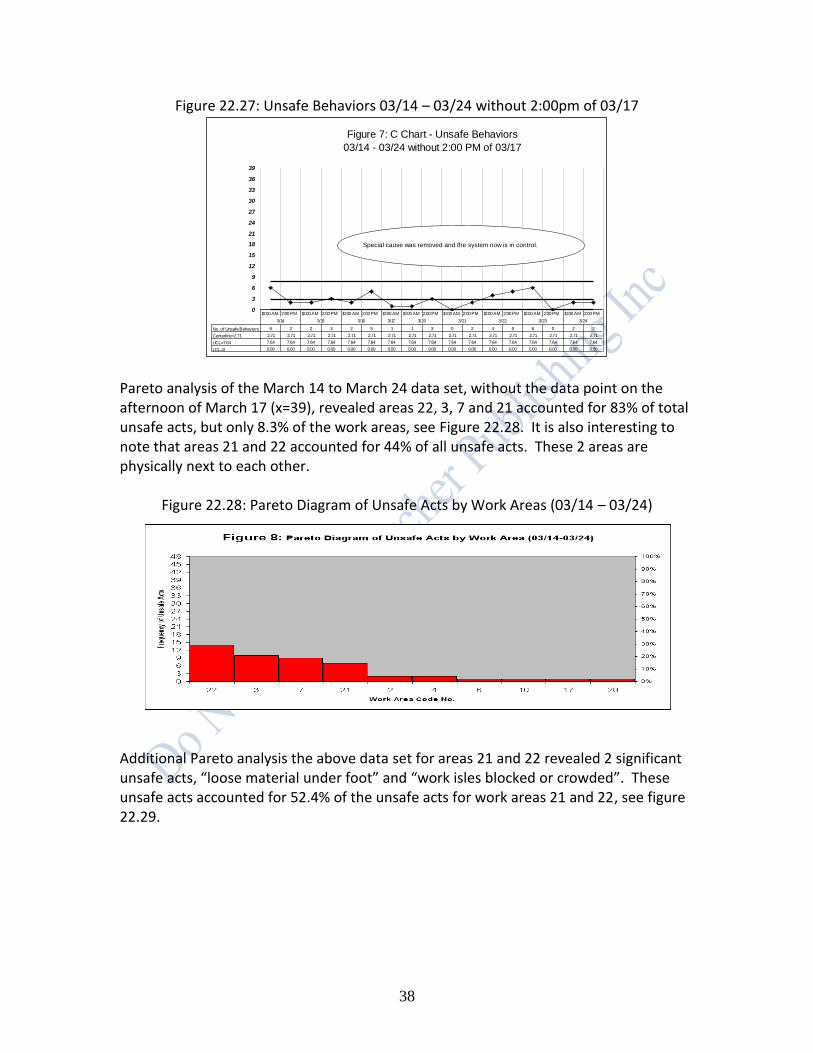
Figure 22.27: Unsafe Behaviors 03/14 – 03/24 without 2:00pm of 03/17
Pareto analysis of the March 14 to March 24 data set, without the data point on the afternoon of March 17 (x=39), revealed areas 22, 3, 7 and 21 accounted for 83% of total unsafe acts, but only 8.3% of the work areas, see Figure 22.28. It is also interesting to note that areas 21 and 22 accounted for 44% of all unsafe acts. These 2 areas are physically next to each other.
Figure 22.28: Pareto Diagram of Unsafe Acts by Work Areas (03/14 – 03/24) Additional Pareto analysis the above data set for areas 21 and 22 revealed 2 significant unsafe acts, “loose material under foot” and “work isles blocked or crowded”. These unsafe acts accounted for 52.4% of the unsafe acts for work areas 21 and 22, see figure 22.29.
0
3
6
9
12
15
18
21
24
27
30
33
36
39
No. of Unsafe Behaviors 6 2 2 3 2 5 1 1 3 0 2 4 5 6 0 2 2
Centerline=2.71 2.71 2.71 2.71 2.71 2.71 2.71 2.71 2.71 2.71 2.71 2.71 2.71 2.71 2.71 2.71 2.71 2.71
UCL=7.64 7.64 7.64 7.64 7.64 7.64 7.64 7.64 7.64 7.64 7.64 7.64 7.64 7.64 7.64 7.64 7.64 7.64
LCL=0 0.00 0.00 0.00 0.00 0.00 0.00 0.00 0.00 0.00 0.00 0.00 0.00 0.00 0.00 0.00 0.00 0.00
10:00 AM 2:00 PM 10:00 AM 2:00 PM 10:00 AM 2:00 PM 10:00 AM 10:00 AM 2:00 PM 10:00 AM 2:00 PM 10:00 AM 2:00 PM 10:00 AM 2:00 PM 10:00 AM 2:00 PM
3/14 3/15 3/16 3/17 3/20 3/21 3/22 3/23 3/24
Special cause was removed and the system now is in control.
Figure 7: C Chart - Unsafe Behaviors
03/14 - 03/24 without 2:00 PM of 03/17

39
Figure 22.29: Pareto Diagram of Unsafe Acts for Areas 21 and 21 (03/14 – 03/24)
Management placed posters on the walls in work areas 21 and 22 stating: “Remove Loose Material from Floor” and “Keep Aisles Clear”. This was done to show the employees in work areas 21 and 22 that management was concerned about safety and wanted to help them overcome their shortcomings. However, management quickly realized that the workers in areas 21 and 22 were upset by the posters. The workers said they were being singled out because there were no posters placed in other areas. Due to this adverse effect on morale, management removed the posters from areas 21 and 22 on March 28. Subsequently, management stressed removing loose material from the floor and keeping aisles clear in all work areas. Figure 22.30 shows that the unsafe behavior process from 03/23 – 04/28 is out of control with a process mean of 1.8 unsafe behaviors (UCL=5.9). The out of control points occurred on the afternoons of April 3, 17, 21, and the morning of April 24. An examination of the log sheet revealed that on April 24 there was a repair done by landlord. This was viewed as a planned and uncommon event and was dropped from the analysis. Log sheet analysis of the 3 remaining out-of-control points indicated that they were all due to the receipt of large UPS shipments.
Figure 9: Pareto Diagram of Unsafe Acts for Area
21 & 22 (03/14-03/24)
0
3
6
9
12
15
18
21
26 L
oose m
ate
rial
under
foot
39 W
ork
ais
les
blo
cked/c
row
ded
29 U
sin
g
defe
ctiv
e tools
38 C
luttere
d w
ork
bench
46 E
xposed r
azor
bla
des
34 C
are
less u
se
of shrink g
un
37 L
oose/tangle
s
pow
er
cord
s
40 Im
pro
per
care
of fla
mm
able
s
41 E
xcessiv
e
talk
ing w
ith w
ork
Unsafe Acts
No
. o
f O
ccu
ren
ce
0%
10%
20%
30%
40%
50%
60%
70%
80%
90%
100%

40
Figure 22.30: Unsafe Behaviors from 03/23 – 04/28
REM management met with UPS management to discuss the following issues:
1) UPS drivers piling boxes higher than 5 feet. 2) UPS drivers leaving boxes in haphazard manner not allowing for an aisle between
shipments. 3) UPS drivers engage REM workers in unnecessary conversation. 4) UPS drivers not careful and fall over REM workers as they enter and leave the
premises. 5) Packages not belonging to REM being delivered.
After 2 meetings, REM and UPS felt they could resolve REM’s safety problems by assigning a permanent driver to service the REM account. The driver was trained in the particular needs of REM. A c-chart was constructed using data collected from June 26 to July 7. It was determined that the permanent UPS driver resolved the chaotic pattern of unsafe behaviors at REM, see Figure 22.31. The new process is stable with a mean of 0.75 unsafe acts per tour and an UCL = 3.4. This represents an order of magnitude improvement in the average number of unsafe acts per tour at REM.
Figure 10: C Chart - Unsafe Behaviors 03/23 - 04/28
0
3
6
9
12
15
18
21
24
27
30
33
36
39
No. of Unsaf e Behaviors 0 2 2 1 2 0 1 1 0 3 2 0 0 0 7 2 0 2 0 0 3 1 0 2 3 3 1 2 1 1 4 0 7 1 0 0 0 0 0 0 7 20 3 3 0 4 0 0 0 3 0
Cent erline=1.84 1.84 1.84 1.84 1.84 1.84 1.84 1.84 1.84 1.84 1.84 1.84 1.84 1.84 1.84 1.84 1.84 1.84 1.84 1.84 1.84 1.84 1.84 1.84 1.84 1.84 1.84 1.84 1.84 1.84 1.84 1.84 1.84 1.84 1.84 1.84 1.84 1.84 1.84 1.84 1.84 1.84 1.84 1.84 1.84 1.84 1.84 1.84 1.84 1.84 1.84 1.84
UCL=5.92 5.92 5.92 5.92 5.92 5.92 5.92 5.92 5.92 5.92 5.92 5.92 5.92 5.92 5.92 5.92 5.92 5.92 5.92 5.92 5.92 5.92 5.92 5.92 5.92 5.92 5.92 5.92 5.92 5.92 5.92 5.92 5.92 5.92 5.92 5.92 5.92 5.92 5.92 5.92 5.92 5.92 5.92 5.92 5.92 5.92 5.92 5.92 5.92 5.92 5.92 5.92
LCL=0 0 0 0 0 0 0 0 0 0 0 0 0 0 0 0 0 0 0 0 0 0 0 0 0 0 0 0 0 0 0 0 0 0 0 0 0 0 0 0 0 0 0 0 0 0 0 0 0 0 0 0
2 PM10 AM2 PM10 AM2 PM10 AM2 PM10 AM2 PM10 AM2 PM10 AM2 PM10 AM2 PM10 AM2 PM10 AM2 PM10 AM2 PM10 AM2 PM10 AM2 PM10 AM2 PM10 AM2 PM10 AM2 PM10 AM2 PM10 AM2 PM10 AM2 PM10 AM2 PM10 AM2 PM10 AM2 PM10 AM2 PM10 AM2 PM10 AM2 PM10 AM2 PM
3/ 23 3/ 24 3/ 27 3/ 28 3/ 29 3/ 30 3/ 31 4/ 3 4/ 4 4/ 5 4/ 6 4/ 10 4/ 11 4/ 12 4/ 13 4/ 14 4/ 17 4/ 18 4/ 19 4/ 20 4/ 21 4/ 24 4/ 25 4/ 26 4/ 27 4/ 28
UPS driver-suggested he be more
careful w ith large loads. Freight forw arder delivered several
large, heavy cartons.
17 inbound UPS- several
large size; not checked in
and cleared.
Repair being done by
landlord on door and
courtyard.
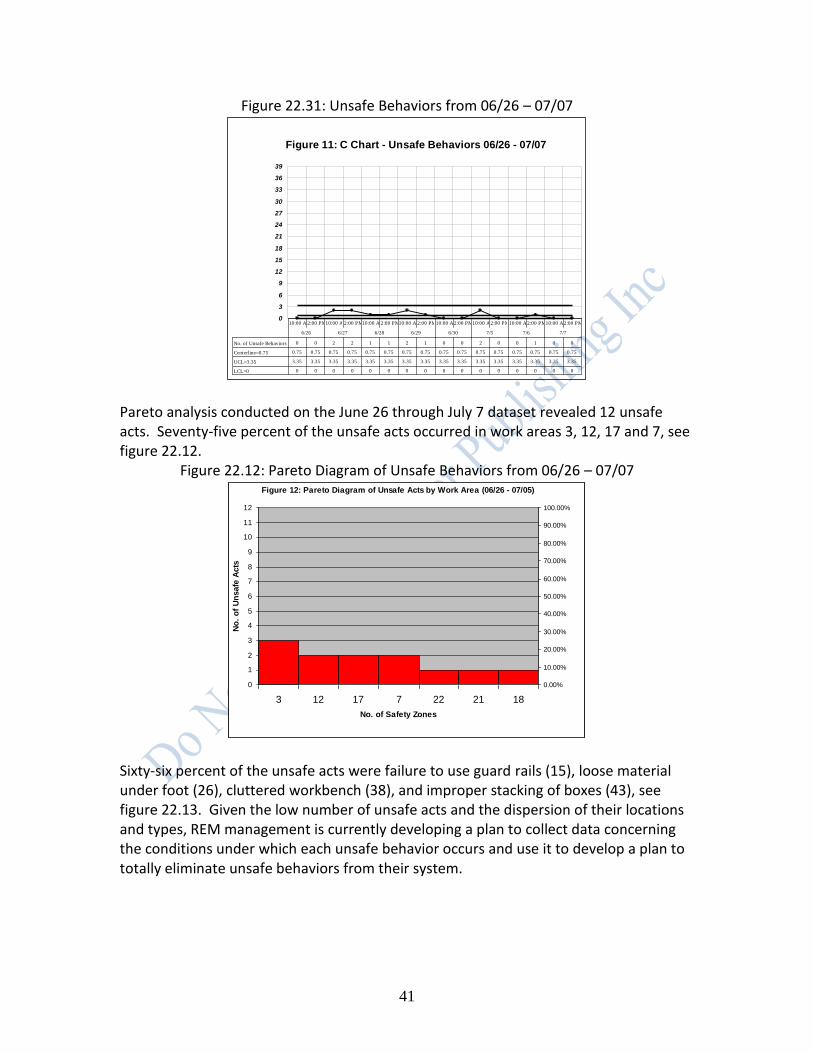
41
Figure 22.31: Unsafe Behaviors from 06/26 – 07/07
Pareto analysis conducted on the June 26 through July 7 dataset revealed 12 unsafe acts. Seventy-five percent of the unsafe acts occurred in work areas 3, 12, 17 and 7, see figure 22.12.
Figure 22.12: Pareto Diagram of Unsafe Behaviors from 06/26 – 07/07
Sixty-six percent of the unsafe acts were failure to use guard rails (15), loose material under foot (26), cluttered workbench (38), and improper stacking of boxes (43), see figure 22.13. Given the low number of unsafe acts and the dispersion of their locations and types, REM management is currently developing a plan to collect data concerning the conditions under which each unsafe behavior occurs and use it to develop a plan to totally eliminate unsafe behaviors from their system.
Figure 11: C Chart - Unsafe Behaviors 06/26 - 07/07
0
3
6
9
12
15
18
21
24
27
30
33
36
39
No. of Unsafe Behaviors 0 0 2 2 1 1 2 1 0 0 2 0 0 1 0 0
Centerline=0.75 0.75 0.75 0.75 0.75 0.75 0.75 0.75 0.75 0.75 0.75 0.75 0.75 0.75 0.75 0.75 0.75
UCL=3.35 3.35 3.35 3.35 3.35 3.35 3.35 3.35 3.35 3.35 3.35 3.35 3.35 3.35 3.35 3.35 3.35
LCL=0 0 0 0 0 0 0 0 0 0 0 0 0 0 0 0 0
10:00 AM2:00 PM10:00 AM2:00 PM10:00 AM2:00 PM10:00 AM2:00 PM10:00 AM2:00 PM10:00 AM2:00 PM10:00 AM2:00 PM10:00 AM2:00 PM
6/26 6/27 6/28 6/29 6/30 7/5 7/6 7/7
Figure 12: Pareto Diagram of Unsafe Acts by Work Area (06/26 - 07/05)
0
1
2
3
4
5
6
7
8
9
10
11
12
3 12 17 7 22 21 18
No. of Safety Zones
No
. o
f U
nsafe
Acts
0.00%
10.00%
20.00%
30.00%
40.00%
50.00%
60.00%
70.00%
80.00%
90.00%
100.00%

42
Figure 22.13: Pareto Diagram of Unsafe Acts by Type (06/26 – 07/07)
Summary. Accidents are the result of unsafe behaviors in the workplace. Accident data are collected after the occurrence of a painful and expensive accident. A less painful and less expensive procedure for reducing accidents in the workplace is by monitoring and eliminating the unsafe behaviors that precede accidents. CONCLUSION TPM works in factories and plants, construction, building maintenance, transportation maintenance, to name a few situations. Employees must be educated and convinced that management is committed to Deming-based Lean Six Sigma management in general, and TPM management specifically.
QUICK CHANGEOVERS (SMED) Quick changeover (Productivity Development Team, 1996) is a technique that team members can use to analyze, and then reduce: (1) Setup time for equipment (including tools and dies) and people (for example, shift to shift setup for cashiers in a supermarket), (2) Resources required for a changeover, and (3) Materials necessary for a changeover. Quick changeovers are accomplished through the SMED system. SMED is an acronym for Single Minute Exchange of Dies. Single minute refers to a change over lasting less than 10 minutes. Quick changeovers create the opportunity in a value stream to effectively and efficiently institute small batch sizes, or even one-piece flows. One piece flows occur when one unit at a time flows through a value stream, as opposed to batch flows when a batch of units flows through a value stream. One-piece flows eliminate the inventory created during batch production.
Figure 13: Pareto Diagram of Unsafe Acts (06/26-07/05)
0123456789
101112
15
Fa
ilu
re to
use
gu
ard
26
Lo
ose
ma
teri
al u
nd
er
foo
t
38
Clu
tte
red
wo
rk
be
nch
43
Im
pro
pe
r
sta
ckin
g o
f b
oxe
s
3 In
co
rre
ct
gri
pp
ing
4 L
ifitn
g w
ith
ou
t
pro
t. W
ea
r
39
Wo
rk a
isle
s
blo
cke
d/c
row
de
d
42
Clu
tte
r in
ais
les
Unsafe Acts
No
. o
f O
ccu
ren
ce
0%
10%
20%
30%
40%
50%
60%
70%
80%
90%
100%

43
To utilize SMED techniques effectively to achieve quick changeovers, team members must understand the difference between internal activities and external activities. Internal activities are the steps in a process that can only be performed while the process is idle, for example, a machine is taken out of service for an engine overhaul. External activities are the steps in a process that can be performed while the process is in operating mode, for example, tightened a bolt while a machine is running. Traditional changeover operations (SMED techniques) consist of four parts, they are: (1) Assembling and adjusting parts, materials and tools, (2) Removing and mounting parts and material using the tools, (3) Calibrating, setting, measuring, and adjusting parts, and (4) Conducting trial production runs and making necessary adjustments. Table 22.12 shows the percentage of changeover time typically devoted to each part of changeover operations.
Table 22.12: Percentage Breakdown of Changeover Time
Parts of a changeover % of changeover time devoted to each part
Assembling and adjusting parts, materials and tools 30%
Removing and mounting parts and material using tools 5%
Calibrating, setting, and measuring, and adjusting parts and devices
15%
Conducting trial production runs and making necessary adjustments
50%
Trail production runs and adjustments take up the majority of changeover time (50%). Good news! SMED techniques frequently can completely eliminate this step of the changeover process. Additionally, SMED techniques are also used to drastically reduce the 30% of changeover time devoted to preparation by using checklists to ensure that all parts, tools, and materials are exactly where they need to be for optimal efficiency. Additionally, if possible, any and/or all preparation activities should be converted from internal activities to external activities. Removing and mounting activities are usually internal activities, and generally, do not use a significant portion of changeover time. Calibrating, setting, measuring, and adjusting activities also do not usually require a large proportion of changeover time, but SMED techniques can makes these functions much more efficient. Team members use the PDSA cycle to reduce the time, material and resources required for a changeover. First, team members conduct the following activities as part of the Plan step of the PDSA cycle.
Videotape the entire process under study making sure to catch all the relevant movements made by personnel. Important process data can be collected using the video camera’s date and time capability.

44
Review the videotape with appropriate personnel to clarify what is actually happening in the process, for example, problems, errors, mistakes, wasted motions, attitudes, morale, etc.
Identify all of the processes, equipment, resources, and people requiring changeovers.
Collect data on the following key indicators for each changeover location: o cycle time of changeover from beginning to end, including prep work and
cleanup, by changeover (I-MR chart), o number of units lost to production during a changeover by changeover (u-
chart), o number of minutes (seconds) lost to production during a changeover by
changeover (I-MR chart), o number of units requiring rework due to a changeover by changeover (u-
chart), and o list of constraining operations that cause long changeovers.
Analyze the above data by changeover location to identify the top 2 or 3 changeover locations, usually a constraining operation, on which to focus attention.
Document the changeover location selected above, this includes: changeover name, changeover specifications (nominal values and specification limits), and part numbers (nominal values and specification limits).
Identify “muda” (waste) or problems associated with the current changeover method.
Breakdown the changeover activity into its component parts, and record the actual changeover time (time spent working on the changeover) and the elapsed changeover time (total time spent working on a changeover including waiting time, and so on) for each component changeover activity, for example, see table 22.13.
Table 22.13: Changeover Component Data Sheet Changeover component number
Changeover component name
Actual changeover time (in minutes)
Elapsed changeover time (in minutes)
Comments
100 Locate coil for cutting
5 5 Coils are stored in a cluttered inventory area.
200 Move coil to cutting & bending machine
10 15 Movement of coil is difficult due to traffic congestion and items out of place in isles.
300 Remove cut and bent coils from cutting & bending machine
5 10 Cut and bent coils must be placed into a tray.
400 Move cut & bent coils to inventory
5 15 Movement of cut & bent coils is difficult due to traffic congestion and items out of place in isles.
500 Insert new coil into cutting & bending machine
30 55 Operator is reactive to worn guide tools. He replaces it only when a
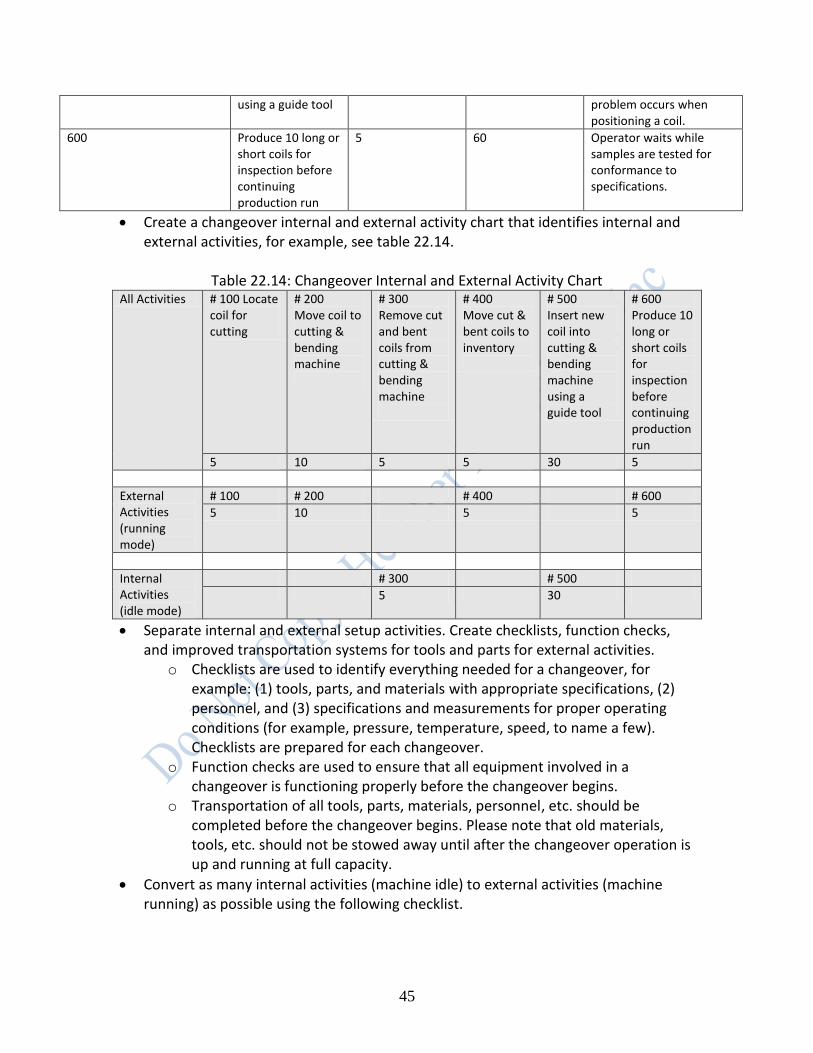
45
using a guide tool problem occurs when positioning a coil.
600 Produce 10 long or short coils for inspection before continuing production run
5 60 Operator waits while samples are tested for conformance to specifications.
Create a changeover internal and external activity chart that identifies internal and external activities, for example, see table 22.14.
Table 22.14: Changeover Internal and External Activity Chart
All Activities # 100 Locate coil for cutting
# 200 Move coil to cutting & bending machine
# 300 Remove cut and bent coils from cutting & bending machine
# 400 Move cut & bent coils to inventory
# 500 Insert new coil into cutting & bending machine using a guide tool
# 600 Produce 10 long or short coils for inspection before continuing production run
5 10 5 5 30 5
External Activities (running mode)
# 100 # 200 # 400 # 600
5 10 5 5
Internal Activities (idle mode)
# 300 # 500
5 30
Separate internal and external setup activities. Create checklists, function checks, and improved transportation systems for tools and parts for external activities.
o Checklists are used to identify everything needed for a changeover, for example: (1) tools, parts, and materials with appropriate specifications, (2) personnel, and (3) specifications and measurements for proper operating conditions (for example, pressure, temperature, speed, to name a few). Checklists are prepared for each changeover.
o Function checks are used to ensure that all equipment involved in a changeover is functioning properly before the changeover begins.
o Transportation of all tools, parts, materials, personnel, etc. should be completed before the changeover begins. Please note that old materials, tools, etc. should not be stowed away until after the changeover operation is up and running at full capacity.
Convert as many internal activities (machine idle) to external activities (machine running) as possible using the following checklist.

46
o List all activities currently performed as internal activities (activity is in idle mode) that can be converted to external activities (activity is in running mode), see activities # 300 and # 500 in table 22.14.
o Identify elements of internal activities that can be performed in external mode, for example, preparing all operating conditions, parts, materials, tools, etc. so they are where they are needed, when they are needed, in perfect operating condition, or, back to the REM Company example, moving a tray to the cutting & bending machine to off-load coils.
o Develop and implement standardized methods for all changeover activities. This includes securing devices, methods for locating and centering objects, and methods for expelling and inserting objects (for example, standardizing the heights of all the dies used by a printing machine, or attaching ears to dies so they can be inserted and expelled easier).
o Utilize intermediary jigs to externally changeover an internal part of a machine. A jig is a device to which a die is attached in a machine. This method only requires downtime to expel the current jig and insert the new jig. It does not require downtime to setup and adjust the new jig.
Perform housekeeping activities on both the internal and external portions of the changeover process using the 5S methods and mistake-proofing methods (discussed later in this chapter).
Reduce unnecessary waits and waste in external processes by: o improving transportation, storage and organization of materials, parts, and
tools, o ensuring all parts, tools and materials are in perfect operating condition
before the changeover, o developing rules for the amount of materials, spare parts, extra tools that
must be kept in inventory, o automating processes, and o making resources more accessible.
Reduce unnecessary waits and waste in internal processes by: o identifying activities that can be done concurrently by multiple employees,
for example, two employees working concurrently on one changeover can complete the job in far less total time than one employee doing the entire changeover by eliminating much of the walking time required by one employee.
o using functional clamps to hold jigs and dies in place, for example, using a pear shaped bolt hole to secure a die instead of having to tighten a bolt to secure a die.
o eliminating (completely) trial runs and adjustments by improving the accuracy of centering, dimensioning, and condition setting of internal changeover operations, for example, using numerical scales that line up on two parts to indicate when a setting is proper for a part, making reference planes and center lines visible for all parts of a changeover operation, and utilizing Least Common Multiple (LCM) devices. An LCM device is a device
47
that combines the operations of several tools, parts or templates into one tool, part, or template to cut down on changeover time. An example of an LCM device is a pen that contains four color inks. An artist using the pen only has to click on the desired color, s/he no longer has to switch pens to change colors.
o alerting operators to changing conditions using alarms, bells, etc., and o using motion simplification techniques.
Prepare a new process map showing proposed changes to the changeover process. Second, team members conduct a planned experiment using the proposed changes (see new process map) in the Do phase of the PDSA cycle. The experiment can be everywhere for a limited period of time, or in a small test area for a limited period of time. Team members collect data on the important key indicators from the old and new changeover process maps. Third, team members analyze the data collected in the Do phase in the Study phase of the PDSA cycle. If the analysis does not show acceptable improvement in the key indicators, then team members return to the Plan phase and try other modifications to the changeover process. If the analysis does show acceptable improvement in the key indicators, then team members proceed to the Act phase of the PDSA cycle. Fourth, team members formalize the new changeover process in the Act phase of the PDSA cycle. They accomplish this with the following actions: o Update all training materials with the new changeover process. o Train all existing relevant employees in the new changeover process. o Train all future (new hires) relevant employees in the new changeover process. o Return to the Plan phase and look for more improvements in the changeover
process.
MISTAKE PROOFING METHODS (POKA-YOKE DEVICES) BACKGROUND Poka-yoke (pronounced POH-kah YOH-kay) is Japanese for “mistake-proofing device” (Shingo, 1985 and 1986; and Venkatesh, 2005). A mistake proofing device is used to prevent the causes of defects and/or defective output (called errors), or to inexpensively inspect each item that is produced to determine whether it is conforming or defective. Shingo, the inventor of poka-yoke devices, writes: "The causes of defects lie in worker errors, and defects are the results of neglecting those errors. It follows that mistakes will not turn into defects if worker errors are discovered and eliminated beforehand" (Venkatesh, 2005). … "Defects arise because errors are made; the two have a cause-and-effect relationship. ... Yet errors will not turn into defects if feedback and action take

48
place at the error stage" (Ventakesh, 2005).” Shingo was opposed to blaming workers for the “inevitable mistakes” they (or machines) would make during production of output. Rather, Shingo wanted to modify the processes used to produce or deliver outputs to make is impossible for people or machines to make mistakes. In the opinions of the authors, W. Edwards Deming would have disagreed with Shigeo Shingo’s view that defects are due to operators or machines (a special cause only view of variation). Deming would have said that defects can be due to either common or special causes of variation. Shingo differed from Deming in the functioning of the PDSA cycle. Deming viewed the cycle as a method for process improvement that could allow defective product to slip through the process in the short term, if it made economic sense. Deming used the “kp rule” to determine if “mass inspection” (called judgment inspection) makes economic sense to sort conforming from non-conforming output in the “Study” step of the PDSA cycle. The “kp rule” is discussed below (Deming, 1982). If mass inspection does not make sense, then Deming advocated the routine monitoring of said process using control charts as a vehicle to collect the data necessary to improve the process and eliminate error over the long term. On the other hand, Shingo viewed the PDSA cycle as a method for mass inspection (judgment inspection) to eliminate the production or delivery of defective output. Shingo accomplished his objective by combining the Do and Study steps of the PDSA cycle into one step. He called this process “source inspection.” Source inspection ensured that the conditions that create defects cannot exist. Shingo popularized the idea of poka-yoke devices to carry out the objective of source inspection. For example, a poka-yoke device could ensure that a sink cannot overflow by adding in a drain feature in the top side of a bathroom sink, see figure 22.14.
Figure 22.14: Sink Drain Poka Yoke Device
Source: http://pokayoke.wikispaces.com/SinkDrain
49
TYPES OF INSPECTION Shingo identified three different types of inspection: judgment inspection (mass inspection), informative inspection (statistical process control), and source inspection (poka-yoke). o Judgment inspection is a process of sorting items into either conforming or non-
conforming categories. Again, this is also called “mass inspection.” Mass inspection is a faulty and unreliable practice. To prove this point to you, please count the number of times the letter “f” appears in the following paragraph. Count both upper and lower case “f”s.
“A process is a collection of interacting components that transform
inputs into outputs toward a common aim, called a mission statement. It is the job of management to optimize the entire process toward its aim. This may require the sub-optimization of selected components of the process; for example, a particular department in an organization may have to give up resources to another department in the short run to maximize profit for the overall organization. The transformation, as shown in Figure 1.1, involves the addition or creation of value in one of three aspects: time, place, or form. An output has “time value” if it is available when needed by a user. For example, you have food when you are hungry, or material inputs are ready on schedule. An output has “place value” if it is available where needed by a user. For example, gas is in your tank (not in an oil field), or wood chips are in a paper mill. An output has “form value” if it is available in the form needed by a user. For example, bread is sliced so it can fit in a toaster, or paper has three holes so it can be placed in a binder.”
How many “f”s did you find? The correct number of “f”s appears in the footnote below1. Did you get the correct answer? If the answer is no, then you realize why judgment inspection is not a way to achieve quality. o Informative inspection is a process of collecting and analyzing process data to
prevent defects or errors. Statistical Process Control is a form of informative inspection.
o Source inspection is a process of determining if the conditions which cause defects are present in a process, and eliminating them. It involves mass inspection, but the purpose is to decrease the cycle time to retrieve information on the output of a process, not to sort out defects.
DEMING’S KP RULE The kp rule is an interesting combination of Deming’s and Shingo’ thinking. It promotes Shingo’s thinking when mass inspection is an economically viable option and invalidates Shingo’s thinking otherwise. Recall, the kp rule was discussed in chapter 4.
1 The correct number of “f”s is 24. Most people get the wrong answer!

50
SOURCE INSPECTION AND THE POKA-YOKE SYSTEM Team members may decide to devote time and energy to a process of source inspection by developing or benchmarking poka-yoke devices for areas with high risk probabilities of mistakes (errors). Table 22.15 lists some high risk conditions for errors and possible poka-yoke solutions.
Table 22.15: Some High Risk Conditions for Mistake (Errors)
Absence of standard operating procedures causing multiple methods being used which cause different outcome distributions. For example, 5 professors teach STAT 101 and each professor uses his/her own syllabus is an example of an absence of standard operating procedures (standardized syllabi). This lack of standardization causes unwanted variation in the knowledge imparted to students over the different sections of STAT 101. A Statistics Department policy requiring a standardized syllabus for all sections of STAT 101 being printed by the departmental secretary is a poka-yoke solution.
Presence of symmetry (both ends of an object look alike, making it easy to confuse the ends). For example, a CD looks alike on both sides. This similarity makes it easy to place the CD in the CD player upside down. The manufacturer of the CD can printing something on the top side of CDs is a poka-yoke solution.
Presence of asymmetry (opposite ends of a part are different, but it is difficult to identify slight differences between the same ends of two or more pieces). For example, a manufacturer to vials of a muscle relaxant produces 0.5 mg doses and 5.0 mg doses, but the tops of the vials both contain white rubber for the insertion of a needle. The use of white rubber in both vials makes it easy to confuse the two dosages, and cause harm to patients. The manufacturer of the muscle relaxant can use white rubber pieces for the 0.5 mg dosage and red rubber pieces for the 5.0 mg dosage. This is a poka-yoke solution.
Speedy repetition of a task. For example, a phlebotomist draws many blood samples per hour over the course of a day. Missing a vein (defect) occurs for many reasons. One of the main reasons is that the patient moves his/her arm due improper placement by the phlebotomist. Improper placement of the patient’s arm is caused by the phlebotomist working too quickly, usually to meet his/her quota. A poka-yoke device could be used in this situation to hold the patient’s arm in place so it cannot move while blood is being drawn.
Frequent adjustments of settings. For example, a machine must be setup and adjusted frequently due to changing product line item demands by customers. Each changeover takes over 30 minutes due to difficulties in aligning two parts of the machine. It is difficult to see the proper alignment from the worker’s physical position. A poka-yoke solution is to engrave ruler type markings on the visible sides of the two parts so they can be quickly aligned by the operator from his/her position.
Processes not capable of meeting specifications. For example, an employee in an ice
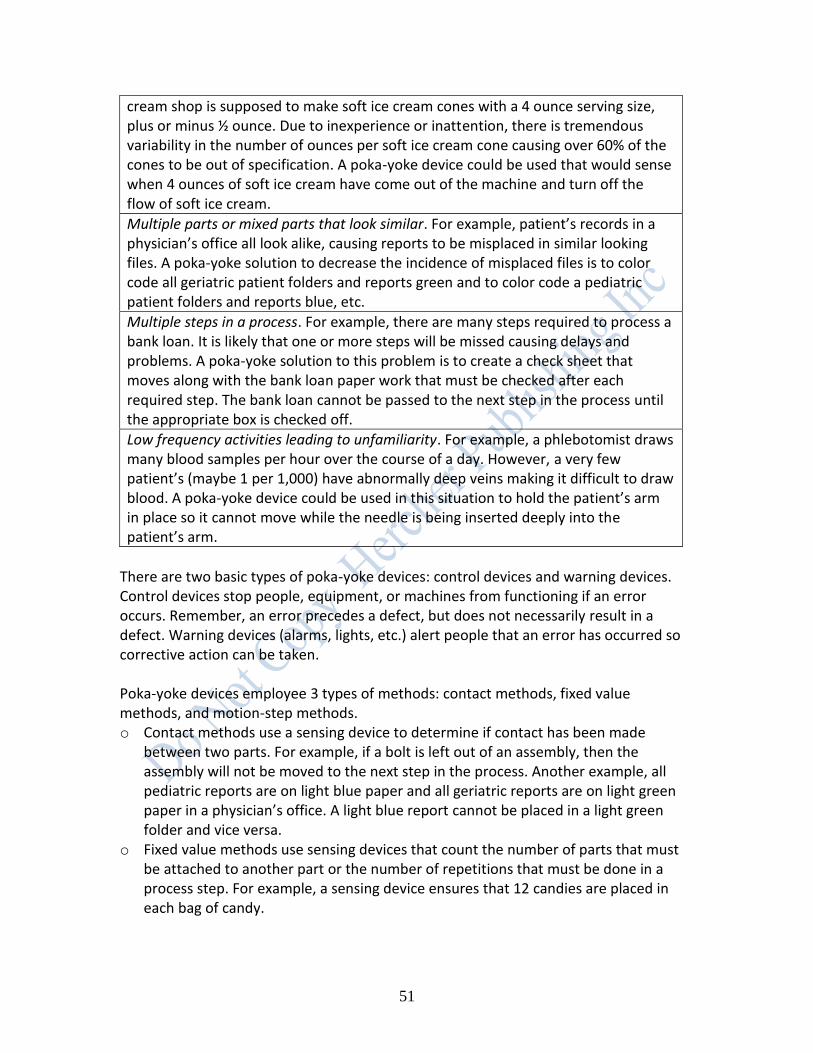
51
cream shop is supposed to make soft ice cream cones with a 4 ounce serving size, plus or minus ½ ounce. Due to inexperience or inattention, there is tremendous variability in the number of ounces per soft ice cream cone causing over 60% of the cones to be out of specification. A poka-yoke device could be used that would sense when 4 ounces of soft ice cream have come out of the machine and turn off the flow of soft ice cream.
Multiple parts or mixed parts that look similar. For example, patient’s records in a physician’s office all look alike, causing reports to be misplaced in similar looking files. A poka-yoke solution to decrease the incidence of misplaced files is to color code all geriatric patient folders and reports green and to color code a pediatric patient folders and reports blue, etc.
Multiple steps in a process. For example, there are many steps required to process a bank loan. It is likely that one or more steps will be missed causing delays and problems. A poka-yoke solution to this problem is to create a check sheet that moves along with the bank loan paper work that must be checked after each required step. The bank loan cannot be passed to the next step in the process until the appropriate box is checked off.
Low frequency activities leading to unfamiliarity. For example, a phlebotomist draws many blood samples per hour over the course of a day. However, a very few patient’s (maybe 1 per 1,000) have abnormally deep veins making it difficult to draw blood. A poka-yoke device could be used in this situation to hold the patient’s arm in place so it cannot move while the needle is being inserted deeply into the patient’s arm.
There are two basic types of poka-yoke devices: control devices and warning devices. Control devices stop people, equipment, or machines from functioning if an error occurs. Remember, an error precedes a defect, but does not necessarily result in a defect. Warning devices (alarms, lights, etc.) alert people that an error has occurred so corrective action can be taken. Poka-yoke devices employee 3 types of methods: contact methods, fixed value methods, and motion-step methods. o Contact methods use a sensing device to determine if contact has been made
between two parts. For example, if a bolt is left out of an assembly, then the assembly will not be moved to the next step in the process. Another example, all pediatric reports are on light blue paper and all geriatric reports are on light green paper in a physician’s office. A light blue report cannot be placed in a light green folder and vice versa.
o Fixed value methods use sensing devices that count the number of parts that must be attached to another part or the number of repetitions that must be done in a process step. For example, a sensing device ensures that 12 candies are placed in each bag of candy.
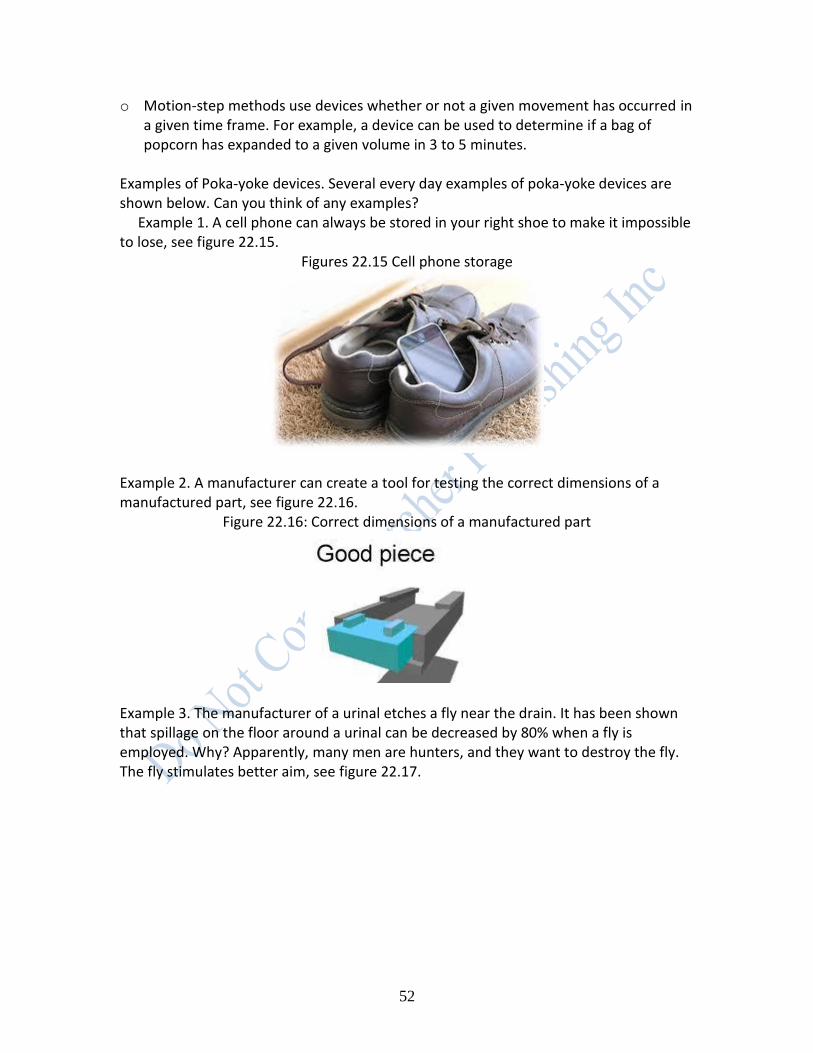
52
o Motion-step methods use devices whether or not a given movement has occurred in a given time frame. For example, a device can be used to determine if a bag of popcorn has expanded to a given volume in 3 to 5 minutes.
Examples of Poka-yoke devices. Several every day examples of poka-yoke devices are shown below. Can you think of any examples? Example 1. A cell phone can always be stored in your right shoe to make it impossible to lose, see figure 22.15.
Figures 22.15 Cell phone storage
Example 2. A manufacturer can create a tool for testing the correct dimensions of a manufactured part, see figure 22.16.
Figure 22.16: Correct dimensions of a manufactured part
Example 3. The manufacturer of a urinal etches a fly near the drain. It has been shown that spillage on the floor around a urinal can be decreased by 80% when a fly is employed. Why? Apparently, many men are hunters, and they want to destroy the fly. The fly stimulates better aim, see figure 22.17.

53
Figure 22.17: Fly etched in urinal
SUMMARY
This chapter introduced some lean tools and methods. It discussed the 5S method, Total Productive Maintenance (TPM) methods, Quick Changeovers (SMED) methods, and Mistake Proofing methods (Poka-Yoke). These methods are useful to team members when creating an improved future-state value stream, as well as just improving a process.
REFERENCES AND ADDITIONAL READINGS W. E. Deming, Quality, Productivity and Competitive Position (Cambridge, MA: Massachusetts Institute of Technology, Center for Advanced Engineering Study, 1982). Gitlow, H., Berkins, A., and He E., “Safety Sampling: A Case Study,” Quality Engineering, vol. 14, number 3, year 2002, pp. 51-65. Gitlow, H. (2009), A Guide to Lean Six Sigma, CRC Press - A Division of Taylor and Francis, (Boca Raton, FL). J. Grout and B. Downs, “A Brief Tutorial on Mistake-Proofing, Poka-Yoke, and ZQC,” (http://www.isixsigma.com/offsite.asp?A=Fr&Url=http://www.campbell.berry.edu/faculty/jgrout/tutorial.html). Productivity Development Team (1996), Quick Changeovers for Operators: The SMED System, Productivity Press (New York, NY). S. Shingo (1985), A Revolution in Manufacturing: The SMED System, Productivity press (New York, NY).

54
S. Shingo (1986), Zero Quality Control: Source Inspection and the Poka-Yoke System , Productivity Press (New York, NY). J. Venkatesh , An Introduction to Total Productive Maintenance (TPM), The Plant Maintenance Resource Center, ©1996-2005. Revised: Sunday, 27-Feb-2005.