chapter 25: metabolism and nutrition
TRANSCRIPT

Copyright 2009, John Wiley & Sons, Inc.
Chapter 25: Metabolism and
Nutrition

Copyright 2009, John Wiley & Sons, Inc.
Metabolism
Metabolism – refers to all chemical reaction occurring in body
Catabolism – break down complex molecules Exergonic – produce more energy than they consume
Anabolism – combine simple molecules into complex ones Endergonic – consume more energy than they produce
Adenosine triphosphate (ATP)
“energy currency”
ADP + P + energy ↔ ATP

Copyright 2009, John Wiley & Sons, Inc.
Role of ATP in linking anabolic and
catabolic reactions

Copyright 2009, John Wiley & Sons, Inc.
Energy transfer
Oxidation-reduction or redox reactions
Oxidation – removal of electrons
Decrease in potential energy
Dehydrogenation – removal of hydrogens
Liberated hydrogen transferred by coenzymes
Nicotinamide adenine dinucleotide (NAD)
Flavin adenine dinucleotide (FAD)
Glucose is oxidized
Reduction – addition of electrons
Increase in potential energy

Copyright 2009, John Wiley & Sons, Inc.
3 Mechanisms of ATP generation
1. Substrate-level phosphorylation
Transferring high-energy phosphate group
from an intermediate directly to ADP
2. Oxidative phosphorylation
Remove electrons and pass them through
electron transport chain to oxygen
3. Photophosphorylation
Only in chlorophyll-containing plant cells
Copyright 2009, John Wiley & Sons, Inc.
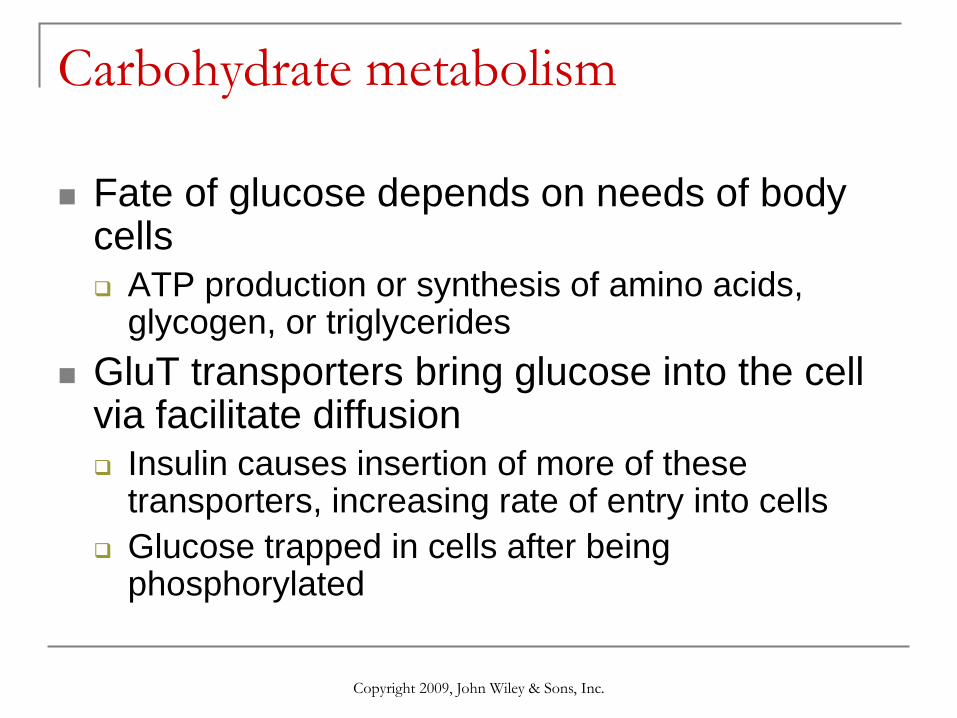
Carbohydrate metabolism
Fate of glucose depends on needs of body cells
ATP production or synthesis of amino acids, glycogen, or triglycerides
GluT transporters bring glucose into the cell via facilitate diffusion
Insulin causes insertion of more of these transporters, increasing rate of entry into cells
Glucose trapped in cells after being phosphorylated

Copyright 2009, John Wiley & Sons, Inc.
Glucose catabolism / cellular respiration
1. Glycolysis
Anaerobic respiration – does not require
oxygen
2. Formation of acetyl coenzyme A
3. Krebs cycle reactions
4. Electron transport chain reactions
Aerobic respiration – requires oxygen

Copyright 2009, John Wiley & Sons, Inc.
Overview of cellular respiration

1
NADH + 2 H+
GLYCOLYSIS 2
2
2 Pyruvic acid
1 Glucose
ATP 1
NADH + 2 H+
GLYCOLYSIS
+ 2 H+ NADH
CO2 FORMATION
OF ACETYL
COENZYME A
2
2
2
2
2 Acetyl
coenzyme A
2 Pyruvic acid
1 Glucose
ATP
2
1
NADH + 2 H+
GLYCOLYSIS
+ 2 H+ NADH
CO2 FORMATION
OF ACETYL
COENZYME A
KREBS
CYCLE + 6 H+
CO2
FADH2
NADH
2
4
6
2
2
2
2
2
2 Acetyl
coenzyme A
2 Pyruvic acid
1 Glucose
ATP
ATP
2
3
1
NADH + 2 H+
GLYCOLYSIS
+ 2 H+ NADH
CO2 FORMATION
OF ACETYL
COENZYME A
KREBS
CYCLE + 6 H+
CO2
FADH2
NADH
2
4
6
2
ELECTRON
TRANSPORT
CHAIN
e–
e–
e–
32 or 34
O2 6
6
2
2
2
2
H2O
Electrons
2 Acetyl
coenzyme A
2 Pyruvic acid
1 Glucose
ATP
ATP ATP
2
3
4

Copyright 2009, John Wiley & Sons, Inc.
Glycolysis
1. Glycolysis
Splits 6-carbon glucose into 2 3-carbon molecules of pyruvic acid
Consumes 2 ATP but generates 4
10 reactions
Fate of pyruvic acid depends on oxygen availability
If oxygen is scarce (anaerobic), reduced to lactic acid
Hepatocytes can convert it back to pyruvic acid
If oxygen is plentiful (aerobic), converted to acetyl coenzyme A

Copyright 2009, John Wiley & Sons, Inc.
Cellular respiration begins with glycolysis

Copyright 2009, John Wiley & Sons, Inc.
The 10 reactions of glycolysis

ADP
O
Glucose (1 molecule)
CH2OH
OH
OH
OH
4 1
3 2
5
6
ATP
H H
H
H HO
1
H
ADP
O
Glucose (1 molecule)
CH2OH
OH
OH
OH
4 1
3 2
5
6
Glucose 6-phosphate
O
OH
OH
OH
OH2C P
ATP
H
HO
H
H
H H
H
H
H
HO
1
2
H
H
Phosphofructokinase
ADP
O
Glucose (1 molecule)
CH2OH
OH
OH
OH
4 1
3 2
5
6
Glucose 6-phosphate
O
OH
OH
OH
CH2OH
Fructose 6-phosphate
O
OH
H
OH2C 6
5
4 3
2
1
ADP
P
OH2C P
ATP
ATP
OH
H
HO
H
H
H H
H H
H
H
HO
H
HO
1
2
3
H
H
Phosphofructokinase
ADP
O
Glucose (1 molecule)
CH2OH
OH
OH
OH
4 1
3 2
5
6
Glucose 6-phosphate
O
OH
OH
OH
CH2OH
Fructose 6-phosphate
O
OH
H
OH2C 6
5
4 3
2
1
CH2O
Fructose 1, 6-bisphosphate
O
OH
H
OH2C
ADP
P P
P
OH2C P
ATP
ATP
OH
H
HO
H
H
H H
H
H
H
H
H
H
HO
HO
H
HO
OH
1
2
3
4
H
H
Phosphofructokinase
Dihydroxyacetone
phosphate
CH2OH
CH2O
C O
Glyceraldehyde
3-phosphate
HCOH
CH2O
O H
C
ADP
O
Glucose (1 molecule)
CH2OH
OH
OH
OH
4 1
3 2
5
6
Glucose 6-phosphate
O
OH
OH
OH
CH2OH
Fructose 6-phosphate
O
OH
H
OH2C 6
5
4 3
2
1
CH2O
Fructose 1, 6-bisphosphate
O
OH
H
OH2C
ADP
P P
P
P
P
OH2C P
ATP
ATP
OH
H
HO
H
H
H H
H
H
H
H
H
H
HO
HO
H
HO
OH
1
2
3
4
5
H
H
+ 2H+ NADH
HCOH
C
CH2O
O
O 1, 3-Bisphosphoglyceric acid
(2 molecules)
2
P
P
Phosphofructokinase
Dihydroxyacetone
phosphate
CH2OH
CH2O
C O
Glyceraldehyde
3-phosphate
HCOH
CH2O
O H
C
ADP
O
Glucose (1 molecule)
CH2OH
OH
OH
OH
4 1
3 2
5
6
Glucose 6-phosphate
O
OH
OH
OH
CH2OH
Fructose 6-phosphate
O
OH
H
OH2C 6
5
4 3
2
1
CH2O
Fructose 1, 6-bisphosphate
O
OH
H
OH2C
ADP
P P
P
P
P
OH2C P
ATP
ATP
OH
H
HO
H
H
H H
H
H
H
H
H
H
HO
HO
H
HO
OH
1
2
3
4
5
6
H
H
2 NAD+ + 2 P
+ 2H+ NADH
HCOH
C
CH2O
O
COOH
O
2
2 ADP
HCOH
CH2O
1, 3-Bisphosphoglyceric acid
(2 molecules)
2
3-Phosphoglyceric acid
(2 molecules)
P
P
P
Phosphofructokinase
Dihydroxyacetone
phosphate
CH2OH
CH2O
C O
Glyceraldehyde
3-phosphate
HCOH
CH2O
O H
C
ADP
O
Glucose (1 molecule)
CH2OH
OH
OH
OH
4 1
3 2
5
6
Glucose 6-phosphate
O
OH
OH
OH
CH2OH
Fructose 6-phosphate
O
OH
H
OH2C 6
5
4 3
2
1
CH2O
Fructose 1, 6-bisphosphate
O
OH
H
OH2C
ADP
P P
P
P
P
OH2C P
ATP
ATP
ATP
OH
H
HO
H
H
H H
H
H
H
H
H
H
HO
HO
H
HO
OH
1
2
3
4
5
6
7 H
H
2 NAD+ + 2 P
+ 2H+ NADH
HCOH
C
CH2O
O
COOH
O
2
2 ADP
HCOH
CH2O
1, 3-Bisphosphoglyceric acid
(2 molecules)
2
3-Phosphoglyceric acid
(2 molecules)
COOH
CH2OH
HCO 2-Phosphoglyceric acid
(2 molecules)
P
P
P
P
Phosphofructokinase
Dihydroxyacetone
phosphate
CH2OH
CH2O
C O
Glyceraldehyde
3-phosphate
HCOH
CH2O
O H
C
ADP
O
Glucose (1 molecule)
CH2OH
OH
OH
OH
4 1
3 2
5
6
Glucose 6-phosphate
O
OH
OH
OH
CH2OH
Fructose 6-phosphate
O
OH
H
OH2C 6
5
4 3
2
1
CH2O
Fructose 1, 6-bisphosphate
O
OH
H
OH2C
ADP
P P
P
P
P
OH2C P
ATP
ATP
ATP
OH
H
HO
H
H
H H
H
H
H
H
H
H
HO
HO
H
HO
OH
1
2
3
4
5
6
7
8
H
H
2 NAD+ + 2 P
+ 2H+ NADH
HCOH
C
CH2O
O
COOH
O
2
2 ADP
HCOH
CH2O
1, 3-Bisphosphoglyceric acid
(2 molecules)
2
3-Phosphoglyceric acid
(2 molecules)
COOH
CH2OH
HCO 2-Phosphoglyceric acid
(2 molecules)
COOH
CH2
C O Phosphoenolpyruvic acid
(2 molecules) P
P
P
P
P
Phosphofructokinase
Dihydroxyacetone
phosphate
CH2OH
CH2O
C O
Glyceraldehyde
3-phosphate
HCOH
CH2O
O H
C
ADP
O
Glucose (1 molecule)
CH2OH
OH
OH
OH
4 1
3 2
5
6
Glucose 6-phosphate
O
OH
OH
OH
CH2OH
Fructose 6-phosphate
O
OH
H
OH2C 6
5
4 3
2
1
CH2O
Fructose 1, 6-bisphosphate
O
OH
H
OH2C
ADP
P P
P
P
P
OH2C P
ATP
ATP
ATP
OH
H
HO
H
H
H H
H
H
H
H
H
H
HO
HO
H
HO
OH
1
2
3
4
5
6
7
8
9
H
H
2 NAD+ + 2 P
+ 2H+ NADH
2 NAD+ + 2
HCOH
C
CH2O
O
COOH
O
2
2 ADP
P
HCOH
CH2O
1, 3-Bisphosphoglyceric acid
(2 molecules)
2
3-Phosphoglyceric acid
(2 molecules)
COOH
CH2OH
HCO 2-Phosphoglyceric acid
(2 molecules)
Pyruvic acid
(2 molecules)
COOH
CH2
2
2 ADP
C O Phosphoenolpyruvic acid
(2 molecules)
COOH
CH 3
C O
P
P
P
P
P
Phosphofructokinase
Dihydroxyacetone
phosphate
CH2OH
CH2O
C O
Glyceraldehyde
3-phosphate
HCOH
CH2O
O H
C
ADP
O
Glucose (1 molecule)
CH2OH
OH
OH
OH
4 1
3 2
5
6
Glucose 6-phosphate
O
OH
OH
OH
CH2OH
Fructose 6-phosphate
O
OH
H
OH2C 6
5
4 3
2
1
CH2O
Fructose 1, 6-bisphosphate
O
OH
H
OH2C
ADP
P P
P
P
P
OH2C P
ATP
ATP
ATP
ATP
OH
H
HO
H
H
H H
H
H
H
H
H
H
HO
HO
H
HO
OH
1
2
3
4
5
6
7
8
9
10
H
H

Copyright 2009, John Wiley & Sons, Inc.
Formation of Acetyl coenzyme A
2. Formation of Acetyl coenzyme A
Each pyruvic acid converted to 2-carbon acetyl
group
Remove one molecule of CO2 as a waste product
Each pyruvic acid also loses 2 hydrogen atoms
NAD+ reduced to NADH + H+
Acetyl group attached to coenzyme A to form
acetyl coenzyme A (acetyl CoA)

Copyright 2009, John Wiley & Sons, Inc.
Fate of pyruvic acid
Copyright 2009, John Wiley & Sons, Inc.
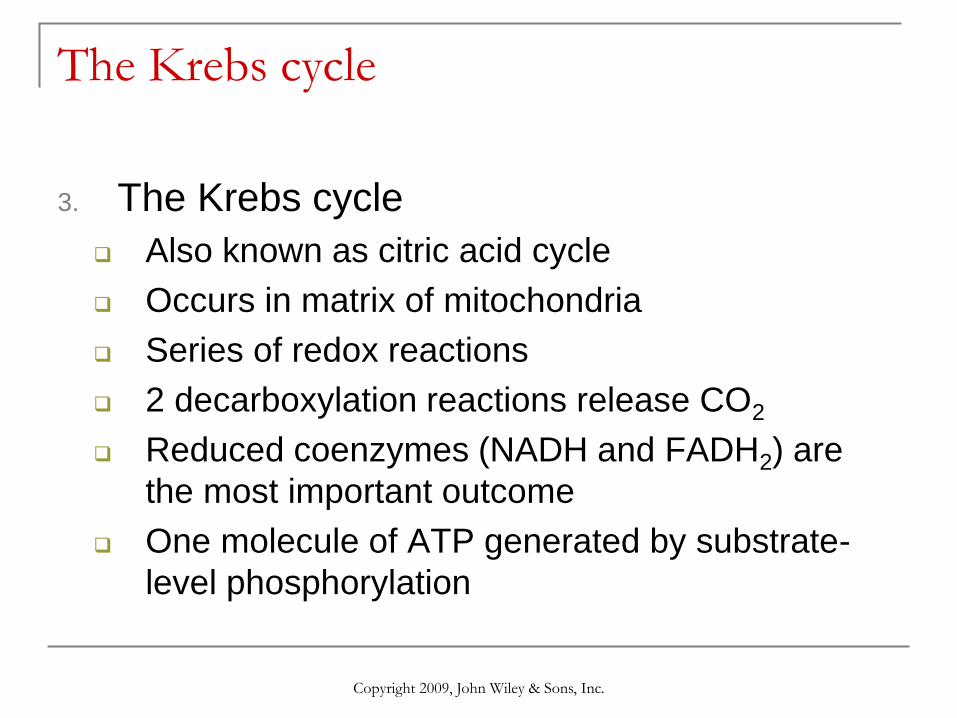
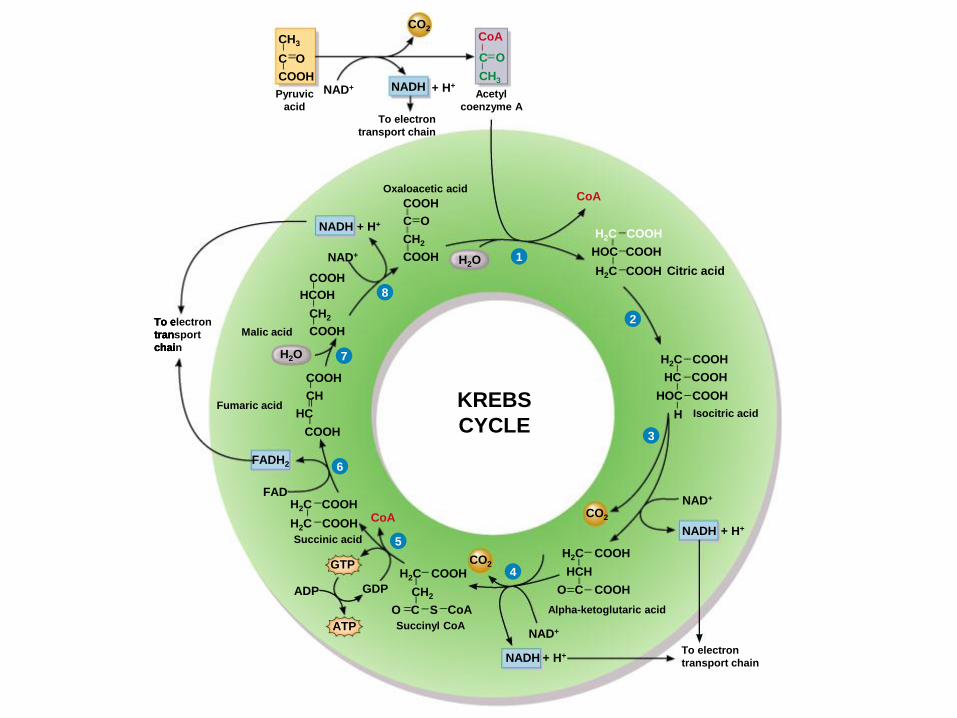
The Krebs cycle
3. The Krebs cycle
Also known as citric acid cycle
Occurs in matrix of mitochondria
Series of redox reactions
2 decarboxylation reactions release CO2
Reduced coenzymes (NADH and FADH2) are
the most important outcome
One molecule of ATP generated by substrate-
level phosphorylation

Copyright 2009, John Wiley & Sons, Inc.
The Krebs Cycle
Copyright 2009, John Wiley & Sons, Inc.
The Eight reactions of the Krebs cycle
1
C
CH2
COOH
O
Oxaloacetic acid
COOH Citric acid
H2C COOH
COOH HOC
H2C COOH
+ H+
Pyruvic
acid
Acetyl
coenzyme A
C
CH3
O
CH3
C
COOH
O
To electron
transport chain
H2O
CO2
NAD+
KREBS
CYCLE
NADH
CoA
CoA
1
C
CH2
COOH
O
Oxaloacetic acid
COOH
Isocitric acid
H2C COOH
HOC COOH
HC COOH
H
Citric acid
H2C COOH
COOH HOC
H2C COOH
+ H+
Pyruvic
acid
Acetyl
coenzyme A
C
CH3
O
CH3
C
COOH
O
To electron
transport chain
H2O
CO2
NAD+
KREBS
CYCLE
NADH
CoA
CoA
2
1
To electron
transport chain
CO2
+ H+
C
CH2
COOH
O
Oxaloacetic acid
COOH
Alpha-ketoglutaric acid
H2C COOH
HCH
C COOH
Isocitric acid
H2C COOH
HOC COOH
HC COOH
H
Citric acid
H2C COOH
COOH HOC
H2C COOH
NAD+
+ H+
Pyruvic
acid
Acetyl
coenzyme A
C
CH3
O
CH3
C
COOH
O
To electron
transport chain
H2O
CO2
NAD+
KREBS
CYCLE
NADH
NADH
CoA
CoA
2
3
O
1
To electron
transport chain
CO2
+ H+ NADH
CO2
+ H+
C
CH2
COOH
O
Oxaloacetic acid
COOH
Succinyl CoA
H2C COOH
CH2
C S CoA Alpha-ketoglutaric acid
H2C COOH
HCH
C COOH
Isocitric acid
H2C COOH
HOC COOH
HC COOH
H
Citric acid
H2C COOH
COOH HOC
H2C COOH
NAD+
NAD+
+ H+
Pyruvic
acid
Acetyl
coenzyme A
C
CH3
O
CH3
C
COOH
O
To electron
transport chain
H2O
CO2
NAD+
KREBS
CYCLE
NADH
NADH
O
CoA
O
CoA
2
3
4
1
To electron
transport chain
CO2
+ H+ NADH
CO2
+ H+
C
CH2
COOH
O
Oxaloacetic acid
COOH
H2C COOH
H2C COOH
Succinic acid
Succinyl CoA
H2C COOH
CH2
C S CoA Alpha-ketoglutaric acid
H2C COOH
HCH
C COOH
Isocitric acid
H2C COOH
HOC COOH
HC COOH
H
Citric acid
H2C COOH
COOH HOC
H2C COOH
NAD+
NAD+
GDP
+ H+
Pyruvic
acid
Acetyl
coenzyme A
C
CH3
O
CH3
C
COOH
O
To electron
transport chain
ADP
H2O
CO2
NAD+
KREBS
CYCLE
NADH
NADH
ATP
GTP
O
CoA
CoA
O
CoA
2
3
4
5
1
To electron
transport chain
CO2
+ H+ NADH
CO2
+ H+
To electron
transport
chain
C
CH2
COOH
O
Oxaloacetic acid
COOH
H2C COOH
H2C COOH
Succinic acid
Succinyl CoA
H2C COOH
CH2
C S CoA Alpha-ketoglutaric acid
H2C COOH
HCH
C COOH
Isocitric acid
H2C COOH
HOC COOH
HC COOH
H
Citric acid
H2C COOH
COOH HOC
H2C COOH
Fumaric acid
NAD+
NAD+
GDP
FAD
HC
CH
+ H+
Pyruvic
acid
Acetyl
coenzyme A
C
CH3
O
CH3
C
COOH
O
To electron
transport chain
ADP
FADH2
COOH
COOH
H2O
CO2
NAD+
KREBS
CYCLE
NADH
NADH
ATP
GTP
CoA
CoA
O
CoA
2
3
4
5
6
O
1
To electron
transport chain
CO2
+ H+ NADH
CO2
+ H+
To electron
transport
chain
C
CH2
COOH
O
Oxaloacetic acid
COOH
HCOH
CH2
COOH
COOH
H2C COOH
H2C COOH
Succinic acid
Malic acid
Succinyl CoA
H2C COOH
CH2
C S CoA Alpha-ketoglutaric acid
H2C COOH
HCH
C COOH
Isocitric acid
H2C COOH
HOC COOH
HC COOH
H
Citric acid
H2C COOH
COOH HOC
H2C COOH
Fumaric acid
NAD+
NAD+
GDP
FAD
HC
CH
+ H+
Pyruvic
acid
Acetyl
coenzyme A
C
CH3
O
CH3
C
COOH
O
To electron
transport chain
ADP
FADH2
COOH
COOH
H2O
H2O
CO2
NAD+
KREBS
CYCLE
NADH
NADH
ATP
GTP
CoA
CoA
O
CoA
2
3
4
5
6
7
O
1
To electron
transport chain
CO2
+ H+ NADH
CO2
+ H+
To electron
transport
chain
C
CH2
COOH
O
Oxaloacetic acid
COOH
+ H+ NADH
HCOH
CH2
COOH
COOH
H2C COOH
H2C COOH
Succinic acid
Malic acid
Succinyl CoA
H2C COOH
CH2
C S CoA Alpha-ketoglutaric acid
H2C COOH
HCH
C COOH
Isocitric acid
H2C COOH
HOC COOH
HC COOH
H
Citric acid
H2C COOH
COOH HOC
H2C COOH
Fumaric acid
NAD+
NAD+
GDP
FAD
NAD+
HC
CH
+ H+
Pyruvic
acid
Acetyl
coenzyme A
C
CH3
O
CH3
C
COOH
O
To electron
transport chain
ADP
FADH2
COOH
COOH
H2O
H2O
CO2
NAD+
KREBS
CYCLE
NADH
NADH
ATP
GTP
CoA
CoA
O
CoA
2
3
4
5
6
7
8
O

Copyright 2009, John Wiley & Sons, Inc.
Electron transport chain
4. Electron transport chain
Series of electron carriers in inner mitochondrial
membrane reduced and oxidized
As electrons pass through chain, exergonic
reactions release energy used to form ATP
Chemiosmosis
Final electron acceptor is oxygen to form water
Copyright 2009, John Wiley & Sons, Inc.
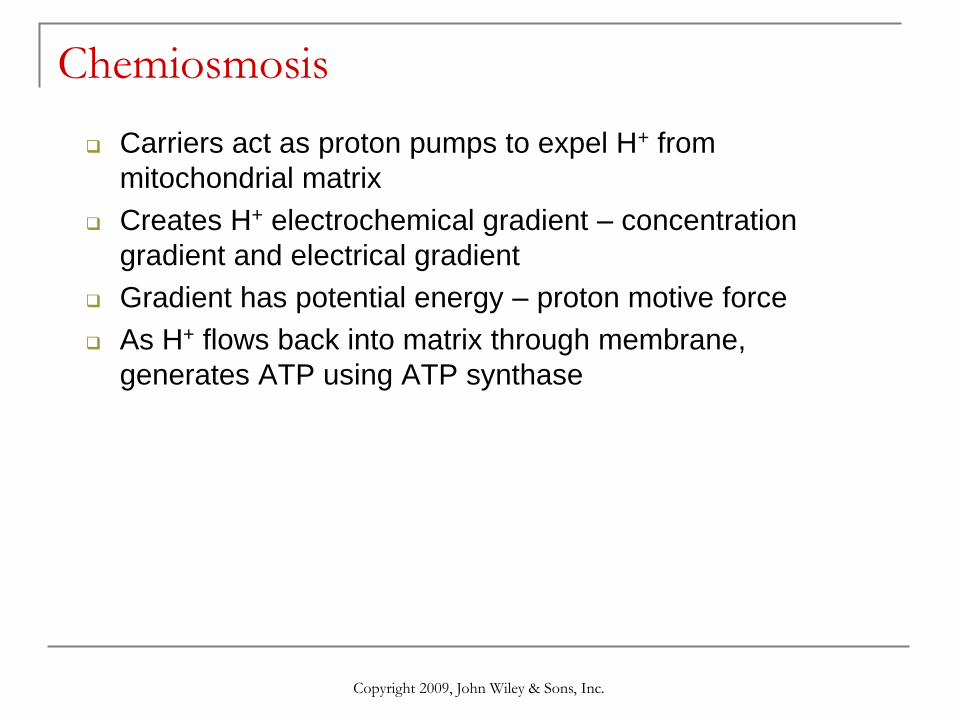
Chemiosmosis
Carriers act as proton pumps to expel H+ from
mitochondrial matrix
Creates H+ electrochemical gradient – concentration
gradient and electrical gradient
Gradient has potential energy – proton motive force
As H+ flows back into matrix through membrane,
generates ATP using ATP synthase

Energy from
NADH + H+
H+
Low H+ concentration in
matrix of mitochondrion
Inner
mitochondrial
membrane
Matrix
High H+ concentration
between inner and
outer mitochondrial
membranes
Outer membrane
Inner membrane
H+
channel
Electron
transport
chain
(includes
proton pumps)
1 Energy from
NADH + H+
H+ H+
Low H+ concentration in
matrix of mitochondrion
Inner
mitochondrial
membrane
Matrix
High H+ concentration
between inner and
outer mitochondrial
membranes
Outer membrane
Inner membrane
H+
channel
Electron
transport
chain
(includes
proton pumps)
1
2
Energy from
NADH + H+
H+ H+
ADP +
ATP synthase Low H+ concentration in
matrix of mitochondrion
Inner
mitochondrial
membrane
Matrix
High H+ concentration
between inner and
outer mitochondrial
membranes
Outer membrane
Inner membrane
H+
channel
Electron
transport
chain
(includes
proton pumps)
P
ATP
1
2
3

Copyright 2009, John Wiley & Sons, Inc.
The actions of the three proton pumps and ATP synthase
in the inner membrane of mitochondria
Space between outer and inner mitochondrial membranes
Inner mito- chondrial membrane
Mitochondrial matrix
H+ channel
NADH dehydrogenase complex: FMN and five Fe-S centers
NAD
e–
H+ + + + + + + +
– – – – – – –
Q
NADH + H+
1
Space between outer and inner mitochondrial membranes
Inner mito- chondrial membrane
Mitochondrial matrix
H+ channel
NADH dehydrogenase complex: FMN and five Fe-S centers
Cytochrome b-c1 complex: cyt b, cyt c1, and an Fe-S center
NAD
e–
e–
e–
H+ + + + + + + +
– – – – – – –
Q
Cyt c
NADH + H+ H+
1 2
Space between outer and inner mitochondrial membranes
Inner mito- chondrial membrane
Mitochondrial matrix
H+ channel
NADH dehydrogenase complex: FMN and five Fe-S centers
Cytochrome b-c1 complex: cyt b, cyt c1, and an Fe-S center
Cytochrome oxidase complex: cyt a, cyt a3,and two Cu
NAD
1 1/2 O2
e–
e–
e–
e–
e–
H+ H+ H+
+ + + + + + +
– – – – – – –
H2O
Q
Cyt c
NADH + H+ H+
3
ADP +
ATP synthase
P
ATP
1 2 3
3

Copyright 2009, John Wiley & Sons, Inc.
Summary of cellular respiration
Copyright 2009, John Wiley & Sons, Inc.
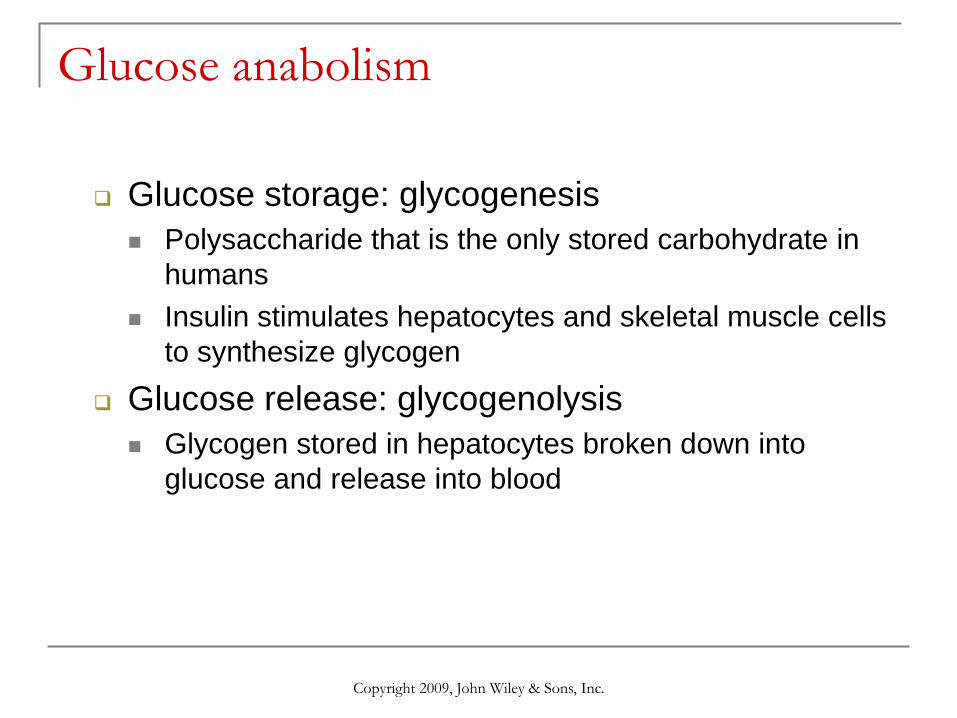
Glucose anabolism
Glucose storage: glycogenesis
Polysaccharide that is the only stored carbohydrate in
humans
Insulin stimulates hepatocytes and skeletal muscle cells
to synthesize glycogen
Glucose release: glycogenolysis
Glycogen stored in hepatocytes broken down into
glucose and release into blood

Copyright 2009, John Wiley & Sons, Inc.
Glycogenesis and glycogenolysis
Copyright 2009, John Wiley & Sons, Inc.
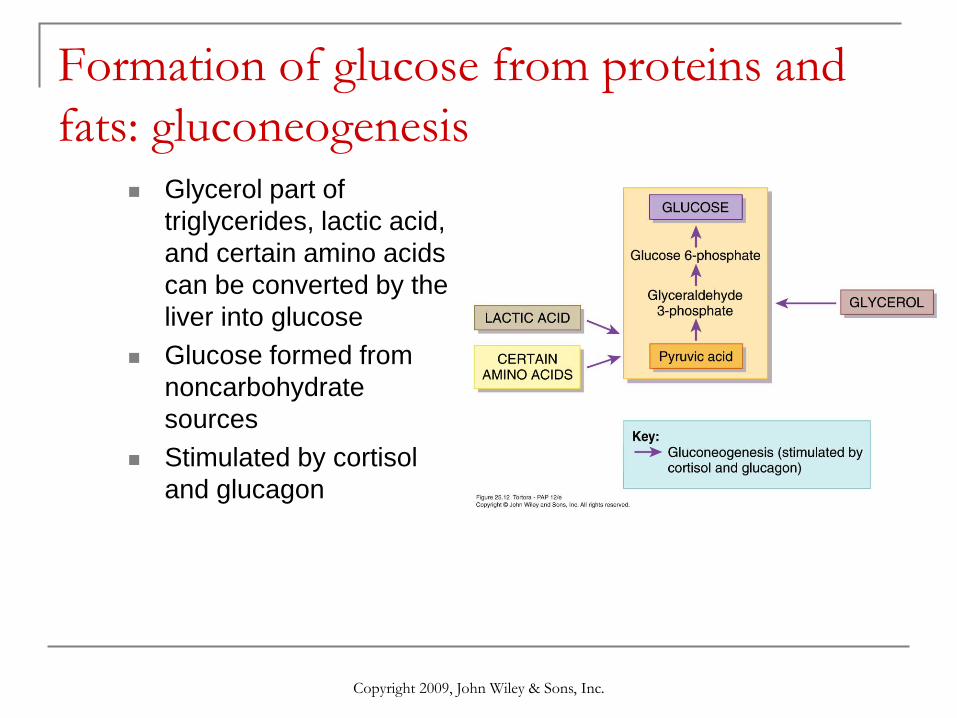
Formation of glucose from proteins and
fats: gluconeogenesis
Glycerol part of
triglycerides, lactic acid,
and certain amino acids
can be converted by the
liver into glucose
Glucose formed from
noncarbohydrate
sources
Stimulated by cortisol
and glucagon

Copyright 2009, John Wiley & Sons, Inc.
Lipid metabolism
Transport by lipoproteins
Most lipids nonpolar and
hydrophobic
Made more water-soluble
by combining them with
proteins to form lipoproteins
Proteins in outer shell called
apoproteins (apo)
Each has specific functions
All essentially are transport
vehicles

Copyright 2009, John Wiley & Sons, Inc.
Apoproteins Apoproteins categorized and named according to density (ratio of
lipids to proteins)
Chylomicrons
Form in small intestine mucosal epithelial cells
Transport dietary lipids to adipose tissue
Very low-density lipoproteins (VLDLs)
Form in hepatocytes
Transport endogenous lipids to adipocytes
Low-density lipoproteins (LDLs) – “bad” cholesterol
Carry 75% of total cholesterol in blood
Deliver to body cells for repair and synthesis
Can deposit cholesterol in fatty plaques
High-density lipoproteins (HDLs) – “good” cholesterol
Remove excess cholesterol from body cells and blood
Deliver to liver for elimination

Copyright 2009, John Wiley & Sons, Inc.
Lipid Metabolism
2 sources of cholesterol in the body Present in foods
Synthesized by hepatocytes
As total blood cholesterol increases, risk of coronary artery disease begins to rise Treated with exercise, diet, and drugs
Lipids can be oxidized to provide ATP Stored in adipose tissue if not needed for ATP
Major function of adipose tissue to remove triglycerides from chylomicrons and VLDLs and store it until needed 98% of all body energy reserves

Copyright 2009, John Wiley & Sons, Inc.
Lipid Metabolism
Lipid catabolism: lipolysis
Triglycerides split into glycerol and fatty acids
Must be done for muscle, liver, and adipose tissue to oxidize fatty acids
Enhanced by epinephrine and norepinephrine
Lipid anabolism: lipogenesis
Liver cells and adipose cells synthesize lipids from glucose or amino acids
Occurs when more calories are consumed than needed for ATP production

Copyright 2009, John Wiley & Sons, Inc.
Pathways of lipid metabolism
Copyright 2009, John Wiley & Sons, Inc.
Protein metabolism
Amino acids are either oxidized to produce ATP or used to synthesize new proteins
Excess dietary amino acids are not excreted but converted into glucose (gluconeogenesis) or triglycerides (lipogenesis)
Protein catabolism
Proteins from worn out cells broken down into amino acids
Before entering Krebs cycle amino group must be removed – deamination
Produces ammonia, liver cells convert to urea, excreted in urine

Copyright 2009, John Wiley & Sons, Inc.
Various points at which amino acids enter
the Krebs cycle for oxidation

Copyright 2009, John Wiley & Sons, Inc.
Protein anabolism
Carried out in ribosomes of almost every cell in the body
10 essential amino acids in the human
Must be present in the diet because they cannot be
synthesized
Complete protein – contains sufficient amounts of all essential
amino acids – beef, fish, poultry, eggs
Incomplete protein – does not – leafy green vegetables,
legumes, grains
10 other nonessential amino acids can be synthesized by
body cells using transamination

Copyright 2009, John Wiley & Sons, Inc.
Key molecules at metabolic crossroads
3 molecules play pivotal roles in metabolism
Stand at metabolic crossroads – reactions
that occur or not depend on nutritional or
activity status of individual
1. Glucose 6-phosphate
Made shortly after glucose enters body cell
4 fates – synthesis of glycogen, release of
glucose into blood stream, synthesis of nucleic
acids, glycolysis

Copyright 2009, John Wiley & Sons, Inc.
Key molecules at metabolic crossroads
2. Pyruvic acid
If there is enough oxygen, aerobic cellular respiration
occurs
If there is not enough oxygen, anaerobic reactions can
produce lactic acid, produce alanine or gluconeogenesis
3. Acetyl Coenzyme A
When ATP is low and oxygen plentiful, most pyruvic acid
goes to ATP production via Acetyl CoA
Acetyl CoA os the entry into the Krebs cycle
Can also be used for synthesis of certain lipids

Copyright 2009, John Wiley & Sons, Inc.
Metabolic adaptations
During the absorptive state ingested nutrients are entering the blood stream
Glucose readily available for ATP production
During postabsorptive state absorption of nutrients from GI tract complete
Energy needs must be met by fuels in the body
Nervous system and red blood cells depend on glucose so maintaining steady blood glucose critical
Effects of insulin dominate

Copyright 2009, John Wiley & Sons, Inc.
Metabolism during absorptive state
Soon after a meal nutrients enter blood
Glucose, amino acids, and triglycerides in chylomicrons
2 metabolic hallmarks
Oxidation of glucose for ATP production in all body cells
Storage of excess fuel molecules in hepatocytes,
adipocytes, and skeletal muscle cells
Pancreatic beta cells release insulin
Promotes entry of glucose and amino acids into cells

Copyright 2009, John Wiley & Sons, Inc.
Principal metabolic pathways during the
absorptive state

AMINO ACIDS GLUCOSE TRIGLYCERIDES
(in chylomicrons)
Blood
GLUCOSE
GASTROINTESTINAL TRACT
+ H2O + CO2
MOST TISSUES
Oxidation
ATP
1
AMINO ACIDS GLUCOSE TRIGLYCERIDES
(in chylomicrons)
Blood
GLUCOSE
GASTROINTESTINAL TRACT
HEPATOCYTES IN LIVER
+ H2O + CO2
MOST TISSUES
Oxidation
ATP
Fatty acids
Triglycerides
Glyceraldehyde
3-phosphate Glycogen
Glucose
+ H2O + CO2 ATP
1
2
AMINO ACIDS GLUCOSE TRIGLYCERIDES
(in chylomicrons)
Blood
GLUCOSE
GASTROINTESTINAL TRACT
HEPATOCYTES IN LIVER
+ H2O + CO2
MOST TISSUES
Oxidation
ATP
Triglycerides
ADIPOSE TISSUE
VLDLs
Triglycerides
Fatty acids
Triglycerides
Glyceraldehyde
3-phosphate Glycogen
Glucose
+ H2O + CO2 ATP
1
2
3
AMINO ACIDS GLUCOSE TRIGLYCERIDES
(in chylomicrons)
Blood
GLUCOSE
GASTROINTESTINAL TRACT
GLUCOSE
HEPATOCYTES IN LIVER
SKELETAL
MUSCLE
Storage
+ H2O + CO2
MOST TISSUES
Oxidation
ATP
Triglycerides
ADIPOSE TISSUE
VLDLs
Fatty
acids
Triglycerides
Glyceraldehyde
3-phosphate
Glucose
Fatty acids
Triglycerides
Glyceraldehyde
3-phosphate Glycogen
Glucose
Glycogen Glycogen
+ H2O + CO2 ATP
1
2
3
4
4
AMINO ACIDS GLUCOSE TRIGLYCERIDES
(in chylomicrons)
Blood
GLUCOSE
GASTROINTESTINAL TRACT
GLUCOSE
HEPATOCYTES IN LIVER
SKELETAL
MUSCLE
Storage
+ H2O + CO2
MOST TISSUES
Oxidation
ATP
Triglycerides
ADIPOSE TISSUE
VLDLs
Triglycerides
Fatty
acids
Triglycerides
Glyceraldehyde
3-phosphate
Glucose
Fatty acids
Triglycerides
Glyceraldehyde
3-phosphate Glycogen
Glucose
Glycogen Glycogen
+ H2O + CO2 ATP
1
2
3
4 5
4
AMINO ACIDS GLUCOSE TRIGLYCERIDES
(in chylomicrons)
Blood
GLUCOSE
GASTROINTESTINAL TRACT
GLUCOSE
HEPATOCYTES IN LIVER
SKELETAL
MUSCLE
Storage
+ H2O + CO2
MOST TISSUES
Oxidation
ATP
Triglycerides
ADIPOSE TISSUE
VLDLs
Triglycerides
Fatty
acids
Triglycerides
Glyceraldehyde
3-phosphate
Glucose
Keto acids
Fatty acids
Triglycerides
Glyceraldehyde
3-phosphate Glycogen
Glucose
Glycogen Glycogen
+ H2O + CO2 ATP
1
2
3
4 5
6
4
AMINO ACIDS GLUCOSE TRIGLYCERIDES
(in chylomicrons)
Blood
GLUCOSE
GASTROINTESTINAL TRACT
GLUCOSE
HEPATOCYTES IN LIVER
SKELETAL
MUSCLE
Storage
+ H2O + CO2
MOST TISSUES
Oxidation
ATP
Triglycerides
ADIPOSE TISSUE
VLDLs
Triglycerides
Fatty
acids
Triglycerides
Glyceraldehyde
3-phosphate
Glucose
Keto acids
Fatty acids Proteins
Triglycerides
Glyceraldehyde
3-phosphate Glycogen
Glucose
Glycogen Glycogen
+ H2O + CO2 ATP
1
2
3
4 5
6
7
4
AMINO ACIDS GLUCOSE TRIGLYCERIDES
(in chylomicrons)
Blood
GLUCOSE
GASTROINTESTINAL TRACT
GLUCOSE
HEPATOCYTES IN LIVER
SKELETAL
MUSCLE
Storage
+ H2O + CO2
MOST TISSUES
Oxidation
ATP
Triglycerides
ADIPOSE TISSUE
VLDLs
Triglycerides
Fatty
acids
Triglycerides
Glyceraldehyde
3-phosphate
Glucose
Keto acids
Fatty acids Proteins
Triglycerides
Glyceraldehyde
3-phosphate Glycogen
Glucose
Glycogen Glycogen
Proteins Proteins
+ H2O + CO2 ATP
1
2
3
4 5
6
7
8
4

Copyright 2009, John Wiley & Sons, Inc.
Metabolism during postabsorptive state
About 4 hours after the last meal absorption in small intestine nearly complete
Blood glucose levels start to fall
Main metabolic challenge to maintain normal blood glucose levels
Glucose production
Breakdown of liver glycogen, lipolysis, gluconeogenesis using lactic acid and/or amino acids
Glucose conservation
Oxidation of fatty acids, lactic acid, amino acids, ketone bodies and breakdown of muscle glycogen

Copyright 2009, John Wiley & Sons, Inc.
Principal metabolic pathways during the
postabsorptive state

1
Liver glycogen
Glucose
LIVER
Blood
HEART ADIPOSE TISSUE SKELETAL MUSCLE TISSUE
OTHER TISSUES
1
Liver glycogen
Glucose
LIVER
Glycerol
Blood
HEART
Fatty acids Glycerol
Triglycerides ADIPOSE TISSUE
SKELETAL MUSCLE TISSUE
OTHER TISSUES
2
Fatty acids
1
Liver glycogen
Glucose
LIVER
Lactic acid
Glycerol
Blood
HEART
Fatty acids Glycerol
Triglycerides ADIPOSE TISSUE
SKELETAL MUSCLE TISSUE
OTHER TISSUES
3
2
Fatty acids
1
Liver glycogen
Keto acids
Glucose
Amino acids
LIVER
Lactic acid
Glycerol
Blood
HEART
Muscle proteins
Fatty acids Glycerol
Triglycerides ADIPOSE TISSUE
Fasting or
starvation
SKELETAL MUSCLE TISSUE
OTHER TISSUES
Proteins Amino acids
Amino acids
4
4
3
4
2
Fatty acids
1
Liver glycogen
Keto acids
Glucose
Amino acids
LIVER
Lactic acid
Glycerol
Blood
HEART
Fatty acids
Muscle proteins
Fatty acids Glycerol
Triglycerides ADIPOSE TISSUE
Fasting or
starvation
SKELETAL MUSCLE TISSUE
OTHER TISSUES
Fatty acids
Proteins Amino acids
Amino acids Fatty acids
ATP
ATP
ATP
4
5
5
4
3
5
4
2
Fatty acids
1
Liver glycogen
Keto acids
Glucose
Amino acids
LIVER
Lactic acid
Glycerol
Blood
HEART
Fatty acids
Muscle proteins
Fatty acids Glycerol
Triglycerides ADIPOSE TISSUE
Fasting or
starvation
SKELETAL MUSCLE TISSUE
OTHER TISSUES
Fatty acids
Proteins Amino acids
Amino acids Fatty acids
Lactic acid
ATP
ATP
ATP
ATP
4
5
5
6
4
3
5
4
2
Fatty acids
1
Liver glycogen
Keto acids
Glucose
Amino acids
LIVER
Lactic acid
Glycerol
Blood
HEART
Fatty acids
Muscle proteins
Fatty acids Glycerol
Triglycerides ADIPOSE TISSUE
Fasting or
starvation
SKELETAL MUSCLE TISSUE
OTHER TISSUES
Fatty acids
Proteins Amino acids
Amino acids Fatty acids
Lactic acid
ATP
ATP ATP
ATP
ATP
4
5
5
6 7
4
3
5
4
2
Fatty acids
1
Liver glycogen
Keto acids
Glucose
Amino acids
LIVER
Fatty acids
Lactic acid
Ketone bodies
Glycerol
Blood
NERVOUS
TISSUE Ketone
bodies
Glucose
Starvation
HEART
Fatty acids
Muscle proteins
Fatty acids Glycerol
Triglycerides ADIPOSE TISSUE
Fasting or
starvation
SKELETAL MUSCLE TISSUE
Ketone bodies
OTHER TISSUES
Fatty acids
Proteins Amino acids
Amino acids Fatty acids
Ketone bodies
Lactic acid
ATP
ATP
ATP
ATP
ATP
ATP
ATP
ATP
ATP ATP
4
5
8
5
6
8 8
7
4
3
5
4
2
8
1
Liver glycogen
Keto acids
Glucose
Amino acids
LIVER
Fatty acids
Lactic acid
Ketone bodies
Glycerol
Blood
NERVOUS
TISSUE Ketone
bodies
Glucose
Starvation
HEART
Fatty acids
Muscle proteins
Fatty acids Glycerol
Triglycerides ADIPOSE TISSUE
Fasting or
starvation
SKELETAL MUSCLE TISSUE
Ketone bodies
OTHER TISSUES
Fatty acids
Proteins Amino acids
Glucose
6-phosphate
Pyruvic acid
Lactic
acid
Muscle glycogen
(aerobic) (anaerobic)
Amino acids Fatty acids
Ketone bodies
Lactic acid
ATP
O2
ATP
ATP
ATP
ATP
ATP
ATP
ATP
ATP
ATP
ATP ATP
+ O2 –
4
5
8
5
6
8 8
7
4
3
9
5
4
2
8

Copyright 2009, John Wiley & Sons, Inc.
Hormones and autonomic nervous system
regulate metabolism during postabsorptive
state
As blood glucose decline, insulin secretion falls
Glucagon – increases release of glucose into blood via
gluconeogenesis and glycogenolysis
Sympathetic nerve endings of ANS release
norepinephrine and adrenal medulla releases
epinephrine and norepinephrine
Stimulate lipolysis, glycogen breakdown

Copyright 2009, John Wiley & Sons, Inc.
Heat and energy balance
Heat – form of energy that can be measured as
temperature and can be expressed in calories
calorie (cal) – amount of heat required to raise 1 gram of
water 1°C
Kilocalorie (kcal) or Calorie (Cal) is 1000 calories
Metabolic rate – overall rate at which metabolic
reactions use energy
Some energy used to make ATP, some lost as heat
Basal metabolic rate (BMR) – measurement with body in
quiet, resting, fasting condition

Copyright 2009, John Wiley & Sons, Inc.
Body temperature homeostasis
Despite wide fluctuations in environmental
temperatures, homeostatic mechanisms maintain
normal range for internal body temperature
Core temperature (37°C or 98.6°F) versus shell
temperature (1-6°C lower)
Heat produced by exercise, some hormones,
sympathetic nervous system, fever, ingestion of
food, younger age, etc.

Copyright 2009, John Wiley & Sons, Inc.
Heat and engery balance
Heat can be lost through
Conduction to solid materials in contact with body
Convection – transfer of heat by movement of a gas or liquid
Radiation – transfer of heat in form of infrared rays
Evaporation exhaled air and skin surface (insensible water loss)
Hypothalamic thermostat in preoptic area
Heat-losing center and heat-promoting center
Copyright 2009, John Wiley & Sons, Inc.
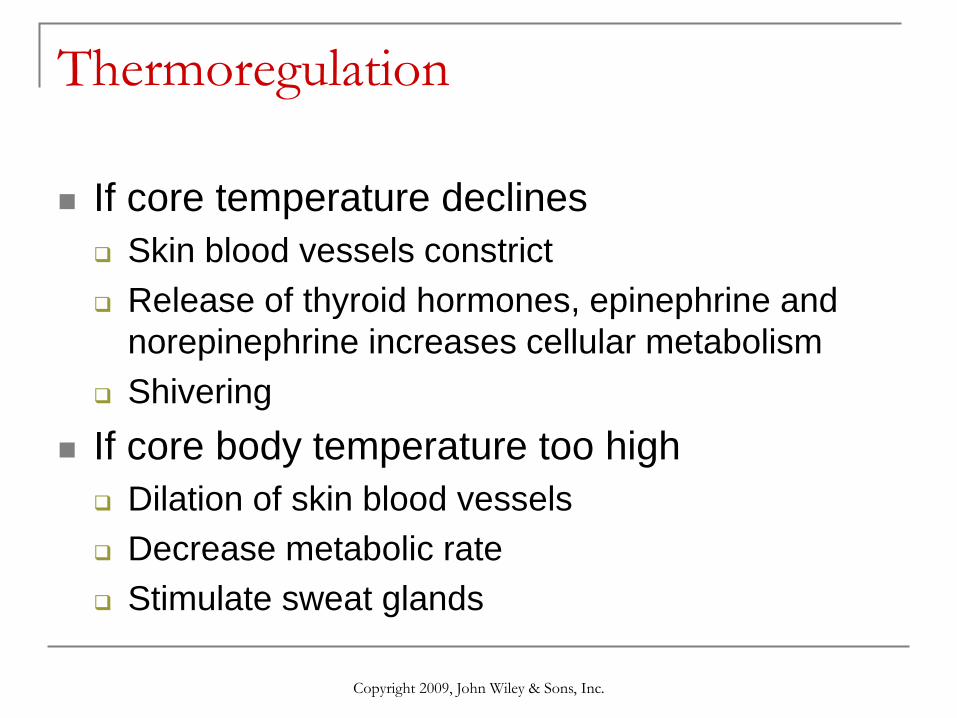
Thermoregulation
If core temperature declines
Skin blood vessels constrict
Release of thyroid hormones, epinephrine and
norepinephrine increases cellular metabolism
Shivering
If core body temperature too high
Dilation of skin blood vessels
Decrease metabolic rate
Stimulate sweat glands

Copyright 2009, John Wiley & Sons, Inc.
Negative feedback mechanisms that
conserve heat and increase increase
production
Copyright 2009, John Wiley & Sons, Inc.
Nutrition
Nutrients are chemical substances in food that body
cells use for growth, maintenance, and repair
6 main types
1. Water – needed in largest amount
2. Carbohydrates
3. Lipids
4. Proteins
5. Minerals
6. Vitamins
Essential nutrients must be obtained from the diet

Copyright 2009, John Wiley & Sons, Inc.
Guidelines for healthy eating
We do not know with certainty what levels and types of
carbohydrates, fat and protein are optimal
Different populations around the world eat radically
different diets adapted to their particular lifestyle
Basic guidelines
Eat a variety of foods
Maintain a healthy weight
Choose foods low in fat, saturated fat and cholesterol
Eat plenty of vegetables, fruits and grain products
Use sugars in moderation only

Copyright 2009, John Wiley & Sons, Inc.
MyPyramid

Copyright 2009, John Wiley & Sons, Inc.
Minerals
Inorganic elements that occur naturally in Earth’s
crust
Eat foods that contain enough calcium,
phosphorus, iron and iodine
Excess amounts of most minerals are excreted in
urine and feces
Major role of minerals to help regulate enzymatic
reactions

Copyright 2009, John Wiley & Sons, Inc.
Vitamins
Organic nutrients required in small amounts to maintain
growth and normal metabolism
Do not provide energy or serve as body’s building materials
Most are coenzymes
Most cannot be synthesized by the body
Vitamin K produced by bacteria in GI tract
Some can be assembled from provitamins
No single food contains all the required vitamins
2 groups
Fat-soluble – A, D, E, K
Water-soluble – several B vitamins and vitamin C

Copyright 2009, John Wiley & Sons, Inc.
End of Chapter 25
Copyright 2009 John Wiley & Sons, Inc. All rights reserved. Reproduction or translation of this work beyond that permitted in section 117 of the 1976 United States Copyright Act without express permission of the copyright owner is unlawful. Request for further information should be addressed to the Permission Department, John Wiley & Sons, Inc. The purchaser may make back-up copies for his/her own use only and not for distribution or resale. The Publishers assumes no responsibility for errors, omissions, or damages caused by the use of theses programs or from the use of the information herein.