chapter 3: annual analysis of disproportionate share ......to reductions in hospital uncompensated...
TRANSCRIPT

Chapter 3:
Annual Analysis of Disproportionate Share Hospital Allotments to States

Chapter 3: Annual Analysis of Disproportionate Share Hospital Allotments to States
58 March 2019
Annual Analysis of Disproportionate Share Hospital Allotments to StatesKey Points
• MACPAC continues to find no meaningful relationship between states’ disproportionate share hospital (DSH) allotments and the three factors that Congress has asked the Commission to study:
– the number of uninsured individuals;
– the amount and sources of hospitals’ uncompensated care costs; and
– the number of hospitals with high levels of uncompensated care that also provide essential community services for low-income, uninsured, and vulnerable populations.
• In 2017, 28.5 million people were uninsured, a 32 percent decline from 2013.
• The coverage expansions under the Patient Protection and Affordable Care Act (ACA, P.L. 111-148, as amended) are resulting in different effects on the two types of uncompensated care that DSH payments help offset: (1) unpaid costs of care for uninsured individuals, and (2) Medicaid shortfall, the difference between a hospital’s Medicaid payments and its costs of providing services to Medicaid-enrolled patients.
– Charity care and bad debt are declining. Nationally, hospitals reported a $5.7 billion decline in charity care and bad debt from 2013 to 2014.
– Medicaid shortfall is increasing. Hospitals reported a $0.9 billion increase in Medicaid shortfall on the American Hospital Association Annual Survey in the same period.
– For hospitals that received DSH payments in state plan rate years 2013 and 2014 (41 percent of all U.S. hospitals), the increase in Medicaid shortfall reported on DSH audits ($4.0 billion) outpaced the decline in unpaid costs of care for uninsured patients ($1.6 billion) for these years.
– In 2016, hospitals reported a total of $35.0 billion in charity care and bad debt and $20.0 billion in Medicaid shortfall.
• In fiscal year (FY) 2019, $12.6 billion in federal DSH funds were allotted to states ($22.3 billion in state and federal funds combined). These allotments are scheduled to be reduced in fiscal FY 2020, with cuts continuing through FY 2025.
• State DSH allotments, which are based on state DSH spending in FY 1992, vary widely today, and the DSH allotment reduction methodology prescribed by statute is projected to preserve much of that variation.
• In the coming year, the Commission will continue to examine other DSH policy issues as part of its broader examination of all types of Medicaid payments to hospitals.

Chapter 3: Annual Analysis of Disproportionate Share Hospital Allotments to States
59Report to Congress on Medicaid and CHIP
CHAPTER 3: Annual Analysis of Disproportionate Share Hospital Allotments to StatesState Medicaid programs are statutorily required to make disproportionate share hospital (DSH) payments to hospitals that serve a high proportion of Medicaid beneficiaries and other low-income patients. The total amount of such payments is limited by annual federal DSH allotments, which vary widely by state. States can distribute DSH payments to virtually any hospital in their state, but total DSH payments to a hospital cannot exceed the total amount of uncompensated care that the hospital provides. DSH payments help to offset two types of uncompensated care: Medicaid shortfall (the difference between a hospital’s Medicaid payments and its costs of providing services to Medicaid-enrolled patients) and unpaid costs of care for uninsured individuals. More generally, DSH payments also help to support the financial viability of safety-net hospitals.
MACPAC is statutorily required to report annually on the relationship between state allotments and several potential indicators of the need for DSH funds:
• changes in the number of uninsured individuals;
• the amounts and sources of hospitals’ uncompensated care costs; and
• the number of hospitals with high levels of uncompensated care that also provide essential community services for low-income, uninsured, and vulnerable populations.
As in our previous DSH reports, we find little meaningful relationship between DSH allotments and the factors that Congress asked the Commission to study. This is because DSH allotments are largely based on states’ historical DSH spending before federal limits were established. Moreover, the variation is projected to continue after federal DSH allotment reductions take effect.
In this report, we update our previous findings to reflect new information on changes in the number of uninsured individuals and levels of hospital uncompensated care. We also provide updated information on deemed DSH hospitals, which are statutorily required to receive DSH payments because they serve a high share of Medicaid-enrolled and low-income patients. Specifically, we find the following:
• According to the Current Population Survey, 28.5 million people, or 8.8 percent of the U.S. population, were uninsured in 2017, about the same percentage as in 2016. Since 2013, the number of uninsured individuals has declined 32 percent, with the largest declines in states that expanded Medicaid under the Patient Protection and Affordable Care Act (ACA, P.L. 111-148, as amended).1
• Hospitals reported $35.0 billion in hospital charity care and bad debt on Medicare cost reports in 2016, an 8 percent decline from 2015. Because of recent changes in Medicare cost report definitions that affected uncompensated care reported for 2015 and subsequent years, we can no longer compare these data with the amount of uncompensated care reported in 2013.2
• Hospitals reported $20.0 billion in Medicaid shortfall on the American Hospital Association (AHA) annual survey in 2016, a 24 percent increase from the amount reported in 2015. Since 2013, the amount of Medicaid shortfall for all hospitals has increased by $6.8 billion (AHA 2017, 2015).

Chapter 3: Annual Analysis of Disproportionate Share Hospital Allotments to States
60 March 2019
• In 2016, deemed DSH hospitals continued to report lower aggregate operating margins than other hospitals (negative 6.0 percent for deemed DSH hospitals versus negative 0.9 percent for all hospitals). Total margins (which include government appropriations and revenue not directly related to patient care) were similar between deemed DSH hospitals (6.2 percent) and all hospitals (6.7 percent). Aggregate operating and total margins for deemed DSH hospitals would have been about 4 percentage points lower without DSH payments.
In this report, we also present new data on the early effects of the ACA coverage expansions using DSH audit data. While other data suggest that total hospital uncompensated declined in 2014, state plan rate year (SPRY) 2014 DSH audit data show a net increase in total uncompensated care costs for DSH hospitals because of an increase in Medicaid shortfall.3 For hospitals included in SPRY 2013 and 2014 DSH audits, the increase in Medicaid shortfall ($4.0 billion) was more than twice as large as the decline in unpaid costs of care for uninsured patients ($1.6 billion).
We also project fiscal year (FY) 2020 DSH allotments before and after implementation of federal DSH allotment reductions.4 DSH allotment reductions were included in the ACA under the assumption that increased insurance coverage through Medicaid and the exchanges would lead to reductions in hospital uncompensated care and thereby lessen the need for DSH payments. DSH allotment reductions have been delayed several times, most recently in February 2018 by the Bipartisan Budget Act (P.L. 115-123). Under current law, the first round of reductions (amounting to $4 billion or 31 percent of unreduced amounts) is now scheduled to take effect in FY 2020. Reductions are currently scheduled to increase to $8 billion in FYs 2021–2025, which is more than half of states’ unreduced allotment amounts.
Chapter 1 of this report provides the Commission’s recommendations for restructuring DSH allotment reductions. Specifically, the Commission is calling
for phasing in reductions more gradually and changing the methodology for distributing reductions among states to help improve the relationship between DSH allotments and measures related to hospital uncompensated care costs. Although the Commission is concerned that the magnitude of DSH cuts assumed under current law may affect the financial viability of some safety-net hospitals, the Commission’s analyses have focused on budget-neutral ways to restructure available funding.
This chapter focuses on DSH allotments to states, but the Commission is also interested in exploring changes to other policies that would affect the distribution of DSH payments to hospitals within states. The Commission has long held that DSH payments should be better targeted to hospitals that serve a high share of Medicaid-enrolled and low-income uninsured patients and have higher levels of uncompensated care, consistent with the original statutory intent of the law establishing DSH payments. However, development of policy to achieve this goal must be considered in terms of all Medicaid payments that hospitals receive.
BackgroundCurrent DSH allotments vary widely among states, reflecting the evolution of federal policy over time. States began making Medicaid DSH payments in 1981, when Medicaid hospital payments were delinked from Medicare payment levels. Initially, states were slow to make these payments, and in 1987, Congress required states to make payments to hospitals that serve a high share of Medicaid-enrolled and low-income patients, referred to as deemed DSH hospitals. DSH spending grew rapidly in the early 1990s—from $1.3 billion in 1990 to $17.7 billion in 1992—after Congress clarified that DSH payments were not subject to Medicaid’s hospital payment limitations and CMS issued guidance permitting the use of provider taxes to finance the non-federal share of Medicaid payments (Holahan et al. 1998).5

Chapter 3: Annual Analysis of Disproportionate Share Hospital Allotments to States
61Report to Congress on Medicaid and CHIP
In 1991, Congress enacted state-specific caps on the amount of federal funds that could be used to make DSH payments, referred to as allotments (Box 3-1). Allotments were initially established for FY 1993 and were generally based on each state’s FY 1992 DSH spending. Although Congress has made several incremental adjustments to these allotments, the states that spent the most in FY 1992 still have the largest allotments, and the states that spent the least in FY 1992 still have the smallest allotments.6
In FY 2017, federal funds allotted to states for DSH payments totaled $12.0 billion, of which states spent $10.4 billion.7 (States spent $18.1 billion in state and federal funds combined.) DSH allotments that year ranged from less than $15 million in six states (Delaware, Hawaii, Montana, North Dakota, South Dakota, and Wyoming) to more than $1 billion in three states (California, New York, and Texas).
DSH spending accounted for 3.2 percent of total Medicaid benefit spending in FY 2017, an amount
that has been relatively consistent since FY 2011.8 DSH spending as a share of total state Medicaid benefit spending varied widely by state, from less than 1 percent in 9 states to 12.3 percent in New Hampshire (Figure 3-1).
States have up to two years to spend their DSH allotment, and $1.2 billion in federal DSH allotments for FY 2016 went unspent.9 There are two primary reasons states do not spend their full DSH allotment: (1) they lack state funds to provide the non-federal share; and (2) the DSH allotment exceeds the total amount of hospital uncompensated care in the state. As noted above, DSH payments to an individual hospital cannot exceed that hospital’s level of uncompensated care. In FY 2016, half of unspent DSH allotments were attributable to five states (Connecticut, New Hampshire, New Jersey, Pennsylvania, and Washington) and the District of Columbia, all of which had FY 2016 DSH allotments (including both state and federal funds) that were larger than the
BOX 3-1. Glossary of Key Medicaid Disproportionate Share Hospital Terminology
DSH hospital. A hospital that receives disproportionate share hospital (DSH) payments and meets the minimum statutory requirements to be eligible for DSH payments; that is, a Medicaid inpatient utilization rate of at least 1 percent and at least two obstetricians with staff privileges that treat Medicaid enrollees (with certain exceptions for rural and children’s hospitals).
Deemed DSH hospital. A DSH hospital with a Medicaid inpatient utilization rate of at least one standard deviation above the mean for hospitals in the state that receive Medicaid payments, or a low-income utilization rate that exceeds 25 percent. Deemed DSH hospitals are required to receive Medicaid DSH payments (§ 1923(b) of the Social Security Act (the Act)).
State DSH allotment. The total amount of federal funds available to a state for Medicaid DSH payments. To draw down federal DSH funding, states must provide state matching funds at the same matching rate as other Medicaid service expenditures. If a state does not spend the full amount of its allotment for a given year, the unspent portion is not paid to the state and does not carry over to future years. Allotments are determined annually and are generally equal to the prior year’s allotment, adjusted for inflation (§ 1923(f) of the Act).
Hospital-specific DSH limit. The annual limit on DSH payments to individual hospitals, equal to the sum of Medicaid shortfall and unpaid costs of care for uninsured patients for allowable inpatient and outpatient costs.

Chapter 3: Annual Analysis of Disproportionate Share Hospital Allotments to States
62 March 2019
FIGURE 3-1. DSH Spending as a Share of Total Medicaid Benefit Spending, by State, FY 2017
< 1% 1% – 1.9% 2% – 3.9% 4% – 7.9% ≥ 8%
1.1%
2.5%2
1.7%
3.3%
2.7%
5.1%10.5%
4.1% 8.6% 4.3%8.3%
6.6%
3.9%RI: 5.3%
NH: 12.3%
1.9%
2.1%
2.9% 4.5% 5.8%
1.6%
0.6%1.8%2.3%
3.8%
3.1%
VT: 2.3%
CT: 1.8%NJ: 5.4%
1.1%
0.1%
1.2%
1.1%
1.5%
1.3%
1.4%
1.0%1.5%
1.6%
DE: 1.3%MD: 1.3%
DC: 1.8%
0.2%
0.2%0.8%
1.3%
0.6%
0.9% 1.1%0.9%
MA: – ¹
Notes: DSH is disproportionate share hospital. FY is fiscal year.
― Dash indicates zero.1 Massachusetts does not make DSH payments to hospitals because its Section 1115 demonstration allows the state to use all of its DSH funding for the state’s safety-net care pool instead.2 DSH spending for California includes DSH-financed spending under the state’s Global Payment Program, which is authorized under the state’s Section 1115 demonstration.
Source: MACPAC, 2019, analysis of CMS-64 Financial Management Report net expenditure data as of October 19, 2018.
total amount of hospital uncompensated care in the state as reported on 2016 Medicare cost reports.10
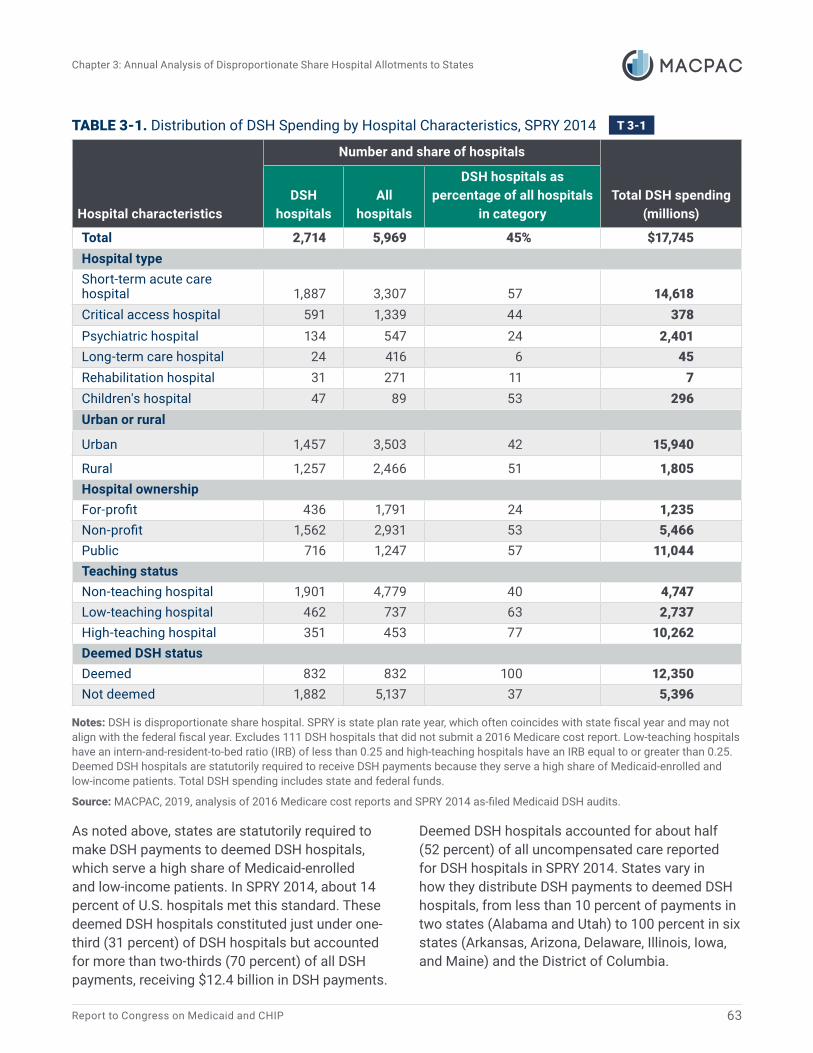
In SPRY 2014, 45 percent of U.S. hospitals received DSH payments (Table 3-1).11 States are allowed to make DSH payments to any hospital that has a Medicaid inpatient utilization rate of at least 1 percent, which is true of almost all U.S. hospitals.12 Public teaching hospitals in urban settings received the largest share of total DSH funding. Half of all rural hospitals also received DSH payments, including many critical access hospitals, which
receive a special payment designation from Medicare because they are small and often the only provider in their geographic area. Many states also make DSH payments to institutions for mental diseases (IMDs), which historically have not been eligible for Medicaid payment for services provided to individuals age 21–64, but are eligible for DSH funding.13 In SPRY 2014, Maine made DSH payments exclusively to IMDs, and four states (Alaska, Connecticut, Maryland, and North Dakota) spent more than half of their DSH allotments on DSH payments to IMDs.14
Chapter 3: Annual Analysis of Disproportionate Share Hospital Allotments to States
63Report to Congress on Medicaid and CHIP
TABLE 3-1. Distribution of DSH Spending by Hospital Characteristics, SPRY 2014
Hospital characteristics
Number and share of hospitals
Total DSH spending (millions)
DSH hospitals
All hospitals
DSH hospitals as percentage of all hospitals
in category
Total 2,714 5,969 45% $17,745Hospital typeShort-term acute care hospital 1,887 3,307 57 14,618Critical access hospital 591 1,339 44 378Psychiatric hospital 134 547 24 2,401Long-term care hospital 24 416 6 45Rehabilitation hospital 31 271 11 7Children's hospital 47 89 53 296Urban or rural
Urban 1,457 3,503 42 15,940
Rural 1,257 2,466 51 1,805Hospital ownershipFor-profit 436 1,791 24 1,235Non-profit 1,562 2,931 53 5,466Public 716 1,247 57 11,044Teaching statusNon-teaching hospital 1,901 4,779 40 4,747Low-teaching hospital 462 737 63 2,737High-teaching hospital 351 453 77 10,262Deemed DSH statusDeemed 832 832 100 12,350Not deemed 1,882 5,137 37 5,396
Notes: DSH is disproportionate share hospital. SPRY is state plan rate year, which often coincides with state fiscal year and may not align with the federal fiscal year. Excludes 111 DSH hospitals that did not submit a 2016 Medicare cost report. Low-teaching hospitals have an intern-and-resident-to-bed ratio (IRB) of less than 0.25 and high-teaching hospitals have an IRB equal to or greater than 0.25. Deemed DSH hospitals are statutorily required to receive DSH payments because they serve a high share of Medicaid-enrolled and low-income patients. Total DSH spending includes state and federal funds.
Source: MACPAC, 2019, analysis of 2016 Medicare cost reports and SPRY 2014 as-filed Medicaid DSH audits.
As noted above, states are statutorily required to make DSH payments to deemed DSH hospitals, which serve a high share of Medicaid-enrolled and low-income patients. In SPRY 2014, about 14 percent of U.S. hospitals met this standard. These deemed DSH hospitals constituted just under one-third (31 percent) of DSH hospitals but accounted for more than two-thirds (70 percent) of all DSH payments, receiving $12.4 billion in DSH payments.
Deemed DSH hospitals accounted for about half (52 percent) of all uncompensated care reported for DSH hospitals in SPRY 2014. States vary in how they distribute DSH payments to deemed DSH hospitals, from less than 10 percent of payments in two states (Alabama and Utah) to 100 percent in six states (Arkansas, Arizona, Delaware, Illinois, Iowa, and Maine) and the District of Columbia.

Chapter 3: Annual Analysis of Disproportionate Share Hospital Allotments to States
64 March 2019
State DSH targeting policies are difficult to categorize. States that concentrate DSH payments among a small number of hospitals do not necessarily make the largest share of payments to deemed DSH hospitals (e.g., North Dakota); conversely, some states that distribute DSH payments across most hospitals still target the largest share of DSH payments to those that are deemed DSH hospitals (e.g., New York) (Figure 3-2). States’ criteria for identifying eligible DSH hospitals and how much funding they receive vary, but are often related to hospital ownership, hospital type, and geographic factors. The methods states use to finance the non-federal share of DSH payments may also affect their DSH targeting policies.15 More
information about state DSH targeting policies is included in Chapter 3 of MACPAC’s March 2017 report to Congress (MACPAC 2017a).
State DSH policies change frequently, often as a function of state budgets; the amounts paid to hospitals are more likely to change than the types of hospitals receiving payments. About 9 in 10 of the hospitals that received DSH payments in SPRY 2014 also received DSH payments in SPRY 2013. But about one-quarter of hospitals receiving DSH payments in both SPRY 2013 and SPRY 2014 reported that the amount they received in SPRY 2014 differed (either increased or decreased) from the amount they received in SPRY 2013 by more than 50 percent.
FIGURE 3-2. Share of Hospitals Receiving DSH Payments and Share of DSH Payments to Deemed DSH Hospitals, by State, SPRY 2014
0% 10% 20% 30% 40% 50% 60% 70% 80% 90% 100%
0%
10%
20%
30%
40%
50%
60%
70%
80%
90%
100%
Share of hospitals receiving DSH payments
Shar
e of
DSH
pay
men
ts to
dee
med
DSH
hos
pita
ls MEIA, AR DE AZ DCIL
CANV
MNVAFL, NETX NJNM
LA NYNC KYAK MSTN WA COIN WVMD
ID GA PAORWI MO
VTSD MISCKSOKND OHWY
NHCT
RIMT
AL UT
Notes: DSH is disproportionate share hospital. SPRY is state plan rate year, which often coincides with state fiscal year and may not align with the federal fiscal year. The share of DSH payments to deemed DSH hospitals shown does not account for provider contributions to the non-federal share; these contributions may reduce net payments. Analysis excludes Massachusetts, which does not make DSH payments to hospitals because its Section 1115 demonstration allows the state to use all of its DSH funding for the state’s safety-net care pool instead, and Hawaii, which did not make DSH payments in SPRY 2014.
Source: MACPAC, 2019, analysis of 2016 Medicare cost reports and SPRY 2014 as-filed Medicaid DSH audits.

Chapter 3: Annual Analysis of Disproportionate Share Hospital Allotments to States
65Report to Congress on Medicaid and CHIP
Changes in the Number of Uninsured IndividualsAccording to the Current Population Survey, 28.5 million people, or 8.8 percent of the U.S. population, were uninsured in 2017, which is not statistically different from 2016 (28.1 million, 8.8 percent) (Berchick et al. 2018).16 This number does not include individuals who were uninsured for part of the year.17
The number of uninsured individuals in the United States in 2017 (28.5 million) represented a decline of 13.3 million from the number reported in 2013 (41.8 million), a 32 percent decrease. The decline in the number of uninsured individuals reflects increases in both private and publicly funded health insurance coverage. From 2013 to 2017, the share of the U.S. population with private coverage at some point in the year (including individual insurance purchased through a health insurance exchange) increased 3.0 percentage points to 67.2 percent, and the share of the population covered at some point in the year by publicly funded coverage (including Medicaid) increased 3.2 percentage points to 37.7 percent (Berchick et al. 2018).18
In 2017, most uninsured individuals were low-income adults. About one-quarter (24 percent) of uninsured individuals had family incomes below 100 percent of the federal poverty level (FPL) and almost half (49 percent) had family incomes below 200 percent FPL. Compared to states that did not expand Medicaid, states that expanded Medicaid had lower uninsured rates not only for individuals with family incomes at or below 138 percent FPL, but also for individuals at higher family income levels (Berchick et al. 2018).
The uninsured rate declined in all states between 2013 and 2017, and states that expanded Medicaid had larger declines (5.8 percentage points) than those that did not (4.2 percentage points), according to the American Community Survey. Louisiana, which expanded its Medicaid program in July 2016, had a 1.9 percentage point decrease in its uninsured rate between 2016 and 2017, the largest state decline in that period (Berchick et al. 2018).
Looking ahead, the number of uninsured individuals is expected to increase as the population grows, policies change, and the year-over-year effects of the ACA coverage expansions diminish. For example, in September 2018, the Congressional Budget Office (CBO) estimated that between 2018 and 2019, the number of uninsured individuals will increase by 3 million (CBO 2018a).
CBO’s projections incorporate estimates of the effects of new regulations to promote the use of association health plans and short-term, limited duration insurance plans (EBSA 2018, IRS et al. 2018). These regulations are expected to decrease the number of uninsured individuals. However, some individuals purchasing short-term, limited duration insurance plans are expected to have coverage that does not meet CBO’s minimum definition of health insurance.19
CBO’s estimates do not include the potential effects of a proposed rule issued by the U.S. Department of Homeland Security that would change the definition of public charge for purposes of immigration status. The Kaiser Family Foundation estimates that if this rule is implemented, 2.1 million to 4.9 million enrollees in Medicaid and the State Children’s Health Insurance Program who have at least one non-citizen in their families will disenroll from the programs (Artiga et al. 2018).20
Changes in the Amount of Hospital Uncompensated CareIn considering changes in the amount of uncompensated care, it is important to note that DSH payments cover both unpaid costs of care for uninsured individuals and Medicaid shortfall. Since the implementation of the ACA coverage expansions in 2014, unpaid costs of care for uninsured individuals have declined substantially, particularly in states that have expanded Medicaid. However, as the number of Medicaid enrollees has increased, Medicaid shortfall has also increased.

Chapter 3: Annual Analysis of Disproportionate Share Hospital Allotments to States
66 March 2019
Definitions of uncompensated care vary among data sources, complicating comparisons and our ability to fully understand effects at the hospital level (Box 3-2). The most recently available data on hospital uncompensated care for all hospitals comes from Medicare cost reports, which define uncompensated care as charity care and bad debt. However, Medicare cost reports do not include reliable information on Medicaid shortfall, the difference between a hospital’s costs of care for Medicaid-enrolled patients and the total payments it receives for those services. Medicaid DSH audits include data on both Medicaid shortfall and unpaid costs of care for uninsured individuals for DSH hospitals, but these data are not published until about five years after DSH payments are made.21
Below, we review the most recent uncompensated care data available for all hospitals in 2016 and new data from Medicaid DSH audits that shed light on changes in uncompensated care costs incurred by DSH hospitals between SPRY 2013 and SPRY 2014. Because DSH audit data are used for making Medicaid DSH payments, they are more accurate and better aligned with Medicaid DSH definitions than other data sources.
Unpaid costs of care for uninsured individualsAccording to Medicare cost reports, hospitals reported a total of $35.0 billion in charity care and bad debt in 2016, which was 3.6 percent of hospital operating expenses. These total costs of hospital uncompensated care for 2016 represented a decline from 2015 of $3.1 billion, or 8 percent. The states that expanded Medicaid in 2016 (Montana and Louisiana) reported a 38 percent decline from 2015.
Due to recent changes in Medicare cost report instructions, uncompensated care reported on 2016 Medicare cost reports cannot be compared with 2013 data.22 Previously, MACPAC found that charity care and bad debt reported on Medicare costs reports had declined $8.6 billion (23 percent) between 2013 and 2015 (MACPAC 2018a).
Hospitals have retroactively adjusted their 2015 cost reports to comply with new definitions, but they are not required to update uncompensated care data from 2013.23
As a share of hospital operating expenses, charity care and bad debt varied widely by state in 2016 (Figure 3-3). In the aggregate, hospitals in states that expanded Medicaid under the ACA before December 31, 2016 reported uncompensated care that was less than half of what was reported in non-expansion states (2.3 percent of hospital operating expenses in Medicaid expansion states versus 6.0 percent in states that did not expand Medicaid).
Uncompensated care reported on Medicare cost reports includes the costs of care provided to both uninsured individuals and patients with insurance who cannot pay deductibles, co-payments, or coinsurance. In 2016, about 43 percent of uncompensated care reported was for charity care for uninsured individuals ($15.1 billion), 16 percent was charity care for insured individuals ($5.7 billion), and 40 percent was for bad debt expenses for both insured and uninsured individuals ($14.2 billion).24 Uncompensated care for uninsured individuals is largely affected by the uninsured rate while uncompensated care for patients with insurance is affected by specific features of their health insurance, such as deductibles and other forms of cost sharing. When patients cannot pay cost sharing, these costs often become bad debt expenses for hospitals. In 2016, the share of private-sector enrollees in high-deductible health plans was 46.5 percent, up from 11.4 percent in 2006 (Miller et al. 2018).
Medicaid shortfall According to the AHA annual survey, Medicaid shortfall in 2016 for all U.S. hospitals totaled $20.0 billion, an increase of $3.8 billion from 2015. The aggregate Medicaid payment-to-cost ratio reported on the AHA survey was 88 percent in 2016, a decline from the 90 percent payment-to-cost ratio reported in 2015 (AHA 2017, 2016).

Chapter 3: Annual Analysis of Disproportionate Share Hospital Allotments to States
67Report to Congress on Medicaid and CHIP
BOX 3-2. Data Sources and Definitions of Uncompensated Care Costs
Data SourcesAmerican Hospital Association (AHA) annual survey. An annual survey of hospital finances that provides aggregated national estimates of uncompensated care for community hospitals.
Medicare cost report. An annual report on hospital finances that must be submitted by all hospitals that receive Medicare payments (that is, most U.S. hospitals with the exception of some freestanding children’s hospitals). Medicare cost reports define hospital uncompensated care as bad debt and charity care.
Medicaid disproportionate share hospital (DSH) audit. A statutorily required audit of a DSH hospital’s uncompensated care. The audit ensures that Medicaid DSH payments do not exceed the hospital-specific DSH limit, which is equal to the sum of Medicaid shortfall and the unpaid costs of care for uninsured individuals for allowable inpatient and outpatient costs. Forty-five percent of U.S. hospitals were included on DSH audits in 2014, the latest year for which data are available.
Definitions
Medicare cost report components of uncompensated care
Charity care. Health care services for which a hospital determines the patient does not have the capacity to pay and, based on its charity care policy, either does not charge the patient at all for the services or charges the patient a discounted rate below the hospital’s cost of delivering the care. Charity care costs cannot exceed a hospital’s cost of delivering the care.
Bad debt. Expected payment amounts that a hospital is not able to collect from patients who are determined to have the financial capacity to pay according to the hospital’s charity care policy.
Medicaid DSH audit components of uncompensated care
Unpaid costs of care for uninsured individuals. The difference between a hospital’s costs of providing services to individuals without health coverage and the total amount of payment received for those services. This includes charity care and bad debt for individuals without health coverage and generally excludes charity care and bad debt for individuals with health coverage.
Medicaid shortfall. The difference between a hospital’s costs of providing services to Medicaid-enrolled patients and the total amount of Medicaid payment received for those services (under both fee-for-service and managed care, excluding DSH payments but including other types of supplemental payments). Costs for patients dually eligible for Medicaid and other coverage (such as Medicare) are included, and costs for physician services and other care that does not meet the definition of inpatient and outpatient hospital services are excluded.

Chapter 3: Annual Analysis of Disproportionate Share Hospital Allotments to States
68 March 2019
FIGURE 3-3. Charity Care and Bad Debt as a Share of Hospital Operating Expenses, 2016
< 2.0 2.0% – 2.9% 3.0% – 3.9% 4.0% – 4.9% ≥ 5.0%
2.3%
1.5%
2.8%
1.7%
2.1%
8.1%4.2%
6.8% 4.5% 7.4%6.8%
4.6%
3.3%
3.3%
RI: 2.0%
NH: 2.4%
3.3%
3.2%
3.6% 3.3% 2.0%
1.5%
6.7%2.1%
1.9%6.6%
1.9%
VT: 1.7%
CT: 1.8%NJ: 3.7%
1.3%
6.1%
1.7%
2.6%
3.4%
4.5%
1.9%
3.6%6.8%
DE: 2.1%MD: 3.1%
DC: 1.5%
2.4%
2.2%1.4%
2.4%
2.0%
5.2% 2.7%4.7%
MA: 1.9%
Source: MACPAC, 2019, analysis of 2016 Medicare cost reports.
In contrast to the AHA survey, which provides data for all U.S. hospitals, Medicaid DSH audits provide data on Medicaid shortfall for the subset of hospitals that receive Medicaid DSH payments (45 percent of U.S. hospitals in SPRY 2014).25 In SPRY 2014, DSH hospitals reported a total of $11.8 billion in Medicaid shortfall and an aggregate Medicaid payment-to-cost ratio of 91 percent before DSH payments.
Medicaid shortfall as a share of total uncompensated care for DSH hospitals varies widely across states (Figure 3-4). In SPRY 2014, 15 states reported no Medicaid shortfall for DSH hospitals and 11 states and the District of Columbia reported shortfall that exceeded 50 percent of total DSH hospital uncompensated care. There is also wide variation in Medicaid payment-to-cost ratios
for DSH hospitals. Before DSH payments, Medicaid payments to DSH hospitals ranged from 70 percent of costs in Arizona to 119 percent of costs in Utah in SPRY 2014.26 Complete state-by-state data on Medicaid payments to DSH hospitals as a share of costs for Medicaid-enrolled and uninsured patients is provided in Appendix 3A.
Aggregate data on Medicaid shortfall for DSH hospitals may not reflect the experience of all hospitals in a state because Medicaid payment rates vary by hospital and because the net payment that a hospital receives may be lower than the total payment reported on DSH audits. For example, in the aggregate, DSH hospitals in Mississippi did not report a Medicaid shortfall in SPRY 2014, but 38 of the 58 hospitals that received DSH payments reported

Chapter 3: Annual Analysis of Disproportionate Share Hospital Allotments to States
69Report to Congress on Medicaid and CHIP
FIGURE 3-4. Medicaid Shortfall as a Share of Total Uncompensated Care Costs for DSH Hospitals, SPRY 2014
No shortfall reported < 25% 25% – 49% 50% – 74% ≥ 75%
NS
27%
38%
57%
7%
NS45%
NS 21% 11%20%
NS
69%
17%
RI: 66%
NH: –2
52%
34%
NS 11% 53%
32%
2%2–2
34%NS
53%
VT: 82%
CT: 46%NJ: 19%
–1
20%
NS
18%
NS
NS
70%
NSNS
DE: 56%MD: NS
DC: 68%
29%
NS70%2
58%
47%
NS 23%NS2
MA: –1
Notes: DSH is disproportionate share hospital. SPRY is state plan rate year. NS is no shortfall reported.
― Dash indicates no data available.1 Hawaii and Massachusetts did not submit SPRY 2014 DSH audits because they did not make any DSH payments in SPRY 2014.2 Analysis excludes 87 DSH hospitals that did not include payments from third-party payers when calculating Medicaid shortfall (2 in Minnesota, all DSH hospitals in New Hampshire, 3 in Tennessee, 1 in Virginia, and all DSH hospitals in West Virginia).
Source: MACPAC, 2019, analysis of as-filed SPRY 2014 DSH audit data.
Medicaid shortfall in that year.27 Moreover, Mississippi finances DSH payments with provider taxes, and stakeholders report that net Medicaid payments to hospitals in the state are below costs after adding the costs of these taxes (Marks et al. 2018).
As a result of recent litigation, some states are changing how they report Medicaid shortfall on DSH audits, which will affect the amount of Medicaid shortfall reported in future years. Specifically, hospitals have challenged CMS’s policy of requiring
states to subtract payments from third-party payers (e.g., Medicare and private insurance) when calculating Medicaid shortfall for Medicaid-eligible patients with third-party coverage.28 In March 2018, the U.S. District Court of the District of Columbia ruled against CMS on this issue.29 CMS has appealed the decision, but in December 2018, CMS withdrew its prior subregulatory guidance on this issue and noted that it would not be enforcing its prior policy while the March 2018 decision is operative in its current form (CMS 2018b).

Chapter 3: Annual Analysis of Disproportionate Share Hospital Allotments to States
70 March 2019
Changes in uncompensated care for DSH hospitals between SPRY 2013 and SPRY 2014To examine the effects of the ACA coverage expansions, we reviewed uncompensated care costs reported for the subset of 2,441 hospitals that were included in DSH audits for both SPRY 2013 and SPRY 2014; this subset accounts for 86 percent of the 2,825 hospitals that were included in DSH audits for SPRY 2014 alone.30 These data do not reflect the full effects of coverage expansions, because SPRY 2014 ended on June 30, 2014 for most states.31
For hospitals in this subset, the increase in Medicaid shortfall ($4.0 billion) from SPRY 2013 to SPRY 2014 was larger than the decline in unpaid costs of care for uninsured individuals ($1.6 billion) in the same period (Table 3-2). Increases in total DSH hospital uncompensated care were reported in both expansion and non-expansion states. The total amount of Medicaid shortfall increased more in expansion states than in non-expansion states from SPRY 2013 to SPRY 2014, but the percentage change was larger in non-expansion states because DSH hospitals in these states reported less shortfall in SPRY 2013.
In contrast, other national data for all hospitals suggest that uncompensated care has declined as a result of the ACA coverage expansions, even after accounting for the increase in Medicaid shortfall. Specifically, on Medicare cost reports, hospitals reported a $5.7 billion decrease in charity care and bad debt between 2013 and 2014, which was larger than the $0.9 billion increase in Medicaid shortfall reported on the AHA annual survey for those years.
Below, we examine potential reasons for the observed differences in the effects of the ACA coverage expansions on unpaid costs of care for uninsured individuals and Medicaid shortfall, compare the SPRY 2013–2014 data to prior years, and examine state variation in the amount of reported Medicaid shortfall for DSH hospitals.
Unpaid costs of care for uninsured individuals. The smaller decline in unpaid costs of care reported on DSH audits compared to Medicare cost reports can largely be explained by the fact that SPRY 2014 DSH audits include only half a year of ACA coverage expansions and about half of all U.S. hospitals. For example, the matching DSH hospitals included in our analysis reported a $3.8 billion decline in charity care and bad debt from calendar year 2013 to calendar year 2014, but they reported a $1.6 billion decline in
TABLE 3-2. Uncompensated Care for DSH Hospitals, SPRYs 2013–2014 (billions)
Medicaid expansion status as of June 30, 2014
Unpaid costs of care for uninsured individuals Medicaid shortfall
SPRY 2013
SPRY 2014
Difference (2014 less
2013)Percent change
SPRY 2013
SPRY 2014
Difference (2014 less
2013)Percent change
All states $ 24.7 $ 23.0 -$ 1.6 -7% $ 6.4 $ 10.4 $ 4.0 62%Expansion states 11.5 9.3 -2.2 -19 6.1 8.2 2.2 36 Non-expansion states 13.1 13.7 0.6 5 0.3 2.1 1.8 546
Notes: DSH is disproportionate share hospital. SPRY is state plan rate year. Analysis limited to 2,441 hospitals that received DSH payments in both SPRY 2013 and SPRY 2014 that provided complete information necessary to calculate Medicaid shortfall. Analysis excludes 87 DSH hospitals that did not include payments from third-party payers when calculating Medicaid shortfall (2 in Minnesota, all DSH hospitals in New Hampshire, 3 in Tennessee, 1 in Virginia, and all DSH hospitals in West Virginia). All Medicaid expansion states in this analysis expanded Medicaid on January 1, 2014, except for Michigan, which expanded Medicaid on March 1, 2014. Numbers do not sum due to rounding.
Source: MACPAC, 2019, analysis of 2016 Medicare cost reports and SPRY 2013 and SPRY 2014 as-filed Medicaid DSH audits.

Chapter 3: Annual Analysis of Disproportionate Share Hospital Allotments to States
71Report to Congress on Medicaid and CHIP
those unpaid costs of care for uninsured individuals on DSH audits from SPRY 2013 to SPRY 2014.32
Medicaid shortfall. Overall, Medicaid shortfall appears to be increasing because Medicaid payments are not increasing at the same rate as Medicaid costs (Table 3-3). Total base payments increased in expansion states, presumably because of increased Medicaid enrollment; and in both expansion and non-expansion states, the amount of non-DSH supplemental payments was largely unchanged.33 However, total Medicaid payments increased at a slower rate than Medicaid costs in both expansion and non-expansion states, thus increasing the amount of shortfall reported. Medicaid costs are affected by several different factors, such as Medicaid enrollment, changes in the intensity and mix of services, and inflation, but these components are not separately identified on DSH audits (Box 3-3).
Comparison to prior years. To better understand whether the variation that we observed between SPRY 2013 and SPRY 2014 is a result of ACA coverage expansions, we also compared uncompensated care reported on DSH audits
between SPRY 2012 and SPRY 2013 for hospitals that received DSH payments in all three years (Table 3-4).34 Between SPRY 2012 and SPRY 2013, Medicaid payments for these hospitals increased at a faster rate than Medicaid costs, resulting in a decrease in Medicaid shortfall. However, between SPRY 2013 and SPRY 2014, Medicaid costs increased at a faster rate than Medicaid payments, thus increasing Medicaid shortfall for these hospitals.
Hospitals with High Levels of Uncompensated Care That Also Provide Essential Community ServicesMACPAC is required to provide data identifying hospitals with high levels of uncompensated care that also provide access to essential community services. Given that the concept of essential community services is not defined elsewhere in Medicaid statute or regulation, MACPAC has developed a working definition based on the types of services suggested in the statutory provision
TABLE 3-3. Components of Medicaid Shortfall Reported on DSH Audits by State Expansion Status, SPRYs 2013–2014 (billions)
Category
Expansion states Non-expansion states All states
SPRY 2013
SPRY 2014
Percent change
SPRY 2013
SPRY 2014
Percent change
SPRY 2013
SPRY 2014
Percent change
Base payments $47.8 $53.1 11% $38.8 $39.5 2% $86.6 $92.6 7%Non-DSH supplemental payments 6.0 6.0 0 7.2 7.2 -1 13.3 13.2 0Total Medicaid payments $53.9 $59.1 10% $46.0 $46.7 2% $99.9 $105.8 6%Medicaid costs 59.9 67.4 12 46.4 48.9 5 106.3 116.2 9Medicaid shortfall $6.1 $8.2 36% $0.3 $2.1 546% $6.4 $10.4 62%
Notes: DSH is disproportionate share hospital. SPRY is state plan rate year. Analysis limited to 2,441 hospitals that received DSH payments in both SPRY 2013 and SPRY 2014 that provided complete information necessary to calculate Medicaid shortfall. Analysis excludes 87 DSH hospitals that did not include payments from third-party payers when calculating Medicaid shortfall (2 in Minnesota, all DSH hospitals in New Hampshire, 3 in Tennessee, 1 in Virginia, and all DSH hospitals in West Virginia). All Medicaid expansion states in this analysis expanded Medicaid on January 1, 2014, except for Michigan, which expanded Medicaid on March 1, 2014
Source: MACPAC, 2019, analysis of SPRY 2013 and SPRY 2014 as-filed Medicaid DSH audits.

Chapter 3: Annual Analysis of Disproportionate Share Hospital Allotments to States
72 March 2019
BOX 3-3. Factors Affecting Medicaid Hospital CostsThe cost of hospital care for Medicaid enrollees is affected by the number of Medicaid enrollees using hospital care, the volume and intensity of services used, and unit costs. Below we examine each of these factors in more detail, including information about how these factors changed between 2013 and 2014.
Number of enrollees. Between 2013 and 2014, the number of Medicaid enrollees increased 9 percent (from 59.8 million to 65.1 million), and the number of Medicaid inpatient hospital admissions increased 8 percent (from 7.4 million admissions to 8.0 million) (MACPAC 2018b, AHRQ 2018a). Medicaid enrollment and Medicaid hospital admissions increased more in states that expanded Medicaid than those that did not (Nikpay et al. 2016).
Volume and intensity of services used. Uninsured individuals who gained Medicaid coverage as a result of ACA coverage expansions may have had pent-up demand that resulted in increased use of services immediately after being enrolled. For example, an Avalere Health study examining claims data for Medicaid expansion enrollees across nine state and plan combinations found that the enrollees’ use of hospital care declined during the first year of coverage, resulting in lower average costs for expansion enrollees in the second half of 2014 than in the first half of 2014 (Avalere Health 2018).
Unit costs. The cost of care for a particular unit of service varies by hospital due to a range of market characteristics (e.g., costs of labor and technology) and hospital characteristics (e.g., productivity and efficiency). According to MACPAC’s analysis of data from the Healthcare Cost and Utilization Project, between 2013 and 2014, the average cost per hospital stay nationally increased 1.5 percent, which was the same as the change in the Consumer Price Index for All Urban Consumers during that period (AHRQ 2018b).
TABLE 3-4. Percent Change in Components of Uncompensated Care for DSH Hospitals, SPRYs 2012–2014
Components of uncompensated care SPRYs 2012–2013 SPRYs 2013–2014Unpaid costs of care for uninsured individuals 2.1% -6.3 %Medicaid costs 6.2 10.2 Medicaid payments (base and non-DSH supplemental payments) 7.0 7.0Medicaid shortfall (Medicaid costs minus Medicaid payments) -5.6 61.4
Notes: DSH is disproportionate share hospital. SPRY is state plan rate year. Analysis limited to 2,295 hospitals that received DSH payments in SPRYs 2012, 2013, and 2014. Analysis excludes 87 DSH hospitals in that did not include payments from third-party payers when calculating Medicaid shortfall (2 in Minnesota, all DSH hospitals in New Hampshire, 3 in Tennessee, 1 in Virginia, and all DSH hospitals in West Virginia).
Source: MACPAC, 2019, analysis of SPRY 2012, SPRY 2013, and SPRY 2014 as-filed Medicaid DSH audits.

Chapter 3: Annual Analysis of Disproportionate Share Hospital Allotments to States
73Report to Congress on Medicaid and CHIP
calling for MACPAC’s study and the limits of available data (Box 3-4). In Chapter 3 of MACPAC’s March 2017 report, the Commission analyzed other criteria that could be used to identify hospitals that should receive DSH payments (MACPAC 2017a).
Using data from 2016 Medicare cost reports and the 2016 AHA annual survey, we found that among hospitals that met the deemed DSH criteria in SPRY 2014, 91 percent provided at least one of the services included in MACPAC’s working definition of essential community services, 73 percent provided two of these services, and 59 percent provided
three or more of these services. By contrast, among non-deemed hospitals, 44 percent provided three or more of these services.
Hospital systemsTo examine the continuum of services that hospitals provide, it is necessary to consider services provided by the larger health systems in which hospitals operate. For example, of the 2,472 hospitals that reported providing primary care services in the 2016 AHA annual survey (41 percent
BOX 3-4. Identifying Hospitals with High Levels of Uncompensated Care That Provide Essential Community Services for Low-Income, Uninsured, and Other Vulnerable Populations
The statute requires that MACPAC provide data identifying hospitals with high levels of uncompensated care that also provide access to essential community services for low-income, uninsured, and vulnerable populations, such as graduate medical education, and the continuum of primary through quaternary care, including the provision of trauma care and public health services. Based on the types of services suggested in the statute and the limits of available data, we included the following services in our working definition of essential community services in this report:
• burn services;
• dental services;
• graduate medical education;
• HIV/AIDS care;
• inpatient psychiatric services (through a psychiatric subunit or stand-alone psychiatric hospital);
• neonatal intensive care units;
• obstetrics and gynecology services;
• primary care services;
• substance use disorder services; and
• trauma services.
We also included deemed DSH hospitals that were designated as critical access hospitals because they are often the only hospital in their geographic area. See Appendix 3B for further discussion of our methodology and its limitations.

Chapter 3: Annual Analysis of Disproportionate Share Hospital Allotments to States
74 March 2019
of all hospitals), one-quarter provided access to primary care outside of the hospital setting, either through clinics owned by the larger system or those that contracted directly with the hospital.
In 2016, 69.7 percent of U.S. hospitals were part of health systems, and hospitals within these health systems accounted for 91.6 percent of all U.S. hospital discharges. One-third of all U.S. hospitals (33.8 percent) were part of health systems that included hospitals in multiple states. Of the 626 health systems identified by the Agency for Healthcare Research and Quality, 255 (41 percent) included at least one deemed DSH hospital (AHRQ 2019).
Consistent with industry trends, many health systems provide primary and specialty care through arrangements with physician groups and other hospitals. Between 2007 and 2017, consolidation of physician practices by hospitals increased for all physician types, but was highest among medical and surgical specialty practices (Nikpay et al. 2018).
Compared to hospitals that do not have arrangements with physician groups, health systems may have more capacity to participate in value-based payment arrangements that aim to manage care provided outside of the hospital setting. Of the 68 hospitals that reported participating in a Medicaid accountable care organization in the 2016 AHA annual survey, 65 hospitals (96 percent) were part of health systems.
In December 2015, California received CMS approval for a Section 1115 demonstration to distribute DSH funding as a global payment to health systems that serve a high share of Medicaid and uninsured patients. The demonstration’s interim evaluation found that health systems participating in this program expanded the availability of primary care services and other care outside the hospital setting during the first two years of the program (Timbie et al. 2018). A final evaluation for California’s Global Payment Program is expected in the summer of 2019, and the Commission will continue to monitor these findings.
Hospital marginsHospitals that are part of multihospital health systems may be able to offset financial losses at one hospital with profits from other hospitals in the health system. For example, deemed DSH hospitals that were part of multihospital health systems reported negative aggregate operating margins of -0.6 percent in 2016, but all hospitals in these health systems reported positive aggregate operating margins of 2.1 percent in this period.
In 2016, aggregate hospital operating margins were 1.0 percent lower and aggregate total margins were 0.7 percent higher for all hospitals than in 2015. Many factors affect a hospital’s margins, such as changes in the prices that a hospital can negotiate because of its competitive position in its market and changes in the hospital’s costs (Bai and Anderson 2016). Additionally, margins are an imperfect measure of a hospital’s financial health and may not be reported reliably on Medicare cost reports. Moreover, hospitals that are struggling financially might decide to cut unprofitable services, which would increase their margins in the short term, and hospitals that are doing well financially might make additional investments, which could decrease their margins in the short term.
DSH Allotment ReductionsUnder current law, DSH allotments are scheduled to be reduced by the following annual amounts:
• $4.0 billion in FY 2020;
• $8.0 billion in FY 2021;
• $8.0 billion in FY 2022;
• $8.0 billion in FY 2023;
• $8.0 billion in FY 2024; and
• $8.0 billion in FY 2025.
DSH allotment reductions are applied against unreduced DSH allotments; that is, the amount that

Chapter 3: Annual Analysis of Disproportionate Share Hospital Allotments to States
75Report to Congress on Medicaid and CHIP
FIGURE 3-5. Aggregate Hospital Operating Margins Before and After DSH Payments, All Hospitals versus Deemed DSH Hospitals, 2016
Before DSH payments
After DSH payments
-0.9%
0.5%
-6.0%
-1.7%
-7.0%
-6.0%
-5.0%
-4.0%
-3.0%
-2.0%
-1.0%
0.0%
1.0%
All hospitals
Agg
rega
te o
pera
ting
mar
gins
Deemed DSH hospitals
Notes: DSH is disproportionate share hospital. Operating margins measure income from patient care divided by net patient revenue. Operating margins before DSH payments in 2016 were estimated using state plan rate year (SPRY) 2014 DSH audit data. Analysis excluded outlier hospitals reporting operating margins greater than 1.5 times the interquartile range from the first and third quartiles. Deemed DSH status was estimated based on available data on Medicaid inpatient and low-income utilization rates. For further discussion of this methodology and limitations, see Appendix 3B.
Source: MACPAC, 2019, analysis of 2016 Medicare cost reports and SPRY 2014 DSH audit data.
FIGURE 3-6. Aggregate Hospital Total Margins Before and After DSH Payments, All Hospitals versus Deemed DSH Hospitals, 2016
Before DSH payments andother governmentappropriations
Before DSH payments
After DSH payments
-0.4%
2.3%
6.2%
4.4%5.3%
6.7%
-2.0%
0.0%
2.0%
4.0%
6.0%
8.0%
All hospitals
Agg
rega
te to
tal m
argi
ns
Deemed DSH hospitals
Notes: DSH is disproportionate share hospital. Total margins include revenue not directly related to patient care, such as investment income, parking receipts, and non-DSH state and local subsidies to hospitals. Total margins before DSH payments in 2016 were estimated using state plan rate year (SPRY) 2014 DSH audit data. Other government appropriations include state or local subsidies to hospitals that are not Medicaid payments. Analysis excluded outlier hospitals reporting total margins greater than 1.5 times the interquartile range from the first and third quartiles. Deemed DSH status was estimated based on available data on Medicaid inpatient and low-income utilization rates. For further discussion of this methodology and limitations, see Appendix 3B.
Source: MACPAC, 2019, analysis of 2016 Medicare cost reports and SPRY 2014 DSH audit data.

Chapter 3: Annual Analysis of Disproportionate Share Hospital Allotments to States
76 March 2019
states would have received without DSH allotment reductions. In FY 2020, DSH allotment reductions amount to 31 percent of states’ unreduced DSH allotment amounts; by FY 2025, DSH allotment reductions will be equal to 55 percent of states’ unreduced DSH allotments. In FY 2026 and beyond, there are no DSH allotments reductions scheduled. Thus, under current law, state DSH allotments would return to their higher, unreduced DSH allotment amounts in those years. Unreduced allotments increase each year based on inflation, and these inflation-based increases continue to apply even when DSH allotment reductions take effect.
Chapter 1 of this report provides the Commission’s analyses and recommendations for restructuring DSH allotment reductions by phasing in reductions more gradually and changing the methodology for distributing reductions among states. Here, we examine DSH allotment reductions under current law, which MACPAC is statutorily required to report.
Current law requires CMS to develop a methodology for distributing DSH allotment reductions among states, referred to as the DSH Health Reform Reduction Methodology (DHRM), and directs CMS to use specific criteria, such as applying greater DSH reductions to states with lower uninsured rates and states that do not target their DSH payments to high-need hospitals (Box 3-5). In July 2017, CMS proposed changes to the DHRM for FY 2018 and subsequent years (CMS 2017b).
MACPAC provided comments on CMS’s proposed DSH allotment reduction formula in August 2017 (MACPAC 2017b). Specifically, the Commission encouraged CMS to apply DSH allotment reductions to unspent DSH funding first, to minimize the effects of DSH allotment reductions on hospitals that are currently receiving DSH payments. MACPAC also analyzed the state-by-state effects of CMS’s proposal to increase the relative weight of the uninsured percentage factor and provided technical comments on ways to improve the calculation of various factors in CMS’s proposed methodology.
Although CMS may revise its methodology before making allotment reductions in FY 2020, we used the proposed methodology to estimate FY 2020 DSH allotment reductions below. In FY 2021 through FY 2025, the size of DSH allotment reductions will double from $4 billion to $8 billion, but the distribution of DSH allotment reductions among states is expected to be largely the same if states do not change their DSH targeting policies and if there are no changes in the rate of uninsurance across states.
We also compare FY 2018 DSH allotments to other factors, such as hospital uncompensated care costs. Complete state-by-state information on current DSH allotments and their relationship to the state-by-state data that Congress requested are provided in Appendix 3A.
Reduced DSH allotments compared to unreduced DSH allotmentsThe $4 billion in DSH allotment reductions scheduled to take effect in FY 2020 are projected to affect states differently, with estimated reductions ranging from 3.8 percent to 46.6 percent of unreduced allotment amounts (Figure 3-7). Because of the low-DSH factor, the projected percentage reduction in DSH allotments for the 17 states that meet the low-DSH criteria (8.9 percent in the aggregate) is less than one-third that of the other states (31.4 percent in the aggregate). Among states that do not meet the low-DSH criteria, the projected percentage reduction in DSH allotments is larger for states that expanded Medicaid (33.7 percent in the aggregate) than for states that did not expand Medicaid (27.1 percent in the aggregate).
DSH allotment reductions will result in a corresponding decline in spending only in states that spend their full DSH allotment. For example, 15 states are projected to have FY 2020 DSH allotment reductions that are smaller than the state’s unspent DSH funding in FY 2016, which means that these states could continue to make the same amount of DSH payments in FY 2020 that they made in FY 2016.35

Chapter 3: Annual Analysis of Disproportionate Share Hospital Allotments to States
77Report to Congress on Medicaid and CHIP
BOX 3-5. Factors Used in Disproportionate Share Hospital Health Reform Reduction Methodology
The Disproportionate Share Hospital (DSH) Health Reform Reduction Methodology (DHRM) provides a model for calculating how DSH allotment reductions will be distributed across states. In July 2017, the Centers for Medicare & Medicaid Services (CMS) proposed changes to the DHRM, but as of this writing, the DHRM has not yet been finalized by CMS. As required by statute, the proposed DHRM applies five factors when calculating state DSH allotment reductions:
Low-DSH factor. Allocates a smaller proportion of the total DSH allotment reductions to low-DSH states based on the size of these states’ DSH allotments relative to their total Medicaid expenditures. Low-DSH states are defined in statute as states with FY 2000 DSH expenditures that were less than 3 percent of total state Medicaid medical assistance expenditures for FY 2000. There are 17 low-DSH states, a number that includes Hawaii, whose eligibility as a low-DSH state is based on a special statutory exception (§§ 1923(f)(5) and 1923(f)(6) of the Social Security Act).
Uninsured percentage factor. Imposes larger DSH allotment reductions on states with lower uninsured rates relative to other states. One-half of DSH reductions are based on this factor.
High volume of Medicaid inpatients factor. Imposes larger DSH allotment reductions on states that do not target DSH payments to hospitals with high Medicaid volume. The proportion of a state’s DSH payments made to hospitals with Medicaid inpatient utilization that is one standard deviation above the mean (the same criteria used to determine deemed DSH hospitals) is compared among states. One-quarter of DSH reductions are based on this factor.
High level of uncompensated care factor. Imposes larger reductions on states that do not target DSH payments to hospitals with high levels of uncompensated care. The proportion of a state’s DSH payments made to hospitals with above-average uncompensated care as a proportion of total hospital costs is compared among states. This factor is calculated using DSH audit data, which defines uncompensated care costs as the sum of Medicaid shortfall and unpaid costs of care for uninsured individuals. One-quarter of DSH reductions are based on this factor.
Budget neutrality factor. An adjustment to the high Medicaid and high uncompensated care factors that accounts for DSH allotments that were used as part of the budget neutrality calculations for coverage expansions under Section 1115 waivers. (Four states—Indiana, Maine, Massachusetts, and Wisconsin—and the District of Columbia meet the statutory criteria for the budget neutrality factor.) Specifically, DSH funding used for coverage expansions is excluded from the calculation of whether DSH payments were targeted to high Medicaid or high uncompensated care hospitals.
We do not know how states will respond to these reductions. As noted above, some states distribute DSH funding proportionally among eligible hospitals, while other states target DSH payments to particular hospitals. Thus, some states may apply reductions to all DSH hospitals in their states while
others may reduce DSH payments only to specific hospitals. Because the DHRM proposed by CMS applies larger reductions to states that do not target DSH funds to hospitals with high Medicaid volume or high levels of uncompensated care, states might change their DSH targeting policies to minimize

Chapter 3: Annual Analysis of Disproportionate Share Hospital Allotments to States
78 March 2019
FIGURE 3-7. Decrease in State DSH Allotments as a Percentage of Unreduced Allotments, by State, FY 2020
< 10% 10% – 19.9% 20% – 29.9% 30% – 39.9% ≥ 40%
8.4%
28.3%
11.9%
41.0%
26.7%
22.7%28.0%
24.2%
41.2% 23.1%32.4%
33.0%
34.4%
19.6%
RI: 46.6%
NH: 28.2%
10.6%
32.5%
21.0%30.7%43.3%
40.7%
35.9%34.0%
36.9%32.6%
38.8%
VT: 45.2%
CT: 29.6%NJ: 34.1%
7.2%
9.8%
11.8%
11.4%
8.3%
13.2%
30.7%
7.4%
DE: 9.3%MD: 32.3%
DC: 34.7%
3.8%
4.7%7.9%
8.6%
6.4%
8.4% 14.1%– ¹
MA: 44.1%
FL: 28.4%
Notes: DSH is disproportionate share hospital. FY is fiscal year.1 Tennessee is not subject to DSH allotment reductions because its DSH allotment is specified in statute (§ 1923(f)(6)(A) of the Social Security Act).
Source: MACPAC, 2019, analysis of Census 2019, CBO 2018b, 2016 Medicare cost reports, and the CMS Medicaid Budget and Expenditure System.
their DSH allotment reductions in future years.36
However, the DSH audit data used to calculate the DSH targeting factors in the DHRM have a substantial data lag of about four to five years.
Relationship of DSH allotments to the statutorily required factorsAs in our past reports, we find little meaningful relationship between current DSH allotments and the factors that Congress asked MACPAC to consider.
Changes in number of uninsured individuals. FY 2019 DSH allotments range from less than $100 per uninsured individual in five states to more than
$1,000 per uninsured individual in nine states. Nationally, the average FY 2019 DSH allotment per uninsured individual is $451.
Amount and sources of hospital uncompensated care costs. As a share of hospital charity care and bad debt costs reported on 2016 Medicare cost reports, FY 2019 federal DSH allotments range from less than 10 percent in six states to more than 80 percent in six states. Nationally, FY 2019 federal DSH allotments are equal to 36 percent of hospital charity care and bad debt costs. At the state level, total FY 2018 DSH funding (including state and federal funds combined) exceeds reported hospital charity care and bad debt costs in 12

Chapter 3: Annual Analysis of Disproportionate Share Hospital Allotments to States
79Report to Congress on Medicaid and CHIP
states. Because DSH payments to hospitals may not exceed total uncompensated care costs, states with DSH allotments larger than the amount of uncompensated care in their state may not be able to spend their full DSH allotment.37
Number of hospitals with high levels of uncompensated care that also provide essential community services for low-income, uninsured, and vulnerable populations. Finally, there continues to be no meaningful relationship between state DSH allotments and the number of deemed DSH hospitals in the state that provided at least one of the services included in MACPAC’s working definition of essential community services.
Next StepsThe analyses in this chapter underscore MACPAC’s prior findings that DSH allotments have little meaningful relationship to measures meant to identify those hospitals most in need. Although much of the variation in state DSH allotment amounts reflects the basis of these allotments in historic patterns of spending, we also find that CMS’s methodology for implementing DSH allotment reductions is projected to preserve most of this historical variation.
Chapter 1 of this report provides the Commission’s analyses and recommendations for restructuring the distribution of reductions among states to improve the relationship between DSH allotments and measures related to hospital uncompensated care costs. The chapter also provides recommendations for ways to phase in reductions more gradually to help mitigate disruption for states and providers.
In the coming year, the Commission will continue to examine other DSH policy issues as part of its broader examination of all types of Medicaid payments to hospitals. The Commission has long held that DSH payments should be better targeted to hospitals that serve a high share of Medicaid-
enrolled and low-income uninsured patients and that have higher levels of uncompensated care, consistent with the original statutory intent of the law establishing DSH payments. However, development of policy to achieve this goal must be considered in terms of all Medicaid payments that hospitals receive.
Endnotes1 The ACA gives states the option of expanding Medicaid to adults under age 65 with incomes at or below 138 percent of the federal poverty level (FPL).
2 Specifically, CMS modified the definition of charity care to include uninsured discounts and changed the way that cost-to-charge ratios were applied on Medicare cost reports (CMS 2017a).
3 On Medicare cost reports, hospitals reported a $5.7 billion decrease in charity care and bad debt between 2013 and 2014, which was larger than the $0.9 billion increase in Medicare shortfall reported on the AHA annual survey for those years. Unlike Medicaid DSH audits, these other data sources include both DSH and non-DSH hospitals. Also, definitions of uncompensated care differ among data sources, as discussed further in Box 3-2.
4 At this writing, CMS has not yet finalized its methodology for distributing DSH allotment reductions so our analyses in this chapter reflect the methodology that CMS proposed in July 2017 (CMS 2017b).
5 Medicaid fee-for-service payments for hospitals cannot exceed a reasonable estimate of what Medicare would have paid in the aggregate. DSH payments are not subject to this upper payment limit, but DSH payments to an individual hospital are limited to that hospital’s uncompensated care costs for Medicaid-enrolled and uninsured patients.
6 Additional background information about the history of DSH payment policy is included in Chapter 1 and Appendix A of MACPAC’s first DSH report (MACPAC 2016).
7 Total DSH spending includes an estimate of the portion of California’s Section 1115 waiver spending that is based on the state’s DSH allotment but excludes Massachussetts.

Chapter 3: Annual Analysis of Disproportionate Share Hospital Allotments to States
80 March 2019
8 The American Recovery and Reinvestment Act of 2009 (P.L. 111-5) increased FY 2009 and FY 2010 DSH allotments to 102.5 percent of what they would have been without the law. Since FY 2011, DSH allotments have accounted for 3 percent to 4 percent of total Medicaid benefit spending. Medicaid benefit spending excludes Medicaid spending on state program administration.
9 Analysis excludes unspent DSH funding that is reported for California and Massachusetts ($1.2 billion total) because these states use their DSH allotment in the budget neutrality assumptions for their Section 1115 waivers.
10 Medicare cost reports define uncompensated care as charity care and bad debt, including uncompensated care for individuals with insurance, which is not part of the Medicaid DSH definition of uncompensated care. Medicare cost reports do not include reliable information on Medicaid shortfall, which is part of the Medicaid DSH definition.
11 States report hospital-specific DSH data on a SPRY basis, which often corresponds to the state fiscal year and may not align with the federal fiscal year.
12 DSH hospitals are also required to have at least two obstetricians with staff privileges who will treat Medicaid enrollees (with certain exceptions for rural and children’s hospitals).
13 The Substance Use-Disorder Prevention that Promotes Opioid Recovery and Treatment for Patients and Communities (SUPPORT) Act of 2018 (P.L. 115-271) provides a state option to cover services provided by an IMD for patients with substance use disorders in FYs 2020–2023. Under Medicaid managed care and Section 1115 waivers, states can also make payments for some services provided by an IMD to Medicaid enrollees age 21–64 (42 CFR 438.6(e)).
14 The amount of a state’s federal DSH funds available for IMDs is limited. Each state’s IMD limit is the lesser amount of either the DSH allotment the state paid to IMDs and other mental health facilities in FY 1995 or 33 percent of the state’s FY 1995 DSH allotment.
15 In 2012, states that financed DSH payments with above-average levels of health care-related taxes distributed DSH payments to a proportion of hospitals in the state that was
about double the proportion of hospitals receiving DSH funding in states that financed DSH payments with lower levels of health care-related taxes. States that financed DSH payments with above-average levels of intergovernmental transfers or certified public expenditures distributed a higher share of total DSH spending to public hospitals—about double the share to public hospitals in states that financed DSH payments with lower levels of local government funding (MACPAC 2017a).
16 The national estimates of the number of uninsured individuals cited in this chapter do not match the state-level estimates of the number of uninsured cited in Appendix 3A because of different data sources used. National estimates of the number of uninsured individuals come from the Current Population Survey, a monthly survey of households by the U.S. Census Bureau for the U.S. Bureau of Labor Statistics, which is the preferred source for national analyses. State-level data come from the American Community Survey, which has a larger sample size and is the preferred source for subnational analyses (Census 2017).
17 There are a variety of ways to count the number of uninsured individuals. Estimates in this chapter reflect the number of people without health insurance for the entire calendar year.
18 In the Current Population Survey, estimates of health insurance coverage are not mutually exclusive. People can be covered by more than one type of health insurance during the year.
19 CBO broadly defines health insurance coverage as a policy that, at a minimum, covers high-cost medical events and various services, including physician and hospital services (CBO 2018a).
20 Federal law states that the applications of individuals seeking admission to the United States or seeking to change their status to lawful permanent residents must be denied if, at any time, these individuals are likely to become public charges. Public charge has historically been defined as when an individual is primarily dependent on the government for subsistence. On October 10, 2018, the U.S. Department of Homeland Security proposed changing the definition of public charge to include individuals who receive one or more public benefits, including Medicaid (USCIS 2018).

Chapter 3: Annual Analysis of Disproportionate Share Hospital Allotments to States
81Report to Congress on Medicaid and CHIP
21 DSH audit data are not due until three years after DSH payments are made and they are not published until after CMS reviews the data for completeness (42 CFR 455.304).
22 Specifically, CMS modified the definition of charity care to include uninsured discounts and changed the way that cost-to-charge ratios were applied on Medicare cost reports (CMS 2017a).
23 As a result of retroactive changes to Medicare cost reports, the adjusted amount of uncompensated care reported by hospitals for 2015 under the new definitions was $9 billion higher than had been reported under the prior definitions.
24 Bad debt expenses for insured and uninsured individuals are not reported separately on Medicare cost reports. The 2016 Medicare cost report data that we report in this chapter have not been audited, so bad debt and charity care costs may not be reported consistently for all hospitals. Beginning in the fall of 2018, CMS began to audit charity care and bad debt costs reported on Medicare cost reports (CMS 2018a).
25 The AHA annual survey also differs from DSH audit data in its definition of Medicaid shortfall. Most notably, the AHA survey includes the costs of provider taxes, which are not included on DSH audits (Nelb et al. 2016).
26 Analysis excludes New Hampshire and West Virginia, which used a different definition of Medicaid costs than other states in their SPRY 2014 DSH audits.
27 An additional 55 hospitals in Mississippi are not included on the state’s SPRY 2014 DSH audit because these hospitals did not receive DSH payments.
28 Medicaid shortfall is the difference between a hospital’s costs of providing care to Medicaid-eligible patients minus the payments that the hospital receives for those services. Because some Medicaid-eligible patients have third-party coverage (e.g., Medicare or private coverage), hospitals receive payments from both Medicaid and other payers for these patients. In 2010, CMS issued subregulatory guidance indicating that the costs of patients with third-party coverage should be included in DSH audits and the amount of third-party payments received for these patients should be subtracted when calculating Medicaid shortfall (CMS 2018b). For example, under CMS’s policy, Medicaid shortfall for
patients dually eligible for Medicare and Medicaid would be the total hospital cost of treating the patient, less the amount that Medicare and Medicaid paid for the service provided.
29 Children’s Hosp. of the King’s Daughters, Inc. v. Azar, 896 F.3d 615 (4th Cir. 2018).
30 We excluded 87 DSH hospitals that did not include payments from third-party payers when calculating Medicaid shortfall: 2 in Minnesota, all DSH hospitals in New Hampshire, 3 in Tennessee, 1 in Virginia, and all DSH hospitals in West Virginia.
31 SPRYs are based on state fiscal years. Most state fiscal years end on June 30th, but in New York, the state fiscal year ends on March 31st; in Texas, the state fiscal year ends on August 31st; and in Michigan and Mississippi, the state fiscal year ends on September 30th.
32 Change in charity care and bad debt for matching hospitals is based on data from cost reports available as of March 31, 2017, prior to CMS’s change in instructions for how uncompensated care is reported.
33 In general, Medicaid enrollment between 2013 and 2014 increased more in states that expanded Medicaid than in those that did not, but some states that did not expand Medicaid nevertheless saw increases in Medicaid enrollment in 2014 among individuals who were previously eligible for Medicaid. Although total base payments for DSH hospitals increased in Medicaid expansion states, we do not have data about how base payment rates changed.
34 The subset of hospitals used to examine three-year trends in DSH hospital uncompensated care costs in Table 3-4 is smaller than the subset used in Tables 3-2 and 3-3 to examine the change in costs between SPRY 2013 and 2014, so the numbers in these tables do not match.
35 For states to spend the same amount of DSH funding in FY 2020 as they spent in FY 2016, DSH payments to individual hospitals may not exceed those hospitals’ uncompensated care costs. Unspent DSH funds for a given year cannot be used for DSH expenditures for future years.
36 Additional analyses of potential strategic state responses to the DSH allotment reduction methodology proposed by CMS are provided in Chapter 2 of MACPAC’s 2016 DSH report (MACPAC 2016).

Chapter 3: Annual Analysis of Disproportionate Share Hospital Allotments to States
82 March 2019
37 For Medicaid DSH purposes, uncompensated care includes Medicaid shortfall, which is not included in the Medicare cost report definition of uncompensated care. As a result, the total amount of uncompensated care reported on Medicare cost reports may differ from the amount of uncompensated care costs states may be able to pay for with Medicaid DSH funds.
ReferencesAgency for Healthcare Research and Quality (AHRQ), U.S. Department of Health and Human Services. 2019. Compendium of U.S. health systems, 2016. Rockville, MD: AHRQ. https://www.ahrq.gov/chsp/compendium/index.html.
Agency for Healthcare Research and Quality (AHRQ), U.S. Department of Health and Human Services. 2018a. HCUP fast stats: Trends in inpatient stays. Healthcare Cost and Utilization Project (HCUP). Rockville, MD: AHRQ. https://www.hcup-us.ahrq.gov/faststats/NationalTrendsServlet?measure1=01&characteristic1=04& time1=10&measure2=characteristic2=01&time2=10& expansionInfoState=hide&dataTablesState=hide&definitions State=hide&exportState=hide.
Agency for Healthcare Research and Quality (AHRQ), U.S. Department of Health and Human Services. 2018b. HCUPnet. Healthcare Cost and Utilization Project (HCUP). Rockville, MD: AHRQ. https://hcupnet.ahrq.gov/#setup.
American Hospital Association (AHA). 2018. AHA annual survey data. Chicago, IL: AHA. https://ahasurvey.org/taker/asindex.do.
American Hospital Association (AHA). 2017. Underpayment by Medicare and Medicaid fact sheet. December 2017. Washington, DC: AHA. https://www.aha.org/data-insights/2018-01-03-underpayment-medicare-and-medicaid-fact-sheet-december-2017-update.
American Hospital Association (AHA). 2016. Underpayment by Medicare and Medicaid fact sheet. December 2016. Washington, DC: AHA. https://www.aha.org/system/files/2018-02/2016-dec-medicaremedicaidunderpmt.pdf.
American Hospital Association (AHA). 2015. Underpayment by Medicare and Medicaid fact sheet. Washington, DC: AHA. https://www.aha.org/2015-underpayment-medicare-medicaid/.
Artiga, S., R. Garfield, and A. Damico. 2018. Estimated impacts of the proposed public charge rule on immigrants and Medicaid. Washington, DC: Kaiser Family Foundation. https://www.kff.org/disparities-policy/issue-brief/estimated-impacts-of-the-proposed-public-charge-rule-on-immigrants-and-medicaid/.
Avalere Health. 2018. Profile of the Medicaid expansion population: Demographics, enrollment, and utilization. Washington, DC: Avalere Health. http://go.avalere.com/acton/attachment/12909/f-0517/1/-/-/-/-/Avalere%20Medicaid%20Expansion%20Analysis.pdf.
Bai, G., and G.F. Anderson. 2016. A more detailed understanding of factors associated with hospital profitability. Health Affairs 35, no. 5: 889–897. https://www.healthaffairs.org/doi/10.1377/hlthaff.2015.1193.
Berchick, E., E.R. Hood, and J.C. Barnett. 2018. Health insurance coverage in the United States: 2017. Current population reports, P60-264. Washington, DC: U.S. Government Printing Office. https://www.census.gov/content/dam/Census/library/publications/2018/demo/p60-264.pdf.
Centers for Medicare & Medicaid Services (CMS), U.S. Department of Health and Human Services. 2018a. Medicare program; hospital inpatient prospective payment systems for acute care hospitals and the long-term care hospital prospective payment system and policy changes and fiscal year 2019 rates; quality reporting requirements for specific providers; Medicare and Medicaid electronic health record (EHR) incentive programs (promoting interoperability programs) requirements for eligible hospitals, critical access hospitals, and eligible professionals; Medicare cost reporting requirements; and physician certification and recertification of claims. Final rule. Federal Register 83, no. 160 (August 17): 41144–41784. https://www.federalregister.gov/d/2018-16766.

Chapter 3: Annual Analysis of Disproportionate Share Hospital Allotments to States
83Report to Congress on Medicaid and CHIP
Centers for Medicare & Medicaid Services (CMS), U.S. Department of Health and Human Services. 2018b. Additional information on DSH reporting and audit requirements. Baltimore, MD: CMS. https://www.medicaid.gov/medicaid/finance/downloads/part-1-additional-info-on-dsh-reporting-and-auditing.pdf.
Centers for Medicare and Medicaid Services (CMS), U.S. Department of Health and Human Services. 2017a. Medicare provider reimbursement manual: Part 2, provider cost reporting forms and instructions. Transmittal 11, September 29, 2017. Baltimore, MD: CMS. https://www.cms.gov/Regulations-and-Guidance/Guidance/Transmittals/2017Downloads/R11p240.pdf.
Centers for Medicare & Medicaid Services (CMS), U.S. Department of Health and Human Services. 2017b. Medicaid program: State disproportionate share hospital allotment reductions. Proposed rule. Federal Register 82, no. 144 (July 28): 33155–35171. https://www.federalregister.gov/d/2017-15962.
Congressional Budget Office (CBO). 2018a. Federal subsidies for health insurance coverage for people under age 65: 2018 to 2028. Washington, DC: CBO. https://www.cbo.gov/publication/53091.
Congressional Budget Office (CBO), 2018b. An update to the economic outlook: 2018 to 2028. Washington, DC: CBO. https://www.cbo.gov/publication/54318.
Employee Benefits Security Administration (EBSA), U.S. Department of Labor. 2018. Definition of “employer” under Section 3(5) of ERISA-association health plans. Final rule. Federal Register 83, no. 120 (June 21): 28912–28964. https://www.federalregister.gov/d/2018-12992.
Holahan, J., B.K. Bruen, and D. Liska. 1998. The decline in Medicaid spending growth in 1996: Why did it happen? Washington, DC: Urban Institute. http://webarchive.urban.org/UploadedPDF/410365.pdf.
Internal Revenue Service, U.S. Department of the Treasury; Employee Benefits Security Administration, U.S. Department of Labor; and Centers for Medicare & Medicaid Services, U.S. Department of Health and Human Services (IRS, EBSA, and CMS). 2018. Final rule. Short-term, limited-duration insurance. Federal Register 83, no. 150 (August 3): 38212–
38243. https://www.federalregister.gov/d/2018-16568.
Marks, T., K. Gifford, S. Perlin, et al. 2018. Factors affecting the development of Medicaid hospital payment policies: Findings from structured interviews in five states. Final report to the Medicaid and CHIP Payment and Access Commission. Washington, DC: Health Management Associates. https://www.macpac.gov/publication/factors-affecting-the-development-of-medicaid-hospital-payment-policies-findings-from-structured-interviews-in-five-states.
Medicaid and CHIP Payment and Access Commission (MACPAC). 2018a. Chapter 3: Annual analysis of disproportionate share hospital allotments to states. In Report to Congress on Medicaid and CHIP. March 2018. Washington, DC: MACPAC. https://www.macpac.gov/publication/annual-analysis-of-disproportionate-share-hospital-allotments-to-states/.
Medicaid and CHIP Payment and Access Commission (MACPAC). 2018b. Exhibit 10: Medicaid enrollment and total spending levels and annual growth, FYs 1966–2017. In MACStats: Medicaid and CHIP Data Book. December 2018. Washington, DC: MACPAC. https://www.macpac.gov/publication/medicaid-enrollment-and-total-spending-levels-and-annual-growth/.
Medicaid and CHIP Payment and Access Commission (MACPAC). 2017a. Chapter 3: Improving the targeting of disproportionate share hospital payments to providers. In Report to Congress on Medicaid and CHIP. March 2017. Washington, DC: MACPAC. https://www.macpac.gov/publication/improving-the-targeting-of-disproportionate-share-hospital-payments-to-providers/.
Medicaid and CHIP Payment and Access Commission (MACPAC). 2017b. Letter from Penny Thompson to Thomas E. Price regarding “CMS-2394-P Medicaid program: Disproportionate share hospital allotment reductions.” August 28, 2017. https://www.macpac.gov/publication/comments-on-proposed-dsh-reduction-rule/.
Medicaid and CHIP Payment and Access Commission (MACPAC). 2016. Report to Congress on Medicaid disproportionate share hospital payments. February 2016. Washington, DC: MACPAC. https://www.macpac.gov/publication/report-to-congress-on-medicaid-disproportionate-share-hospital-payments/.

Chapter 3: Annual Analysis of Disproportionate Share Hospital Allotments to States
84 March 2019
Miller, G.E., J.P. Vistnes, F. Rohde, and P.S. Keenan. 2018. High-deductible health plan enrollment increased from 2006 to 2016, employer-funded accounts grew in largest firms. Health Affairs 37, no. 8: 1231–1237. https://doi.org/10.1377/hlthaff.2018.0188.
Nelb, R., J. Teisl, A. Dobson, et al. 2016. For disproportionate-share hospitals, taxes and fees curtail Medicaid payments. Health Affairs 35, no. 12: 2277–2281. https://www.healthaffairs.org/doi/10.1377/hlthaff.2016.0602.
Nikpay, S.S., M.R. Richards, and D. Penson. 2018. Hospital-physician consolidation accelerated in the past decade in cardiology, oncology. Health Affairs 37, no. 7: 1123–1127. https://www.healthaffairs.org/doi/10.1377/hlthaff.2017.1520.
Nikpay, S., T. Buchmueller, and H.G. Levy. 2016. Affordable Care Act Medicaid expansion reduced uninsured hospital stays in 2014. Health Affairs 35, no. 1: 106–110. https://www.healthaffairs.org/doi/full/10.1377/hlthaff.2015.1144.
Timbie, J.W., J.L. Liu, M. DeYoreo, et al. 2018. Evaluation of the global payment program: Midpoint report. Santa Monica, CA: RAND corporation. http://www.dhcs.ca.gov/provgovpart/Documents/GPP/GPP_MidpointRpt_July2018.pdf.
U.S. Census Bureau (Census), U.S. Department of Commerce. 2019. American Community Survey data. Suitland, MD: Census. https://www.census.gov/programs-surveys/acs/data.html.
U.S. Census Bureau (Census), U.S. Department of Commerce. 2017. Health insurance: Guidance for data users. Suitland, MD: Census. http://www.census.gov/topics/health/health-insurance/guidance.html.
U.S. Citizenship and Immigration Services (USCIS), U.S. Department of Homeland Security. 2018. Inadmissibility on public charge grounds. Notice of proposed rulemaking. Federal Register 83, no. 196 (October 10): 51114–51296. https://www.gpo.gov/fdsys/pkg/FR-2018-10-10/pdf/2018-21106.pdf.

Chapter 3: APPENDIX 3A
85Report to Congress on Medicaid and CHIP
APPENDIX 3A: State-Level DataTABLE 3A-1. State DSH Allotments, FYs 2019 and 2020 (millions)
State
FY 2019 FY 2020
Total (state and federal) Federal Total (state and federal) Federal
Total $22,281.1 $12,627.6 $15,738.0 $8,935.3Alabama 492.4 353.9 296.6 213.2Alaska 46.9 23.4 44.5 22.2Arizona 166.9 116.5 118.6 82.8Arkansas 70.4 49.7 62.0 43.7California 2,523.5 1,261.7 1,854.7 927.4Colorado 212.9 106.5 160.0 80.0Connecticut 460.4 230.2 332.0 166.0Delaware 18.1 10.4 16.8 9.7District of Columbia 100.7 70.5 67.4 47.2Florida 378.2 230.2 277.3 168.8Georgia 457.4 309.3 360.4 243.7Hawaii 20.8 11.2 19.8 10.7Idaho 26.6 18.9 25.0 17.8Illinois 491.9 247.5 398.2 200.4Indiana 373.0 246.0 264.9 174.7Iowa 75.6 45.3 70.8 42.5Kansas 83.1 47.5 57.5 32.8Kentucky 232.9 166.9 150.5 107.8Louisiana 1,214.1 789.2 895.2 581.9Maine 187.3 120.9 154.3 99.6Maryland 175.5 87.8 121.7 60.8Massachusetts 702.1 351.0 402.2 201.1Michigan 473.2 305.0 287.4 185.2Minnesota 171.9 86.0 162.3 81.2Mississippi 229.8 175.5 178.5 136.3Missouri 833.7 545.3 572.0 374.1Montana 19.9 13.1 18.1 11.9Nebraska 61.9 32.6 56.7 29.8Nevada 82.1 53.2 74.1 48.0New Hampshire 368.5 184.3 271.1 135.6New Jersey 1,481.9 740.9 1,001.0 500.5New Mexico 32.4 23.4 30.4 22.0New York 3,697.5 1,848.7 2,484.4 1,242.2North Carolina 505.6 339.5 349.2 234.5

Chapter 3: APPENDIX 3A
86 March 2019
TABLE 3A-1. (continued)
State
FY 2019 FY 2020
Total (state and federal) Federal Total (state and federal) Federal
North Dakota $22.0 $11.0 $21.5 $10.7Ohio 741.1 467.6 430.4 271.5Oklahoma 66.8 41.7 62.7 39.1Oregon 83.3 52.1 75.3 47.1Pennsylvania 1,236.3 646.0 775.4 405.2Rhode Island 142.3 74.8 77.8 40.9South Carolina 529.3 376.9 366.4 261.0South Dakota 22.4 12.7 22.1 12.5Tennessee 80.6 53.1 80.6 53.1Texas 1,891.4 1,100.6 1,497.7 871.5Utah 32.4 22.6 28.8 20.1Vermont 48.1 25.9 27.0 14.5Virginia 201.7 100.8 132.5 66.2Washington 425.9 212.9 257.5 128.8West Virginia 104.5 77.7 70.7 52.6Wisconsin 183.3 108.8 175.8 104.4Wyoming 0.5 0.3 0.5 0.2
Notes: DSH is disproportionate share hospital. FY is fiscal year. Under current law, federal DSH allotments will be reduced by $4 billion in FY 2020. DSH allotment estimates for FY 2020 are based on the DSH allotment reduction methodology that CMS proposed in July 2017; these estimates may change if CMS changes this methodology when it finalizes this DSH allotment reduction rule.
Source: MACPAC, 2019, analysis of Census 2019, CBO 2018b, 2016 Medicare cost reports, and the CMS Medicaid Budget and Expenditure System.
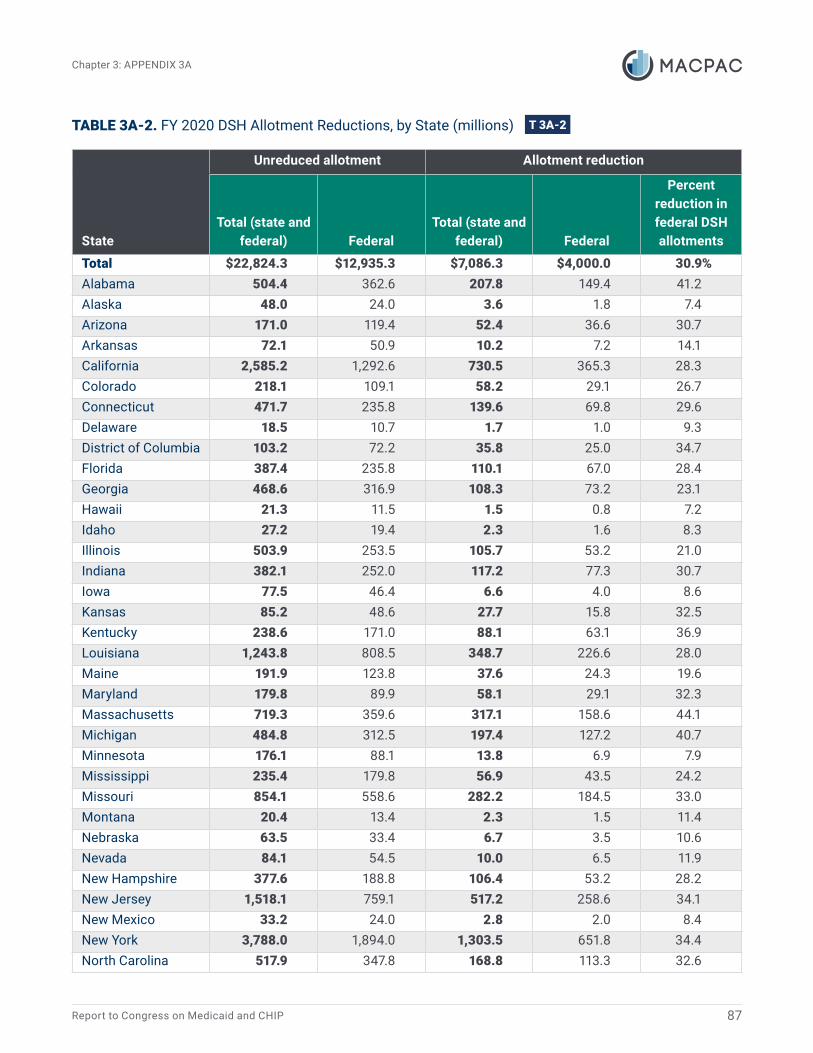
Chapter 3: APPENDIX 3A
87Report to Congress on Medicaid and CHIP
TABLE 3A-2. FY 2020 DSH Allotment Reductions, by State (millions)
State
Unreduced allotment Allotment reduction
Total (state and federal) Federal
Total (state and federal) Federal
Percent reduction in federal DSH allotments
Total $22,824.3 $12,935.3 $7,086.3 $4,000.0 30.9%Alabama 504.4 362.6 207.8 149.4 41.2Alaska 48.0 24.0 3.6 1.8 7.4Arizona 171.0 119.4 52.4 36.6 30.7Arkansas 72.1 50.9 10.2 7.2 14.1California 2,585.2 1,292.6 730.5 365.3 28.3Colorado 218.1 109.1 58.2 29.1 26.7Connecticut 471.7 235.8 139.6 69.8 29.6Delaware 18.5 10.7 1.7 1.0 9.3District of Columbia 103.2 72.2 35.8 25.0 34.7Florida 387.4 235.8 110.1 67.0 28.4Georgia 468.6 316.9 108.3 73.2 23.1Hawaii 21.3 11.5 1.5 0.8 7.2Idaho 27.2 19.4 2.3 1.6 8.3Illinois 503.9 253.5 105.7 53.2 21.0Indiana 382.1 252.0 117.2 77.3 30.7Iowa 77.5 46.4 6.6 4.0 8.6Kansas 85.2 48.6 27.7 15.8 32.5Kentucky 238.6 171.0 88.1 63.1 36.9Louisiana 1,243.8 808.5 348.7 226.6 28.0Maine 191.9 123.8 37.6 24.3 19.6Maryland 179.8 89.9 58.1 29.1 32.3Massachusetts 719.3 359.6 317.1 158.6 44.1Michigan 484.8 312.5 197.4 127.2 40.7Minnesota 176.1 88.1 13.8 6.9 7.9Mississippi 235.4 179.8 56.9 43.5 24.2Missouri 854.1 558.6 282.2 184.5 33.0Montana 20.4 13.4 2.3 1.5 11.4Nebraska 63.5 33.4 6.7 3.5 10.6Nevada 84.1 54.5 10.0 6.5 11.9New Hampshire 377.6 188.8 106.4 53.2 28.2New Jersey 1,518.1 759.1 517.2 258.6 34.1New Mexico 33.2 24.0 2.8 2.0 8.4New York 3,788.0 1,894.0 1,303.5 651.8 34.4North Carolina 517.9 347.8 168.8 113.3 32.6

Chapter 3: APPENDIX 3A
88 March 2019
TABLE 3A-2. (continued)
State
Unreduced allotment Allotment reduction
Total (state and federal) Federal
Total (state and federal) Federal
Percent reduction in federal DSH allotments
North Dakota $22.5 $11.3 $1.1 $0.5 4.7%Ohio 759.3 479.0 328.9 207.5 43.3Oklahoma 68.5 42.7 5.8 3.6 8.4Oregon 85.3 53.4 10.0 6.3 11.8Pennsylvania 1,266.6 661.8 491.2 256.6 38.8Rhode Island 145.8 76.6 68.0 35.7 46.6South Carolina 542.2 386.2 175.8 125.2 32.4South Dakota 23.0 13.0 0.9 0.5 3.8Tennessee1 80.6 53.1 – – –Texas 1,937.7 1,127.5 440.0 256.0 22.7Utah 33.2 23.1 4.4 3.1 13.2Vermont 49.2 26.5 22.2 12.0 45.2Virginia 206.6 103.3 74.1 37.1 35.9Washington 436.3 218.1 178.7 89.4 41.0West Virginia 107.1 79.6 36.4 27.0 34.0Wisconsin 187.7 111.5 12.0 7.1 6.4Wyoming 0.5 0.3 0.1 0.0 9.8
Notes: DSH is disproportionate share hospital. FY is fiscal year. DSH allotment estimates for FY 2020 are based on the DSH allotment reduction methodology that CMS proposed in July 2017; these estimates may change if CMS changes this methodology when it finalizes this DSH allotment reduction rule.
― Dash indicates zero; 0.0 indicates a non-zero amount less than $0.5 million.1 Tennessee is not subject to DSH allotment reductions because its DSH allotment is specified in statute (§ 1923(f)(6)(A) of the Social Security Act).
Source: MACPAC, 2019, analysis of Census 2019, CBO 2018b, 2016 Medicare cost reports, and the CMS Medicaid Budget and Expenditure System.

Chapter 3: APPENDIX 3A
89Report to Congress on Medicaid and CHIP
TABLE 3A-3. Number of Uninsured Individuals and Uninsured Rate, by State, 2013–2017
State
2013 2017Difference in uninsured
(2017-2013)
Number (thousands)
Percent of state
populationNumber
(thousands)
Percent of state
populationNumber
(thousands)Percentage
point change
Total 45,181 14.5% 28,019 8.7% -17,162 -5.8%Alabama 645 13.6 449 9.4 -196 -4.2Alaska 132 18.5 98 13.7 -34 -4.8Arizona 1,118 17.1 695 10.1 -423 -7.1Arkansas 465 16.0 232 7.9 -233 -8.1California 6,500 17.2 2,797 7.2 -3,703 -10.0Colorado 729 14.1 414 7.5 -315 -6.6Connecticut 333 9.4 194 5.5 -139 -3.9Delaware 83 9.1 51 5.4 -32 -3.7District of Columbia 42 6.7 26 3.8 -16 -2.8Florida 3,853 20.0 2,676 12.9 -1,177 -7.1Georgia 1,846 18.8 1,375 13.4 -471 -5.4Hawaii 91 6.7 53 3.8 -38 -2.9Idaho 257 16.2 172 10.1 -85 -6.0Illinois 1,618 12.7 859 6.8 -759 -5.9Indiana 903 14.0 536 8.2 -367 -5.8Iowa 248 8.1 146 4.7 -102 -3.4Kansas 348 12.3 249 8.7 -99 -3.5Kentucky 616 14.3 235 5.4 -381 -8.9Louisiana 751 16.6 383 8.4 -368 -8.3Maine 147 11.2 107 8.1 -40 -3.1Maryland 593 10.2 366 6.1 -227 -4.0Massachusetts 247 3.7 190 2.8 -57 -0.9Michigan 1,072 11.0 510 5.2 -562 -5.8Minnesota 440 8.2 243 4.4 -197 -3.8Mississippi 500 17.1 352 12.0 -148 -5.0Missouri 773 13.0 548 9.1 -225 -3.9Montana 165 16.5 88 8.5 -77 -8.0Nebraska 209 11.3 157 8.3 -52 -3.0Nevada 570 20.7 333 11.2 -237 -9.4New Hampshire 140 10.7 77 5.8 -63 -4.9New Jersey 1,160 13.2 688 7.7 -472 -5.5New Mexico 382 18.6 187 9.1 -195 -9.5

Chapter 3: APPENDIX 3A
90 March 2019
TABLE 3A-3. (continued)
State
2013 2017Difference in uninsured
(2017-2013)
Number (thousands)
Percent of state
populationNumber
(thousands)
Percent of state
populationNumber
(thousands)Percentage
point change
New York 2,070 10.7% 1,113 5.7% -957 -5.0%North Carolina 1,509 15.6 1,076 10.7 -433 -5.0North Dakota 73 10.4 56 7.5 -17 -2.8Ohio 1,258 11.0 686 6.0 -572 -5.1Oklahoma 666 17.7 545 14.2 -121 -3.5Oregon 571 14.7 281 6.8 -290 -7.8Pennsylvania 1,222 9.7 692 5.5 -530 -4.2Rhode Island 120 11.6 48 4.6 -72 -7.0South Carolina 739 15.8 542 11.0 -197 -4.8South Dakota 93 11.3 77 9.1 -16 -2.2Tennessee 887 13.9 629 9.5 -258 -4.4Texas 5,748 22.1 4,817 17.3 -931 -4.8Utah 402 14.0 282 9.2 -120 -4.8Vermont 45 7.2 28 4.6 -17 -2.7Virginia 991 12.3 729 8.8 -262 -3.5Washington 960 14.0 446 6.1 -514 -7.9West Virginia 255 14.0 109 6.1 -146 -7.9Wisconsin 518 9.1 309 5.4 -209 -3.7
Wyoming 77 13.4 70 12.3 -7 -1.2
Source: Berchick et al. 2018.

Chapter 3: A
PPEND
IX 3A
91Report to C
ongress on Medicaid and C
HIP
TABLE 3A-4. State Levels of Uncompensated Care, 2015–2016
State
Total hospital uncompensated care costs, 2015
Total hospital uncompensated care costs, 2016
Difference in total hospital uncompensated care costs (2016 less 2015)
Total (millions)Share of hospital
operating expenses Total (millions)Share of hospital
operating expenses Total (millions)Share of hospital operating expenses
(percentage point change)
Total $38,058 4.1% $35,002 3.6% -$3,056 -0.5%
Alabama 610 5.5 514 4.5 -96 -1.0
Alaska 101 3.8 105 3.6 4 -0.2
Arizona 458 2.8 307 1.9 -151 -0.9
Arkansas 250 3.6 193 2.7 -57 -0.9
California 2,141 1.9 1,810 1.5 -331 -0.4
Colorado 387 2.7 317 2.1 -69 -0.6
Connecticut 412 3.6 213 1.8 -199 -1.8
Delaware 73 2.2 71 2.1 -2 -0.2
District of Columbia 87 1.9 73 1.5 -14 -0.4
Florida 3,682 7.7 3,336 6.8 -346 -0.9
Georgia 1,788 7.4 1,865 7.4 77 0.0
Hawaii 47 1.3 51 1.3 4 0.0
Idaho 189 4.3 149 3.4 -40 -0.8
Illinois 1,444 3.8 1,458 3.6 14 -0.2
Indiana 1,073 5.1 751 3.3 -322 -1.7
Iowa 227 2.7 221 2.4 -6 -0.2
Kansas 343 4.1 283 3.2 -60 -0.9
Kentucky 310 2.3 273 1.9 -37 -0.4
Louisiana 966 7.2 587 4.2 -380 -3.0
Maine 198 3.7 189 3.3 -10 -0.4
Maryland 516 3.2 507 3.1 -9 -0.2
Massachusetts 519 1.9 552 1.9 33 0.0
Michigan 551 1.8 493 1.5 -58 -0.3
Minnesota 246 1.4 261 1.4 15 0.0
Mississippi 559 7.0 521 6.8 -38 -0.1
Missouri 1,133 5.4 1,016 4.6 -117 -0.8

Chapter 3: A
PPEND
IX 3A
92M
arch 2019
TABLE 3A-4. (continued)
State
Total hospital uncompensated care costs, 2015
Total hospital uncompensated care costs, 2016
Difference in total hospital uncompensated care costs (2016 less 2015)
Total (millions)Share of hospital
operating expenses Total (millions)Share of hospital
operating expenses Total (millions)Share of hospital operating expenses
(percentage point change)
Montana $155 3.9% $108 2.6% -$47 -1.3%
Nebraska 280 4.3 229 3.3 -51 -1.0
Nevada 218 3.7 174 2.8 -45 -0.9
New Hampshire 132 2.9 114 2.4 -18 -0.5
New Jersey 813 3.4 896 3.7 83 0.2
New Mexico 183 3.3 132 2.3 -51 -1.1
New York 2,554 3.6 2,448 3.3 -106 -0.3
North Carolina 1,594 6.3 1,782 6.6 187 0.4
North Dakota 85 2.2 89 2.2 4 0.0
Ohio 1,157 2.7 920 2.0 -237 -0.7
Oklahoma 645 6.1 565 5.2 -80 -1.0
Oregon 227 2.0 210 1.7 -17 -0.3
Pennsylvania 1,044 2.4 870 1.9 -175 -0.5
Rhode Island 75 2.1 73 2.0 -3 -0.2
South Carolina 1,008 8.2 878 6.8 -130 -1.4
South Dakota 97 2.4 103 2.4 6 0.0
Tennessee 864 5.1 825 4.7 -38 -0.4
Texas 6,188 9.2 5,713 8.1 -475 -1.1
Utah 301 4.5 323 4.5 22 0.0
Vermont 41 1.8 41 1.7 -0 -0.1
Virginia 1,116 5.8 1,375 6.7 258 1.0
Washington 349 1.7 365 1.7 16 0.0
West Virginia 165 2.7 134 2.1 -31 -0.6
Wisconsin 339 1.6 416 2.0 77 0.3
Wyoming 114 6.8 103 6.1 -11 -0.7

Chapter 3: A
PPEND
IX 3A
93Report to C
ongress on Medicaid and C
HIP
TABLE 3A-4. (continued)
Notes: Uncompensated care is calculated using Medicare cost reports, which define uncompensated care as charity care and bad debt. Because of recent changes in Medicare cost report definitions that changed uncompensated care reporting for 2015 and subsequent years, these data are not comparable with data for prior years.
0 or -0 indicates a non-zero amount between $500,000 and -$500,000 that rounds to zero.
Source: MACPAC, 2019, analysis of 2015 and 2016 Medicare cost reports.

Chapter 3: APPENDIX 3A
94 March 2019
TABLE 3A-5. Number and Share of Hospitals Receiving DSH Payments and Meeting Other Criteria, by State, 2014
StateNumber of
hospitals (all)
DSH hospitalsDeemed DSH
hospitals
Deemed DSH hospitals that provide at least one essential community service
Number Percent Number Percent Number Percent
Total 5,969 2,714 45% 832 14% 761 13%Alabama 114 63 55 4 4 4 4Alaska 25 4 16 1 4 1 4Arizona 104 39 38 39 38 31 30Arkansas 98 7 7 4 4 4 4California 401 44 11 41 10 36 9Colorado 99 71 72 16 16 16 16Connecticut 41 9 22 3 7 2 5Delaware 13 2 15 2 15 2 15District of Columbia 13 9 69 6 46 6 46Florida 251 72 29 40 16 37 15Georgia 168 126 75 33 20 22 13Hawaii1 25 – – – – – –Idaho 47 23 49 7 15 6 13Illinois 206 56 27 47 23 42 20Indiana 167 51 31 11 7 11 7Iowa 121 7 6 7 6 7 6Kansas 150 62 41 12 8 12 8Kentucky 117 97 83 34 29 31 26Louisiana 208 67 32 34 16 30 14Maine 37 1 3 1 3 1 3Maryland 60 11 18 8 13 7 12Massachusetts2 97 – – – – – –Michigan 164 119 73 20 12 18 11Minnesota 144 57 40 13 9 13 9Mississippi 109 54 50 15 14 14 13Missouri 144 113 78 27 19 25 17Montana 65 34 52 3 5 3 5Nebraska 96 27 28 14 15 12 13Nevada 52 21 40 6 12 5 10New Hampshire 30 29 97 6 20 6 20New Jersey 97 69 71 23 24 23 24New Mexico 53 7 13 3 6 3 6New York 192 172 90 36 19 35 18

Chapter 3: APPENDIX 3A
95Report to Congress on Medicaid and CHIP
TABLE 3A-5. (continued)
StateNumber of
hospitals (all)
DSH hospitalsDeemed DSH
hospitals
Deemed DSH hospitals that provide at least one essential community service
Number Percent Number Percent Number Percent
North Carolina 132 74 56% 20 15% 20 15%North Dakota 49 8 16 3 6 3 6Ohio 230 159 69 17 7 16 7Oklahoma 152 50 33 13 9 11 7Oregon 63 59 94 15 24 15 24Pennsylvania 226 201 89 41 18 39 17Rhode Island 15 14 93 3 20 2 13South Carolina 83 58 70 14 17 14 17South Dakota 62 24 39 13 21 12 19Tennessee 142 65 46 18 13 12 8Texas 589 175 30 102 17 100 17Utah 59 42 71 5 8 4 7Vermont 16 13 81 1 6 1 6Virginia 108 24 22 6 6 6 6Washington 101 60 59 14 14 13 13West Virginia 61 51 84 10 16 8 13Wisconsin 144 103 72 20 14 19 13Wyoming 29 11 38 1 3 1 3
Notes: DSH is disproportionate share hospital. Excludes 111 DSH hospitals that did not submit a 2016 Medicare cost report. Deemed DSH hospitals are statutorily required to receive DSH payments because they serve a high share of Medicaid-enrolled and low-income patients. Deemed DSH status was estimated based on available data on Medicaid inpatient and low-income utilization rates. Our working definition of essential community services includes the following services: burn services, dental services, graduate medical education, HIV/AIDS care, inpatient psychiatric services (through psychiatric subunit or stand-alone psychiatric hospital), neonatal intensive care units, obstetrics and gynecology services, primary care services, substance use disorder services, and trauma services. For further discussion of the methodology and limitations, see Appendix 3B.
― Dash indicates zero.1 Hawaii did not report DSH spending in 2014.2 Massachusetts does not make DSH payments to hospitals because its Section 1115 demonstration allows the state to use all of its DSH funding for the state’s safety-net care pool instead; for this reason, no hospitals in the state can be characterized as DSH or deemed DSH hospitals.
Source: MACPAC, 2019, analysis of state plan rate year 2014 DSH audits, 2014 and 2016 Medicare cost reports, and the 2016 American Hospital Association annual survey.

Chapter 3: A
PPEND
IX 3A
96M
arch 2019
TABLE 3A-6. Number and Share of Hospital Beds and Medicaid Days Provided by Deemed DSH Hospitals, by State, 2014
State
Number of hospital beds Number of Medicaid days (thousands)
All hospitals
DSH hospitals Deemed DSH hospitals
All hospitals
DSH hospitals Deemed DSH hospitals
Number Percent Number Percent Number Percent Number Percent
Total 664,083 386,268 58% 140,872 21% 40,729 27,612 68% 14,846 36%
Alabama 12,650 8,701 69 586 5 670 462 69 51 8
Alaska 1,217 493 41 80 7 72 42 57 2 3
Arizona 12,091 5,861 48 5,861 48 916 654 71 654 71
Arkansas 8,044 1,429 18 1,080 13 318 73 23 57 18
California 61,564 7,004 11 5,910 10 4,935 1,092 22 960 19
Colorado 8,649 6,826 79 2,152 25 578 538 93 281 49
Connecticut 7,129 2,419 34 535 8 530 220 41 86 16
Delaware 2,280 269 12 269 12 143 8 6 8 6
District of Columbia 2,480 2,056 83 936 38 252 241 95 125 50
Florida 46,642 19,302 41 11,185 24 2,742 1,699 62 1,284 47
Georgia 18,521 15,109 82 4,949 27 1,152 1,099 95 548 48
Hawaii1 2,255 – – – – 162 – – – –
Idaho 2,573 1,839 71 918 36 119 105 89 61 52
Illinois 26,786 10,642 40 8,200 31 1,801 1,047 58 792 44
Indiana 14,700 5,090 35 2,403 16 776 358 46 249 32
Iowa 6,629 1,261 19 1,261 19 332 129 39 129 39
Kansas 7,177 3,837 53 1,197 17 227 166 73 75 33
Kentucky 12,294 11,329 92 4,487 36 789 761 96 439 56
Louisiana 14,764 6,775 46 3,304 22 652 380 58 263 40
Maine 2,702 51 2 51 2 135 1 1 1 1
Maryland 10,944 2,237 20 1,720 16 768 113 15 69 9
Massachusetts2 16,770 – – – – 1,318 – – – –
Michigan 20,600 17,057 83 4,988 24 1,195 1,039 87 553 46
Minnesota 9,376 5,849 62 1,781 19 586 492 84 254 43
Mississippi 9,106 5,523 61 2,355 26 456 297 65 175 38
Missouri 15,391 12,567 82 1,839 12 906 622 69 186 21

Chapter 3: A
PPEND
IX 3A
97Report to C
ongress on Medicaid and C
HIP
TABLE 3A-6. (continued)
State
Number of hospital beds Number of Medicaid days (thousands)
All hospitals
DSH hospitals Deemed DSH hospitals
All hospitals
DSH hospitals Deemed DSH hospitals
Number Percent Number Percent Number Percent Number Percent
Montana 2,607 1,872 72% 176 7% 72 69 96% 9 13%
Nebraska 4,749 3,145 66 1,856 39 156 147 94 113 72
Nevada 5,473 3,118 57 1,580 29 407 345 85 249 61
New Hampshire 2,356 2,356 100 749 32 83 83 100 49 59
New Jersey 18,780 16,495 88 5,329 28 1,023 955 93 438 43
New Mexico 3,777 1,141 30 415 11 316 158 50 92 29
New York 38,384 37,129 97 8,526 22 3,528 3,446 98 1,272 36
North Carolina 18,657 14,708 79 4,404 24 1,114 1,007 90 356 32
North Dakota 2,282 1,064 47 583 26 84 55 66 42 50
Ohio 27,120 23,256 86 4,606 17 1,620 1,506 93 633 39
Oklahoma 10,122 5,007 49 1,367 14 496 259 52 100 20
Oregon 5,920 5,589 94 1,555 26 390 384 99 180 46
Pennsylvania 31,590 30,153 95 5,868 19 1,641 1,617 99 593 36
Rhode Island 2,564 2,482 97 805 31 143 143 100 53 37
South Carolina 10,540 9,149 87 2,922 28 561 553 99 293 52
South Dakota 2,508 1,667 66 1,008 40 89 83 93 59 66
Tennessee 15,612 11,169 72 4,100 26 876 758 86 441 50
Texas 59,617 29,897 50 18,776 31 2,988 2,321 78 1,828 61
Utah 4,651 3,731 80 525 11 225 218 97 50 22
Vermont 980 814 83 344 35 48 47 99 27 58
Virginia 14,401 5,803 40 1,285 9 698 381 55 141 20
Washington 10,290 7,899 77 1,806 18 766 606 79 122 16
West Virginia 5,595 5,177 93 1,215 22 300 297 99 124 41
Wisconsin 10,916 9,410 86 2,999 27 551 527 96 278 51
Wyoming 1,258 511 41 26 2 24 9 39 0 2

Chapter 3: A
PPEND
IX 3A
98M
arch 2019
TABLE 3A-6. (continued)
Notes: DSH is disproportionate share hospital. Excludes 111 DSH hospitals that did not submit a 2016 Medicare cost report. Deemed DSH status was estimated based on available data on Medicaid inpatient and low-income utilization rates. For further discussion of the methodology and limitations, see Appendix 3B.
― Dash indicates zero; 0 indicates non-zero amount less than 500.1 Hawaii did not report DSH spending in 2014.2 Massachusetts does not make DSH payments to hospitals because its Section 1115 demonstration allows the state to use all of its DSH funding for the state’s safety-net care pool instead; for this reason, no hospitals in the state can be characterized as DSH or deemed DSH hospitals.
Source: MACPAC, 2019, analysis of 2014 and 2016 Medicare cost reports and state plan rate year 2014 DSH audits.

Chapter 3: A
PPEND
IX 3A
99Report to C
ongress on Medicaid and C
HIP
TABLE 3A-7. FY 2019 DSH Allotment per Uninsured Individual, by State (millions)
State
FY 2019 DSH allotmentFY 2019 DSH allotment per uninsured individual
FY 2019 DSH allotment per uninsured individual and Medicaid enrollee
Total (state and federal) Federal
Total (state and federal) Federal
Total (state and federal) Federal
Total $22,281.1 $12,627.6 $795.2 $450.7 $288.6 $163.6
Alabama 492.4 353.9 1,096.6 788.2 431.1 309.9
Alaska 46.9 23.4 478.5 239.2 213.0 106.5
Arizona 166.9 116.5 240.2 167.7 88.0 61.4
Arkansas 70.4 49.7 303.5 214.0 85.4 60.2
California 2,523.5 1,261.7 902.2 451.1 232.2 116.1
Colorado 212.9 106.5 514.3 257.2 170.5 85.2
Connecticut 460.4 230.2 2,373.1 1,186.6 629.6 314.8
Delaware 18.1 10.4 355.0 204.3 103.0 59.3
District of Columbia 100.7 70.5 3,873.4 2,711.4 628.1 439.6
Florida 378.2 230.2 141.3 86.0 70.6 43.0
Georgia 457.4 309.3 332.7 225.0 172.3 116.5
Hawaii 20.8 11.2 392.5 211.6 89.8 48.4
Idaho 26.6 18.9 154.6 110.0 69.7 49.6
Illinois 491.9 247.5 572.6 288.1 171.6 86.3
Indiana 373.0 246.0 695.9 459.0 263.4 173.7
Iowa 75.6 45.3 518.0 310.5 140.5 84.2
Kansas 83.1 47.5 333.9 190.7 157.7 90.0
Kentucky 232.9 166.9 990.9 710.2 205.6 147.3
Louisiana 1,214.1 789.2 3,170.0 2,060.5 878.1 570.7
Maine 187.3 120.9 1,750.5 1,129.5 762.4 491.9
Maryland 175.5 87.8 479.6 239.8 149.3 74.7
Massachusetts 702.1 351.0 3,695.2 1,847.6 537.5 268.8
Michigan 473.2 305.0 927.9 598.1 220.8 142.3
Minnesota 171.9 86.0 707.5 353.8 172.9 86.5
Mississippi 229.8 175.5 652.8 498.6 270.2 206.4
Missouri 833.7 545.3 1,521.4 995.0 695.3 454.7

Chapter 3: A
PPEND
IX 3A
100M
arch 2019
TABLE 3A-7. (continued)
State
FY 2019 DSH allotmentFY 2019 DSH allotment per uninsured individual
FY 2019 DSH allotment per uninsured individual and Medicaid enrollee
Total (state and federal) Federal
Total (state and federal) Federal
Total (state and federal) Federal
Montana $19.9 $13.1 $226.5 $148.5 $80.2 $52.6
Nebraska 61.9 32.6 394.5 207.5 189.6 99.7
Nevada 82.1 53.2 246.4 159.9 107.5 69.8
New Hampshire 368.5 184.3 4,786.2 2,393.1 1,730.7 865.4
New Jersey 1,481.9 740.9 2,153.9 1,076.9 813.6 406.8
New Mexico 32.4 23.4 173.5 125.4 45.3 32.7
New York 3,697.5 1,848.7 3,322.1 1,661.0 760.1 380.0
North Carolina 505.6 339.5 469.9 315.6 206.1 138.4
North Dakota 22.0 11.0 392.6 196.3 196.4 98.2
Ohio 741.1 467.6 1,080.4 681.6 289.0 182.3
Oklahoma 66.8 41.7 122.6 76.5 63.1 39.4
Oregon 83.3 52.1 296.4 185.4 84.4 52.8
Pennsylvania 1,236.3 646.0 1,786.6 933.5 505.7 264.2
Rhode Island 142.3 74.8 2,964.8 1,558.6 632.1 332.3
South Carolina 529.3 376.9 976.5 695.5 427.3 304.3
South Dakota 22.4 12.7 291.1 165.1 139.2 78.9
Tennessee 80.6 53.1 128.2 84.4 50.2 33.1
Texas 1,891.4 1,100.6 392.7 228.5 223.2 129.9
Utah 32.4 22.6 114.9 80.1 63.9 44.5
Vermont 48.1 25.9 1,716.2 924.9 320.6 172.8
Virginia 201.7 100.8 276.6 138.3 141.7 70.9
Washington 425.9 212.9 954.8 477.4 265.9 133.0
West Virginia 104.5 77.7 958.8 712.8 214.7 159.6
Wisconsin 183.3 108.8 593.1 352.1 188.5 111.9
Wyoming 0.5 0.3 7.4 3.7 4.5 2.3

Chapter 3: A
PPEND
IX 3A
101Report to C
ongress on Medicaid and C
HIP
TABLE 3A-7. (continued)
Notes: FY is fiscal year. DSH is disproportionate share hospital. Excludes DSH hospitals that did not submit a Medicare cost report. Calculations of DSH allotments per uninsured individual and Medicaid enrollee are based on the 2017 American Community Survey (ACS) from the U.S. Census Bureau. Estimates of Medicaid enrollment in the ACS include CHIP and other state-funded, means-tested programs; ACS estimates of Medicaid enrollment are typically lower than what is reported in administrative data.
Source: MACPAC, 2019, analysis of state plan rate year 2014 DSH audits, 2014 and 2016 Medicare cost reports, the American Hospital Association annual survey, and Census 2019.
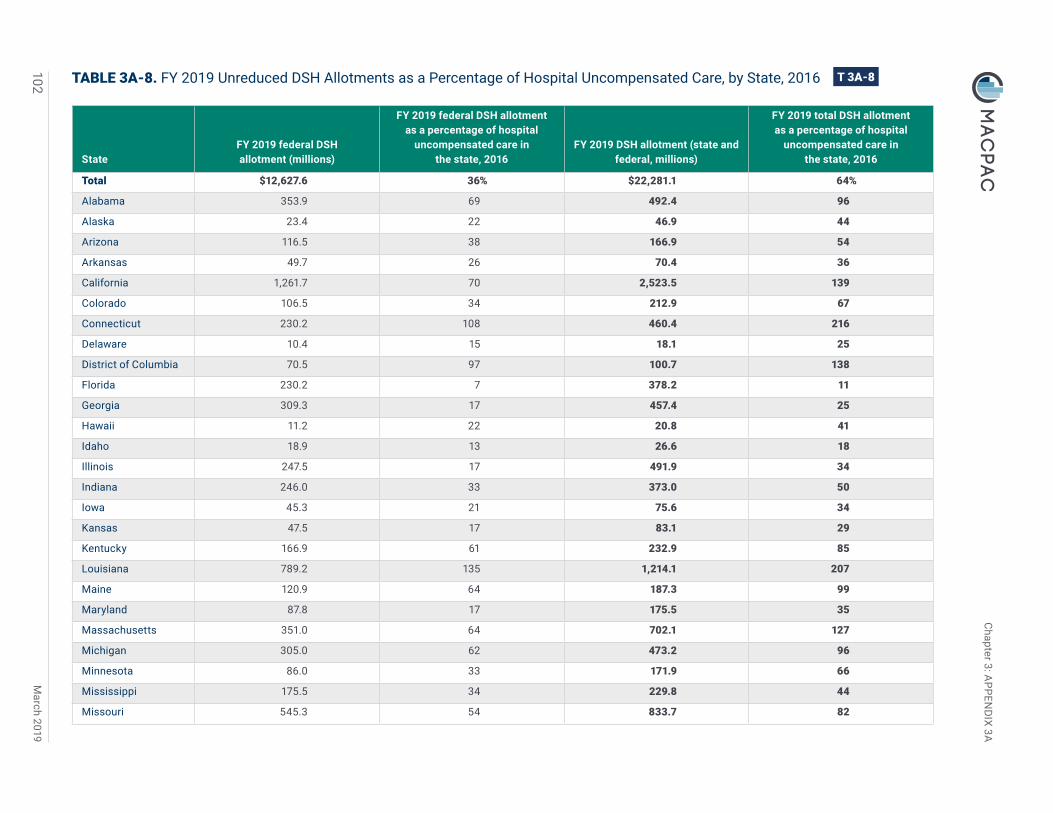
Chapter 3: A
PPEND
IX 3A
102M
arch 2019
TABLE 3A-8. FY 2019 Unreduced DSH Allotments as a Percentage of Hospital Uncompensated Care, by State, 2016
StateFY 2019 federal DSH allotment (millions)
FY 2019 federal DSH allotment as a percentage of hospital
uncompensated care in the state, 2016
FY 2019 DSH allotment (state and federal, millions)
FY 2019 total DSH allotment as a percentage of hospital
uncompensated care in the state, 2016
Total $12,627.6 36% $22,281.1 64%
Alabama 353.9 69 492.4 96
Alaska 23.4 22 46.9 44
Arizona 116.5 38 166.9 54
Arkansas 49.7 26 70.4 36
California 1,261.7 70 2,523.5 139
Colorado 106.5 34 212.9 67
Connecticut 230.2 108 460.4 216
Delaware 10.4 15 18.1 25
District of Columbia 70.5 97 100.7 138
Florida 230.2 7 378.2 11
Georgia 309.3 17 457.4 25
Hawaii 11.2 22 20.8 41
Idaho 18.9 13 26.6 18
Illinois 247.5 17 491.9 34
Indiana 246.0 33 373.0 50
Iowa 45.3 21 75.6 34
Kansas 47.5 17 83.1 29
Kentucky 166.9 61 232.9 85
Louisiana 789.2 135 1,214.1 207
Maine 120.9 64 187.3 99
Maryland 87.8 17 175.5 35
Massachusetts 351.0 64 702.1 127
Michigan 305.0 62 473.2 96
Minnesota 86.0 33 171.9 66
Mississippi 175.5 34 229.8 44
Missouri 545.3 54 833.7 82

Chapter 3: A
PPEND
IX 3A
103Report to C
ongress on Medicaid and C
HIP
TABLE 3A-8. (continued)
StateFY 2019 federal DSH allotment (millions)
FY 2019 federal DSH allotment as a percentage of hospital
uncompensated care in the state, 2016
FY 2019 DSH allotment (state and federal, millions)
FY 2019 total DSH allotment as a percentage of hospital
uncompensated care in the state, 2016
Montana $13.1 12% $19.9 18%
Nebraska 32.6 14 61.9 27
Nevada 53.2 31 82.1 47
New Hampshire 184.3 162 368.5 324
New Jersey 740.9 83 1,481.9 165
New Mexico 23.4 18 32.4 25
New York 1,848.7 76 3,697.5 151
North Carolina 339.5 19 505.6 28
North Dakota 11.0 12 22.0 25
Ohio 467.6 51 741.1 81
Oklahoma 41.7 7 66.8 12
Oregon 52.1 25 83.3 40
Pennsylvania 646.0 74 1,236.3 142
Rhode Island 74.8 103 142.3 195
South Carolina 376.9 43 529.3 60
South Dakota 12.7 12 22.4 22
Tennessee 53.1 6 80.6 10
Texas 1,100.6 19 1,891.4 33
Utah 22.6 7 32.4 10
Vermont 25.9 63 48.1 117
Virginia 100.8 7 201.7 15
Washington 212.9 58 425.9 117
West Virginia 77.7 58 104.5 78
Wisconsin 108.8 26 183.3 44
Wyoming 0.3 0 0.5 1

Chapter 3: A
PPEND
IX 3A
104M
arch 2019
TABLE 3A-8. (continued)
Notes: FY is fiscal year. DSH is disproportionate share hospital. Excludes DSH hospitals that did not submit a Medicare cost report. Uncompensated care is calculated using 2016 Medicare cost reports, which define uncompensated care as charity care and bad debt. Because of recent changes in Medicare cost report definitions that changed uncompensated care reporting for 2015 and subsequent years, these data are not comparable with data for prior years.
0 indicates a non-zero amount less than 0.5 percent.
Source: MACPAC, 2019, analysis of state plan rate year 2014 DSH audits, 2016 Medicare cost reports, and the American Hospital Association annual survey.

Chapter 3: A
PPEND
IX 3A
105Report to C
ongress on Medicaid and C
HIP
TABLE 3A-9. FY 2019 DSH Allotment per Deemed DSH Hospital Providing at Least One Essential Community Service, by State (millions)
State
FY 2019 DSH allotmentFY 2019 DSH allotment
per deemed DSH hospital
FY 2019 DSH allotment per deemed DSH hospital providing at least one
essential community service
Total (state and federal) Federal Total (state and federal) Federal Total (state and federal) Federal
Total $22,281.1 $12,627.6 $26.8 $15.2 $29.3 $16.6
Alabama 492.4 353.9 123.1 88.5 123.1 88.5
Alaska 46.9 23.4 46.9 23.4 46.9 23.4
Arizona 166.9 116.5 4.3 3.0 5.4 3.8
Arkansas 70.4 49.7 17.6 12.4 17.6 12.4
California 2,523.5 1,261.7 61.5 30.8 70.1 35.0
Colorado 212.9 106.5 13.3 6.7 13.3 6.7
Connecticut 460.4 230.2 153.5 76.7 230.2 115.1
Delaware 18.1 10.4 9.1 5.2 9.1 5.2
District of Columbia 100.7 70.5 16.8 11.7 16.8 11.7
Florida 378.2 230.2 9.5 5.8 10.2 6.2
Georgia 457.4 309.3 13.9 9.4 20.8 14.1
Hawaii1 20.8 11.2 – – – –
Idaho 26.6 18.9 3.8 2.7 4.4 3.2
Illinois 491.9 247.5 10.5 5.3 11.7 5.9
Indiana 373.0 246.0 33.9 22.4 33.9 22.4
Iowa 75.6 45.3 10.8 6.5 10.8 6.5
Kansas 83.1 47.5 6.9 4.0 6.9 4.0
Kentucky 232.9 166.9 6.8 4.9 7.5 5.4
Louisiana 1,214.1 789.2 35.7 23.2 40.5 26.3
Maine 187.3 120.9 187.3 120.9 187.3 120.9
Maryland 175.5 87.8 21.9 11.0 25.1 12.5
Massachusetts2 702.1 351.0 – – – –
Michigan 473.2 305.0 23.7 15.3 26.3 16.9
Minnesota 171.9 86.0 13.2 6.6 13.2 6.6
Mississippi 229.8 175.5 15.3 11.7 16.4 12.5

Chapter 3: A
PPEND
IX 3A
106M
arch 2019
TABLE 3A-9. (continued)
State
FY 2019 DSH allotmentFY 2019 DSH allotment
per deemed DSH hospital
FY 2019 DSH allotment per deemed DSH hospital providing at least one
essential community service
Total (state and federal) Federal Total (state and federal) Federal Total (state and federal) Federal
Missouri $833.7 $545.3 $30.9 $20.2 $33.3 $21.8
Montana 19.9 13.1 6.6 4.4 6.6 4.4
Nebraska 61.9 32.6 4.4 2.3 5.2 2.7
Nevada 82.1 53.2 13.7 8.9 16.4 10.6
New Hampshire 368.5 184.3 61.4 30.7 61.4 30.7
New Jersey 1,481.9 740.9 64.4 32.2 64.4 32.2
New Mexico 32.4 23.4 10.8 7.8 10.8 7.8
New York 3,697.5 1,848.7 102.7 51.4 105.6 52.8
North Carolina 505.6 339.5 25.3 17.0 25.3 17.0
North Dakota 22.0 11.0 7.3 3.7 7.3 3.7
Ohio 741.1 467.6 43.6 27.5 46.3 29.2
Oklahoma 66.8 41.7 5.1 3.2 6.1 3.8
Oregon 83.3 52.1 5.6 3.5 5.6 3.5
Pennsylvania 1,236.3 646.0 30.2 15.8 31.7 16.6
Rhode Island 142.3 74.8 47.4 24.9 71.2 37.4
South Carolina 529.3 376.9 37.8 26.9 37.8 26.9
South Dakota 22.4 12.7 1.7 1.0 1.9 1.1
Tennessee 80.6 53.1 4.5 3.0 6.7 4.4
Texas 1,891.4 1,100.6 18.5 10.8 18.9 11.0
Utah 32.4 22.6 6.5 4.5 8.1 5.6
Vermont 48.1 25.9 48.1 25.9 48.1 25.9
Virginia 201.7 100.8 33.6 16.8 33.6 16.8
Washington 425.9 212.9 30.4 15.2 32.8 16.4
West Virginia 104.5 77.7 10.5 7.8 13.1 9.7
Wisconsin 183.3 108.8 9.2 5.4 9.6 5.7
Wyoming 0.5 0.3 0.5 0.3 0.5 0.3

Chapter 3: A
PPEND
IX 3A
107Report to C
ongress on Medicaid and C
HIP
TABLE 3A-9. (continued)
Notes: FY is fiscal year. DSH is disproportionate share hospital. Excludes 111 DSH hospitals that did not submit a 2016 Medicare cost report. Deemed DSH status was estimated based on available data on Medicaid inpatient and low-income utilization rates. Our working definition of essential community services includes the following services: burn services, dental services, graduate medical education, HIV/AIDS care, inpatient psychiatric services (through psychiatric subunit or stand-alone psychiatric hospital), neonatal intensive care units, obstetrics and gynecology services, primary care services, substance use disorder services, and trauma services. For further discussion of the methodology and limitations, see Appendix 3B.
– Dash indicates that the category is not available.1 Hawaii did not report DSH spending in 2014.2 Massachusetts does not make DSH payments to hospitals because its Section 1115 demonstration allows the state to use all of its DSH funding for the state’s safety-net care pool instead; for this reason, no hospitals in the state can be categorized as DSH or deemed DSH hospitals.
Source: MACPAC, 2019, analysis of CMS Medicaid Budget and Expenditure System, state plan rate year 2014 DSH audits, 2014 and 2016 Medicare cost reports, and the 2016 American Hospital Association annual survey.

Chapter 3: A
PPEND
IX 3A
108M
arch 2019
TABLE 3A-10. Medicaid Payments to DSH Hospitals as a Share of Costs, by State, SPRY 2014
State
Share of hospitals in the state included
in analysis
Medicaid payments as a share of costs for Medicaid-enrolled patients
Medicaid payments as a share of costs for Medicaid-enrolled and uninsured patients
Base payments
Non-DSH supplemental
payments DSH paymentsTotal Medicaid
paymentsBase
payments
Non-DSH supplemental
payments DSH paymentsTotal Medicaid
payments
Total 44% 79% 12% 13% 103% 68% 10% 11% 88%
Alabama 56 73 19 33 125 55 14 25 95
Alaska 12 110 – 4 114 89 – 3 92
Arizona 39 44 27 5 75 39 24 4 67
Arkansas 6 74 18 25 116 60 14 20 95
California1 10 88 6 35 129 76 5 30 112
Colorado 72 69 30 8 107 60 26 7 93
Connecticut 15 77 3 4 84 75 3 4 82
Delaware 8 93 – 26 119 78 – 22 100
District of Columbia 23 89 0 15 104 84 0 15 99
Florida 28 91 15 4 110 75 13 3 90
Georgia 79 92 4 10 106 71 3 8 82
Idaho 53 99 2 4 104 84 1 4 89
Illinois2 26 77 28 11 116 67 24 10 101
Indiana 31 97 – 18 116 81 – 15 96
Iowa 6 84 6 10 100 78 6 10 94
Kansas 41 77 9 7 93 63 7 6 76
Kentucky 81 88 6 7 101 77 5 6 89
Louisiana 31 70 2 63 134 51 1 46 98
Maryland 13 107 – 12 119 89 – 10 99
Michigan 71 68 27 5 100 63 26 5 94
Minnesota3 35 85 6 1 92 82 6 1 89
Mississippi 53 83 19 15 117 68 16 12 97
Missouri 74 104 – 17 120 85 – 14 99
Montana 52 80 13 6 100 63 11 5 79

Chapter 3: A
PPEND
IX 3A
109Report to C
ongress on Medicaid and C
HIP
TABLE 3A-10. (continued)
State
Share of hospitals in the state included
in analysis
Medicaid payments as a share of costs for Medicaid-enrolled patients
Medicaid payments as a share of costs for Medicaid-enrolled and uninsured patients
Base payments
Non-DSH supplemental
payments DSH paymentsTotal Medicaid
paymentsBase
payments
Non-DSH supplemental
payments DSH paymentsTotal Medicaid
payments
Nebraska 23% 79% 0% 4% 83% 66% 0% 3% 69%
Nevada 42 72 11 9 91 56 8 7 71
New Jersey 65 84 5 25 114 62 4 19 85
New Mexico 13 89 13 5 107 74 11 4 89
New York 91 77 3 14 94 72 3 13 88
North Carolina 53 71 34 9 113 57 27 7 92
North Dakota2 6 117 – 2 119 105 – 2 107
Ohio 68 84 6 8 98 77 6 7 90
Oklahoma 32 76 29 4 110 64 24 3 91
Oregon 90 98 3 3 104 89 3 3 94
Pennsylvania 91 59 14 9 81 49 11 7 67
Rhode Island 80 85 1 14 100 79 1 13 93
South Carolina 72 90 3 19 112 72 2 15 89
Tennessee3 43 85 24 1 110 72 20 1 93
Texas 29 80 23 18 120 58 16 13 87
Utah 69 87 32 4 123 68 25 3 96
Vermont 81 80 – 10 90 76 – 9 86
Virginia3 22 88 11 10 108 69 8 8 85
Washington 56 82 (0) 8 89 75 -0 7 82
Wisconsin 67 75 16 1 93 68 15 1 84
Wyoming 38 78 12 1 90 54 8 0 63
Notes: DSH is disproportionate share hospital. SPRY is state plan rate year, which often coincides with state fiscal year and may not align with the federal fiscal year. This analysis includes 44 states and the District of Columbia and excludes Hawaii, Massachusetts, Maine, New Hampshire, South Dakota, and West Virginia. Institutions for mental diseases were also excluded. Base Medicaid payments include fee-for-service as well as managed care payments for services. Non-DSH supplemental payments include upper payment limit payments in fee-for-service Medicaid, graduate medical education payments, and supplemental payments authorized under Section 1115 demonstrations (except for delivery system reform incentive payments, which are not reported on DSH audits). DSH payments and non-DSH supplemental payments may also be used to offset non-Medicaid costs, such as unpaid costs of care for uninsured patients. Costs for uninsured patients are uncompensated care costs for uninsured patients, net of payments received from them. Payment levels shown do not account for provider contributions to the non-federal share; these contributions may reduce net payments. Numbers do not sum due to rounding.

Chapter 3: A
PPEND
IX 3A
110M
arch 2019
TABLE 3A-10. (continued)
― Dash indicates zero; 0 indicates a non-zero amount less than 0.5 percent.1 California public hospitals are eligible to receive DSH payments up to 175 percent of the hospital’s Medicaid uninsured costs.2 Illinois and North Dakota reported SPRY 2014 DSH payments that exceeded hospital uncompensated care costs for Medicaid and uninsured patients on their as-filed DSH audits. Because DSH payments to an individual hospital cannot exceed hospital uncompensated care costs, some of these payments may be recouped when these states’ DSH audits are finalized.3 Two DSH hospitals in Minnesota, all DSH hospitals in New Hampshire, three DSH hospitals in Tennessee, one DSH hospital in Virginia, and all DSH hospitals in West Virginia did not include payments from third-party payers when calculating Medicaid shortfall, so they are excluded from this analysis.
Source: MACPAC, 2019, analysis of SPRY 2014 as-filed Medicaid DSH audits.

Chapter 3: APPENDIX 3B
111Report to Congress on Medicaid and CHIP
APPENDIX 3B: Methodology and Data Limitations MACPAC used data from several different sources to analyze and describe Medicaid disproportionate share hospital (DSH) payments and their relationship to factors such as uninsured rates, uncompensated care, and DSH hospitals with high levels of uncompensated care that provide access to essential services. We also modeled DSH allotment reductions and simulated DSH payments under a variety of scenarios. Below we describe the data sources used in this analysis and the limitations associated with each one, and we review the modeling assumptions we made for our projections of DSH allotments and payments.
Primary Data Sources
DSH audit dataWe used state plan rate year 2014 DSH audit reports, the most recent data available, to examine historic DSH spending and the distribution of DSH spending among a variety of hospital types. These data were provided by the Centers for Medicare & Medicaid Services (CMS) on an as-filed basis and may be subject to change as CMS completes its internal review of state DSH audit reports.
Overall, 2,825 hospitals receiving DSH payments are represented in our analyses of DSH audit data. We did not include DSH audit data provided by states for hospitals that did not receive DSH payments (81 hospitals were excluded under this criterion). Some hospitals received DSH payments from multiple states; we combined the data for duplicate hospitals so that each hospital would only appear once in the dataset.
Medicare cost reportsWe used Medicare cost report data to examine uncompensated care for all hospitals in each state. A hospital that receives Medicare payments must file an annual Medicare cost report, which includes a range of financial and non-financial data about hospital performance and services provided. We excluded hospitals in U.S. territories, religious non-medical health care institutions, and hospitals participating in special Medicare demonstration projects (87 hospitals were excluded under these criteria). These facilities submit Medicare cost reports but do not receive Medicare DSH payments.
We linked DSH audit data and Medicare cost report data to create descriptive analyses of DSH hospitals and to identify deemed DSH hospitals. Hospitals were matched based on their CMS certification number. A total of 2,714 DSH hospitals were included in these analyses. We excluded 111 DSH hospitals without matching 2016 Medicare cost reports.
When using Medicare cost reports to analyze hospital uncompensated care, we excluded hospitals that reported uncompensated care costs that were greater than hospital operating expenses. One hospital was excluded under this criterion.
When using Medicare cost reports to analyze hospital operating margins, we excluded hospitals with operating margins that were more than 1.5 times the interquartile range above the highest quartiles or below the lowest quartile (445 hospitals were excluded under this criterion). Operating margins are calculated by subtracting operating expenses (OE) from net patient revenue (NPR) and dividing the result by net patient revenue: (NPR – OE) ÷ NPR. Total margins, in contrast, include additional types of hospital revenue, such as state or local subsidies and revenue from other facets of hospital operations (e.g., parking lot receipts).

Chapter 3: APPENDIX 3B
112 March 2019
Working Definition of Essential Community ServicesThe statute requires that MACPAC’s analysis include data identifying hospitals with high levels of uncompensated care that also provide access to essential community services for low-income, uninsured, and vulnerable populations, such as graduate medical education and the continuum of primary through quaternary care, including the provision of trauma care and public health services.
In this report, we use the same working definition to identify such hospitals that was used in MACPAC’s 2016 Report to Congress on Medicaid Disproportionate Share Hospital Payments. This working definition is based on a two-part test:
• Is the hospital a deemed DSH hospital?
• Does the hospital provide at least one essential service?
Deemed DSH hospital statusAccording to the Social Security Act (the Act), hospitals must meet one of two criteria to qualify as a deemed DSH hospital: (1) a Medicaid inpatient utilization rate greater than one standard deviation above the mean for hospitals in the state, or (2) a low-income utilization rate greater than 25 percent (§ 1923(b)(1) of the Act). Because deemed DSH hospitals are statutorily required to receive DSH payments, we excluded from our analysis hospitals that did not receive DSH payments in 2014.
Calculation of the Medicaid inpatient utilization rate threshold for each state requires data from all hospitals in that state, and we relied on Medicare cost reports to make those calculations and to determine which hospitals exceeded this threshold. A major limitation of this approach is that Medicaid inpatient utilization reported on Medicare cost reports does not include services
provided to Medicaid enrollees that were not paid for by Medicaid (e.g., Medicare-funded services for individuals who are dually eligible for Medicare and Medicaid). However, the Medicaid DSH definition of Medicaid inpatient utilization includes services provided to anyone who is eligible for Medicaid, even if Medicaid is not the primary payer. Thus, our identification of deemed DSH hospitals may omit some hospitals with high utilization by dually eligible beneficiaries and overstate the extent to which hospitals with low utilization by dually eligible beneficiaries (e.g., children’s hospitals) exceed the threshold.
The low-income utilization rate threshold for deemed DSH hospitals is the same for all states (25 percent), so we were able to use Medicaid DSH audit data to determine whether hospitals met this criterion. However, about one-quarter of DSH hospitals did not provide data on the rate of low-income utilization on their DSH audits, and these omissions limited our ability to identify all deemed DSH hospitals.
Provision of essential community servicesBecause the term essential community services is not otherwise defined in statute or regulation, we identified a number of services that could be considered essential community services using available data from 2016 Medicare cost reports and the 2016 American Hospital Association (AHA) annual survey (Table 3B-1). Services were selected for inclusion if they were directly mentioned in the statute requiring this report or if they were related services mentioned in the cost reports or the AHA annual survey.

Chapter 3: APPENDIX 3B
113Report to Congress on Medicaid and CHIP
TABLE 3B-1. Essential Community Services, by Data Source
Data source Service type
American Hospital Association annual survey Burn services Dental services HIV/AIDS care Neonatal intensive care units Obstetrics and gynecology services Primary care services Substance use disorder servicesTrauma services
Medicare cost reports Graduate medical education Inpatient psychiatric services (through psychiatric subunit or stand-alone psychiatric hospital)
For this report, for the sake of inclusiveness, any deemed DSH hospital providing at least one essential community service was included in our analysis. We also included certain hospital types if they were the only hospital in their geographic area to provide certain types of services. These hospital types included critical access hospitals because they are often the only hospital within a 25-mile radius.
Projections of DSH Allotments Unreduced DSH allotments for FY 2023 were calculated by increasing prior year allotments based on inflation. We used the projections of the Consumer Price Index for All Urban Consumers in
the Congressional Budget Office’s August economic baseline (CBO 2018). Unreduced allotments increase each year for all states except Tennessee, whose DSH allotment is specified in statute (§ 1923(f)(6)(A)(vi) of the Social Security Act).
We estimated DSH allotment reductions under current law using the DSH allotment reduction methodology that CMS proposed in July 2017 (CMS 2017). We used a variety of data sources to estimate the factors used in CMS’s methodology and the most recently available data (Table 3B-2). We then calculated reductions based on these factors using a model for estimating DSH allotment reductions that Dobson DaVanzo & Associates and KNG Health previously developed for MACPAC (MACPAC 2016).
TABLE 3B-2. Data Sources for Factors Used in the CMS DSH Allotment Reduction Model
DSH allotment reduction factor Data source (year)
Low DSH Specified in statute (N/A)Uninsured percentage American Community Survey (2017)High volume of Medicaid inpatients Medicare cost reports (2014) and DSH audits (2014)High level of uncompensated care DSH audits (2014)Budget neutrality CMS Financial Management Group (2014)
Notes: CMS is the Centers for Medicare & Medicaid Services. DSH is disproportionate share hospital. N/A is not applicable.