chapter 3 control charts for variables...xbar-r charts. • control limits for s chart are: lcl b s...
TRANSCRIPT
10/05/1436
1
Chapter 3
University of Hail College of Engineering
ISE 320 - Quality Control and Industrial Statistics
Prof. Mohamed AichouniProf. Mohamed Aichouni
Chapter 3 Control Charts for Variables
Lectures notes adapted from: PowerPoint presentation to accompany Besterfield, Quality Improvement, 9th edition
Course Webpage: faculty.uoh.edu.sa/m.aichouni/ise320-quality/
Lectures notes adapted from: PowerPoint presentation to accompany Besterfield, Quality Improvement, 9th edition
Course Webpage: faculty.uoh.edu.sa/m.aichouni/ise320-quality/
• The variation concept is a law of nature in that no two natural items are the same.Th i ti b it l d il
variation
The variation may be quite large and easily noticeableThe variation may be very small. It may appear that items are identical; however, precision instruments will show differenceTh bilit t i ti i b f
2
The ability to measure variation is necessary before it can be controlled
10/05/1436
2
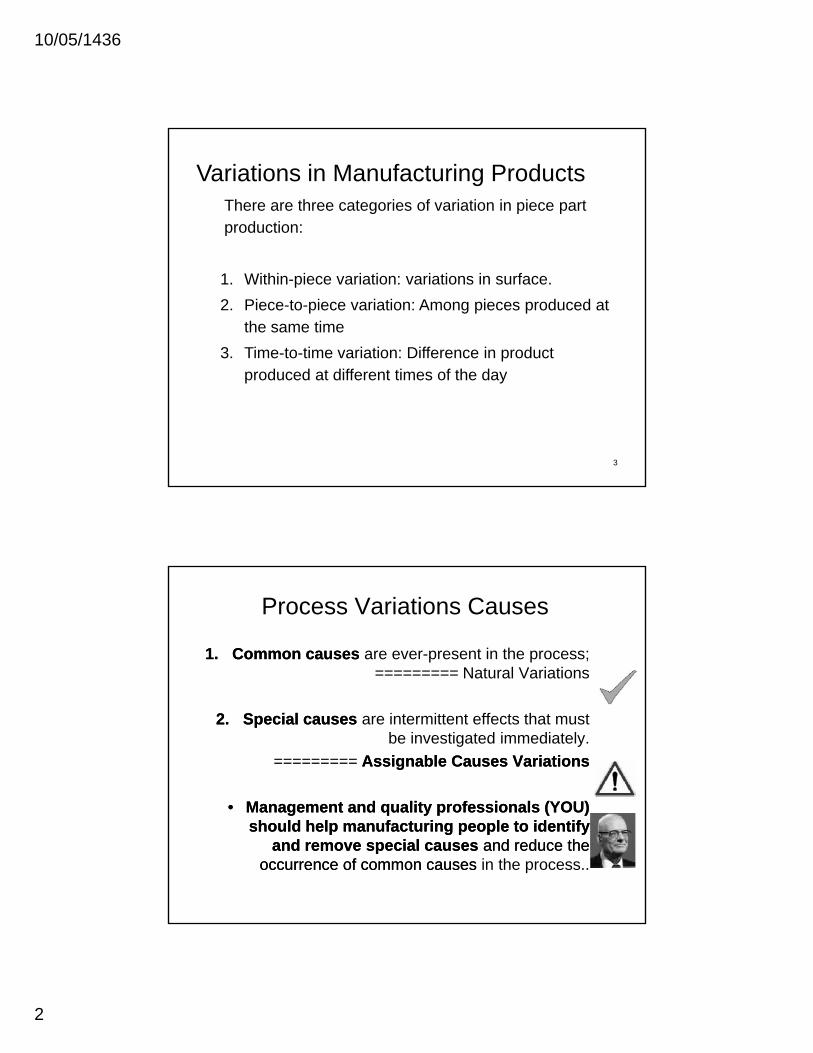
There are three categories of variation in piece part production:
Variations in Manufacturing Products
1. Within-piece variation: variations in surface.2. Piece-to-piece variation: Among pieces produced at
the same time3. Time-to-time variation: Difference in product
3
produced at different times of the day
Process Variations Causes
1.1. Common causesCommon causes are ever-present in the process;========= Natural Variations
2.2. Special causesSpecial causes are intermittent effects that must be investigated immediately.
========= Assignable Causes VariationsAssignable Causes Variations
Management and quality professionals (YOU)Management and quality professionals (YOU)•• Management and quality professionals (YOU) Management and quality professionals (YOU) should help manufacturing people to identify should help manufacturing people to identify
and remove special causes and remove special causes and reduce the and reduce the occurrence of common causesoccurrence of common causes in the process..
10/05/1436
3
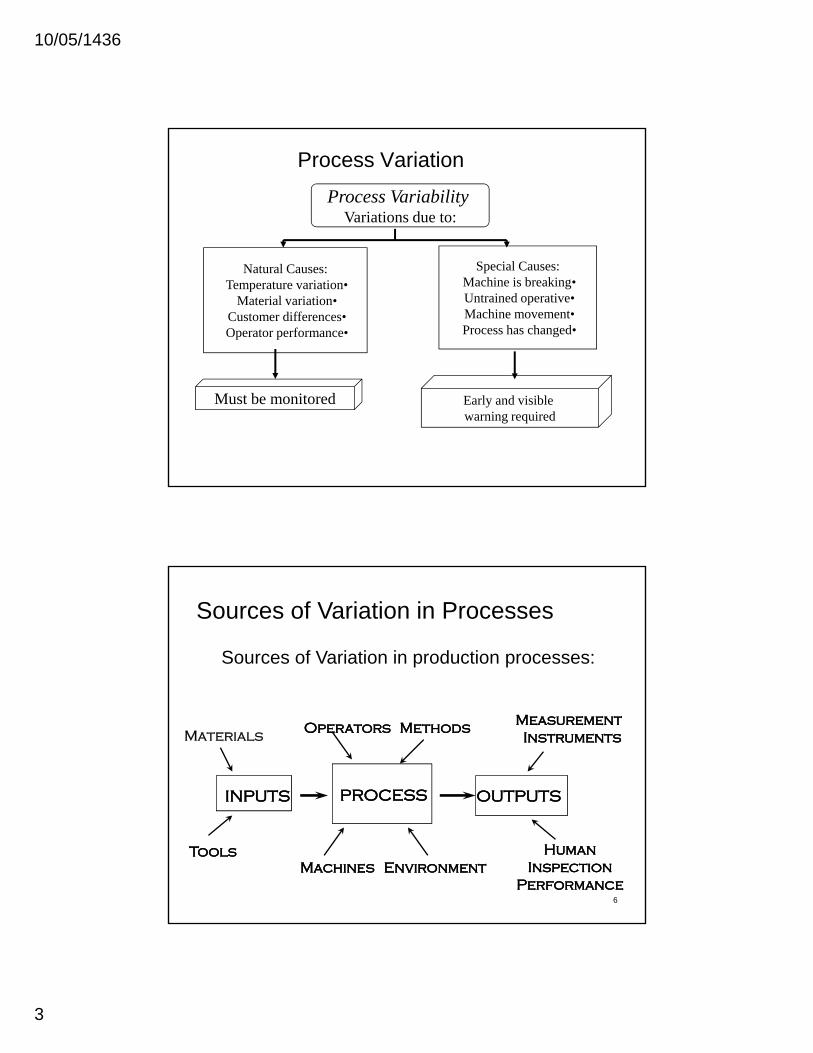
Process Variation
Process Variability Variations due to:
Natural Causes:•Temperature variation
•Material variation•Customer differences•Operator performance
Special Causes:•Machine is breaking•Untrained operative•Machine movement•Process has changed
Must be monitored Early and visible warning required
Sources of Variation in Processes
Sources of Variation in production processes:
Materials OperatorsOperators MethodsMethods MeasurementMeasurementInstrumentsInstruments
INPUTSINPUTS PROCESSPROCESS OUTPUTSOUTPUTS
6
ToolsTools HumanHumanInspectionInspection
PerformancePerformanceEnvironmentEnvironmentMachinesMachines
10/05/1436
4
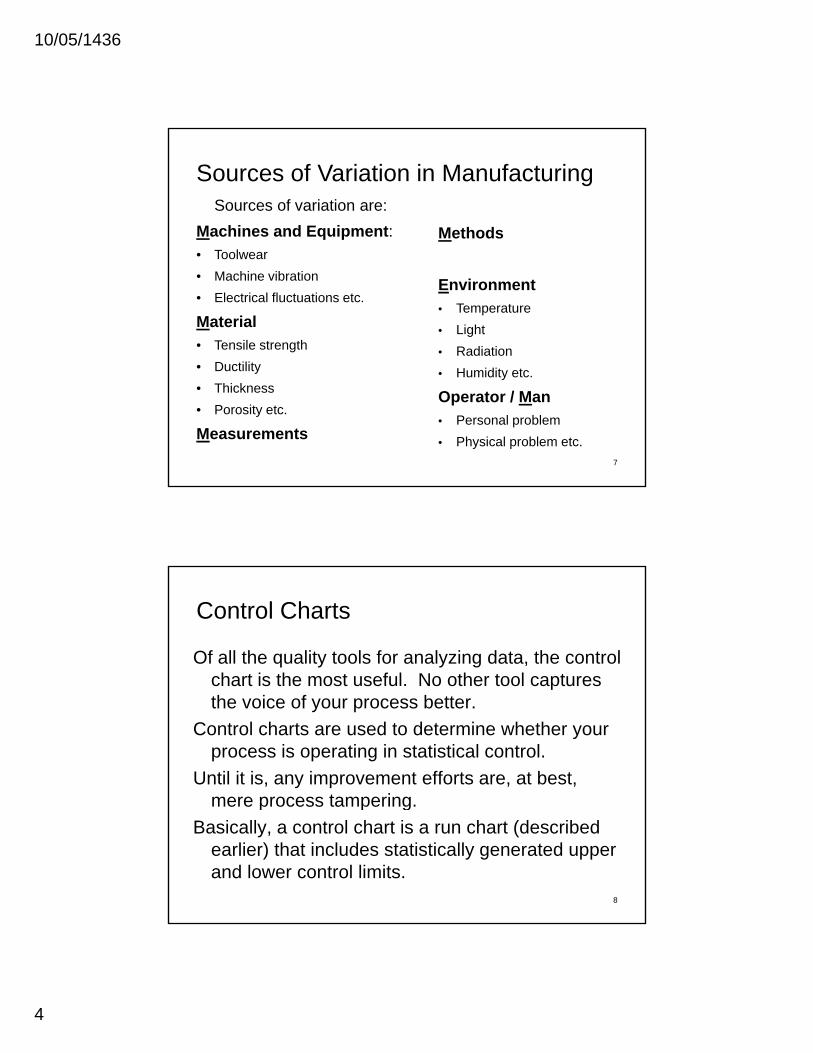
Sources of variation are:Machines and Equipment:
Sources of Variation in Manufacturing
Methods• Toolwear• Machine vibration• Electrical fluctuations etc.
Material• Tensile strength• Ductility
Environment• Temperature• Light• Radiation
7
• Ductility• Thickness• Porosity etc.
Measurements
• Humidity etc.
Operator / Man• Personal problem• Physical problem etc.
Of all the quality tools for analyzing data, the control chart is the most useful. No other tool captures
Control Charts
chart is the most useful. No other tool captures the voice of your process better.
Control charts are used to determine whether your process is operating in statistical control.
Until it is, any improvement efforts are, at best, mere process tampering.
8
mere process tampering. Basically, a control chart is a run chart (described
earlier) that includes statistically generated upper and lower control limits.
10/05/1436
5
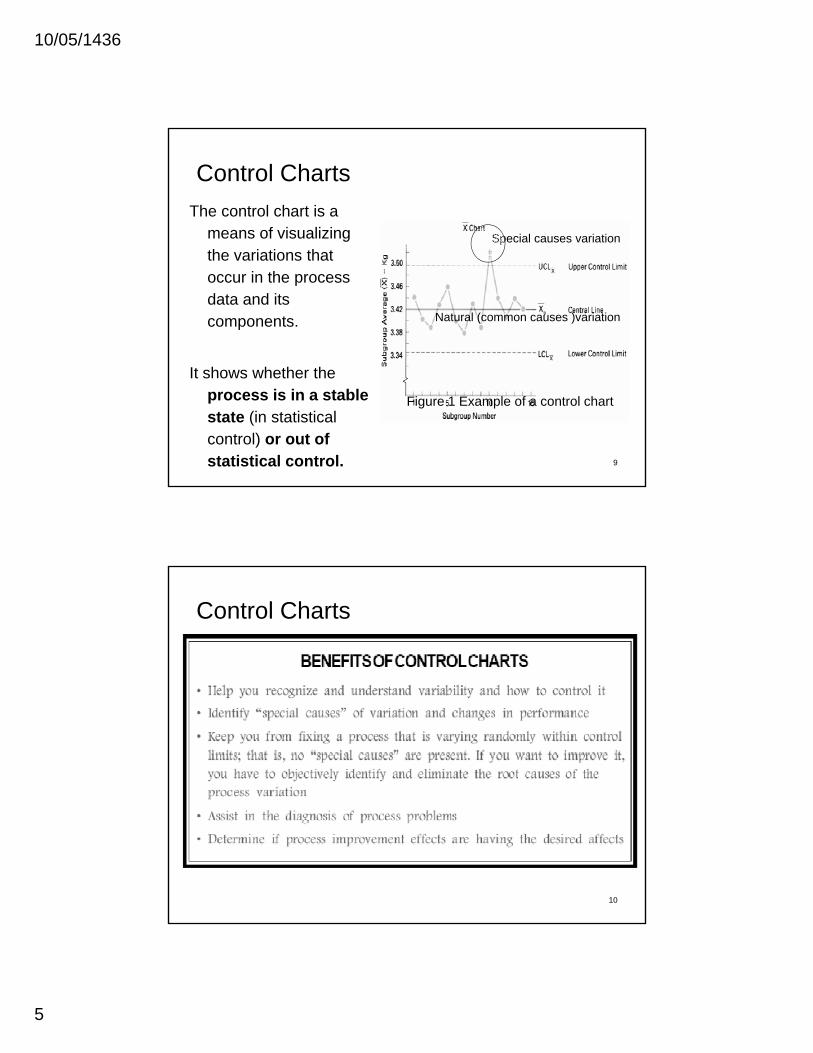
The control chart is a means of visualizing
Control Charts
Special causes variationthe variations that occur in the process data and its components.
It h h th th
Natural (common causes )variation
9
It shows whether the process is in a stable state (in statistical control) or out of statistical control.
Figure 1 Example of a control chart
Control Charts
10
10/05/1436
6
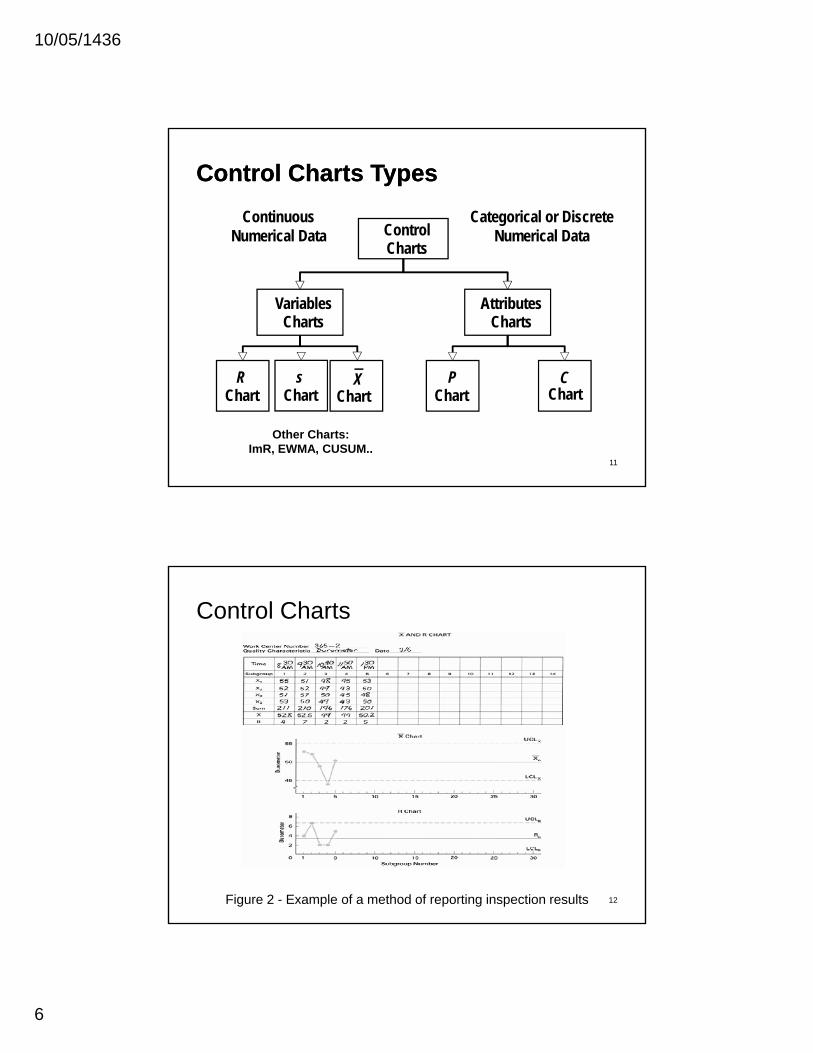
ControlCharts
Continuous Numerical Data
Categorical or Discrete Numerical Data
Control Charts TypesControl Charts Types
Charts
VariablesCharts
AttributesCharts
11
RChart
XChart
PChart
CChart
sChart
Other Charts: ImR, EWMA, CUSUM..
Control Charts
12Figure 2 - Example of a method of reporting inspection results
10/05/1436
7
The objectives of the variable control charts are:
Use of Variable Control Charts in Manufacturing
The objectives of the variable control charts are:For process improvementTo determine the process capability.For decisions regarding product specificationsFor current decisions on the production process
13
For current decisions on recently produced items
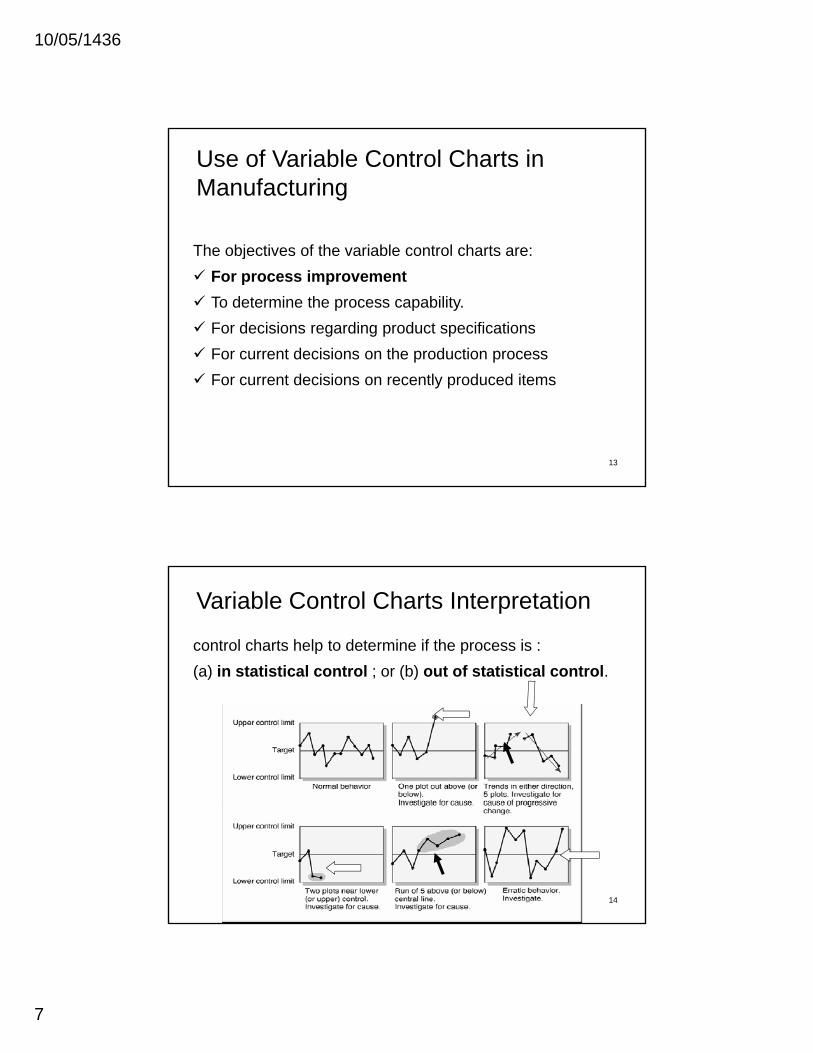
control charts help to determine if the process is : (a) in statistical control ; or (b) out of statistical control.
Variable Control Charts Interpretation
14
10/05/1436
8
Procedure for establishing a pair of control charts for the average Xbar and the range R:
Control Chart Techniques
1. Select the quality characteristic2. Choose the rational subgroup3. Collect the data4. Determine the trial center line and control limits
15
5. Establish the revised central line and control limits6. Achieve the objective
Quality Characteristic
• Variable - a single quality characteristic that can be measured on a numerical scale.
• When working with variables, we should monitor both the mean value ofshould monitor both the mean value of the characteristic and the variabilityassociated with the characteristic.
10/05/1436
9
The Quality characteristic must be measurable. It can expressed in terms of the seven basic units:
Quality Characteristic
1. Length2. Mass3. Time4. Electrical current5 Temperature
17
5. Temperature6. Substance7. Luminosity
Control Charts for and R
Notation for variables control charts• n size of the sample (sometimes called a
x
• n - size of the sample (sometimes called a subgroup) chosen at a point in time
• m - number of samples selected• = average of the observations in the ith
sample (where i = 1, 2, ..., m)• = grand average or “average of the
ix
x grand average or average of the averages (this value is used as the center line of the control chart)
x
10/05/1436
10
Control Charts for and R
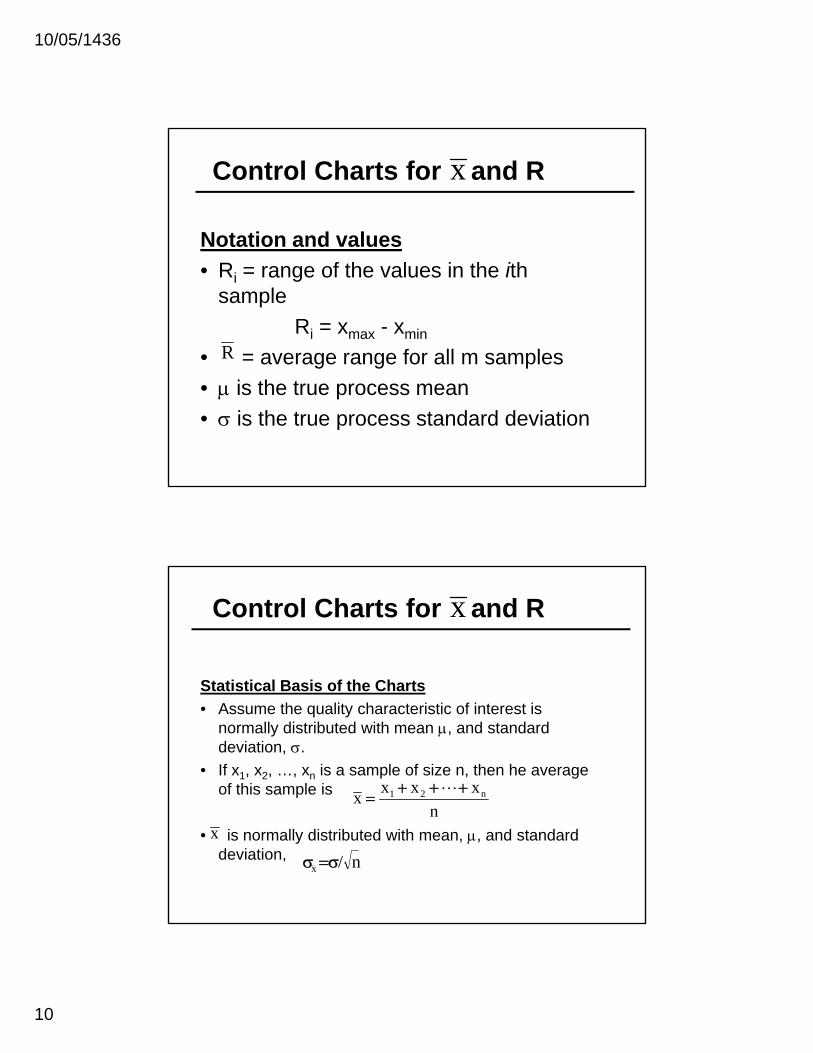
Notation and values
x
• Ri = range of the values in the ith sample
Ri = xmax - xmin
• = average range for all m samplesR g g p• μ is the true process mean• σ is the true process standard deviation
Control Charts for and R
Statistical Basis of the Charts
x
Statistical Basis of the Charts• Assume the quality characteristic of interest is
normally distributed with mean μ, and standard deviation, σ.
• If x1, x2, …, xn is a sample of size n, then he average of this sample is xxxx n21 +++
=L
• is normally distributed with mean, μ, and standard deviation,
nx
n/x σ=σ
10/05/1436
11
Control Charts for and R
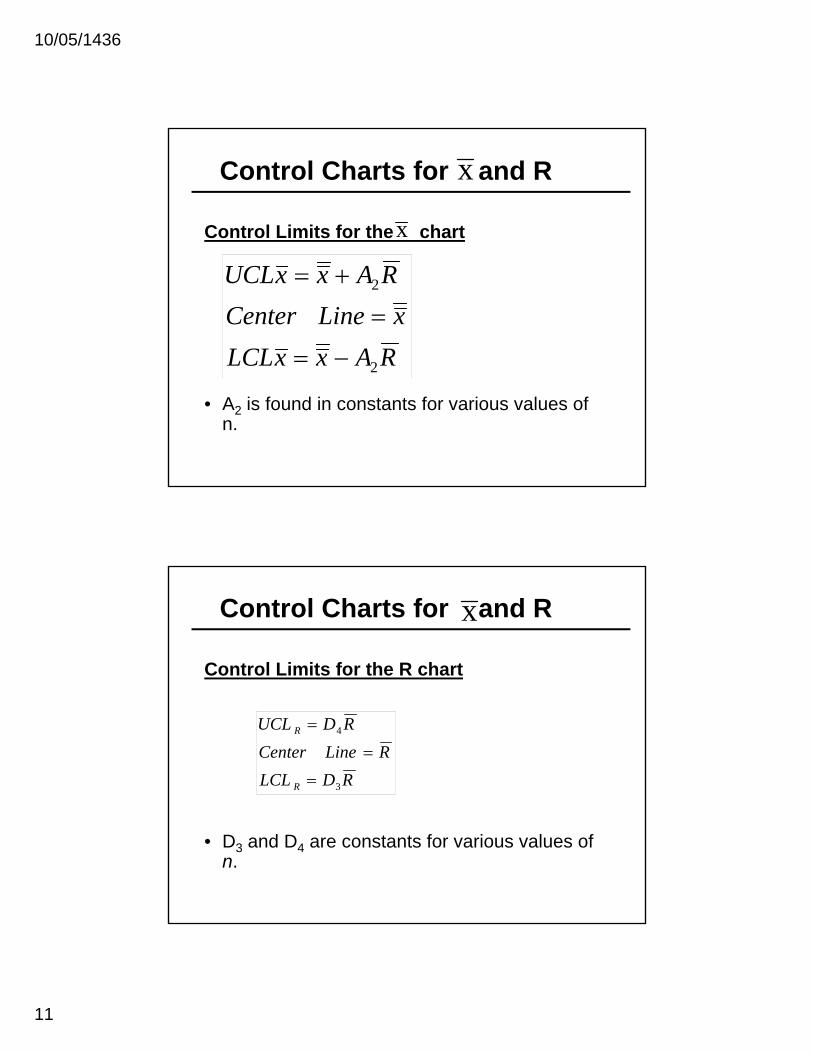
Control Limits for the chart
x
x
RAxxLCLxLineCenter
RAxxUCL
2
2
−=
=
+=
• A2 is found in constants for various values of n.
2
Control Charts for and R
Control Limits for the R chart
x
RDLCLRLineCenter
RDUCL
R
R
3
4
=
=
=
• D3 and D4 are constants for various values of n.
10/05/1436
12
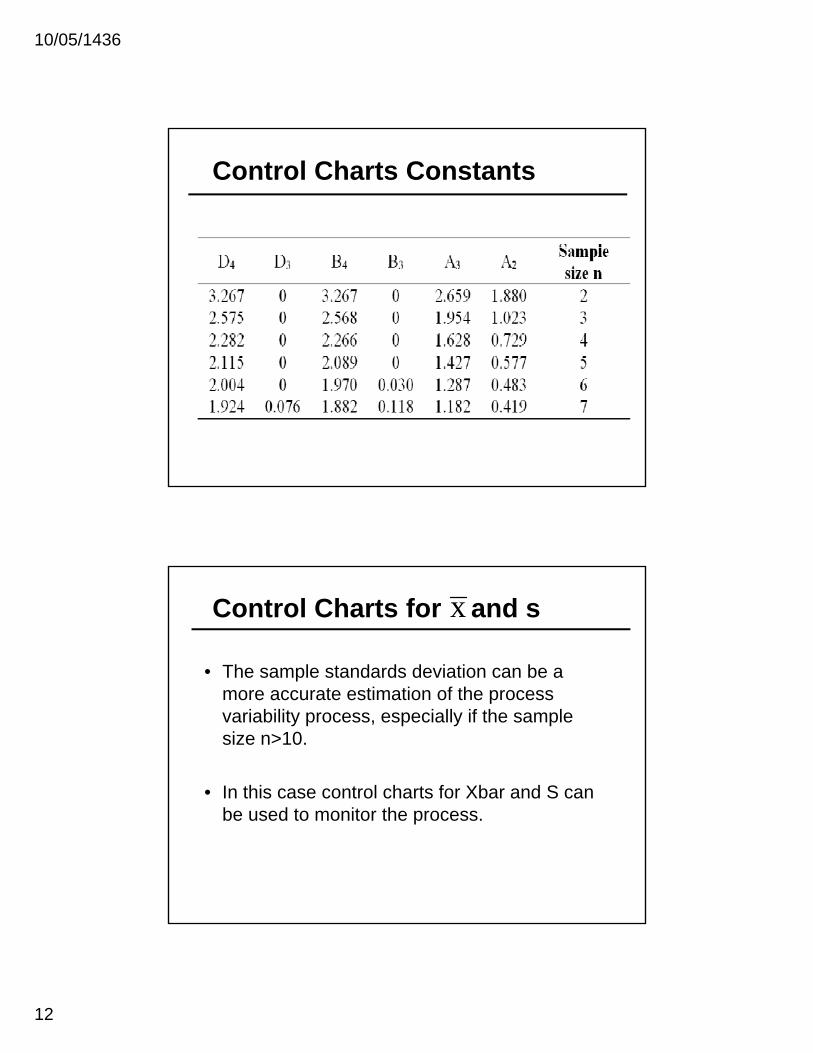
Control Charts Constants
Control Charts for and s
• The sample standards deviation can be a
x
more accurate estimation of the process variability process, especially if the sample size n>10.
• In this case control charts for Xbar and S can be used to monitor the process.
10/05/1436
13
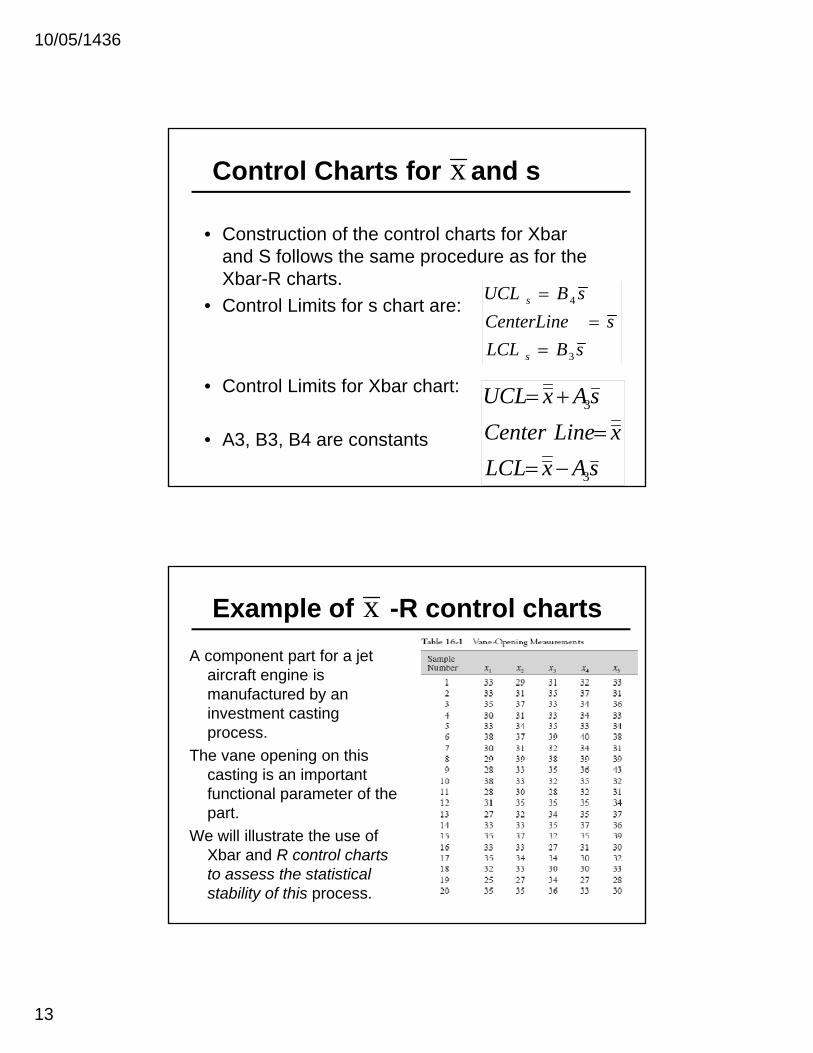
Control Charts for and s
• Construction of the control charts for Xbar
x
and S follows the same procedure as for the Xbar-R charts.
• Control Limits for s chart are:
sBLCLsCenterLine
sBUCL
s
s
3
4
==
=
• Control Limits for Xbar chart:
• A3, B3, B4 are constants sAxLCL
xLineCentersAxUCL
3
3
−=
=
+=
Example of -R control charts A component part for a jet
aircraft engine is
x
manufactured by an investment casting process.
The vane opening on this casting is an important functional parameter of the part.
We will illustrate the use of Xbar and R control charts to assess the statistical stability of this process.
10/05/1436
14
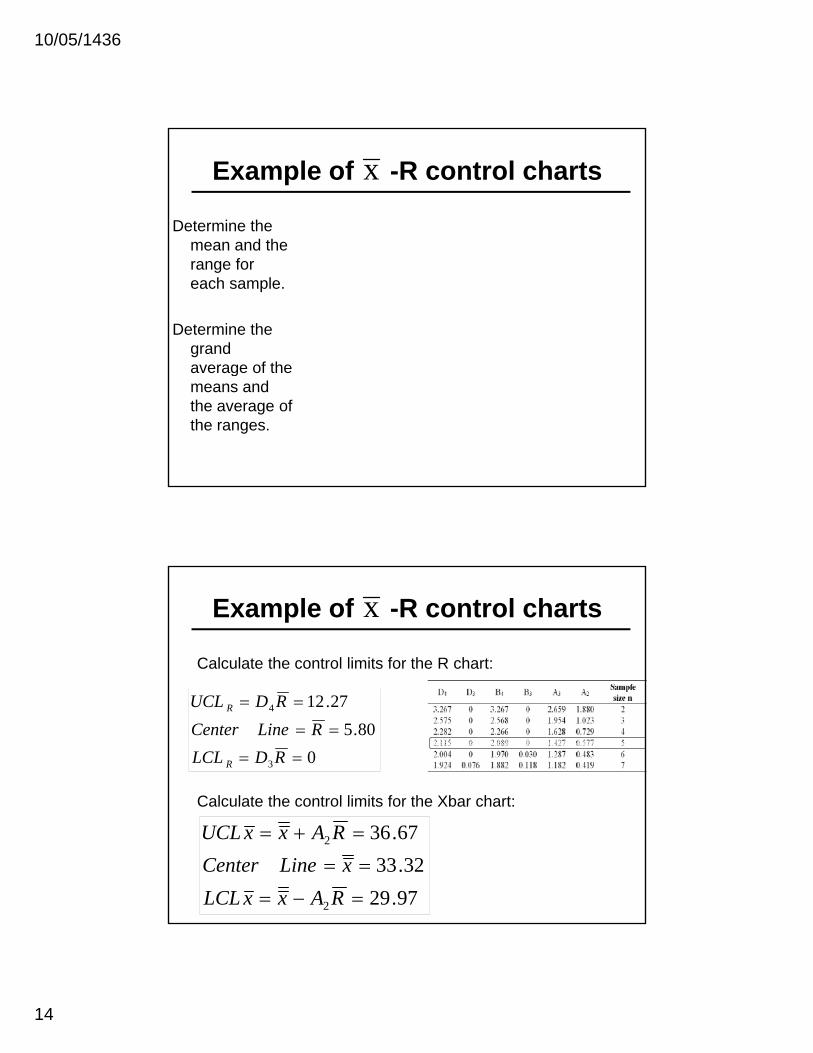
Example of -R control charts
Determine the mean and the
x
mean and the range for each sample.
Determine the grand average of theaverage of the means and the average of the ranges.
Example of -R control charts
Calculate the control limits for the R chart:
x
Calculate the control limits for the Xbar chart:
080.5
27.12
3
4
==
==
==
RDLCLRLineCenter
RDUCL
R
R
Calculate the control limits for the Xbar chart:
97.2932.33
67.36
2
2
=−=
==
=+=
RAxxLCLxLineCenter
RAxxUCL
10/05/1436
15
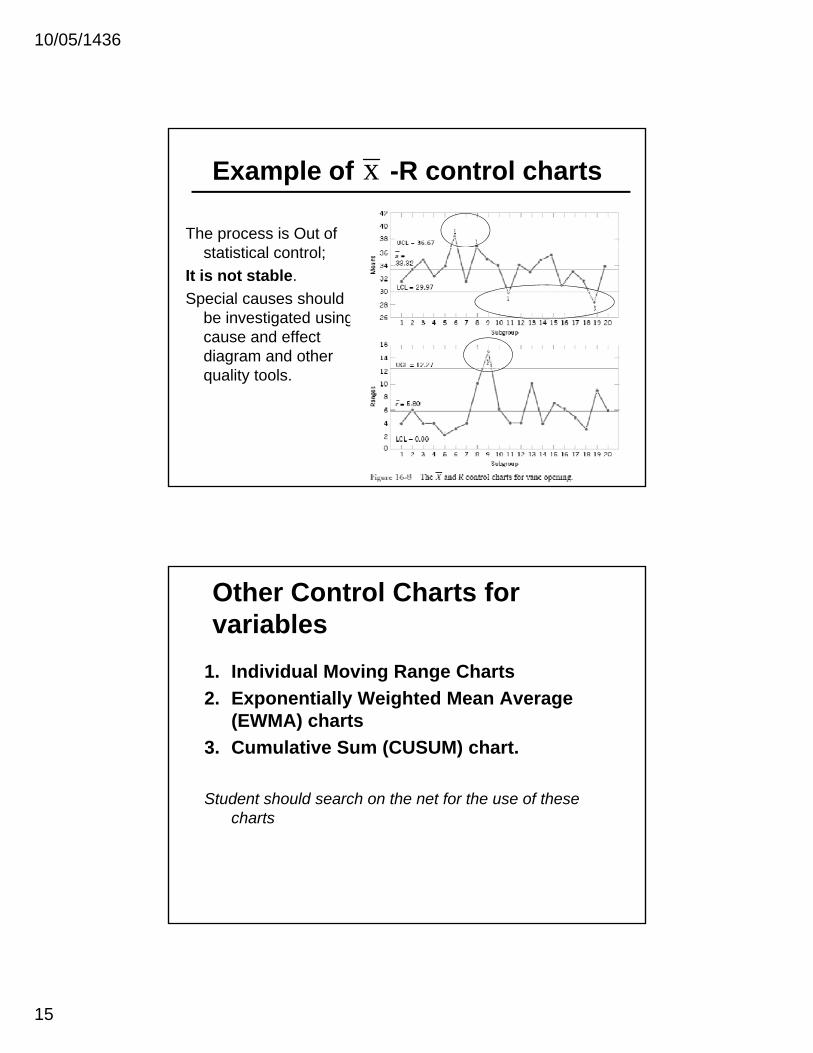
Example of -R control charts
The process is Out of t ti ti l t l
x
statistical control;It is not stable.Special causes should
be investigated using cause and effect diagram and other quality tools.
Other Control Charts for variables
1. Individual Moving Range Charts2. Exponentially Weighted Mean Average
(EWMA) charts3. Cumulative Sum (CUSUM) chart.
Student should search on the net for the use of these charts
10/05/1436
16
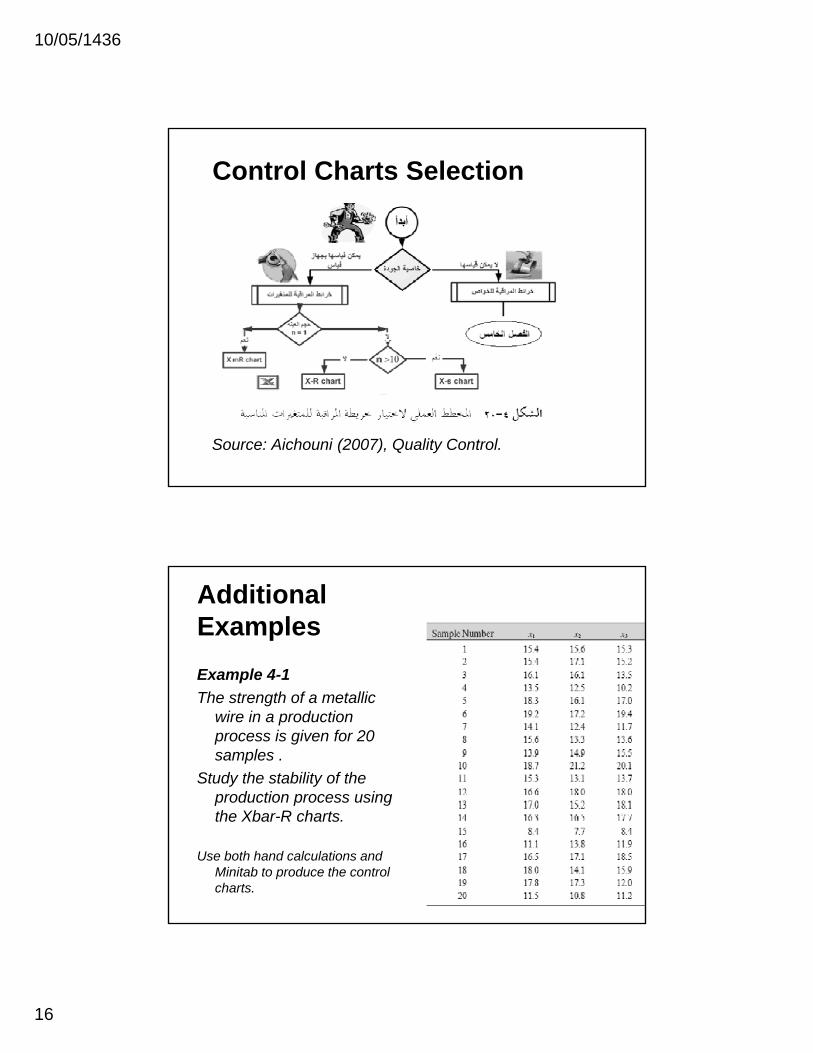
Control Charts Selection
Source: Aichouni (2007), Quality Control.
Additional ExamplesExample 4-1The strength of a metallic
wire in a production process is given for 20 samples .
Study the stability of the production process using p p gthe Xbar-R charts.
Use both hand calculations and Minitab to produce the control charts.
10/05/1436
17
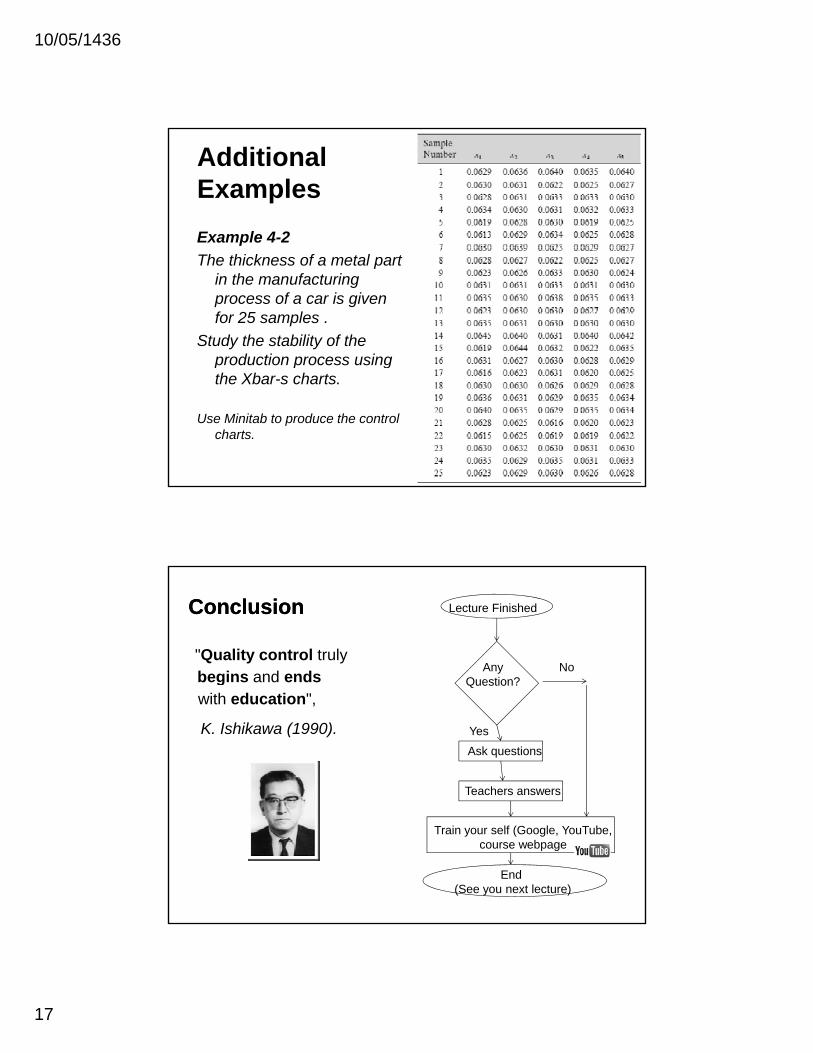
Additional ExamplesExample 4-2The thickness of a metal part
in the manufacturing process of a car is given for 25 samples .
Study the stability of the production process using p p gthe Xbar-s charts.
Use Minitab to produce the control charts.
Conclusion Conclusion
"Quality control truly begins and ends
Lecture Finished
Any Question?
Nogwith education",
K. Ishikawa (1990).
Question?
Ask questions
Teachers answers
Yes
Train your self (Google, YouTube, course webpage
End (See you next lecture)