chapter 3 data and methodology 3.1 statement of the...
TRANSCRIPT

51
Chapter 3
Data and Methodology
3.1 Statement of the Problem
The growth of higher education system in India has been muddled and
unplanned. The drive to make higher education socially inclusive has also led
to a swift and remarkable increase in the number of higher education
institutions without a fair increase in infrastructure and intellectual resources.
Consequently, academic standards have been put at risk (Béteille, André,
2005). Research in higher education institutions is at its lowest ebb. There is
an inadequate and diminishing financial support for higher education from the
government and from society.
According to a NASSCOM estimate, the supply of IT engineering
graduates in India was 95,000 in 2003-04, in 2004-05 it was 100,000, and in
2005-06 it was 111,000. Each year, India produces almost twice the number
of engineers produced by the US and a little less than twice of all that Europe
produces. A look into the impetus given to education in our country indicates
that the spending on education has grown five times in the last 50 years. The
challenge is not so much from other parts of the globe as it is from China.
China is today the largest producer of engineering graduates in the world.6
6 http:// www.mission10x.com

52
Now the number of institutes set up for various disciplines year on year
indicates an engineering education boom in India. Engineering colleges in the
country have been growing at 20 per cent a year. Further, the quality of
engineering education also needed a boost.
The paradox is that, despite the increase in the number of higher
education institutions, the competition for acquiring fresh talent every year is
so heated that it gives an impression that resources are really scarce. In
reality, there is a plethora of career options for graduates of current years.
The challenge is not the supply of talent but that of talent that meets the
needs of the corporate world. In other words, the challenge is that of
employability. Only 25 percent of technical graduates and 10-15 percent of
other graduates are considered employable by the growing IT and ITES
sectors. Even after employing these graduates, most companies have to
spend considerable amount of time and resources on their training so as to
develop the skills required by the industry. If the students augment their skills
in a few specific areas desired by the industry, employability in the country
can be significantly enhanced. While India currently boasts of one of the
world's largest qualified pools of scientific and engineering manpower, the
growing global demand for quality graduates is gradually widening demand-
supply gap.
Given these issues, the purpose of this investigation is to examine the
perceptions of quality criteria, which are identified by a broad range of
stakeholders in a national study of quality in higher education (Donald, J. G.,

53
& Denison, D. B. 1993, June).The stakeholders are leaders of university and
college boards, administrators, faculty, students, alumni and members of the
larger community. Quality of higher education cannot be achieved without
knowing the perceptions of stakeholders.
The following needs are addressed by this research.
3.2 Objectives Primary Objectives 1. Need for a unique quality measurement tool to measure the
perceptions of various stakeholders on the quality of students
and faculty of higher education in India.
2. Need to determine the Perception Gap between the various
stakeholders (faculty, students, alumni and industries) on the
quality of higher education in India.
3. Need to determine the effect of demographic variables on the
perceptions of faculty, students, alumni and industries
respectively.
Secondary Objectives
The perception gap between the various stakeholders (Primary
Objective No.2) is identified through the following secondary
objectives:

54
1. To determine the Perception Gap between the industries and
students on the quality of students and faculty.
2. To determine the Perception Gap between the industries and
faculty on the quality of students and faculty.
3. To determine the Perception Gap between the industries and
alumni on the quality of students and faculty.
4. To determine the Perception Gap between the faculty and students on
the quality of students and faculty.
5. To determine the Perception Gap between the faculty and alumni on
the quality of students and faculty.
6. To determine the Perception Gap between the alumni and students on
the quality of students and faculty.
3.3 Conceptual Framework
Based on the clearly defined problem, it is paramount to measure the
perceptions of various stakeholders such as faculty, students, alumni and
industries on the quality of students and faculty of higher education in India. It
is also very important to determine the Perception Gap between the
stakeholders on the quality of higher education in India. As the existing
literature supports the need to determine the perceptions of the stakeholders
of higher education, it is very significant to determine the Perception Gap
between the Stakeholders. The whole study is conceptually derived as
shown in Figure 3.1. The measurement of perceptions of the stakeholders on

55
quality of faculty and students is based on the instruments used by Janet G.
Donald and D. Brian Denison, 2001.
Perception Gap
Perception
Instrument
Figure 3.1 Conceptual Framework
3.4 Significance of the Study
This Study makes a vital contribution in the form of a research tool,
further additions to the existing literature and valuable suggestions to the
administrators of higher education in India.
• A standardised measurement tool: The contribution of this research will
be a unique questionnaire to measure the perceptions of various
stakeholders on the quality of students and faculty of higher education
in India. There is no published work citing the availability of such
contextual instrument. Such instrument will give a direction for other
Industries
Faculty
Students
Alumni
Survey
Industries vs Faculty
Industries vs Students
Industries vs Alumni
Faculty vs Students
Faculty vs Alumni
Students vs Alumni

56
contextual academic researchers (India based) to further work on the
instrument and make it valid by testing it in different parts of India.
• Addition to quality literature: This research attempts to study the
perceptions gap between various stakeholders of higher education on
the quality of students and faculty. Until now the literature addresses
the perceptions of academic leaders on quality of higher education.
This research will give further additions to the literature on the
perceptions of students, alumni, faculty and industries on quality.
• Benefits to college administrators: The management of higher
education institutions can think in a new perspective and can face the
challenge of deterioration of quality beyond the perceptions of
academic leaders. The management of higher education institutions
will be given with the choice of looking at the perceptions of teaching
faculty, students and alumni to understand the methods to enhance the
quality of higher education institutions
• Benefits for teaching faculty: The teaching faculty shall understand the
perception gap between them, the students, alumni and industries and
improve their competence in delivery and content.
• The Indian educational system: To further the cause of Indian higher
educational system this research will attempt to study the relationship

57
between the stakeholders namely faculty, students, alumni and
industries.
Given the Higher Education System undergoing a colossal change with
privatisation and globalisation of education, this study will aid the development
of the system by bringing in a socially relevant tool and suggestions which will
enhance the quality of higher education institutions.
This study is focussed on “Quality Assessment in Higher Education” to
determine the perceptions gap between the stakeholders of higher education,
namely students, faculty, alumni and industries.
3.5 Defining the Hypotheses
Formal Directional Hypothesis: As the major question of this
research is to identify the perception of the stakeholders on the quality of
higher education in India and to measure the perception gap between the
stakeholders, the major directional hypotheses of the research are as follows:

58
H1. There is a significant difference between the perceptions of industries
and faculty on the quality of higher education.
H2. There is a significant difference between the perceptions of industries
and students on the quality of higher education.
H3. There is a significant difference between the perceptions of industries
and alumni on the quality of faculty of higher education.
H4. There is a significant difference between the perceptions of faculty and
students on the quality of higher education.
H5. There is a significant difference between the perceptions of faculty and
alumni on the quality of higher education.
H6. There is a significant difference between the perceptions of students
and alumni on the quality of higher education.
3.5.1 Sub-Hypothesis The sub-hypothesis is made based on the main directional
hypothesis. Sub-hypothesis details the relationship between the variables
such as age, gender, educational qualifications, year of passing and industrial
experience and the perceptions of stakeholders on the quality of higher
education.

59
H7: There is a significant relationship between age, educational
qualification and industrial experience of the Industry personnel and
their perceptions on the quality (academic performance) of higher
education in India.
H8: There is a significant relationship between age, gender and industrial
experience of the Industry personnel and their perceptions on the
quality (academic performance) of higher education in India.
H9: There is a significant relationship between age, year of passing and
industrial experience of the industry personnel and their perceptions on
the quality (Intelligence) of higher education in India.
H10: There is a significant relationship between educational qualifications of
the Industry personnel and their perceptions on the quality
(Learning Skills) of higher education in India.
3.6 Research Design
The design of this study is explained with the detailed instrumentation
process where the operationalisation of variables is described. The various

60
validities required for research work and the reliability of the study are
explained. The validities include the external validity which stresses the
generalizability of samples, construct validity which validates the
measurement model that it measures what it intends to measure, face and
content validity to ensure that the instrument covers all the variables which
could exhaustively measure the intended concept.
Reliability of the study explains the dependability of the measuring
instrument. Beyond these, the design defines the nature of the research, the
sampling frame, the population base from which samples are derived, the
sampling procedure, method of selecting the samples, the data collection
protocol which mentions about the method of collecting the filled up
questionnaires and finally defines the independent, dependent and control
variables used in the study. This part of the research gets the crucial focus, as
it gives the skeletal structure to the whole research work.
3.6.1 Instrumentation -- (Validation of Quality Criteria) This part of the design gives the whole explanation about the
development of the research instrument. The perception of stakeholders on
the quality criteria will be measured using the questionnaire as developed by
Donald, J. G., & Denison, D. B. 2001. This questionnaire is an ideal
instrument to measure the perceptions of stakeholders on the quality of higher
education because these criteria had been identified by a broad range of

61
stakeholders in a national study of criteria and indicators of quality in higher
education (Donald & Denison, 1993; Nadeau et al., 1992).
The stakeholders were governors of university and college boards,
administrators, faculty, students, and members of the larger community. They
independently identified criteria of quality in universities and colleges that they
considered to be important, and then verified the criteria over three rounds of
a Delphi procedure (Linstone & Turoff, 1975). Moreover, as the Indian context
differs from the western context, it needs a customised instrument taking into
count the local value systems. So, it demands a separate validation process
to develop a unique instrument to cater to the Indian higher educational
institutions’ requirement and to measure their quality. The 33 criteria for the
quality of students and the 20 criteria for the quality of faculty that emerged
from this study reflected the perspective of the broad higher education
community pertaining to Indian higher education, but not specifically students'
own views.
3.6.2 Operationalisation of the Quality Variables Operationalisation means successfully translating the concepts that
we have in mind into simple measurable terms. It is defined as a method of
portraying a concept in terms of the procedure used to measure it. It is also
referred to as the process in which the variables are identified as specific data
and facts, suitable for recordable/repeatable acts (operations & combinations)
to be performed on them (e.g. Defining, locating, measuring etc.).

62
Le Compete & Schensul (1999) define the operationalisation as
defining a concept concretely in such a way that it can be understood,
observed or categorized accurately by any researcher reviewing the same
data or observing the same event. So, the instrumentation process requires a
thorough operationalisation of the variables and the subjects of the study. The
operationalisation process starts with the translation validity and ends with
construct validity of the variables.
3.6.3 Method of Measurement
The identified variables have to be measured using an appropriate
method. Sackmann (1991) argues that there are different methods to
measure the quality in an organisation. The methods can be arranged in a
continuum. One end of the continuum comprises inductive modes of enquiry
like ethnographic studies through participant observation, in-depth interviews
and so on, the other end of the continuum consists of structured methods like
Questionnaires, Structured Interviews, Check list and so on (Sackmann,
1991). The ethnographic perspective often cited as the insider’s perspective is
considered to give complete face validity, richness of data, contextualization
of data and thorough insight through empathic listening. But, it faces
difficulties in terms of cost, researcher imposing his/her own views, analysis of
data, impossibility in meeting every stakeholder and difficulties in comparison
between organisations (Sackmann, 1991).

63
The questionnaire and other methods often cited as outsider’s/external
perspective allows for statistical treatment of data, complete enumeration from
all employees in an organisation cheap and faster and gives scope for
comparison between one organisation to another organisation. But, it also
carries disadvantages in the form of lack of contextuality, impersonal
approach, and therefore, fewer chances for sensitive questions being
answered (Sackmann, 1991).
As the existing design is meant for eliciting the perception of
stakeholders on the quality of higher education and to find the perception gap
between the stakeholders, a questionnaire method of measurement is
sufficient. Further, in many of the studies, quantitative questionnaires alone
are used (Hofstede, Neuijen, Ohayav & Sanders, 1990; House et al., 1999;
Smith, Misumi, Tayeb, Peterson & Bond, 1989; Smith, Dungan &
Trompenaars, 1996).
The measurement scale for the questionnaire is on a normative scale
basis as the ipsative formats (Paired Comparison & Q-Sort techniques) are
found problematic (Cable & Judge, 1997; Tepeci, 2001). A simple Likert type
scaling is found to be less time-consuming and easily interpretable (Tepeci,
2001). So, all the 33 items for Students and 20 items for Faculty are
developed into value statements to reduce socially desirable responses. Such
questions are randomized and simplified for clarity and simplicity of the
questionnaire. Each question is measured using a Likert scale that consists of
five points. Nunnally (1967) maintains that the reliability of a tool increases

64
with the number of scale points.Further, Nunnally (1967) opines that a graphic
scale with numbers will be preferable. The questionnaire is designed in two
parts, the first part measuring the perceptions of stakeholders on the criteria
for the quality of students and the second measuring the criteria for the quality
of faculty. The first part has 33 items and the second part has 20 items to
verify the correlation between the items. The scale measure for the first part is
a 5-point Likert Scale which measures each item from Not at all Important (NI)
to Extremely Important (EI). Similarly, the second part also measures
perceptions on the criteria for the quality of faculty in a 5-point scale ranging
from Not at all Important (NI) to Extremely Important (EI).
Not at all (NI) Somewhat (SI) (I) Quite (QI) Extremely (EI) Important Important Important Important Important
Figure 3.2 Measurement Scale
3.6.4 Pilot Study
After validating the questionnaire items for face and content
adequacies, it necessitates to check the criterion related validity of the
variables concerned, in the research design process. This part carries
importance as the construct validity and predictive validity of the model
involved in the study are verified.
1 2 3 4 5

65
The pilot study is conducted to finalise the list of relevant items which
can be further factor analysed. This will identify the hidden factor structure
involved with the items. Also, the reliability of the scale and relevant subscales
can be verified. The independent variable -- the demographic data of various
stakeholders (Independent) and its predictive power on any of the criteria for
the quality of Higher Education (dependent variables) -- can be identified. This
will prove the predictive validity of the construct involved.
3.6.4 a Construct Validity
Construct validity refers to the degree to which the inferences can be
legitimately made from the operationalisation in the study to the theoretical
constructs on which the operationalisation is based. In a simple sense, it will
check whether the operationalisation measures what it intends to measure
(Trochim, 2000). It will assess how well the ideas of the researcher are
translated into actual programmes or measure. It comprises two parts, namely
convergent validity and discriminant validity.
Convergent validity is the degree to which the operationalisation is
similar to (converges on) the other operationalisation that it theoretically
should be similar to. The contrary is true for proving discriminant validity
where the operationalisation is dissimilar from other operationalisation that it
theoretically should not be similar to (Trochim, 2000). Guion (1965) defines
construct validity as the degree to which the variance in a given set of
measures is due to the variance in the underlying construct. The factors

66
derived from factor analysis are constructs and the operational definition of
construct validity is the factor loading. This permits a specific numerical
statement of construct validity that is important for both criterion and predictor
measurement.
So, by means of factor analysis it is possible to construct a test giving a
relatively pure measurement of specific theoretical construct. This is achieved
by a factor analysis of the items in the test that individually are considered as
variables. Smit (1991) specifies that the analysis of internal factor structure of
the variables culminates in a factor loading, leading to a measure of a specific
construct.
3.6.4 b Predictive Validity
It is the process of assessing the operationalisation ability to predict
something it theoretically is able to predict (Trochim, 2000). Here, the
construct’s predictive ability in determining the effect size of the dependent
variable is counted as the predictive power/validity. Existence of predictive
ability will show that the measure can correctly predict something, which when
theoretically assumed, should be able to predict.
The pilot study is made with the following objectives:
• To identify the relevant quality variables which are highly correlated to
each other and to remove the distant items which are not closely
correlated to other items

67
• To figure out the initial factor structure of the variables so that the
identified factors will show Convergent and Discriminant validity
through their factor loadings showing construct validity
• Identifying the subscale reliability, mean and variance of the
construct .Measuring the predictive power of the construct by studying
the relationship between the quality criteria and perceptions of various
stakeholders
• To arrive at a preliminary questionnaire to measure the perceptions of
stakeholders on the quality of higher education in India.
With the above objectives, the pilot study is carried out to measure the
the perceptions of various stakeholders on the criteria for quality of higher
education.
3.6.4 c Methodology of Pilot Study
The questionnaire deployed for the pilot study is divided into two parts.
The first part measures the perception of stakeholders on the quality of
students with the face validated 33 items and the second part measures the
perceptions on the quality of faculty with 20 items. The Coronach Alpha
measure for the instrument are α =0.837 for Students and 0.8 for faculty
respectively which are high in reliability (Tepeci, 2001).
For the pilot study three, Engineering colleges offering engineering and
management courses affiliated to Anna University, Chennai Zone X have
68
been selected in random. By covering the colleges offering professional
courses of both engineering and management in the preliminary study, the
representativeness of the instrument is assured across a broad set of
samples. Hundred students and twenty five faculties are taken for the study to
ensure sampling adequacy which will enable further statistical enquiry.
3.6.4 d Outcomes of Pilot Study
For the preliminary analysis, the factor structure for the perceptions of
stakeholders on quality items alone have been found out, as the objective of
the study primarily is to filter the more relevant items for further studies.
Deletion of irrelevant items based on KMO Statistic
Using SPSS 13.0 software, the values of all the 33 items of the first
part of the instrument and 20 items of the second part of the instrument are
tested for Keyser-Meyer-Olkin (KMO) statistic and the Anti Image Correlation
(AIC) Matrix respectively. In the AIC matrix, the individual MSA (Measures of
Sample Adequacy) items whose values lie above 0.6 are filtered out. The
Initial KMO Measure is 0.642 for all 33 items of first Part and 0.715 for all 20
items of the second part. As a result of MSA value filter, 23 items of Part I and
18 items of Part II emerged with high KMO measure which are used in
subsequent analyses for factor structure. The 23 items of PartI and 18 items
of Part II give the overall KMO measure of 0.842 and 0.852 respectively.

69
Table 3.1
Data Reduction for Questionnaire Construction
Instrument α KMO No. of Variables
Before Filtering the Data Students 0.837 0.642 33
Faculty 0.8 0.715 20
After Filtering the Data Students 0.832 0.842 23
Faculty 0.831 0.858 18
3.7 Population, Sample and Data Collection
The higher education in India is undergoing a massive change with the
mushrooming of private colleges. Rapid industrialisation and globalisation
have resulted in a sudden rise in the demand for high quality higher education
in India. It is one of the major priorities in the field of education now
(Bhattacharya, 2004).
2.5 million Graduates and 3, 50,000 Engineers are spewing out every
year in India from 300 Universities and 15,600 colleges. Of the 1,300
engineering colleges in India, Tamilnadu itself boasts of more than 300
colleges. There are 20 Engineering Colleges in the Zone X of Anna
University, Tamilnadu. Around 10,000 students and 1,000 faculties belong to

70
the University and Industries of Chennai and Bangalore and alumni of those
colleges form the population of the study.
Initially, the sample size required for the study is measured. Sample
size of a study is a function of proposed analyses, namely factor and
regression analysis Tepeci (2001). Hair, Anderson, Tatham, and Black (1998)
argue that factor analysis requires 5 to 10 subjects per questionnaire item.
Guadagnoli, Edward and Wayne F. Velicer (1988) recommend a minimum
sample size of 100-200 for conducting factor analysis based on the results of
numerous simulation studies.
x = Z2 ( c/100) x r(100-r)
n = Nx / ( N-1) E2 + x)
E = [(N-n) x / n (N- 1)] 1/2
n = Sample Size E= Margin of Error N= Population Size
r = Fraction of responses the researcher is interested in
Z2 ( c/100) = Critical value for a confidence interval ‘c’
Figure 3.3
Sample Size Estimator Formula (Based on Normal Distribution)
As per Comrey (1988), a sample size of 200 is adequate for factor
analysis involving not more than 40 items. Moreover, to get a sample size

71
which is good enough to represent a normal distribution, Raosoft calculator7 is
used. It is based on the measurement model which uses normal distribution
as shown in Figure 3.3.
The margin of error is assumed as 5 %. It represents the amount of
tolerable error. The confidence level is fixed at 95 % which indicates the
amount of tolerable uncertainty. As per this method, the minimum sample size
recommended by the calculator for the study is 377 for students and 278 for
faculties. This also more than satisfies the requirements for factor analysis
and further regression analysis, as the items of the questionnaire are 23 and
18 only.
The sampling procedure is made on a multi-stage random method
where samples are drawn in two stages. Initially, from the 20
engineering colleges affiliated to Anna University, Chennai Zone X, six
colleges are selected on a random basis. Such selected colleges are
approached for permission from the Principal/Head of the Institution and
based on that status these colleges are included in the sampling basket. In
the whole process, all colleges gave permission for data collection. In the
second stage, the selected colleges’ faculty and students are selected in a
random way without any priory control. At least, 25 % of each college
population is covered to ensure aggregate level/cross level analysis, as a
reasonable number of respondents are required per college to get the
aggregate score for each college. The number of respondents per college
7 http://www.raosoft.com/samplesize.html

72
varied as the number of faculty and students also vary for each college. The
sampling procedure is followed and total sample size for faculty and students
reaches 201 (Response rate is 60%) and 487 (Response rate is 80%)
respectively.
The data collection protocols are through direct approach and
enumerator methods. In the direct approach method, the researcher
personally went to the selected colleges and distributed the questionnaires.
Although personal contact method is followed in certain cases, predominantly
data collection is through enumerators who are the college faculty members
(known to the researcher), working in the engineering colleges coming under
the sample basket. They helped in collecting data from their respective
colleges. Here, the questionnaires were mailed to the enumerators and they,
in turn, distributed the questionnaires in random, based on the college pay roll
name list.
The instructions given to the enumerators are that they have to cover
at least 25 % of the faculty in their institution, excluding them. Once they
collected the sample responses, they mailed it back to the researcher. The
enumerators carried out the task, out of the courtesy they showed to the
researcher as a friend. The resultant sample responses collected from the
faculty and students of institutions thus arrived at 201 and 487 respectively
and each college’s sample coverage percentage varied from 25 to 30.
Questionnaires were also mailed to alumni of randomly selected colleges and

73
Industry personnel in Chennai and Bangalore through email and responses
were received from 160 alumni and 100 Industry personnel.
In one section of the questionnaire, faculty, students, alumni and
industries were presented with the set of 23 criteria for quality of students and
in another section with the set of 18 criteria for the quality of faculty. faculty,
students, alumni and Industries were asked to use a 5-point response scale
(1 = not at all important, 2 = somewhat important, 3 = important, 4 = quite
important, 5 = extremely important) to indicate how important they felt each
criterion was for evaluating the quality of a student and faculty. Factor
analysis and the reliability test were conducted on the collected data and the
tables were formulated (Table 3.2 – 3.9).
Table 3.2 depicts the data collected on the perceptions of faculty on the
criteria for the quality of students. Principal components analysis of the
composite ratings on data collected was done utilizing a varimax rotation
extracted seven factors. The first factor encompassed 4 of the 23 criteria.
Loading most strongly on this factor, branded Academic Performance, were
the following criteria: (a) Personal Student Development, (b) Completion of
Program requirements, and (c) Expertise at the end of the program. The
second factor, labelled Social Responsibility, included (a) Commitment to Life
Long Learning (b) Commitment to Physical Fitness, (c) Leadership Skills and
(d) Commitment to Social Concerns.

74
Table 3.2
Criteria for Quality of Students according to Faculty Perception Reliability Test: Alpha = 0.873 KMO = 0.848
Factor Analysis
S.No Questionnaire Factor Loading Alpha Mean Variance ACADEMIC PERFORMANCE
5 Commitment to Learning I 0.500 R
0.744 3.766 0.964
11 Personal Student Development
I 0.666 R
12 Completion of Program requirements
I 0.763 R
13 Expertise at the end of the program
I 0.673 R
SOCIAL RESPONSIBILITY 16 Commitment to Life Long
Learning II 0.654 R
0.622
3.641
1.115
17 Commitment to Physical Fitness
II 0.581 R
18 Leadership Skills II 0.508 R 23 Commitment to Social
Concerns II 0.657 R
COMMUNICATION SKILLS 20 Written communication skills III 0.799 R
0.704 4.0
0.890 21 Presentation skills III 0.653 R
22 Oral Communication skills III 0.752 R LEARNING SKILLS
4 Intelligence IV 0.394 R 0.7
3.69
0.986
7 Openness and Flexibility IV 0.561 R 8 Ability to interact with others IV 0.740 R 9 Effective study skills & habits IV 0.560 R 10 Moral & Ethical Reasoning IV 0.529 R
ACADEMIC PREPAREDNESS 2 Preparedness for a specific
Program V 0.717 R
0.577
3.862
0.832
6 Sense of Responsibility V 0.718 R 19 Ability to apply knowledge V 0.504 R
EMPLOYMENT COMPETENCE 14 Ability to get a job VI 0.761 R
0.590 4.152 0.995 15 Performance on the job VI 0.632 R
GENERIC SKILLS 1 Secondary School
Preparation VII 0.757 R
0.475 3.652
1.152
3 Basic Mathematical Competency
VII 0.689 R

75
A third factor expressed as Communication Skills consisted of
(a) Written communication skills, (b) Presentation skills, and (c) Oral
Communication skills. Openness and Flexibility, Ability to interact with others,
Effective study skills and habits and Moral and Ethical Reasoning were loaded
together to form a fourth factor, Learning skills. The fifth factor, academic
preparedness, consisted of (a) secondary school preparation, (b) general
academic preparedness, and (c) preparedness for a specific program. The
sixth factor named Employment Competence included (a) Ability to get a job
and (b) Performance on the job. Secondary School Preparation and Basic
Mathematical Competency form the seventh factor named Generic Skills.
Academic Competence, Team bonding skills, Interpersonal Skills and
Presentation Skills were found as the factors for the criteria for the quality of
faculty according to the perceptions of faculty as shown in Table 3.3. The first
factor consisted of seven of eighteen criteria. Ability to Explain Clearly, Depth
of Knowledge, Commitment to knowledge updation and Commitment to
research are the strongly loaded criteria on the factor. The second factor
named Team Bonding Skills consisted of five criteria, namely (a) Ability to
work as a Team Member (b) Problem Solving Skills (c) Leadership Skills (d)
Commitment to Ethical Values and (e) Commitment to Social Concerns.
Ability to encourage the students, Approachability by Students and
Enthusiasm were loaded together to form the third factor labelled as
Interpersonal Skills. The fourth factor branded as Presentation Skills include
(a) friendly with students, (b) temperament and (c) sense of humour.

76
Table 3.3
Criteria for Quality of Faculty according to Faculty Perception
Reliability Test: Alpha = 0.882 KMO = 0.866
Factor Analysis
S.No Questionnaire Factor Loading Alpha Mean Variance ACADEMIC COMPETENCE
1 Ability to Explain Clearly I 0.717 R 0.796
4.151
0.830
3 Depth of Knowledge I 0.662 R 4 Presentation Skills I 0.698 R 6 Ability to use Computer &
Technology I 0.512 R
10 Commitment to Knowledge updation
I 0.574 R
14 Confidence I 0.548 R 18 Commitment to research I 0.575 R
TEAM BONDING SKILLS 7 Ability to work as a Team
Member II 0.614 R
0.795
3.79
1.015
8 Problem Solving Skills II 0.541 R 9 Leadership Skills
II 0.415 R
11 Commitment to Ethical Values
II 0.672 R
12 Commitment to Social Concerns
II 0.769 R
INTERPERSONAL SKILLS 2 Ability to Encourage the
students III 0.521 R
0.678
3.9
0.8 5 Approachable by
Students III 0.775 R
13 Enthusiasm III 0.620 R PRESENTATION SKILLS
15 Friendliness with Students
IV 0.759 R
0.649 3.244 1.174 16 Temperament IV 0.609 R 17 Sense of Humour IV 0.739 R

77
Table 3.4 illustrates the data collected on the perceptions of students
on the criteria for the quality of students. Principal components analysis of the
composite ratings on the data were collected utilizing a varimax rotation
extracted seven factors. The first factor covered 5 of the 23 criteria. Loading
most strongly on this factor, branded communication skills were (a) written
communication skills (b) presentation skills, and (c) oral communication skills.
The second factor, labelled Learning Skills, included four criteria among them
(a) Commitment to Life Long Learning and (b) Commitment to Physical
Fitness were strongly loaded.
A third factor expressed as Generic Skills consisted of (a) Sense of
responsibility (b) Openness and Flexibility, and (c) Ability to interact with
others. Ability to get a job and performance on the job were loaded together to
form a fourth factor, Employment competence. The fifth factor, academic
Performance, consisted of (a) Moral and ethical reasoning, (b) Personal
Student Development ,(c) Completion of program requirements and (d)
Expertise at the end of the program. The sixth factor named academic
preparedness consisted of three criteria and among them (a) Secondary
school preparation and (b) Preparedness for a specific program were strongly
loaded. The seventh factor named Intelligence included (a) Intelligence and
(b) Effective study skills and competence.

78
Table 3.4
Criteria for Quality of Students according to Students’ Perception
Reliability Test: Alpha = 0.832 KMO = 0.842
Factor Analysis
S.No Questionnaire Factor Loading Alpha Mean Variance COMMUNICATION SKILLS
18 Leadership Skills I 0.513 R
0.686 3.933 1.006 19 Ability to apply knowledge I 0.561 R 20 Written communication skills I 0.624 R 21 Presentation skills I 0.785 R 22 Oral Communication skills I 0.611 R
LEARNING SKILLS 5 Commitment to Learning II 0.488 R
0.554
3.51
1.321
16 Commitment to Life Long Learning
II 0.703 R
17 Commitment to Physical Fitness
II 0.620 R
23 Commitment to Social Concerns
II 0.422 R
GENERIC SKILLS 6 Sense of Responsibility III 0.581 R
0.613 3.91
1.027 7 Openness and Flexibility III 0.724 R
8 Ability to interact with others III 0.738 R EMPLOYMENT COMPETENCE
14 Ability to get a job IV 0.765 R 0.618 4.256 0.888
15 Performance on the job IV 0.672 R ACADEMIC PERFORMANCE
10 Moral & Ethical Reasoning V 0.577 R 0.575
3.556
1.152
11 Personal Student Development
V 0.672 R
12 Completion of Program requirements
V 0.621 R
13 Expertise at the end of the program
V 0.397 R
ACADEMIC PREPAREDNESS
1 Secondary School Preparation VI 0.763 R
0.454 3.7 1.046 2 Preparedness for a specific program
VI 0.587 R
3 Basic Mathematical Competency
VI 0.487 R
INTELLIGENCE 4 Intelligence VII 0.584 R
0.381 3.807 0.964 9 Effective study skills & habits VII 0.626 R

79
The results of factor analysis carried out on the perceptions of students
on criteria for the quality of faculty are shown in Table 3.5. Social
Responsibility, Interpersonal Skills, Presentation Skills, Academic
Competence, and Research Skills were found as the five factors.
The first factor consisted of four of eighteen criteria. Commitment to
social concerns and Commitment to ethical values were the strongly loaded
criteria on the factor. The second factor branded as Interpersonal Skills
consisted of seven criteria and (a) Friendliness with the students (b)
Enthusiasm and (c) Sense of humour were the robustly loaded on the factor.
Ability to use computer and technology and ability to work as a team member
loaded strongly on the factor labelled as Presentation Skills. The fourth factor
branded as Academic Competence includes (a) ability to explain clearly and
(b) depth of knowledge. Commitment to research is the only criteria loaded
adequately for the factor named research skills.
Table 3.6 demonstrates the data collected on the perceptions of alumni
on the criteria for the quality of students. Principal components analysis of the
composite ratings on data collected utilizing a varimax rotation extracted eight
factors. The first factor covered 6 of the 23 criteria and is called academic
performance. Completion of program requirements and Expertise at the end
of the program were loaded significantly on the factor. The second factor
named as Communication skills includes the criteria (a) written
communication skills (b) presentation skills, and (c) oral communication skills

80
with strong loading. The third factor, labelled Intelligence consisted of three
criteria.
Table 3.5
Criteria for Quality of Faculty according to Students’ Perception
Reliability Test: Alpha = 0.831 KMO = 0.858
Factor Analysis
S.No Questionnaire Factor Loading Alpha Mean Variance SOCIAL RESPONSIBILITY
9 Leadership Skills I 0.565 R 0.707
3.678
1.192
10 Commitment to Knowledge updation
I 0.553 R
11 Commitment to Ethical Values
I 0.776 R
12 Commitment to Social Concerns
I 0.746 R
INTERPERSONAL SKILLS
2 Ability to Encourage the students
II 0.478 R 0.705
3.954
0.973
5 Approachable by Students
II 0.366 R
13 Enthusiasm II 0.617 R
14 Confidence II 0.433 R 15 Friendliness with
Students II 0.719 R
16 Temperament II 0.484 R 17 Sense of Humour II 0.676 R
PRESENTATION SKILLS
4 Presentation Skills III 0.361 R 0.609
3.813
1.047
6 Ability to use Computer & Technology
III 0.682 R
7 Ability to work as a Team Member
III 0.727 R
8 Problem Solving Skills III 0.520 R ACADEMIC COMPETENCE
1 Ability to Explain Clearly
IV 0.775 R 0.490
4.336
0.803
3 Depth of Knowledge IV 0.693 R REASERCH SKILLS
18 Commitment to Research V 0.690 R

81
The fourth factor named academic preparedness, consisted of two
criteria (a) secondary school preparation and (b) preparedness for a specific
program. Employment competence, social responsibility, learning skills and
generic skills were the other four factors structured by the factor analysis on
the perceptions of alumni on the criteria for the quality of students.
Commitment to social concerns is the significantly loaded criteria on the factor
called social responsibility. The seventh factor named as learning skills was
strongly loaded with the criteria of ability to apply knowledge. The eighth
factor labelled as generic skills was very strongly loaded with the criteria of
openness and flexibility.
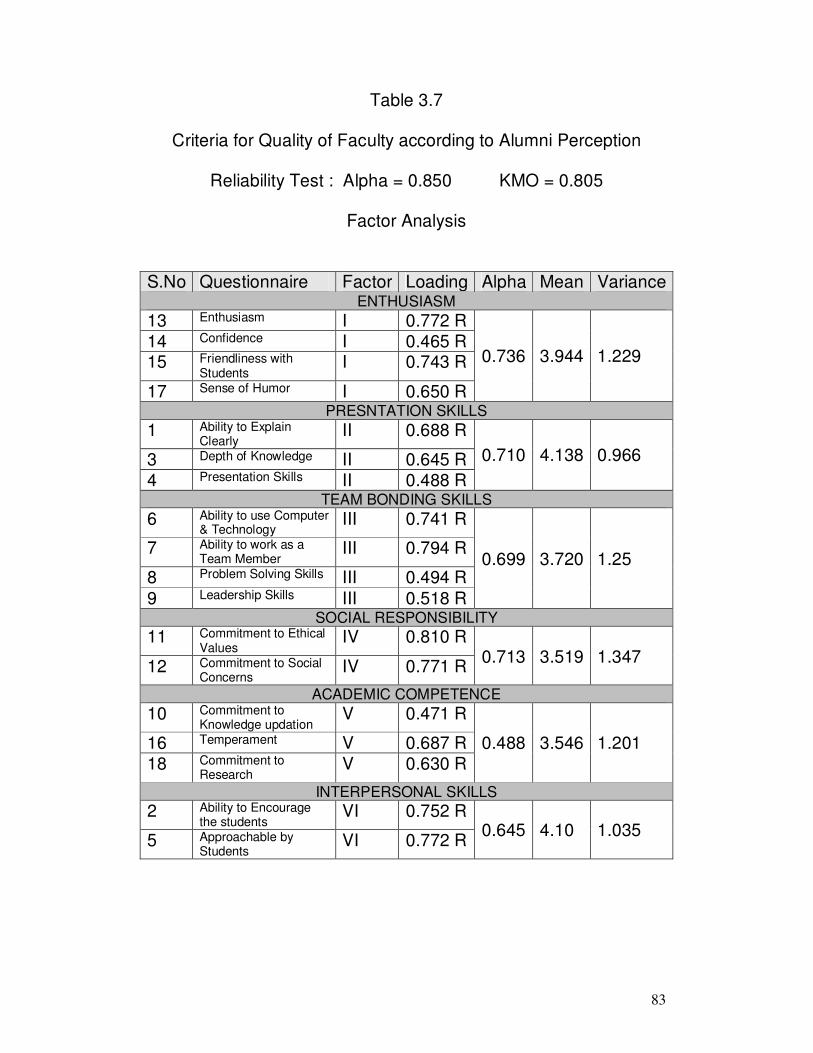
The factor analysis carried out on the perceptions of alumni on the
criteria for the quality of Faculty and six factors were structured and shown in
Table 3.7. Enthusiasm, Presentation Skills, Team Bonding Skills, Social
Responsibility, Academic Competence and Interpersonal Skills were found as
the six factors. The first factor consisted of four of eighteen criteria.
Enthusiasm was the strongly loaded criteria on the factor. The second factor
branded as presentation Skills consisted of three criteria and (a) ability to
explain clearly and (b) depth of knowledge skills were the robustly loaded on
the factor. Ability to work as a team member and ability to use computer and
technology loaded strongly on the factor labelled as team bonding skills. The
fourth factor branded as social responsibility includes (a) commitment to
ethical values and (b) commitment to social concerns with strong loading. The
sixth factor named as Interpersonal skills was very strongly loaded with the
criteria, ability to encourage the students and approachability by students.

82
Table 3.6
Criteria for Quality of Students according to Alumni Perception Reliability Test : Alpha = 0.859 KMO = 0.795
Factor Analysis
S.No Questionnaire Factor Loading Alpha Mean Variance ACADEMIC PERFORMANCE
8 Ability to interact with others I 0.463 R 0.720
3.716
1.137
10 Moral & Ethical Reasoning I 0.414 R 11 Personal Student
Development I 0.571 R
12 Completion of Program requirements
I 0.719 R
13 Expertise at the end of the program
I 0.609 R
14 Ability to get a job I 0.635 R COMMUNICATION SKILLS
20 Written communication skills II 0.716 R 0.655
3.89
1.187 21 Presentation skills II 0.624 R
22 Oral Communication skills II 0.671 R INTELLIGENCE
3 Basic Mathematical Competency
III 0.554 R 0.587
3.785
1.238
4 Intelligence III 0.697 R 5 Commitment to Learning III 0.631 R
ACADEMIC PREPAREDNESS 1 Secondary School
Preparation IV 0.672 R
0.55 3.341
1.36
2 Preparedness for a specific program
IV 0.677 R
EMPLOYMENT COMPETENCE 6 Sense of Responsibility V 0.638 R
0.576 3.908
1.025 9 Effective study skills & habits V 0.674 R
15 Performance on the job V 0.506 R SOCIAL RESPONSIBILITY
17 Commitment to Physical Fitness
VI 0.635 R 0.398 3.447 1.328
23 Commitment to Social Concerns
VI 0.790 R
LEARNING SKILLS 16 Commitment to Life Long
Learning VII 0.525 R
0.522 3.821
1.156
18 Leadership Skills VII 0.578 R 19 Ability to apply knowledge VII 0.683 R
GENERIC SKILLS 7 Openness & Flexibility VIII 0.826 R
83
Table 3.7
Criteria for Quality of Faculty according to Alumni Perception
Reliability Test : Alpha = 0.850 KMO = 0.805
Factor Analysis
S.No Questionnaire Factor Loading Alpha Mean Variance ENTHUSIASM
13 Enthusiasm I 0.772 R
0.736 3.944 1.229 14 Confidence I 0.465 R 15 Friendliness with
Students I 0.743 R
17 Sense of Humor I 0.650 R PRESNTATION SKILLS
1 Ability to Explain Clearly
II 0.688 R
0.710 4.138 0.966 3 Depth of Knowledge II 0.645 R 4 Presentation Skills II 0.488 R
TEAM BONDING SKILLS 6 Ability to use Computer
& Technology III 0.741 R
0.699
3.720
1.25
7 Ability to work as a Team Member
III 0.794 R
8 Problem Solving Skills III 0.494 R
9 Leadership Skills III 0.518 R SOCIAL RESPONSIBILITY
11 Commitment to Ethical Values
IV 0.810 R 0.713
3.519
1.347
12 Commitment to Social Concerns
IV 0.771 R
ACADEMIC COMPETENCE 10 Commitment to
Knowledge updation V 0.471 R
0.488 3.546 1.201 16 Temperament V 0.687 R 18 Commitment to
Research V 0.630 R
INTERPERSONAL SKILLS
2 Ability to Encourage the students
VI 0.752 R 0.645 4.10 1.035
5 Approachable by Students
VI 0.772 R
84
Commitment to knowledge updation, temperament and Commitment to
research were the only criteria loaded heavily for the fifth factor named
academic competence.
Table 3.8 shows the data collected on the perceptions of Industries on
the criteria for the quality of students. Principal components analysis of the
composite ratings on data collected utilizing a varimax rotation extracted eight
factors. The first factor encompassed 3 of the 23 criteria. Loading most
strongly on this factor, branded communication skills were (a) Written
communication skills, (b) Presentation skills, and (c) Oral Communication
skills.. The second factor, Academic performance, included openness and
flexibility, (b) Completion of Program requirements, and (c) Expertise at the
end of the program. A third factor expressed as Generic Skills and consisted
of (a) Basic Mathematical Competency, (b) Sense of responsibility and (c)
ability to interact with others. Effective study skills and habits, Moral and
Ethical Reasoning, Commitment to Life Long Learning and ability to apply
knowledge form the fourth factor named as learning skills.
Commitment to social concern was the criteria strongly loaded for the
fifth factor called social responsibility. The sixth factor labelled as employment
competence includes the criteria, ability to get a job and the performance on
the job with strong loading. The seventh factor, academic preparedness, was
strongly loaded with criteria (a) secondary school preparation and (b)
preparedness for a specific program.

85
Table 3.8
Criteria for Quality of Students according to Industry Perception Reliability Test: Alpha = 0.832 KMO = 0.732
Factor Analysis
S.No Questionnaire Factor Loading Alpha Mean Variance COMMUNICATION SKILLS
20 Written Communication Skills I 0.789 R 0.781
4.13
0.723 21 Presentation skills I 0.742 R
22 Oral Communication skills I 0.818 R ACADEMIC PERFORMANCE
7 Openness and Flexibility II 0.573 R
0.606 0.37 0.85 12 Completion of Program
requirements II 0.712 R
13 Expertise at the end of the program
II 0.714 R
GENERIC SKILLS
3 Basic Mathematical Competency
III 0.684 R
0.594 4.017 0.778 6 Sense of Responsibility III 0.757 R 8 Ability to interact with
others III 0.635 R
LEARNING SKILLS 9 Effective study skills & habits IV 0.487 R
0.62 3.86 0.881 10 Moral & Ethical Reasoning IV 0.555 R 16 Commitment to lifelong
learning IV 0.686 R
19 Ability to apply knowledge IV 0.795 R SOCIAL RESPONSIBILITY
17 Commitment to Physical V 0.618 R 0.515 3.41 0.980 23 Commitment to Social
Concerns V 0.763 R
EMPLOYMENT COMPETENCE 11 Personal Student
Development VI 0.411 R
0.687
4.00 0.725 14 Ability to get a job VI 0.846 R
15 Performance on the job VI 0.722 ACADEMIC PREPAREDNESS
01 Secondary School Preparation
VII 0.806 R
0.313 3.44 1.159 02 Preparedness for a specific program
VII 0.675 R
18 Leadership Skills VII 0.407
INTELLIGENCE 04 Intelligence VIII 0.576 R
0.542 4.01 0.80 05 Commitment to Learning VIII 0.447 R

86
The factor analysis carried out on the perceptions of Industries on
criteria for the quality of Faculty and five factors were structured and shown in
Table 3.9. Presentation Skills, Social Responsibility, Academic Competence,
Interpersonal Skills and Team Bonding Skills were found as the five factors.
The first factor consisted of four of eighteen criteria. Friendliness with
the students was the strongly loaded criteria on the factor. The second factor
branded as social responsibility consisted of four criteria with strong loading
for commitment to social concerns. (a) Ability to explain clearly and (b) depth
of knowledge skills (c) Problem solving skills and (d) commitment to
knowledge updation were robustly loaded on the factor branded as academic
competence. Ability to encourage the students was the criteria strongly loaded
for the fourth factor called interpersonal skills. Ability to work as a team
member and ability to use computer and technology were loaded strongly on
the factor labelled as team bonding skills.

87
Table 3.9
Criteria for Quality of Faculty according to Industry Perception
Reliability Test : Alpha = 0.866 KMO = 0.808
Factor Analysis
S.No Questionnaire Factor Loading Alpha Mean Variance PRESENTATION SKILLS
4 Presentation Skills I 0.559
0.676 4.128 0.703 5 Approachable by
Students I 0.663
9 Leadership Skills I 0.572 R 15 Friendliness with
Students I 0.847 R
SOCIAL RESPONSIBILITY 12 Commitment to Social
Concerns II 0.688 R
0.732 3.5 1.066 16 Temperament II 0.645 R
17 Sense of Humour II 0.488 R 18 Commitment to
Research II 0.745 R
ACADEMIC COMPETENCE 1 Ability to Explain
Clearly III 0.643 R
0.714 4.308 0.542 3 Depth of Knowledge III 0.754 R 8 Problem Solving Skills III 0.549 R 10 Commitment to
Knowledge updation
III 0.641 R
INTERPERSONAL SKILLS 2 Ability to Encourage
the students IV 0.757 R
0.666 4.193 0.67 11 Commitment to Ethical
Values IV 0.477 R
14 Confidence IV 0.593 R 13 Enthusiasm IV 0.536 R
TEAM BONDING SKILLS
06 Ability to use Computer & Technology
V 0.758 R 0.594 3.81 0.815
07 Ability to work as a Team Member
V 0.735 R

88
3.8 Variables Involved in the Study
The operationalisation of the control, independent variables and
dependent variables are explained in this section.
3.8 a Control Variables
A control variable is a variable that affects the dependent variable. By
"controlling a variable", it is possible to balance its effect across subjects and
groups so that one can ignore it, and just study the relationship between the
independent and the dependent variables.
3.8 b Independent Variables
The independent variable is considered to be the programme or the
cause or the treatment (Trochim, 2000). If it is manipulated for the study, the
independent variable is considered to be ‘active’ and if not, and studied as
such for its effect on another variable, then it is considered to be an ‘attribute’.
In this study, the demographic data, namely gender, age, educational
qualification, marital status and experience of the respondents are the
attribute independent variables. The demographic data of different
stakeholders, namely faculty, alumni and industries are collected.
i. Gender: Male / Female
ii Age:

89
iii Educational Qualification:
iv Marital Status:
v Designation:
vi Year of passing
vii Experience: In terms of years
From the category of students, demographic data such as gender, age,
degree, branch and year are collected. After the final phase of data collection,
the effects of these variables on the perception of stakeholders on the quality
of higher education are studied by using regression analysis. All the variables
are subject to factor analysis and the resultant factors and individual value
factors are calculated by adding the individual item variables under each
factor.
3.8 c Dependent Variables
The dependent variable is what is affected by the independent variable
(Trochim, 2000). It is called the criterion measure, the independent variable
being the experimental measure. The dependent variables are quality criteria.
Academic Performance, Social Responsibility, Communication Skills,
Learning Skills, Academic Preparedness, Employment Competence and
Generic Skills are the factors for measuring the quality of students. Academic
Competence, Team Bonding Skills, Interpersonal Skills, and Presentation
Skills are the factors for measuring the quality of faculty.
90
3.9 Data Analysis
This section of research design deals with the explanation of various
analyses carried out in this research work. The data after collection is entered
in the MS-Excel spread sheet and later the spread sheet is converted to a
‘.sav’ file to operate in the SPSS version 13.0. Initially, the data is checked for
omitted data, if any, and replaced with group means. Further, the data is
checked for the fulfilment of the basic assumptions of multivariate analysis,
namely linearity, normality and homoscedasticity.
3.9 a Exploratory Factor Analysis
The data collected in the final phase of the study is initially subjected to
an exploratory factor analysis using SPSS, to facilitate the process of eliciting
a factor structure. Here, Principal Components Analysis (PCA) with ‘Varimax’
rotation is used to identify the hidden factors/underlying factors. Here, the
factor structure obtained from the pilot study is not considered because the
sample size variation in the final study will change the factor structure
completely and the initial factor analytic study on the pilot data is only to know
the consistency of the data and to establish the validity of the construct
(Kerlinger, 1986; Guion, 1965).
The factor analysis is considered to be the queen of all multivariate
analyses, as it will help in establishing the construct validity of any tool. When
factor analysis is able to generate similar factors, when subject to new
91
samples comparing to the factors previously generated from an old sample, it
is said to be useful in hypothesis testing (Kerlinger, 1986). Moreover, factor
analysis will be useful to create summated scales which are useful in additive
analysis of the variables under each factor grouping and such additive
values/composite scores can be taken for interpretation on any of the factor
(Hair et al., 1998). So, the exploratory factor analysis is applied for the final
set of data to know the new factor structure emanating from the new set of
sample collected in the final phase of the study.
Before subjecting the data to exploratory factor analysis, the data is
tested for Kaiser-Meyer-Olkin (KMO) statistic which will analyse the sampling
adequacy of the data for factor analysis. The KMO statistic should not be less
than 0.6.
3.9 b Regression Analysis
Regression analysis is used to determine the functional relationship
between a dependent variable and a host of predictors. Multiple Linear
Regression is a logical extension of the simple linear regression analysis and
involves two or more independent variables forming the basis for estimating
the values of a dependent variable. The relationship between each
independent variable and the dependent variable is a linear one. The principal
advantage of multiple regression analysis is that it allows to use more of
available information to estimate the dependent variable (Dipak Kumar
Bhattacharya, 2006). The investigator assembles data on the underlying

92
variables of interest and employs regression to estimate the quantitative effect
of the causal variables upon the variable that they influence. The investigator
also typically assesses the “statistical significance” of the estimated
relationships, that is, the degree of confidence that the true relationship is
close to the estimated relationship
3.9 c Hierarchical Regression Analysis Hierarchical regression is used to evaluate the relationship between a
set of independent variables and the dependent variable, taking into count the
impact of different set of independent variables on the dependent variable.
Here, the independent variables are entered into the analysis in a sequence
of blocks/ groups that may contain one or more variables (Hair et al., 1998). A
hierarchical regression can have as many blocks as possible. A common
hierarchical regression analysis involves two blocks, one being control
variables and other a set of independent variables. Support for a hypothesis
would be expected to require statistical significance for the addition of each
block of variables and many times, the effect of blocks of variables previously
entered into the analysis will be excluded, whether or not a previous block is
statistically significant.
The analysis is aimed at obtaining the best indicator of the effect of the
predictor variables. The statistical significance of previously entered variables
is not interpreted (Hair et al., 1998). In the results analysis, the ‘R2 change’ is
used to confirm the hypothesis that the additional block of independent

93
variables is able to explain variance over and above the control/other
independent variable blocks.
3.9 d T-Test
The t-test is probably the most commonly used Statistical Data
Analysis procedure for hypothesis testing. Actually, there are several kinds of
t-tests, but the most common is the "two-sample t-test" also known as the
"Student's t-test" or the "independent samples t-test". The two sample t-test
simply tests whether or not two independent populations have different mean
values on some measure. From the data collected from the stakeholders, it
was observed that the two groups have different average scores. But does
this represent a real difference between the two populations, or just a chance
difference in samples? The statistics t-test allows to answer this question by
using the t-test statistic to determine a p-value that indicates how likely these
results could have been gotten by chance. By convention, if there is a less
than 5% chance of getting the observed differences by chance, the null
hypothesis is rejected and found a statistically significant difference between
the two groups is found.
3.9 e Correlation
In statistics, correlation (often measured as a correlation coefficient, r)
indicates the strength and direction of a linear relationship between
94
two random variables. That is in contrast with the usage of the term in
colloquial speech, which denotes any relationship, not necessarily linear. In
general statistical usage, correlation or co-relation refers to the departure of
two random variables from independence. In this broad sense, there are
several coefficients, measuring the degree of correlation, adapted to the
nature of the data. A number of different coefficients are used for different
situations. The best known is the Pearson product-moment correlation
coefficient, which is obtained by dividing the covariance of the two variables
by the product of their standard deviations
The following tools are used for analysis and hypothesis testing.
• To measure the gap between any two criteria, deviation (Difference in
individual factors sum) and correlation measure are used. This will
ensure that the results are methodologically triangulated.
• Moreover, the gap between any two groups is depicted through a
pictorial radar diagram to give a visual glimpse of the gap.
• Differentiating the differences in perception between any two groups in
the study is made through simple percentage analysis and later the
difference is established through student’s t-test.
• To identify the relationship between the demographic data of the
respondents and the quality perception factors, hierarchical
regressions is used.