chapter 3 - derivative market an overview -...
TRANSCRIPT

Implied Volatility Structure and Forecasting Efficiency: Evidence from Indian Option Market
~ Chapter 3 ~ 50
CHAPTER III
DERIVATIVE MARKET: AN OVERVIEW
3.1 INTRODUCTION
Many associate the financial market mostly with the equity market. The
financial market is, of course, far broader, encompassing bonds, foreign
exchange, real estate, commodities, classification of other asset and financial
instruments. Of late segment of the market that has fast become its most
important one is the derivatives market. The derivatives market has seen the
highest growth among all financial market segments in recent years. It has
become a central contributor to the vibrant state of the financial system and has
emerged as an important factor in the functioning of the real economy. Despite
the importance of the derivatives market, many a section of society want to
have a comprehensive perspective on its size, structure, role, etc. and on how it
works.
Last decade was one of the most eventful decades in the international
financial markets, more specifically derivatives market. On one side, just few
derivatives disaster stories were enough to bring the entire business of
derivatives under limelight, make everyone worry about unknown risks
associated with derivatives, and elevate derivatives into mysterious

Implied Volatility Structure and Forecasting Efficiency: Evidence from Indian Option Market
~ Chapter 3 ~ 51
“something”; while on the other side, there were people who started
understanding the derivatives and used the derivatives for hedging and
mitigating risks while adding liquidity to the markets.
The derivatives market has recently attracted more attention against the
backdrop of the financial crisis, fraud cases and the near failure of some market
participants. Although the financial crisis has primarily been caused by
structured credit-linked securities that are not derivatives, policy makers and
regulators have started thinking about strengthening regulation to increase
transparency and safety both for derivatives and other financial instruments.
Before discussing the prerequisites for a well-functioning derivatives market, it
is useful to consider the fundamentals and characteristics of this market along
with the mechanics of trading, its economic and social functions and the
dynamics of derivative market functioning with special reference to futures
market.
3.2 DERIVATIVES
Derivatives are financial instruments that are mainly used to protect
against or to manage risks, and very often also serve arbitrage or investment
purposes, providing various advantages compared to securities. Derivatives
come in many varieties and can be differentiated by how they are traded, what
they refer to, and the product type.
Implied Volatility Structure and Forecasting Efficiency: Evidence from Indian Option Market
~ Chapter 3 ~ 52
A derivative instrument, broadly, is financial contract whose payoff
structure is determined by the value of an underlying commodity, security,
interest rate, share price index, exchange rate, and oil price alike. Thus, a
derivative instrument derives its value from some underlying variable. A
derivative instrument by itself does not constitute ownership. It is, instead, a
promise to convey ownership. All derivatives are based on some “cash”
products. The underlying basis of a derivative instrument may be any product
including
1. Commodities like grain, coffee beans, orange juice, etc.
2. Precious metals like gold and silver
3. Foreign exchange rate
4. Bonds of different types, including medium and long-term negotiable
debt securities issued by governments, companies, etc.
5. Short-term debt securities such as T-bills
Derivatives are specialized contracts which are employed for a variety
of purposes including reduction of funding costs by borrowers, enhancing the
yield on assets, and modifying the payment structure of assets to correspond to
the investor’s market view. In the organized derivatives market where
derivative products are traded, future market plays a defining role. Futures
contracts are traded on exchanges, and they are standardized according to the
rules and regulations of the exchange. The exchange determines the exact
quality and quantity of the goods to be delivered per contract, when the

Implied Volatility Structure and Forecasting Efficiency: Evidence from Indian Option Market
~ Chapter 3 ~ 53
contract terminates and the location of the delivery. This standardization
facilitates secondary market trading and enhances the liquidity of the market.
The parties involved need not concern themselves with the creditworthiness of
other players because the exchange itself guarantees the performance of all
parties. The seller of a futures contract is said to be in the ‘short’ position and
the buyer is said to be in the ‘long’ position. The date at which the parties must
complete the transaction is the settlement or delivery date. The price agreed to
by two parties is known as the futures price.
3.3 TYPES OF DERIVATIVES
The most commonly used derivatives contracts are forwards, futures and
options. Here we take a brief look at various derivatives contracts that have
come to be used.
3.3.1 Forward Contracts
A forward contract is an agreement between two parties to buy and sell
a commodity or financial asset at certain future time for a certain price.
Historically, the forward markets are forerunners of futures markets. A forward
contract is a simple derivative that can be contrasted with a spot contract,
which is an agreement to buy or sell an asset today. A forward contract is
traded in the over-the-counter market usually between two financial institutions
or between a financial institution and one of its clients.
Implied Volatility Structure and Forecasting Efficiency: Evidence from Indian Option Market
~ Chapter 3 ~ 54
One of the parties to a forward contract assumes a long position and
agrees to buy the underlying asset on a certain specified future date for a
certain specified price. The other party assumes a short position and agrees to
sell the asset on the same date for the same price. Forward contracts on foreign
exchange are very popular. Most large banks have a "forward desk" within
their foreign exchange trading room that is devoted to the trading of forward
contracts.
3.3.2 Futures Contracts
Like a forward contract, a futures contract is an agreement between two
parties to buy or sell an asset at a certain time in the future for a certain price.
Unlike forward contracts, futures contracts are normally traded on an exchange.
To make trading possible, the exchange specifies certain standardized features
of the contract. As the two parties to the contract do not necessarily know each
other, the exchange provides a mechanism that gives the two parties a
guarantee that the contract will be honored.
The largest exchanges on which futures contracts are traded are the
Chicago Board of Trade (CBOT) and the Chicago Mercantile Exchange
(CME). On these and other exchanges throughout the world, a very wide range
of commodities and financial assets form the underlying assets in the various
contracts. The commodity includes even pork bellies, live cattle, sugar, wool,

Implied Volatility Structure and Forecasting Efficiency: Evidence from Indian Option Market
~ Chapter 3 ~ 55
lumber, copper, aluminum, gold, and tin. The financial assets include stock
indices, currencies, and treasury bonds.
One way in which a futures contract is different from a forward contract
is that an exact delivery date is usually not specified. The contract is referred to
by its delivery month, and the exchange specifies the period during the month
when delivery must be made. For commodities, the delivery period is often the
entire month. The holder of the short position has the right to choose the time
during the delivery period when it will make delivery. Usually, contracts with
several different delivery months are traded at any one time. The exchange
specifies the amount of the asset to be delivered for one contract and how the
futures price is to be quoted. In the case of a commodity, the exchange also
specifies the product quality and the delivery location.
3.3.3 Options Contracts
Options are traded both on exchanges and in the over-the-counter
market. There are two basic types of options. A call option gives the holder the
right to buy the underlying asset by a certain date for a certain price. A put
option gives the holder the right to sell the underlying asset by a certain date
for a certain price. The price in the contract is known as the exercise price or
strike price; the date in the contract is known as the expiration date or maturity
date. American options can be exercised at any time up to the expiration date.
European options can be exercised only on the expiration date. Most of the

Implied Volatility Structure and Forecasting Efficiency: Evidence from Indian Option Market
~ Chapter 3 ~ 56
options that are traded on exchanges are American. In the exchange-traded
equity options market, one contract is usually an agreement to buy or sell 100
shares. European options are generally easier to analyze than American
options, and some of the properties of an American option are frequently
deduced from those of its European counterpart.
It should be emphasized that an option gives the holder the right to do
something. The holders do not necessarily have to exercise this right. This is
what distinguishes options from forwards and futures, where the holder is
obligated to buy or sell the underlying asset. It should be noted that it costs
nothing to enter into a forward or futures contract, whereas there is a cost for
acquiring an option.
3.4 EMERGENCE OF FINANCIAL DERIVATIVES
Derivative products initially emerged as hedging devices against
fluctuations in common prices, and commodity-linked derivatives remained the
sole form of such products for almost three hundred years. Financial
derivatives came into limelight in the post-1970s due to growing instability in
the financial markets. However, since their emergence, financial derivatives
products have become very popular and in 1990’s, overtaking the commodity
derivatives they accounted for about two-thirds of total transaction in derivative
market. In recent years, the market for financial derivatives has grown
tremendously in terms of variety of instruments available, their complexity and

Implied Volatility Structure and Forecasting Efficiency: Evidence from Indian Option Market
~ Chapter 3 ~ 57
also in terms of turnover. In the class of equity derivatives world over, futures
and options on stock indices have gained more popularity than on individual
stocks, especially among institutional investors, who are the major users of
index-linked derivatives. Even small investors find the usefulness of
derivatives became of the existence of a high correlation between the popular
indexes with various portfolios. The lower cost associated with index
derivatives than derivative products based on individual securities is another
reason for their growing use.
3.5 PLAYERS IN DERIVATIVE MARKETS
Derivatives markets have been outstandingly successful. The main
reason is that they have attracted many different types of traders and have a
great deal of liquidity. When an investor wants to take one side of a contract,
there is usually no problem in finding someone who is prepared to take the
other side.
Three broad categories of traders can be identified among the players in
the market: hedgers, speculators, and arbitrageurs. Hedgers use futures,
forwards, and options to reduce the risk that they face from potential future
movements in a market variable. Speculators use them to bet on the future
direction of a market variable. Arbitrageurs take offsetting positions in two or
more instruments to lock in a profit.

Implied Volatility Structure and Forecasting Efficiency: Evidence from Indian Option Market
~ Chapter 3 ~ 58
3.5.1 Hedgers
Hedging is the prime reason which has led to the emergence of
derivatives. The availability of derivatives allows one to undertake many
activities at a considerably lower risk. Hedgers, therefore, are important
components of the derivatives markets. Hedgers are the traders who wish to
eliminate the risk associated with the price of an asset and they may take a long
position or short position on a commodity to lock in existing profits. The main
purpose is to reduce the volatility of a portfolio, by reducing the risk.
Nevertheless, while a forward contract requires no payment, an option contract
involves an initial cost. In the event of call is not exercised, the premium paid
for it becomes a net loss while if it is exercised, the profit resulting from the
call exercise compensates the cost.
3.5.2 Speculators
Hedgers are the people who wish to avoid the price risk; while
speculators are those who are willing to take such risk. These are the people
who take positions in the market and assume risks, to profit from fluctuations
in prices. In fact, the speculators consume information, make forecasts about
the prices and put their money in these forecasts. In this process, they feed
information into prices and hence contribute to market efficiency. By taking
positions, they are betting that a price would go up or they are betting that it
would go down. Depending on their perceptions, they may take long or short
Implied Volatility Structure and Forecasting Efficiency: Evidence from Indian Option Market
~ Chapter 3 ~ 59
positions on futures or options or may hold spread positions. Derivatives make
speculation easy with least investment. In the absence of the derivatives,
speculative activity would become very difficult as it might require huge funds
to be invested.
Speculators in the derivatives market may be categorized as scalpers,
day traders and position traders. Scalpers attempt to profit from small changes
in the contract price. Day traders speculate on the price movements during
single trading day, thus open and close positions many times a day but do not
carry any position at the end of the day. Obviously, they monitor the prices
continuously and generally attempt to make profit from just a few ticks per
trade. On the other hand, the position traders attempt to gain from price
fluctuations by keeping their positions open for longer durations - may be for a
few days, weeks or even months. They use fundamental analysis, technical
analysis and other information available to them to form their opinions on the
likely price movements (Vohra and Bagri 2008).
3.5.3 Arbitrageurs
Arbitrageurs attempt to earn risk-free profits by exploiting market
imperfections. An arbitrageur profits by trading a given commodity or other
items that sell for different prices in different markets. Thus, arbitrage involves
making riskless profit by simultaneously entering into transactions in two or
more markets. If a certain share is quoted at a lower rate on the NSE and at a

Implied Volatility Structure and Forecasting Efficiency: Evidence from Indian Option Market
~ Chapter 3 ~ 60
higher rate on the BSE, an arbitrageur would make profit by buying the share at
NSE and simultaneously selling it at BSE. This type of arbitrage is “arbitrage
over space”. If an arbitrageur feels that the futures are being quoted at a high
level considering the cost of carry, the arbitrageur would buy securities
underlying today and sell the future in market maturing in a month or two
hence. Similarly, since futures and options with various expiration dates are
traded in the market, there are likely to be several arbitrage opportunities in
trading. Thus, if a trader believes that the price differential between the futures
contracts on the same underlying asset with differing maturities is more or less
than what the arbitrageur perceives them to be, then appropriate positions in
them may be taken to make profits.
It may be noted that the existence of well-functioning derivatives
markets alters the flow of information into the prices. This is because, in a
purely cash market, speculators feed information into the spot prices. In
contrast, the presence of a derivatives market ensures that a major part of the
transformation of information into prices, due to lower transactions costs
involved in derivative a market, and then it gets transmitted to the spot markets.
It is here that the arbitrageurs provide a link between the derivatives market
and the cash market by synchronizing the prices in the two markets. Thus,
through their actions, the arbitrageurs provide a critical link between the cash
and derivatives markets.

Implied Volatility Structure and Forecasting Efficiency: Evidence from Indian Option Market
~ Chapter 3 ~ 61
3.6 SIGNIFICANCE OF DERIVATIVE MARKET
The derivatives market performs a number of economic functions; they are
1. Price Discovery: Prices in an organized derivatives market reflect the
perception of market participants about the future and lead the prices of
underlying to the perceived future level. The prices of derivatives
converge with the prices of the underlying at the expiration of the
derivative contracts. Thus derivatives help in discovery of future as well
as current prices.
2. Risk Transfer: Due to the inherent link of derivatives market with the
underlying cash market, witnesses higher trading volumes because of
participations by more players who would not have otherwise
participated for lack of an arrangement to transfer risk.
3. Controlled Speculative Trading: Speculative trades shift to a more
controlled environment due to the existence of derivatives market. In
the absence of an organized derivatives market, speculators trade in the
underlying cash markets and margining, monitoring and surveillance of
the activities of various participants become extremely difficult in
derivative markets.
4. Financial Architecture: An important incidental benefit that flows
from derivatives trading is that it acts as a catalyst for new

Implied Volatility Structure and Forecasting Efficiency: Evidence from Indian Option Market
~ Chapter 3 ~ 62
entrepreneurial activity. The derivative has a history of attracting many
bright, creative, well-educated people with an entrepreneurial attitude.
They often energize others to create new business, new products and
new employment opportunities, the benefit of which is immense.
5. Enhancing Volume of Activity: Derivatives market help to increase
savings and investment in the long run and transfer of risk enables the
market participants to expand their volume of activity.
3.7 INTERNATIONAL DERIVATIVES MARKETS
A comparison of the derivatives markets, over the last few years, among
various countries, gives rise to an interesting pattern. The exchanges of the
developed markets have shown robust growth and maintained their leadership
position over the last five years; at the same time, emerging market exchanges
have gained a position of eminence with strong growth trends. It is evident
from the data presented in Tables 3.1 and 3.2 given below that the Indian
market has emerged fourth along with markets in Korea, Spain and Israel, but
only in case of single stock option contracts traded Indian market stood at 11th
position.

Implied Volatility Structure and Forecasting Efficiency: Evidence from Indian Option Market
~ Chapter 3 ~ 63
TABLE 3.1
Top Five Exchanges in Terms of Stock Index Option Contracts Traded Exchange Number of Contracts traded
in 2010* Number of Contracts traded
in 2002 Percentage Changes
Korea Exchange 3,28,94,31,136 1,88,98,23,786 74.06% National Stock Exchange India 47,90,89,032 3,14,478 152244.21% EUREX 31,89,01,284 9,02,66,672 253.29%
Chicago Board Options Exchange 25,04,66,478 9,43,83,544 165.37%
TAIFEX 8,88,98,258 15,66,446 5575.16% Source: World Federation of Exchanges, * January to November 2010.
TABLE 3.2
Top Five Exchanges in Terms of Stock Option Contracts Traded
Exchange Number of Contracts traded in 2010*
Number of Contracts traded in 2002
Percentage Changes
Chicago Board Options Exchange 78,10,56,384 17,31,89,719 350.98% BM&FBOVESPA 75,06,13,492 8,97,40,269 736.43%
International Securities Exchange 67,83,16,805 15,22,71,279 345.47%
NASDAQ OMX PHLX 49,89,53,730 - -
EUREX 26,32,72,756 14,33,10,653 83.71%
National Stock Exchange India# 2,56,22,014 27,73,524 823.81% Source: World Federation of Exchanges, * January to November 2010.

Implied Volatility Structure and Forecasting Efficiency: Evidence from Indian Option Market
~ Chapter 3 ~ 64
3.8 DERIVATIVES MARKET IN INDIA
The derivatives market is a new market design of the Indian equity
market, which plays a vital role in disseminating information and offsetting
undesirable price risks. It ensures the cheapest trading facilities to the investors
and shareholders. The development of markets for derivatives was initially not
possible in view of prohibition in the Securities Contracts (Regulation) Act, 1956
(SCRA). The preamble to Act itself spoke of prohibiting options trading.
Section 20 of the Act explicitly prohibited all options in securities. Under this
Act, by a notification in 1969, Government prohibited all forward trading in
securities in order to curb unhealthy practices and to prevent undesirable
transactions. The introduction of trading in derivatives required withdrawal of
these prohibitions (Narain 2003).
The first step towards the introduction of derivatives trading in the Indian
financial markets was the promulgation of the Securities Laws (Amendment)
Ordinance, 1995, which withdrew the prohibition on options in securities. The
market for derivatives, however, did not take off, as there was no regulatory
framework to govern trading of derivatives. SEBI set up a 24 member
committee under the chairmanship of Dr. L.C.Gupta on November 18, 1996 to
develop appropriate regulatory framework for derivatives trading in India. The
committee submitted its report on March 17, 1998, prescribing necessary pre-
conditions for the introduction of derivatives trading in India. The committee

Implied Volatility Structure and Forecasting Efficiency: Evidence from Indian Option Market
~ Chapter 3 ~ 65
recommended that derivatives should be declared as “securities” so that
regulatory framework applicable to trading of “securities” could also govern
trading of securities. SEBI also set up a group in June 1998 under the
Chairmanship of Prof. J. R. Varma to recommend measures for risk containment
in derivatives market in India. The report, which was submitted in October 1998,
worked out the operational details of margining system, methodology for
charging initial margins, broker net worth, deposit requirement and real-time
monitoring requirements.
In December 1999, amendment to Securities Contracts (Regulation) Act
was notified, making way for derivatives trading in India. In June 2000, Futures
contracts on Nifty and Sensex were launched, followed by Options contracts on
Nifty and Sensex (European style). The Options contracts were launched on
stocks (American style) and Futures contracts on stocks in June, July and
November 2001, respectively. The number of underlying stocks and indexes has
increased over the years and presented in Table: 3.3
In the Indian market, the Index option contracts are cash settled European
style options. Stock options are also cash settled American style contracts.
Interest rate derivatives are based on notional 10-years bonds and 91-days T-bill.
All exchange-traded equity derivatives contracts are cash settled contracts.

Implied Volatility Structure and Forecasting Efficiency: Evidence from Indian Option Market
~ Chapter 3 ~ 66
TABLE 3.3
Futures and Options Traded on NSE & BSE
Financial Year NSE - Stocks NSE - Index BSE - Stocks BSE - Index 2001 - 2002 31 1 31 1 2002 - 2003 41 1 38 1 2003 - 2004 53 2 42 1 2004 - 2005 52 2 46 1 2005 - 2006 117 3 76 7 2006 - 2007 155 3 89 7 2007 - 2008 265 7 126 7 2008 – 2009 233 9 126 7 2009 - 2010 190 5 125 7
Source: BSE, NSE

Implied Volatility Structure and Forecasting Efficiency: Evidence from Indian Option Market
~ Chapter 3 ~ 67
TABLE 3.4
Total Derivatives Turnover Since Inception (in Rs. Crore)
Period NSE BSE Total 2001 - 2002 101,925 1,917 103,842 2002 - 2003 439,865 2,475 442,340 2003 - 2004 2,130,447 12,074 2,142,521 2004 - 2005 2,547,053 16,112 2,563,165 2005 - 2006 4,824,245 9 4,824,254 2006 - 2007 7,356,271 59,007 7,415,278 2007 – 2008 13,090,478 242,308 13,332,786 2008 – 2009 11,010,482 12,268 11,022,750 2009 - 2010 17,663,664 242,330 17,905,994
Source: BSE, NSE.

Implied Volatility Structure and Forecasting Efficiency: Evidence from Indian Option Market
~ Chapter 3 ~ 68
Turnover in the derivatives segment, since inception, is presented in Table
3.4. During 2001 - 02, turnover on NSE was Rs. 101,925 Crore and during 2009
– 2010, it was Rs 17,663,664 Crore. Likewise, during 2001 - 2002, turnover on
BSE was Rs. 1,917 Crore and during 2007 – 2008, it was Rs. 242. 330 Crore.
Turnover on BSE increased till 2004 – 2005, but during 2005 - 2006 there was a
noticeable decrease in turnover. The turnover on BSE has started increasing since
2006 - 2007. During the financial year 2008, there was decrease in total turnover
of derivative segment due to financial crisis. The business growth of F&O
segment and the number of contracts traded during the year are presented in
Chart 3.1
Chart 6
CHART 3.1
Business Growth of Futures & Options Segment
Source: www.nseindia.com
Implied Volatility Structure and Forecasting Efficiency: Evidence from Indian Option Market
~ Chapter 3 ~ 69
3.9 INDIA’S EXPERIENCE IN FUTURE & OPTIONS
India’s experience with the launch of equity derivatives market has been
extremely positive with the global derivatives market. The derivatives turnover
on the NSE has surpassed the equity market turnover. The turnover of derivatives
on the NSE increased from Rs. 23,654 million in 2000 - 01 to Rs. 166,193,220
million in 2009- 10. India is one of the most successful developing countries in
terms of a vibrant market for exchange-traded derivatives. This reiterates the
strengths of the recent developments of India’s securities markets, which are
based on nationwide market access, anonymous electronic trading, and a
predominantly retail market. There is an increasing belief that the equity
derivatives market is playing a major role in shaping price discovery.
As per Indian Securities Market Review (ISMR) 2009, NSE ranked as the
eighth largest derivatives exchange in the world, the second largest exchange in
terms of number of contracts traded in single stock futures and the third largest in
terms number of contracts traded in the index futures category. The derivatives
trading at NSE commenced on June 12, 2000 with futures trading on S&P CNX
Nifty Index. Subsequently, the product base has been increased to include trading
in options on S&P CNX Nifty Index, futures and options on CNX IT Index,
Bank Nifty Index, Nifty Midcap 50 Indices and 190 single stocks were observed
as of December 2010. Nifty Junior, CNX 100 and DEFTY indices were
discontinued from option trading from July 31, 2009. The various products on

Implied Volatility Structure and Forecasting Efficiency: Evidence from Indian Option Market
~ Chapter 3 ~ 70
the derivative segment of NSE and their date of launch are shown in the table
below.
TABLE 3.5
Products Available for Trading on Derivatives Segment
Products on Derivative Segment Date of Launch
S&P CNX Nifty Futures June 12, 2000
S&P CNX Nifty Options June 4, 2001
Single Stock Options July 2, 2001
Single Stock Futures November 9, 2001
Interest Rate Futures June 24, 2003
CNX IT Futures & Options August 29, 2003
Bank Nifty Futures & Options June 13, 2005
CNX Nifty Junior Futures & Options June 1, 2007
CNX 100 Futures & Options June 1, 2007
Nifty Midcap 50 Futures & Options October 5, 2007
Mini Nifty Futures & Options on S&P CNX Nifty January 1, 2008
Long term Options on S&P CNX Nifty March 3, 2008
S&P CNX Defty Futures and Options December 10, 2008
Interest rate Futures August 31, 2009 Source: www.nseindia.com
As per NSE factbook 2010, the total number of contracts traded increased
by 3 % to 68 crore contracts during 2009-10. Out of the total contracts traded,
50.26 % of the contracts were traded on Index options followed by index futures
on which 26.25% of the contracts were traded. Number of contracts traded on

Implied Volatility Structure and Forecasting Efficiency: Evidence from Indian Option Market
~ Chapter 3 ~ 71
stock futures was 21.45%, while 2.06% of the total contracts were traded on
stock options as envisaged in Chart 3.2.
Chart 3.2
Product Wise Numbers of Contracts Traded during 2009-2010
Source: www.nseindia.com
3.10 MECHANICS OF OPTION TRADING 3.10.1 Market Design
Only two exchanges in India have been permitted to trade in derivatives
contracts, the NSE and the BSE. Over the years, however, statistics show that the
BSE's contribution to the total derivatives turnover in the market has been
declining. Hence, the market design enumerated in this section is the derivative
segment of NSE (hereafter referred to as the F&O segment).

Implied Volatility Structure and Forecasting Efficiency: Evidence from Indian Option Market
~ Chapter 3 ~ 72
3.10.2 Trading Mechanism
The derivatives trading system at NSE is called NEAT-F&O system,
which provides a fully automated screen-based, anonymous order driven trading
system for derivatives on nationwide basis. It provides tremendous flexibility by
allowing users to place orders with their own time and price related conditions.
Nevertheless, trading in derivatives segment is essentially similar to that of Cash
Market segment.
There are four entities in the trading system:
1. Trading members: Trading members can trade either on their own
account or on behalf of their clients including participants. They are
registered as members with NSE and are assigned an exclusive Trading
member ID.
2. Clearing members: Clearing Members are members of NSCCL. They
carry out risk management activities and confirmation/inquiry of trades
through the trading system. These clearing members are also trading
members and clear trades for themselves and/or others.
3. Professional clearing members: A professional clearing member (PCM)
is a clearing member who is not a trading member. Typically, banks and
custodians become PCMs and clear and settle for their trading members.

Implied Volatility Structure and Forecasting Efficiency: Evidence from Indian Option Market
~ Chapter 3 ~ 73
4. Participants: A participant is a client of trading members like financial
institutions. These clients may trade through multiple trading members,
but settle their trades through a single clearing member only.
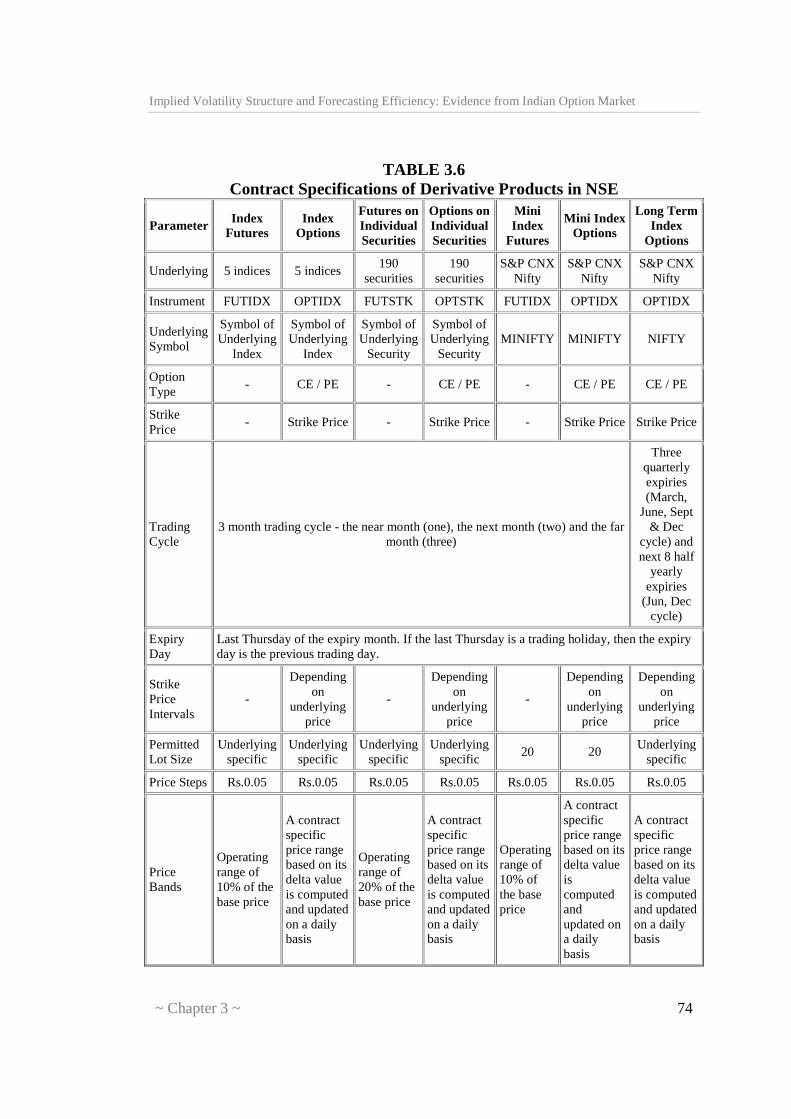
3.10.3 Contract Specifications
The index futures and index options contracts traded on NSE are based on
S&P CNX Nifty, CNX IT and Bank Nifty, while stock futures and options are
based on individual securities. Stock futures and options are available on 190
securities. Interest rate future contracts are available on Notional 91 day T-bill
and Notional 10 year bonds (6% coupon bearing and zero coupon bonds). While
the index options are European style, stock options are American style.
At any point of time there are only three contract months available for
trading, with 1 month, 2 months and 3 months to expiry. These contracts expire
on last Thursday of the expiry month and have a maximum of 3-month
expiration cycle. If the last Thursday is a trading holiday, the contracts expire on
previous trading day. A new contract is introduced on the next trading day
following the expiry of the near month contract. All the derivatives contracts are
at present cash settled. The contract specifications for derivatives traded on NSE
are summarized in Table 3.6.
Implied Volatility Structure and Forecasting Efficiency: Evidence from Indian Option Market
~ Chapter 3 ~ 74
TABLE 3.6
Contract Specifications of Derivative Products in NSE
Parameter Index Futures
Index Options
Futures on Individual Securities
Options on Individual Securities
Mini Index
Futures
Mini Index Options
Long Term Index
Options
Underlying 5 indices 5 indices 190
securities 190
securities S&P CNX
Nifty S&P CNX
Nifty S&P CNX
Nifty
Instrument FUTIDX OPTIDX FUTSTK OPTSTK FUTIDX OPTIDX OPTIDX
Underlying Symbol
Symbol of Underlying
Index
Symbol of Underlying
Index
Symbol of Underlying
Security
Symbol of Underlying
Security MINIFTY MINIFTY NIFTY
Option Type
- CE / PE - CE / PE - CE / PE CE / PE
Strike Price
- Strike Price - Strike Price - Strike Price Strike Price
Trading Cycle
3 month trading cycle - the near month (one), the next month (two) and the far month (three)
Three quarterly expiries (March,
June, Sept & Dec
cycle) and next 8 half
yearly expiries
(Jun, Dec cycle)
Expiry Day
Last Thursday of the expiry month. If the last Thursday is a trading holiday, then the expiry day is the previous trading day.
Strike Price Intervals
-
Depending on
underlying price
-
Depending on
underlying price
-
Depending on
underlying price
Depending on
underlying price
Permitted Lot Size
Underlying specific
Underlying specific
Underlying specific
Underlying specific
20 20 Underlying
specific
Price Steps Rs.0.05 Rs.0.05 Rs.0.05 Rs.0.05 Rs.0.05 Rs.0.05 Rs.0.05
Price Bands
Operating range of 10% of the base price
A contract specific price range based on its delta value is computed and updated on a daily basis
Operating range of 20% of the base price
A contract specific price range based on its delta value is computed and updated on a daily basis
Operating range of 10% of the base price
A contract specific price range based on its delta value is computed and updated on a daily basis
A contract specific price range based on its delta value is computed and updated on a daily basis

Implied Volatility Structure and Forecasting Efficiency: Evidence from Indian Option Market
~ Chapter 3 ~ 75
3.10.4 Transaction Charges
The maximum brokerage chargeable by a trading member in relation to
trades effected in the contracts admitted to dealing on the F&O segment of NSE
is fixed at 2.5% of the contract value in case of index futures and stock futures.
In case of index options and stock options it is 2.5% of notional value of the
contract [(Strike Price + Premium) X Quantity)], exclusive of statutory levies.
The transaction charges payable to the exchange by the trading member
for the trades executed by him on the F&O segment are fixed at the rate of Rs. 2
per lakh of turnover (0.002%) subject to a minimum of Rs. 1,00,000 per year.
However, for the transactions in the options sub-segment, the transaction charges
will be levied on the premium value at the rate of 0.05% (each side) instead of on
the strike price as levied earlier.
The trading members contribute to Investor Protection Fund of F&O
segment at the rate of Re.1/- per Rs. 100 crore of the traded value (each side) in
case of Futures segment and Rs.1/- per Rs. 100 crore of the premium amount
(each side) in case of Options segment. The trading members are also required to

Implied Volatility Structure and Forecasting Efficiency: Evidence from Indian Option Market
~ Chapter 3 ~ 76
pay securities transaction tax (STT) on non-delivery transactions at the rate of
0.017% (payable by the seller) for derivatives w. e. f June 1, 2006.
No transaction charges will be payable in respect of trades done in Interest
Rate Futures on the F&O Segment of the Exchange with effect from 1st April
2007 till 31st March 2008. Every Trading Member participating in trading in such
Interest Rate Futures at any time during the year 2007-08 shall be required to
make a lump sum contribution of Rs.500/- for the whole year as a contribution to
the Investor Protection Fund. There was no transaction charges levied on
turnover above Rs.10 crores per trading member per day for trades done in
NIFTY Junior and CNX 100 in the Futures sub-segment upto September 30,
2007.
3.10.5 Clearing and Settlement
NSCCL undertakes clearing and settlement of all trades executed on the
F&O segment of the Exchange. It also acts as legal counterparty to all trades on
this segment and guarantees their financial settlement. The Clearing and
Settlement process comprises three main activities, viz., Clearing, Settlement and
Risk Management.
3.10.5.1 Clearing Mechanism
The first step in clearing process is working out open positions and
obligations of clearing (self-clearing/trading-cum-clearing/professional clearing)

Implied Volatility Structure and Forecasting Efficiency: Evidence from Indian Option Market
~ Chapter 3 ~ 77
members (CMs). The open position of a CM is arrived at by aggregating the
open positions of all the trading members (TMs) and all custodial participants
(CPs) clearing through him, in the contracts which they have traded. The open
position of a TM is arrived at by summing up his proprietary open position and
clients' open positions, in the contracts which they have traded. While entering
orders on the trading system, TMs identify orders as either proprietary or client.
Proprietary positions are calculated on net basis for each contract and that of
clients are arrived at by summing together net positions of each individual client.
A TM's open position is the sum of proprietary open position, client open long
position and client open short position.
3.10.5.1 Settlement Mechanism
All futures and options contracts are cash settled i.e. through exchange of
cash. The underlying for index futures/options of the Nifty index cannot be
delivered. The settlement amount for a CM is netted across all their TMs/clients,
across various settlements. For the purpose of settlement, all CMs are required to
open a separate bank account with NSCCL designated clearing banks for F&O
segment.

Implied Volatility Structure and Forecasting Efficiency: Evidence from Indian Option Market
~ Chapter 3 ~ 78
3.10.5.1.1 Settlement of Futures Contracts on Index or Individual
Securities
Futures contracts have two types of settlements, the MTM settlement
which happens on a continuous basis at the end of each day, and the final
settlement which happens on the last trading day of the futures contract.
• MTM Settlement for Futures: The positions in futures contracts for each
member are marked-to-market to the daily settlement price of the relevant
futures contract at the end of each day. The CMs who have suffered a loss
are required to pay the mark-to-market (MTM) loss amount in cash which
is in turn passed on to the CMs who have made a MTM profit. This is
known as daily mark-to-market settlement. CMs are responsible to collect
and settle the daily MTM profits/losses incurred by the TMs and their
clients clearing and settling through them. Similarly, TMs are responsible
to collect/pay losses/ profits from/to their clients by the next day. The pay-
in and pay-out of the mark-to-market settlement are affected on the day
following the trade day (T+1).
• Final Settlement for Futures: On the expiry day of the futures contracts,
after the close of trading hours, NSCCL marks all positions of a CM to the
final settlement price and the resulting profit/loss is settled in cash. Final
settlement loss/profit amount is debited/credited to the relevant CM's
clearing bank account on the day following expiry day of the contract.

Implied Volatility Structure and Forecasting Efficiency: Evidence from Indian Option Market
~ Chapter 3 ~ 79
• Settlement Prices for Futures: Daily settlement price on a trading day is
the closing price of the respective futures contracts on such day. The
closing price for a futures contract is currently calculated as the last half
an hour weighted average price of the contract in the F&O Segment of
NSE. Final settlement price is the closing price of the relevant underlying
index/security in the Capital Market segment of NSE, on the last trading
day of the Contract. The closing price of the underlying Index/security is
currently its last half an hour weighted average value in the Capital
Market Segment of NSE.
3.10.5.1.2 Settlement of Options Contracts on Index or Individual
Securities
Options contracts have three types of settlements, daily premium
settlement, interim exercise settlement in the case of option contracts on
securities and final settlement.
• Daily Premium Settlement for Options: Buyer of an option is obligated to
pay the premium towards the options purchased by him. Similarly, the
seller of an option is entitled to receive the premium for the option sold by
him. The premium payable position and the premium receivable position
are netted to compute the net premium payable or receivable amount for

Implied Volatility Structure and Forecasting Efficiency: Evidence from Indian Option Market
~ Chapter 3 ~ 80
each client for each option contract. The CMs who have a premium
payable positions are required to pay the premium amount to NSCCL
which is in turn passed on to the members who have a premium receivable
position. This is known as daily premium settlement. CMs are also
responsible to collect and settle the premium amounts from the TMs and
their clients clearing and settling through them. The pay-in and pay-out of
the premium settlement is on T+1 day (T=Trade day). The premium
payable amount and premium receivable amount are directly
credited/debited to the CMs clearing bank account.
• Interim Exercise Settlement: Interim exercise settlement takes place only
for option contracts on individual securities. An investor can exercise his
in-the-money options at any time during trading hours, through his trading
member. Interim exercise settlement is effected for such options at the
close of the trading hours, on the day of exercise. Valid exercised option
contracts are assigned to short positions in the option contract with the
same series (i.e. having the same underlying, same expiry date and same
strike price), on a random basis, at the client level. The CM who has
exercised the option receives the exercise settlement value per unit of the
option from the CM who has been assigned the option contract. Exercise
settlement value is debited/credited to the relevant CMs clearing bank
account on T+1 day (T=exercise date).

Implied Volatility Structure and Forecasting Efficiency: Evidence from Indian Option Market
~ Chapter 3 ~ 81
• Final Exercise Settlement: Final Exercise settlement is effected for
option positions at in-the-money strike prices existing at the close of
trading hours, on the expiration day of an option contract. All long
positions at in-the-money strike prices are automatically assigned to short
positions in option contracts with the same series, on a random basis.
For index options contracts, exercise style is European style, while for
options contracts on individual securities, exercise style is American style. Final
Exercise is Automatic on expiry of the option contracts.
Final settlement loss/profit amount for option contracts on Index is
debited/credited to the relevant CMs clearing bank account on T+1 day
(T=expiry day). Final settlement loss/ profit amount for option contracts on
Individual Securities is debited/credited to the relevant CMs clearing bank
account on T+2 day. Open positions, in option contracts, cease to exist after their
expiration day.
The pay-in / pay-out of funds for a CM on a day is the net amount across
settlements and all TMs/clients, in F&O Segment.
Implied Volatility Structure and Forecasting Efficiency: Evidence from Indian Option Market
~ Chapter 3 ~ 82
3.11 RISK MANAGEMENT SYSTEM
NSCCL has developed a comprehensive risk containment mechanism for the
F&O segment. The salient features of risk containment measures on the F&O
segment are:
• The financial soundness of the members is the key to risk management.
Therefore, the requirements for membership in terms of capital adequacy
(net worth, security deposits) are quite stringent.
• NSCCL charges an upfront initial margin for all the open positions of a
Clearing Member (CM). It specifies the initial margin requirements for
each futures/options contract on a daily basis. It follows VaR-based
margining computed through SPAN. The CM in turn collects the initial
margin from the trading members (TMs) and their respective clients.
• The open positions of the members are marked to market based on
contract settlement price for each contract at the end of the day. The
difference is settled in cash on a T+1 basis.
• NSCCL's on-line position monitoring system monitors a CM's open
position on a real time basis. Limits are set for each CM based on his
effective deposits. The on-line position monitoring system generates alert
messages whenever a CM reaches 70 %, 80 %, 90 % and a disablement
message at 100 % of the limit. NSCCL monitors the CMs for Initial

Implied Volatility Structure and Forecasting Efficiency: Evidence from Indian Option Market
~ Chapter 3 ~ 83
Margin violation and Exposure margin violation, while TMs are
monitored for Initial Margin violation and position limit violation.
• CMs are provided a trading terminal for the purpose of monitoring the
open positions of all the TMs clearing and settling through him. A CM
may set limits for a TM clearing and settling through him. NSCCL assists
the CM to monitor the intra-day limits set up by a CM and whenever a
TM exceeds the limits, it stops that particular TM from further trading.
• A member is alerted of his position to enable him to adjust his exposure or
bring in additional capital. Margin violations result in disablement of
trading facility for all TMs of a CM in case of a violation by the CM.
• A separate Settlement Guarantee Fund for this segment has been created
out of deposits of members.
The most critical component of risk containment mechanism for F&O
segment is the margining system and on-line position monitoring. The actual
position monitoring and margining is carried out on-line through Parallel Risk
Management System (PRISM) using SPAN® (is a registered trademark of the
Chicago Mercantile Exchange (CME) used here under license) Standard
Portfolio Analysis of Risk) system for the purpose of computation of on-line
margins, based on the parameters defined by SEBI.

Implied Volatility Structure and Forecasting Efficiency: Evidence from Indian Option Market
~ Chapter 3 ~ 84
3.12 NSE - SPAN
The objective of NSE-SPAN is to identify overall risk in a portfolio of all
futures and options contracts for each member. The system treats futures and
options contracts uniformly, while at the same time recognising the unique
exposures associated with options portfolios, like extremely deep out-of-the-
money short positions and inter-month risk.
Its over-riding objective is to determine the largest loss that a portfolio
might reasonably be expected to suffer from one day to the next day based on
99% VaR methodology.
SPAN considers uniqueness of option portfolios. The following factors
affect the value of an option:
i. Underlying market price
ii. Volatility (variability) of underlying instrument
iii. Time to expiration
iv. Interest rate
v. Strike price
As these factors change, the value of options maintained within a portfolio
also changes. Thus, SPAN constructs scenarios of probable changes in
underlying prices and volatilites in order to identify the largest loss a portfolio

Implied Volatility Structure and Forecasting Efficiency: Evidence from Indian Option Market
~ Chapter 3 ~ 85
might suffer from one day to the next. It then sets the margin requirement to
cover this one-day loss.
The complex calculations (e.g. the pricing of options) in SPAN are
executed by NSCCL. The results of these calculations are called risk arrays. Risk
arrays, and other necessary data inputs for margin calculation are provided to
members daily in a file called the SPAN Risk Parameter file. Members can apply
the data contained in the Risk Parameter files, to their specific portfolios of
futures and options contracts, to determine their SPAN margin requirements.
Hence, members need not execute a complex option pricing calculation,
which is performed by NSCCL. SPAN has the ability to estimate risk for
combined futures and options portfolios, and also re-value the same under
various scenarios of changing market conditions.
NSCCL generates six risk parameters file for a day taking into account
price and volatilities at various time intervals and are provided on the website of
the Exchange.
3.13 MARGINS
The margining system for F&O segment is as below:
• Initial margin: Margin in the F&O segment is computed by NSCCL upto
client level for open positions of CMs/TMs. These are required to be paid
up-front on gross basis at individual client level for client positions and on

Implied Volatility Structure and Forecasting Efficiency: Evidence from Indian Option Market
~ Chapter 3 ~ 86
net basis for proprietary positions. NSCCL collects initial margin for all
the open positions of a CM based on the margins computed by NSE-
SPAN. A CM is required to ensure collection of adequate initial margin
from his TMs up-front. The TM is required to collect adequate initial
margins up-front from his clients.
• Premium Margin: In addition to Initial Margin, Premium Margin is
charged at client level. This margin is required to be paid by a buyer of an
option till the premium settlement is complete.
• Assignment Margin for Options on Securities: Assignment margin is
levied in addition to initial margin and premium margin. It is required to
be paid on assigned positions of CMs towards interim and final exercise
settlement obligations for option contracts on individual securities, till
such obligations are fulfilled. The margin is charged on the net exercise
settlement value payable by a CM towards interim and final exercise
settlement.
• Exposure Margins: Clearing members are subject to exposure margins in
addition to initial margins.
• Client Margins: NSCCL intimates all members of the margin liability of
each of their client. Additionally members are also required to report
details of margins collected from clients to NSCCL, which holds in trust
client margin monies to the extent reported by the member as having been
collected from their respective clients.

Implied Volatility Structure and Forecasting Efficiency: Evidence from Indian Option Market
~ Chapter 3 ~ 87
3.14 CONCLUSION
The study concludes that the derivatives market and its instruments are
very dynamic and have quickly emerged as the most important segment of
financial market. The market has a complex operational environment with
brokers, exchanges, and industry organization and a federal agency all playing
their respective roles. Finally, the regulatory bodies govern the activities of a
variety of like arbitragers, speculators, etc. and thus, facilitate option market
effectively to fulfill its economic functions of risk allocation. The imperatives for
a well-functioning market are efficiency, price discovery and safety. Overall, it
is clearly desirable to preserve the environment that has contributed to the
impressive development of the derivatives market which performs various
important economic functions. However, it is imperative for policy makers to
put efforts such that safety, transparency and operational efficiency could be
enhanced along proven and successful models helping the global derivatives
market to become even safer and more efficient.