chapter 3 energy scenario in...
TRANSCRIPT
21
CHAPTER 3
ENERGY SCENARIO IN INDIA
3.1 INTRODUCTION
India has achieved tremendous success in developing its electricity system.
Commencing with a meager installed capacity of about 1360 MW in 1947, the year
ower sector grew substantially over the
last six decades, and the installed capacity at present as on 31st October 2010 is
1,67,278.36 MW. However, India has to ensure sufficient energy for industrial and
commercial activity in the country, as energy is an essential input in the economy.
Further, India has set itself an ambitious target of electrifying every village and
every household by 2012. The National Electricity Policy of the Government of
India visualizes that the annual per capita consumption increases to 1000 units from
the current level of 733.54 units. The Government would also like to ensure a
minimum lifeline consumption of 1 unit per household per day as a merit good by
2012. In order to achieve this scale of supply and ensure sufficient electricity to all at
reasonable rates, it is necessary not only to have an efficient and competitive power
sector but also to explore all possible options of generation and supply of electricity.
As shown in Figure 3.1, out of the total installed generation capacity, 65% is
thermal, 22% hydro, 3% nuclear and 10% renewable (including wind). Despite
impressive growth in the generation capacity since independence, India has always
experienced shortage in terms of peaking capacity requirement as well as energy.
At present, all India peak shortage and energy shortage are 9.4% and 7%
respectively. Considering that, roughly 57% of rural households are yet to get

22
access to electricity and that the Government aims to provide electricity to all
households by 2012, shortages of peaking capacity and energy will only increase.
Needless to say, efforts need to be made to explore all energy supply options.
Figure 3.1 Power Capacity installed in India
3.2 INDIA METEOROLOGICAL DEPARTMENT
The India Meteorological Department (IMD), with its headquarters at Delhi,
has six regional meteorological centers. Moreover, there are different kinds of
radiation stations that measure solar radiation and the daily duration of sunshine.
Observations made by these stations help in the assessment of solar energy potential
across the country. During most of the year in India, the sky is clear and sunny with
moderate humidity. The states of Rajasthan and northern Gujarat experience the
highest annual global radiation. According to the national action plan on climate
change, if India were to convert 1% of the 5,000 trillion kilowatt-hour of solar
energy that it receives in a year into energy, the country would have enough to meet
its energy needs, which is now a growing concern.
Solar industry has immense potential for a tropical country like India where
around 45% of households, mainly in rural areas, do not have access to electricity.
The industry has witnessed rapid growth over the past few years and is projected to

23
grow further in future. In India, most part of the country receives 300 to 330 sunny
days in a year which contributes to solar energy equivalent to more than 5,000
Trillion kWh per year, which is far more than its total annual energy consumption.
geographical location, large population and Government support are making
it to become one of the most rapidly emerging solar energy markets in the world.
As a result, the country is becoming one of the most preferred destinations for both
global and local ventures
Demand for solar products has been rapidly rising for the recent years, especially
in rural areas, and is expected to continue growing substantially during our forecast
period (2013-2015). Solar street lighting systems, home lighting systems, power
plants, solar cookers, solar pumps and solar water heating systems are the most
popular applications in India. Many states have started promoting solar based
applications by giving incentives and tax savings. States like Gujarat and Rajasthan
have formulated transparent and progressive regulatory framework in order to boost
the solar industry. Besides, states like Delhi, Uttar Pradesh, West Bengal,
Maharashtra, Chandigarh and Tamilnadu are promoting solar energy in rural, urban
and semi urban areas.
3.3 ENERGY SCENARIO IN TAMIL NADU
The total installed power capacity of Tamilnadu is 14,774.06 MW as on
31st October 2010, comprising generation from thermal, hydro and renewable
sources of energy. Tamilnadu is the only state in India where 35% share of the
installed capacity comes from renewable source of energy.
At present, the peak shortage in the state is 7.9% whereas energy shortage is
4.6%. To meet the ever growing needs of energy, the Tamilnadu electricity board
has proposed new generation projects for the next 5 years. A total installed capacity
of 5530 MW is proposed to be added which includes thermal, hydro and joint
venture projects in the state.

24
Figure 3.2 shows the sector wise installed capacity in Tamilnadu. The
maximum contribution is from private sector at 42.6%, followed by state and central
contribution of 38.6% and 18.8% respectively.
Figure 3.2 Sector-wise installed capacity in Tamilnadu
Developing countries face situations of limited energy resources, especially the
provision of electricity in rural areas, and there is an urgent need to address this constraint
to social and economic development. India faces a significant gap between electricity
demand and supply where demand is increasing at a very rapid rate compared to the
supply. According to the World Bank, roughly 45 percent of residences in India are
without electricity. In addition, blackouts are a common occurrence throughout the
-third of Indian businesses
believe that unreliable electricity is one of their primary impediments to doing business.
In addition, coal shortages are further straining power generation capabilities.
Figure 3.3shows the sector wise installed capacity in Tamilnadu. The major
contribution is from thermal sources (about 48%) followed by renewable, hydro &
nuclear by 35%, 14% and 3% respectively).

25
Figure 3.3 Technology-wise installed Capacity in Tamilnadu
Power generation using freely available solar energy is one such option of
renewable energy resources. India is endowed with rich solar energy resource.
The average intensity of solar radiation received on India is 200 MW/km square.
With a geographical area of 3.287 million km square, this amounts to 657.4 million MW.
However, 87.5% of the land is used for agriculture, forests, fallow lands, etc., 6.7%
for housing, industry, etc., and 5.8% is either barren, snow bound, or generally
inhabitable. Thus, only 12.5% of the land area amounting to 0.413 million km
square can, in theory, be used for solar energy installations. Even if 10% of this area
can be used, the available solar energy would be 8 million MW.
As part of the National Solar Mission, the ministry aims to bolster the annual
photovoltaic production to at least 1,000 megawatts a year by 2017 as India has
only 2.12 MW of grid connected solar generation capacity. With an installed
capacity of 123 GW, the country currently faces energy shortage of 8 percent and a
peak demand shortage of 11.6 percent. In order to sustain a growth rate of
8 percent, it is estimated 36 that the power generation capacity in India would have

26
to increase to 306 GW in the next ten years which is 2.5 times current levels. The
high solar incidence of about 300 clear sunny days in a year in most parts of India
and the daily average solar energy incident over India varies from 4-7 kWh/m2.
3.4 AGRO CLIMATIC RESEARCH CENTRE
The Department of Agricultural Meteorology, established on 9th November
1998 for doing research on aerobic meteorology, micro-meteorology, horticultural
meteorology, and other related subjects, acts as centre for the different AGROMET
observatories of TNAU and strengthens the agricultural meteorology education for
the State of Tamil Nadu.
Regional forecast based agro-advisory services are made in collaboration
with India Meteorological Department, Pune. Figure 3.4 shows the Agro Climate
Research Centre in TNAU, Coimbatore.
Figure 3.4 Automatic weather station in TNAU
The following equipments are used to measure global solar radiation and
sunshine hours of Agro climatic research centre.
Pyranometer
Sunshine Recorder
27
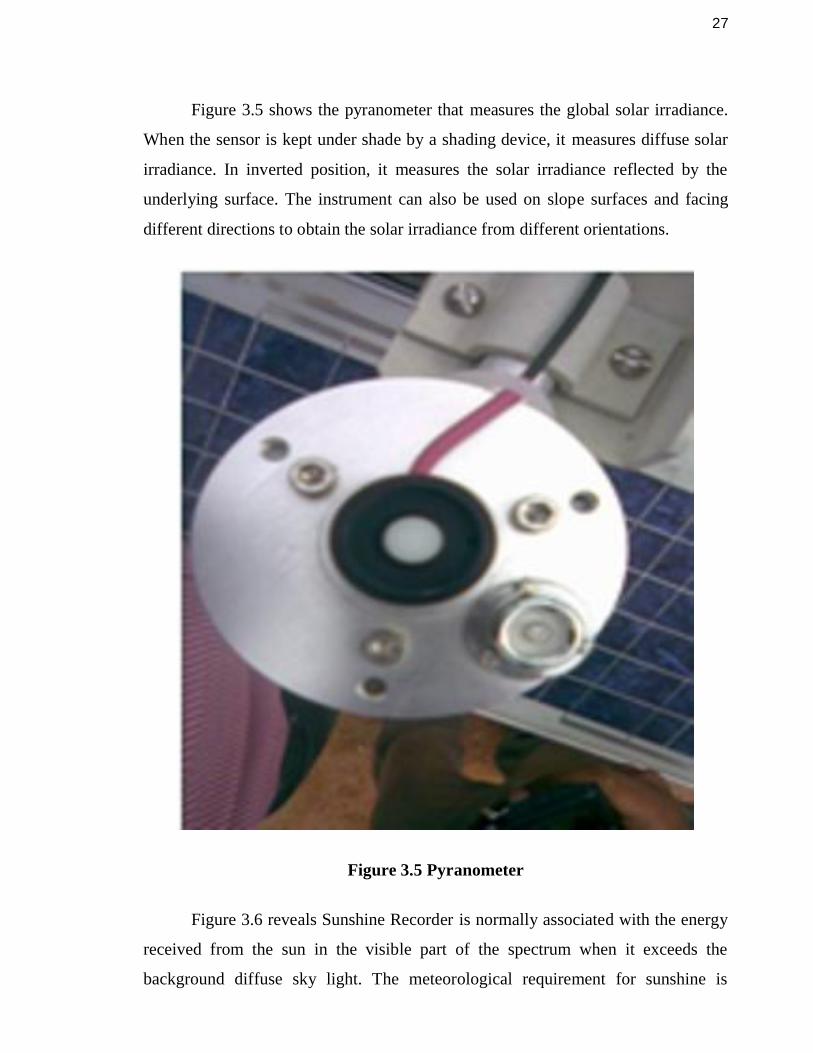
Figure 3.5 shows the pyranometer that measures the global solar irradiance.
When the sensor is kept under shade by a shading device, it measures diffuse solar
irradiance. In inverted position, it measures the solar irradiance reflected by the
underlying surface. The instrument can also be used on slope surfaces and facing
different directions to obtain the solar irradiance from different orientations.
Figure 3.5 Pyranometer
Figure 3.6 reveals Sunshine Recorder is normally associated with the energy
received from the sun in the visible part of the spectrum when it exceeds the
background diffuse sky light. The meteorological requirement for sunshine is

28
primarily for relating to climatologically cloudy conditions. The sunshine data are
also used to characterize the climate of sites, especially of the health resorts and
places of tourist interests. The sunshine duration data are also used as an input in
studies concerning agriculture.
Figure 3.6 Sunshine Recorder
Note: Specifications presented in the Appendix 1.