chapter 3 experimental investigation -...
TRANSCRIPT

66
CHAPTER 3
EXPERIMENTAL INVESTIGATION
3.1 PREAMBLE
In this section, the preparation of an FRP Honeycomb core
sandwich panel with different cell sizes, and the experimental methods
adopted for assessing the mechanical characteristics, are explained. They are
broadly as under:
Manufacture of FRP Facings
Manufacture of FRP Honeycomb core
Manufacture of Sandwich panels
Testing of facing sheets
Static flexural and compression testing of Sandwich panels
Low velocity Impact testing of Sandwich panels
Dynamic testing of Sandwich panels
3.2 FLOW CHART OF THE RESEARCH
E-glass fabrics, epoxy thermosetting resin based honeycomb core
and facesheets were used to fabricate composite sandwich panels. The
reinforcement constituents of the composite facesheets and core are E-glass
0°/90° fabrics, and LY 556 epoxy resin with HY 951 hardener used as the

67
3.0
Analysis of Static, Impact and vibration behaviour of Sandwich panels 4.0
Experimental Investigation- Manufacture of Sandwich panels with different cell sizes- Physical & mechanical characterization of Face sheet- Flexural testing of sandwich panels- Compression testing of sandwich panels- Low velocity Impact testing of sandwich panels- Experimental Modal analysis of sandwich panels under differentboundary conditions
Dissertation on “The Static, Impact and Vibration Behaviour of FRPHoneycomb Core Sandwich Composites”
Analysis ofImpact
Behaviour
Conclusions 5.0
Evolution of design criteria of sandwich panels
Introduction, Literature survey & Problem definition 1.0 &2.0
4.1Analysis of
StaticBehaviour
4.2
Correlation between cell size and coredensity, elastic constants,
compressive strength, shear strength,stiffness, of Sandwich panels
4.3Analysis ofvibrationBehaviour
Correlation between cellsize and low velocityimpact strength ofSandwich panels
Correlation between cell sizeand Modal parameters ofSandwich panels under
different boundary conditions
matrix material. The core material having regular hexagonal cell
configuration (with four different cell sizes of 8, 16, 20 and 25mm) was used
in the fabrication of the composite.
Figure 3.1 Flow chart of the research work

68
The physical and mechanical properties of the facesheets have been
determined as per the appropriate ASTM standards. To assess the static
behaviour of the sandwich panels compression, Flexural 3-Point and 4-Point
tests have been carried out as per the guidelines of the ASTM standard to
determine the elastic constants of the core, such as the compression and shear
modulus, as well as on the compression and shear strength of the core. To
assess the low velocity impact behavior of the sandwich panels under falling
weight, impact tests have been carried out at different incident energy levels.
To assess the dynamic behaviour of the sandwich panels, experimental modal
analyses under different constraint conditions have been carried out. The
details of the tests are provided in the respective sub-sections. Figure 3.1
shows the flow chart of the research work carried out.
3.3 DEVELOPMENT OF THE SANDWICH COMPOSITE
The fabrication is carried out through the vacuum bag molding
technique, in which the refinement of the hand lay-up, uses the vacuum to
eliminate the entrapped air and excess resin. The process flow chart for the
manufacturing of FRP composites is shown in Figure 3.2. The Vacuum bag
hand lay-up process offers many benefits, when compared to the conventional
hand lay-up techniques. As it is a closed molding process, it virtually
eliminates potentially harmful volatile organic compound (VOC) emissions. It
also allows unlimited set-up time, because the resin system is not introduced
until all the reinforcements and core materials are in place. This method is of
particular benefit, when producing large facings, due to the weight savings
that can be gained, greater structural strength and efficiency gains against the
Hand Lay-up process. The vacuum system also facilitates good resin
distribution and consolidation of layers of the laminate. As a result, the
resulting mechanical properties of the Facings are likely to be markedly

69
higher, than would be the case with hand laminating (Malin Akermo et al
1999).
Figure 3.2 Process flow chart for the manufacturing of sandwich
composites
3.3.1 Manufacture of face sheet
Bi-woven glass ‘E’ cloth, which is commercially available is used
for making the face sheet and is shown in Figure 3.3. The cloth ply was
trimmed to the correct size and impregnated in an adhesive made from a
mixture of LY556 epoxy resin and HY 951 hardener, mixed in the ratio of
100:10. The ply was stacked in 0 /90 orientation and was built to a thickness
of around 2.0 mm. The Vacuum hand lay – up technique was used to make
the facings and is shown in Figure 3.4. A Vacuum level of 450Hg/mm² is
maintained for 1 hour to avoid surface undulations and also to avoid air
pockets at the interface. The coupons were allowed to cure for about 24 hours
EpoxyE-glassfabric
Lamination of facesheet and core by wet
lay up
Vacuum Bagging
Curing
(1 day at roomtemperature)
Post Curing
(2 hours at 100oC)
Core (8, 16, 20 &25mm)

70
at room temperature. The glass and resin content in the Facings was
respectively around 61.5 % and 38.5 %.
Figure 3.3 Bi-woven glass ‘E’ fabric
Figure 3.4 Manufacture of Face sheet using Vacuum hand lay-up technique
3.3.2 Manufacture of Honeycomb core
For the manufacturing of the honeycomb core the matrix used is
epoxy resin LY 556 mixed with a hardener HY 951 and the reinforcement is
glass ‘E’ fabric. The resin and hardener are mixed in the weight ratio of 10:1.

71
To maintain the optimum strength, the resin glass ratio is found to be 35:65.
The molding tool used is hexagonally machined split molding tool made of
chromium plated mild steel, and is shown in Figure 3.5 (a). After ensuring
that the surface is clean and free from foreign particles the application of
release agents is done.
(a) Split Moulding Tool (b) Wet laminate under load
(c) Half honeycomb core (d) Joining of two halves of the core
Figure 3.5 Fabrication of the honeycomb core

72
Figure 3.6 Honeycomb core
A coat of resin mixture is applied on the molding surface and the
plain weave glass ’E’ fabric is impregnated against the first half of the
molding tool surface, by ensuring a thorough wetting of the glass fabric. Then
the hexagonal mandrel is placed in the respective slots by pushing the glass
cloth downwards into the half hexagonal slot of the molding tool. The Load is
applied onto the wet laid-up laminate in order to improve its consolidation, as
shown in Figure 3.5 (b). This is achieved by sealing the wet laid up laminate
with a Peel-ply, perforated plastic film, and placing the breather over the
perforated plastic film. Above this, a bag with a Vacuum Valve (returnable) is
placed and sealed, which constitutes the vacuum bagging process. At one
corner of the bag a port for the vacuum is arranged and subjected to 450-500
Hg/mm2 of pressure for 120 minutes to consolidate and to increase the inter
laminar shear strength of the layers. After ambient curing, the laminate which
takes the shape of half-hexagon as shown in Figure 3.5 (c) is taken from the
molding tool, and a similar fabrication of the second half is done. The two
halves are joined together by placing the epoxy resin putty on the contact
surface, and allowing it to dry as shown in Figure 3.5 (d). Then it is cut to the
required thickness to form the hexagonal honeycomb core. Figure 3.6 shows
the honeycomb core.
73
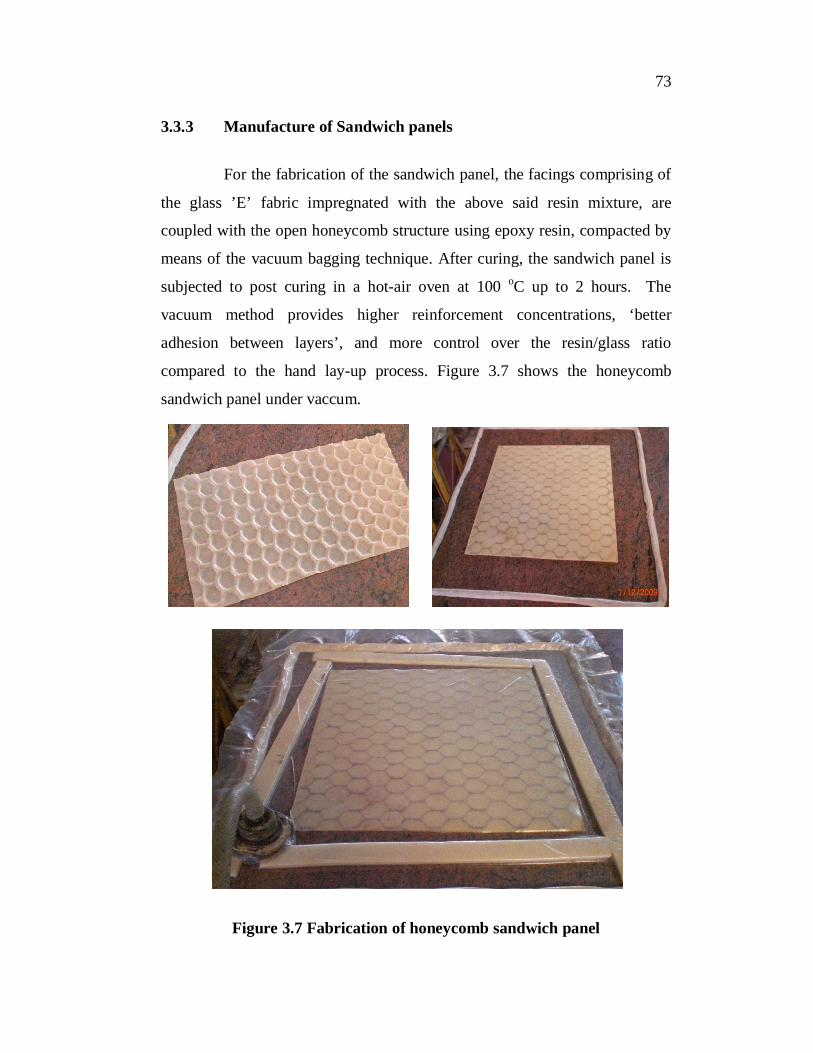
3.3.3 Manufacture of Sandwich panels
For the fabrication of the sandwich panel, the facings comprising of
the glass ’E’ fabric impregnated with the above said resin mixture, are
coupled with the open honeycomb structure using epoxy resin, compacted by
means of the vacuum bagging technique. After curing, the sandwich panel is
subjected to post curing in a hot-air oven at 100 oC up to 2 hours. The
vacuum method provides higher reinforcement concentrations, ‘better
adhesion between layers’, and more control over the resin/glass ratio
compared to the hand lay-up process. Figure 3.7 shows the honeycomb
sandwich panel under vaccum.
Figure 3.7 Fabrication of honeycomb sandwich panel

74
Four types of sandwich panels of size 500 x 500mm are fabricated
with different cell sizes, i.e., 8, 12, 16 and 20 mm. The cell shape of the
honeycomb core is a regular hexagon. The membrane wall thickness of the
core is 0.2 mm and the height of the core is fixed at 8 mm. The thickness of
the top and bottom face sheets has been kept constant at 1 mm
The cell sizes were selected, based on the ease of manufacture and
testing requirements, stipulated by the relevant standards. A Cell size below 8
mm is extremely difficult, because the FRP sheets cannot be bent around the
mould. A Panel with a cell size higher than 25 mm poses severe restrictions
on flexural testing, as the width of the specimens become too unwieldy.
3.4 CHARACTERIZATION OF THE FACE SHEET
A thorough understanding of the physical and mechanical properties
of a material is paramount to determine whether the material is suitable for a
specific application. Hence, the face sheet must be characterized and
understood to determine how the selected material caters to the manufacturing
of the sandwich panels. The physical and mechanical characteristics of the
face sheet used for the fabrication of the sandwich panels are tested as per the
ASTM standards.
3.4.1 Tensile test
A Tensile test was conducted on the face sheet to determine the
tensile strength and modulus of the composite face sheets, as per the ASTM D
3039M-08. The Test specimens were sectioned from the composite panels
with the width of 25 mm, thickness of 2 mm and length of 220 mm. The Test
specimens were bonded with composite tabs of 4” in length at both the ends.
The tabs distribute the gripping stresses and prevent specimen failure caused
by grip jaws. As the face sheet exhibits a similar behaviour for 0° and 90°

75
directions, only one direction is tested. The specimens were tested using the
universal test machine (Shimadzu) as shown in Figure 3.8. The test were
conducted at a cross head speed of 2 mm/min.
Figure 3.8 Tensile test setup for face sheet
The tensile strength ( uts) was calculated by using the Equation 3.1.
uts = F/A (3.1)
where F is the breaking load in N and A is the cross sectional area of the
specimen in mm2.
3.4.2 Compression test
The Compression test method, according to ASTM D3410M-03 was
used to measure the compressive strength and modulus values of the
composite face sheet panels. For this purpose, compression test specimens

76
were cut from larger face sheet panels and tests along the ply-layup directions
were performed using the universal test machine (Shimadzu) at a crosshead
speed of 1.3 mm/min. The compressive stress was calculated by dividing the
load with the cross-sectional area of the specimens. The modulus was
estimated from the slope of the stress - strain curve.
3.4.3 Flexural test
The flexural test method according to the ASTM D790-10 was used
to determine the flexural strength and modulus of the composites. For this
purpose, test specimens 20 mm in width, 2 mm in height and 160 mm in
length, were sectioned from the face sheet panels using a diamond saw.
Specimens were tested in a 3-point bending apparatus under loading, both in
the longitudinal and tranverse directions of the fibers. The composite face
sheets were tested using the Schimadzu universal test machine at a crosshead
speed of 1.2 mm/min. During the test, the load versus central deflection was
recorded, and the slope P/ w and the elastic modulus were determined.
3.5 TESTING OF SANDWICH PANELS
While considering a sandwich construction for an application, care
must be given to the directional mechanical properties, and the design must
ensure that the best advantage of this attribute is incorporated. The biggest
advantage of a sandwich construction is that it possesses high stiffness at very
low weights. However, the stiffness behavior must be thoroughly understood,
so as to make a comprehensive computation of the deflection arising out of
the shear deflection because of low core densities as well as bending
deflection.
The panel can fail in any one of several different ways, depending
upon the geometric and fabrication characteristics of the panel, and how it is

77
loaded. For example, a face sheet can fail in tension, compression, shear or
local buckling. Additionally, the core can fail in shear or by crushing. A face
sheet can separate from the core due to excessive shear or normal tensile
stress in the adhesive bond. Test methods have been developed to isolate and
simulate each of these specific failure modes.
3.5.1 Flexural test of Sandwich panels
Flexural tests were carried out as per the ASTM C393M-06, to
characterize the flexural properties of the sandwich composites. In accordance
with this standard, a series of 3-point bending, 4-point bending and short
beam shear strength (SBSS) tests are conducted. The three, four bending and
SBSS bending test setups are shown in Figures 3.9 a, b, c. This test method
was used to determine the flexural stiffness parameter (D), the core shear
modulus (G) and the core shear strength ( core ). The load-displacement
curves were plotted for all the test conditions. The SBSS test setup is similar
to the 3-point bend test except the use of specimen span length. The Test
parameters for the flexural testing of the sandwich composite specimens are
given in Table 3.1.
Table 3.1 Test parameters for the flexural testing of the sandwich
composite specimens
Type of bending test Span length
(mm)
Width
(mm)
Thickness
(mm)
Three-point 500 50 10
Four-point 500 50 10
SBSS 160 50 10

78
Figure 3.9 Flexural test setup for (a) Three-point bending (b) Four-
point bending (c) SBSS test
By means of the flexure test, load can be applied to the specimen to
produce constant or variable bending moments, and constant or variable
shears. The concentrated load for all the specimens is applied by the movable
cross head, gradually at the cross head displacement rate of 2 mm/min. The
load is applied on the specimen till fracture and the maximum load at fracture
(a) (b)
(c)

79
has been recorded for each case. Load - deflection curves are also recorded
using a deflectometer placed at the mid-span length of the specimen. The
slope of the load versus deflection curve is determined for each specimen.
The following equations are used from the ASTM standard C393M-06 to
compute ‘D’ and ‘G’.
For a point load at the mid-span of a simply supported beam, the
overall deflection including bending and shear is:
3 2 21 1 2 1
1 1 1 2 2 2 1
P L 1- 11L /8LD =
48 1- 2P L /P L (3.2)
2 21 1 1 2
2 3 31 1 1 2 2 2 1
P L c 8L /11L -1G =
b d+c 16PL /11P L -1 (3.3)
where,
P1 1 - slope of the load – deflection curve in three point
bending
P2 2 - slope of the load – deflection curve in four point bending
L1 - span length in three point bending test (160 mm)
L2 - span length in four point bending test (200 mm)
The shear strength of the core( core ) and the bending stress ( facing )
of the face sheet are computed using the equation (3.4).
core facingP PL= ; =
2bc 2t d+c b (3.4)

80
3.5.2 Flatwise compressive test of Sandwich core
Flatwise compression tests of sandwich panels are conducted in
accordance with the ASTM C365M-11 standard to determine the f latwise
compressive strength and modulus. In order to prevent local crushing at the
edges of the honeycomb cores, the edges were stabilized with thin facings, so
that the load which causes failure in the core does not cause any damage to
the facings. The Setup used for compression tests is shown in Figure 3.10.
Figure 3.10 Flatwise compression test setup loaded with specimen
A constant crosshead movement rate is maintained at 0.5 mm/min,
as suggested by the ASTM standard. Specimens in this study have the
dimensions of 50×50×10 mm for length, width and height respectively, in
accordance with the ASTM C365M-11. The Load-displacement data is
obtained from the tests, and is used to carry out the calculations for the
modulus and compressive strength.

81
coreP
Face sheet area (3.5)
p cEb L
(3.6)
Where, C is the core height in mm and b x L is the area of the face
sheet in mm2.
3.5.3 Low velocity impact test of the Sandwich panel
Low-velocity impact tests were carried out at different energy levels
on honeycomb sandwich panels, using an instrumented falling weight
apparatus to obtain information about the absorbed energy and maximum
impact force. Indigenously developed instrumented low velocity impact test
equipment was employed to perform the non-penetrating impact test. The
maximum impact energy is limited by suitably adjusting the falling height and
mass. The mass together with the height of the drop determines the energy of
the impact. With an increase in the mass and height of the fall, the potential
energy is converted to kinetic energy. The Instrumented falling weight impact
testing machine is shown in Figure 3.11 (a).
In accordance with the ASTM D3029-95 the impact test is
performed by sticking the specimen at the centre by a flat square dart. The
square dart is made of mild steel, and sized 25mm × 25mm. Figure 3.11 (b)
shows the specimen clamping apparatus having a fixture with a square slot of
100mm. This is specifically designed in order to assure the consistency of the
clamping force through the pre-loading of the four helical springs. The

82
vertical guides of the impact are power lubricated frequently to minimize any
friction generated during the descent of the impactor.
This machine is capable of impacting samples at energies of up to
140J. For this test, samples of the size 150×150×10 mm were impacted. Table
3.2 lists the impact test parameters which give the range of the drop height
and impact mass to achieve the required impact energy. An inbuilt data
acquisition system along with an impact software was used to monitor the
position and acceleration of the impactor. The incident energy is calculated
based on the height history, while the dissipation of energy was derived from
both the acceleration and height histories of the impactor, assuming rigid
body motion. Tests were conducted under different impact energies, ranging
from 7 to 50 J.
Table 3.2 Impact Test Parameters
S.No Drop height mm Drop mass kg Impact energy J
1 500 2.576 12.64
2 1000 2.576 25.27
3 750 5.116 37.64
4 1000 5.166 50.19

83
(a) Instrumented falling weight impact testing machine
(b) Specimen Clamping Fixture
Figure 3.11 Low velocity impact test setup

84
3.5.4 Vibration testing of the Sandwich panel
The vibrational characteristics of the specimens are obtained by
studying their impulse response. Assessing the modal characteristics of
sandwich panels is very essential for design and manufacturing. The tests are
carried out for two boundary conditions C-F-F-F (One end Clamped) and C-
F-C-F (Two ends Clamped). In the cantilever (C-F-F-F) analysis, the
honeycomb sandwich panel is clamped at one end using a suitable fixture, and
the impact test is carried out. The accelerometer is placed at one of the corner
nodes, while the hammer is made to impact at multiple nodes. For the Fixed-
Fixed (C-F-C-F) analysis, the honeycomb sandwich panel is clamped at two
opposite ends using a suitable fixture, and the impact test is carried out. The
accelerometer is placed at one of the corner nodes, while the hammer is made
to impact at multiple nodes. The traditional “strike method” is used to
measure the vibration properties. The modal test setup is shown in
Figure 3.12.
Figure 3.12 Modal test setup

85
The specimens are subjected to impulses through a hard tipped
hammer which is provided with a force transducer with a sensitivity of
2.25mV/N and the response is measured through the accelerometer with a
sensitivity of 10 mV/g. The hammer consists of an integral ICP quartz force
sensor mounted on the striking end of the hammer head. The striking end of
the hammer has a threaded hole for the installation of a variety of impact tips.
The tip functions to transfer the force of the impact to the sensor and protects
the sensor face from damage.
The impulse and the response are processed on a computer aided
fast fourier transformer (FFT) analyzer test system (LMS Inc.) in order to
extract the modal parameters with the help of built in software
(SMARTOFFICE). The types of specimens investigated in this study are in
the form of plates. The specimens are cut with a nominal length of 170 mm,
breadth of 150 mm and thickness of 10mm. In the total length of 170mm,
20mm were used for fixing the specimen to obtain a cantilever condition, thus
maintaining the effective test dimension as 150 x 150 mm, as shown in
Figure 3.13 a. Similarly, another specimen was prepared for the C-F-C-F
condition, and is shown in Figure 3.13 b. The sandwich specimen is subjected
to impulses at 25 station locations. The frequency response curves are
obtained for various grid points located on the specimen.

86
(a) C-F-F-F condition
(b) C-F-C-F Condition
Figure 3.13 Specimens attached to the fixture for simulating the C-F-F-
F and C-F-C-F condition

87
The FFT spectrum analyzer samples the time varying input signal,
computes the magnitude of its sine and cosine components, and displays the
spectrum of these measured frequency components. The FFT analyzer used
consisted of 8 channels for input and output which helps to plot the spectrum
with a linear, logarithmic, or dB amplitude scale and a linear or logarithmic
frequency scale. The FFT analyzer also helps in obtaining the frequency
response function (FRF), through which the dynamic behaviour of a structure
is determined. The Frequency Response Function (FRF) is a fundamental
measurement that isolates the inherent dynamic properties of a mechanical
structure. Experimental modal parameters (frequency, damping, and mode
shape) are also obtained from a set of FRF measurements. FRF is defined as
the ratio of the Fourier transform of an output response (X (w)) divided by the
Fourier transform of the input force (F (w)) that caused the output.