chapter 3 experimental study of a chiller...
TRANSCRIPT

27
CHAPTER 3
EXPERIMENTAL STUDY OF A CHILLER UNIT
INTEGRATED WITH COOL THERMAL ENERGY
STORAGE SYSTEM
An experimental investigation to study the performance of a chiller
unit integrated with encapsulated phase change material (PCM)-based cool
thermal energy storage is carried out. A series of charging experiments are
conducted to evaluate the performance of chiller unit integrated with/without
storage system. The experimental set-up and the performance results are
reported in this chapter.
3.1 EXPERIMENTAL SET-UP
A schematic diagram of the experimental apparatus designed and
constructed is shown in Figure 3.1 and the photographic view is shown in
Figure 3.2. The experimental set-up consists of two parts, cool thermal energy
storage tank and a vapour compression refrigeration system. A vertical
storage tank is integrated with the evaporator of the vapour compression
refrigeration system. The evaporator coils are designed in such a way that
they are completely immersed in the heat transfer fluid. The heat transfer fluid
returning from the storage tank is made to fall on the evaporator by using a
distribution pipe. In the evaporator, cold energy is transferred to the heat
transfer fluid and a temperature controller is attached to it, which can
maintain the evaporator tank temperature at any desired constant temperature
between 0ºC to – 20°C during the charging process. The evaporator tank is

28
V1
V2
5
7
8
T
P
F
1
A
P P
T
M
TC
T
4
3
6
V3
P
2
T P
Figure 3.1 Schematic diagram of experimental set-up
1. Compressor, 2. Condenser, 3. Expansion valve, 4. Evaporator tank, 5. Vertical
CTES tank, 6. Rotameter, 7. Data acquisition system, 8. Personalcomputer,
A-Accumulator, M-Fan motor, F-Filter and drier, T-Temperature measurement,
P-Pressure measurement, TC-Temperature controller, P-Pump, V1, V2,
V3-Valves
insulated with polyurethane foams (PUF) of 50 mm thickness. An aqueous
solution of 30 wt. % ethylene glycol is used as the heat transfer fluid and
R134a is used as a refrigerant. The main components of chiller unit are shown
in Figure 3.3 and the properties of R134a are given in Table 3.1. A cylindrical
storage tank with a diameter of 240 mm and 500 mm length, made of 3 mm
thick stainless steel plate with a design pressure of 5 bar installed in a vertical
manner is shown in Figure 3.4.

29
Figure 3.2 Photographic view of the experimental set-up
1. Chiller unit, 2. Vertical storage tank, 3. Horizontal storage tank,
4. Flow meter, 5. Acrylic tank, 6. Energy meters, 7. Electric heater,
8. Data acquisition and control system, 9. Pentium-4 PC

30
Figure 3.3 Photographic view of chiller unit
1. Evaporator tank, 2. Condenser, 3. R134a – compressor,
4. Thermostatic expansion valve, 5. HTF circulation pump

31
Figure 3.4 Sectional views of CTES tank
HTF Inlet T(in)
HTF Outlet T(out)
Out
let f
or
ther
moc
oupl
e
A A’
PCM
fille
d no
dule
s
Fixt
ure
for
ther
moc
oupl
es
TP5
TP3
TP1
T5
T3
T4
T2
T1
T10 T11
T9 T8
T6 T7
T7
T6
T11
T10 T9 T8
Section at A – A’
1 6 7f1
3 8 9f3
5 10 11f5
T +T +TT =3
T +T +TT =3
T +T +TT =3

32
The tank is provided with an upper opening for loading and
unloading the PCM spherical capsules. The tank is insulated with
polyurethane foam of 50 mm thickness. The phase change material is filled in
the spherical capsules of 48 mm diameter. The PCM capsules are made of
high density polyethylene material. The maximum number of spherical
capsules in the tank is 250. The PCM inside each capsule is 50 g of distilled
water with heterogeneous nucleation agents. Adding nucleation agents
initiates the freezing of water at its melting temperature. The PCM capsules
are filled with 90% volume to prevent the capsules from cracking due to
thermal expansion during the phase change process. The process of filling of
PCM capsules are shown in Figures 3.5 and 3.6. The thermo physical
properties of HTF and PCM are given in Table 3.2.
Table 3.1 Properties of R134a (CF3CH2F)
Mol. Wt.
Cr.Temp. ºC Boil. Point (at 1 bar)
Density kg/m3 (at -25ºC)
ODP GWP
102.3 101.1 -26.16 5.50(v)
1371.0(l) 0 0.27
Table 3.2 Thermo physical properties of HTF (30 wt.% Ethylene
glycol) and PCM (water)
Properties HTF PCM
Density (kg m-3) 1056 1000 (l), 920 (s)
Specific heat (kJkg-1 K-1) 3.65 4.186 (l), 2.01 (s)
Thermal conductivity (Wm-1 K-1) 0.485 0.566 (l), 2.22 (s)
Freezing point (ºC) -17.8 0
Latent heat (kJkg-1) - 333.6

33
Figure 3.5 Photographic view of drilling in spherical capsules 1. Polyethylene spherical capsule, 2. Micro drilling machine, 3. 1.5 mm drill pit
Figure 3.6 Photographic view of filling the PCM in capsules
1. Distilled water with bio-additive, 2. Filled PCM capsule

34
In the top and bottom of the cylindrical storage tank, perforated
distributor plates are provided to achieve uniform flow distribution. A
rotameter with an accuracy ± 0.5% is installed in the flow line between the
evaporator and storage tank to measure the flow rate of the aqueous ethylene
glycol. In the refrigeration circuit six RTD (PT100) sensors with ± 0.5°C
accuracy were fixed to measure the temperature at various points. Pressure
gauges with ± 0.25 % accuracy were also provided suitably. The locations of
temperature and pressure measurement are shown in Figure 3.1. To measure
the compressor and heater power input two energy metres are provided. The
temperature of the HTF and the PCM temperature are measured using k-type
thermocouples (with 1.5 mm OD). Five thermocouples are positioned axially
with 100 mm interval and six of them are positioned at radial location and an
interval of 60 mm. A fixture has been provided at the centre to hold the
thermocouples in position. Three thermocouples inserted into the spherical
capsules measure the temperatures of PCM. Also two thermocouples are
provided at inlet and outlet to measure the temperature of the HTF entering
and leaving the storage tank. All the thermocouples and RTDs are connected
with a data acquisition system (AI 8000+). The data acquisition and control
system and a personal computer (Pentium 4) are used for data recording and
storage.
3.2 EXPERIMENTS
A series of charging experiments are performed by varying the
HTF inlet at various temperatures between -2ºC and -15°C. The temperature
of the refrigerant in the chiller circuit at various locations, the temperature of
the HTF in the storage tank and PCM inside the spherical capsules are
recorded continuously using data acquisition system. The charging process
ends when the outlet temperature of HTF approaches nearly equal to the inlet
HTF temperature. The inlet and outlet pressures of the compressor and
35
evaporator are recorded continuously with 10 minutes interval during the
experimentation. The energy metre initial and final readings are noted to
calculate the cumulative energy used during the charging process. The
experiments are repeated for various condensing temperatures and also
varying the porosity at three different values (ε = 36%, 49% and 61%). The
porosity signifies the volume fraction of the HTF in the storage tank. In order
to evaluate the energy loss from the insulated cylindrical cool storage tank to
the surrounding, the overall heat loss coefficient is evaluated through the heat
gain experiment.
3.3 EVALUATION OF OVERALL HEAT LOSS COEFFICIENT
In order to evaluate the energy loss from the insulated cylindrical cool
storage tank to the surrounding, the overall heat loss coefficient is evaluated
through the following heat gain experiment. The average temperature of the
heat transfer fluid in the storage tank is maintained initially at -10 ºC. The
HTF temperature increases with respect to time due to the influence of higher
surrounding temperature. The temperature of heat transfer fluid inside the
storage tank and room temperature are recorded continuously. The final
temperature of HTF is noted after ten hours to evaluate the overall heat loss
coefficient. Figure 3.7 shows the temperature variation of HTF and room
temperature for ten hours.
The average overall heat transfer coefficient of the surface of the
storage tank can be determined as
( )st f fdTUA LMTD m cdt
(3.1)

36
0 100 200 300 400 500 600
-10
-9
-8
-7
-6
-5
-4
-3
-2
-1
0
Time in minutes
HTF
Tem
pera
ture
o C
HTF temp.
0
5
10
15
20
25
30
35
Roo
m te
mp.
o C
Room temp.
where ( ) ( )
ln
fi sur f sur
fi sur
f sur
T T T TLMTD
T TT T
(3.2)
where Tfi denotes the average initial temperature of HTF, Tsur is the
surrounding temperature and Tf is the final HTF temperature. From the
experiment it is evaluated that the average overall heat loss coefficient (U) of
the cylindrical storage tank with the surrounding is 0.5978 W/m2°C.
Figure 3.7 Variation of temperature with time during heat gain
experiment

37
The maximum cool energy stored Qmax, in the cool thermal energy
storage (CTES) tank can be expressed as the sum of the energy storage in the
HTF and PCM capsules.
max HTF PCMQ Q Q (3.3)
The cold energy stored in the heat transfer fluid is given by
( )HTF f f i fQ m c T T (3.4)
The cold energy stored in the spherical capsules is given by
[ ( 0 ) (0 ) ]PCM P P i PS fQ m c T c T (3.5)
where Ti denotes the initial temperature and Tf denotes the final temperature
during charging process, mf is the mass of heat transfer fluid, mP the total
mass of the PCM inside spherical capsules, cf is the specific heat of heat
transfer fluid, cP, cPS are the specific heat of phase change material at liquid
and solid state respectively and λ is the latent heat of freezing of phase change
material.
3.4 PERFORMANCE EVALUATION PARAMETER
The specific energy consumption (SEC) of the chiller unit with and
without storage system defined as below is used as a parameter for evaluation.
.
max
( / )( )
3.52
Compwithout storage
st
PSEC kW TR
Q UA Tt
(3.6)
38
The compressor power (PComp) is the ratio of total electrical energy consumed
during charging process in kWh to the time for complete charging (Δt) in
second. The overall heat loss coefficient (U) of the storage tank and Qmax are
calculated using the equation (3.1) and (3.3).
max
( / )
3.52
Comp pumpwith storage
P PSEC kW TR
Qt
(3.7)
where Ppump is the power utilized to circulate the HTF between the evaporator
and the storage tank during the charging process.
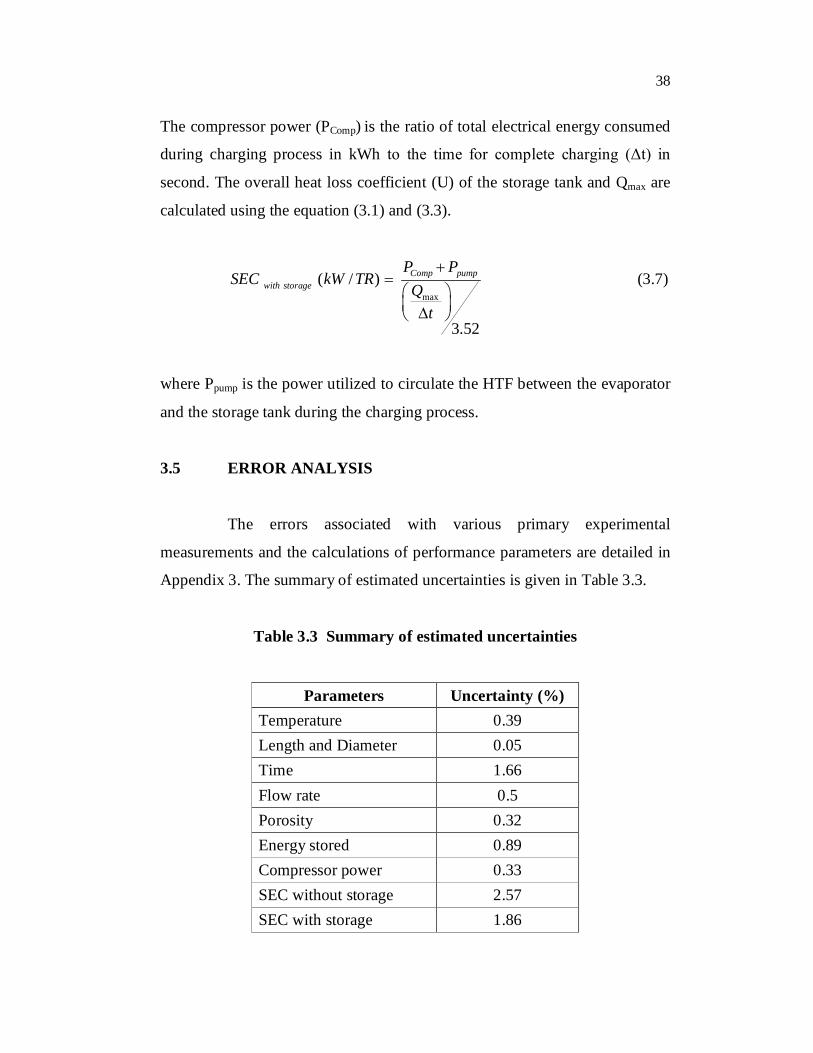
3.5 ERROR ANALYSIS
The errors associated with various primary experimental
measurements and the calculations of performance parameters are detailed in
Appendix 3. The summary of estimated uncertainties is given in Table 3.3.
Table 3.3 Summary of estimated uncertainties
Parameters Uncertainty (%) Temperature 0.39 Length and Diameter 0.05 Time 1.66 Flow rate 0.5 Porosity 0.32 Energy stored 0.89 Compressor power 0.33 SEC without storage 2.57 SEC with storage 1.86
39
3.6 RESULTS AND DISCUSSION
The experimental results showing the effect of the inlet temperature
of heat transfer fluid and the performance parameters, namely, average rate of
charging, energy stored, specific energy consumption of the chiller with and
without storage system are reported in this section.
3.6.1 Effect of HTF inlet temperature
The results obtained from experimental investigation for various
inlet heat transfer fluid temperature under different condenser temperature are
presented to analyze the performance of the integration of cool thermal
storage system with the refrigeration system. The temperature histories of the
HTF and PCM in the storage tank for various HTF inlet temperatures with a
mass flow rate of 12 kg/min are studied and discussed. In all the figures the
temperature of heat transfer fluid and the phase change material are shown for
three different axial locations (bottom, centre and top) of the storage tank.
Figures 3.8 and 3.9 correspond to HTF and PCM temperatures for a HTF inlet
temperature of –2°C. Similarly figures are also drawn for HTF inlet
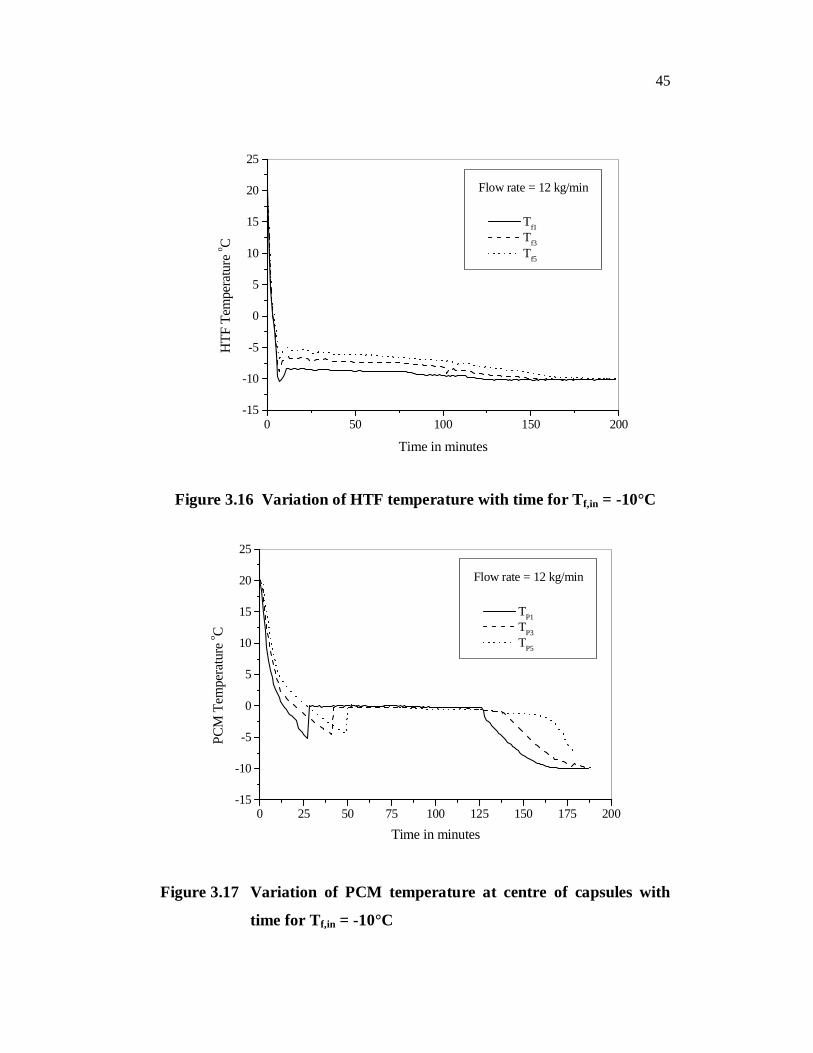
temperatures of -3, -5, -8 and -10°C respectively in Figures 3.10 to 3.17.
It is seen from Figures 3.8 and 3.9 that both the HTF and PCM
have reached the thermal equilibrium within a short period. The small
temperature gradient between the HTF and PCM is not sufficient for the
occurrence of ice nucleation and hence freezing does not occur and only
sensible cool energy is stored in the storage system. When the HTF inlet
temperature is maintained at -3°C (Figure 3.11) the PCM temperature has
reached nearly -3°C after 50 minutes and remains in the sub-cooled state for a
long period of time. After 200 minutes the freezing has been initiated in the
PCM capsules at the bottom portion of the tank. Suddenly the temperature of

40
the PCM is increased to its freezing temperature as the sub-cooled energy
available in the PCM capsules are used for the initial dendritic ice formation.
The freezing continues by rejecting its latent heat to the surrounding HTF at a
very low rate as the temperature potential difference available between HTF
and PCM is very low. The freezing has been initiated in the middle portion of
the tank only after 330 minutes and it is not initiated in the top portion of the
tank even after 400 minutes where the experimental trial is stopped.
When the HTF inlet temperature is maintained at -5°C
(Figures 3.12 and 3.13) both the HTF and PCM temperature in the storage
tank are brought down below 0°C (freezing temperature of the PCM) within a
short period of time. A short duration after the start of the process, a small
increase in temperature is observed in the HTF in the bottom portion of the
storage tank (Figure 3.12). This is due to sudden large heat removal from the
PCM as the freezing is initiated in the inner surface of the PCM capsules with
high temperature gradient. As the HTF temperature increases the temperature
gradient between the PCM and HTF decreases and the HTF in the bottom
portion of the storage tank attains an equilibrium condition after a small time
interval i.e., the heat absorbed from the PCM and the cool energy absorbed
from the incoming HTF are maintained at a constant level (Figure 3.13). A
sudden increase in temperature of the PCM is also observed when the freezing
is initiated by dendritic ice formation at 60 minutes, 90 minutes and 125
minutes respectively at bottom, centre and top portion of the storage tank. The
freezing process continues at constant temperature till the PCM rejects its
total latent heat. Then the PCM temperature decreases till it attains
equilibrium with the HTF inlet temperature. Similar trends are observed when
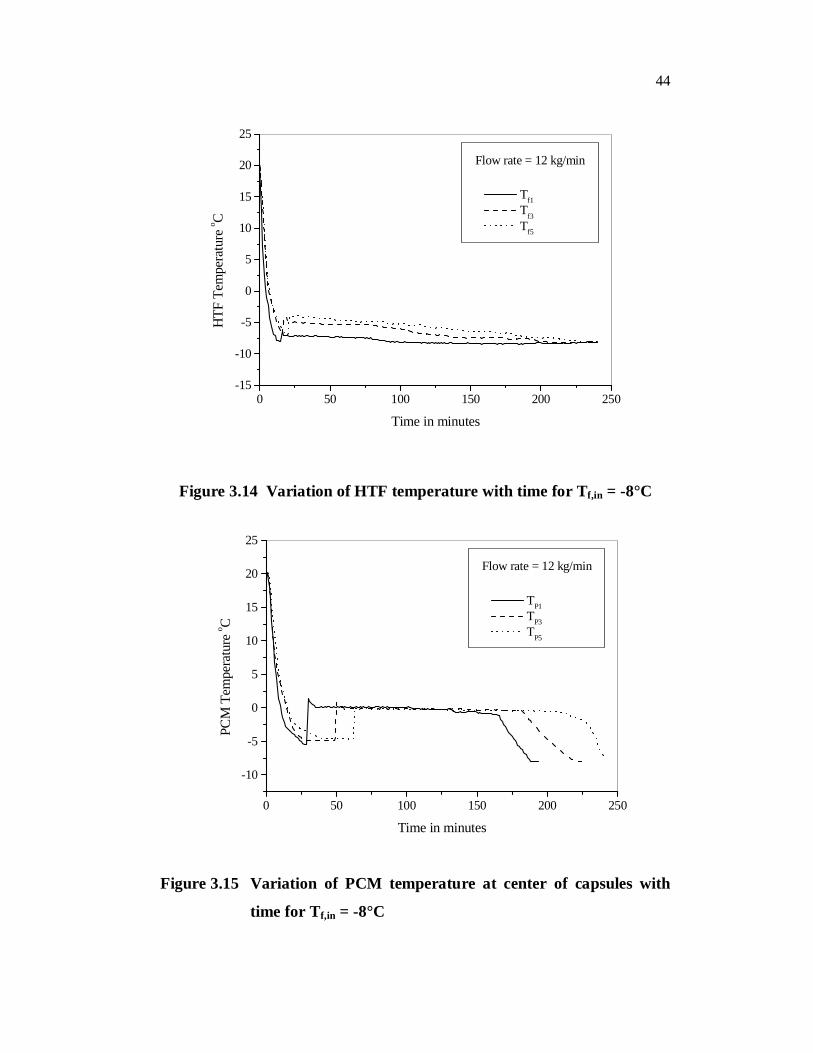
the HTF inlet temperatures are maintained at -8 and -10°C (Figures 3.14
to 3.17). The complete freezing time for the HTF inlet temperatures of -5°C,
-8°C and -10°C are approximately 425, 250 and 190 minutes respectively.

41
0 50 100 150 200 250 300 350 400 450 500-15
-10
-5
0
5
10
15
20
25
Flow rate = 12 kg/min
Tf1 Tf3 Tf5
HTF
Tem
pera
ture
o C
Time in minutes
0 50 100 150 200 250 300 350 400 450 500-15
-10
-5
0
5
10
15
20
25
Flow rate = 12 kg/min
TP1 TP3 TP5
PCM
Tem
pera
ture
o C
Time in min
Figure 3.8 Variation of HTF temperature with time for Tf,in = -2°C
Figure 3.9 Variation of PCM temperature at centre of capsules with
time for Tf,in = -2°C

42
0 50 100 150 200 250 300 350 400-15
-10
-5
0
5
10
15
20
25
Flow rate = 12 kg/min
Tf1 Tf3 Tf5
HTF
Tem
pera
ture
o C
Time in minutes
0 50 100 150 200 250 300 350 400-15
-10
-5
0
5
10
15
20
25
Flow rate = 12 kg/min
TP1 TP3 TP5
PCM
Tem
pera
ture
o C
Time in minutes
Figure 3.10 Variation of HTF temperature with time for Tf,in = -3°C
Figure 3.11 Variation of PCM temperature at centre of capsules with
time for Tf,in = -3°C

43
0 50 100 150 200 250 300 350 400 450 500-15
-10
-5
0
5
10
15
20
25
Flow rate = 12 kg/min
Tf1 Tf3 Tf5
HTF
Tem
pera
ture
o C
Time in minutes
0 50 100 150 200 250 300 350 400 450-15
-10
-5
0
5
10
15
20
25
Flow rate = 12 kg/min
TP1 TP3 TP5
PCM
Tem
pera
ture
o C
Time in min
Figure 3.12 Variation of HTF temperature with time for Tf,in = -5°C
Figure 3.13 Variation of PCM temperature at center of capsules with
time for Tf,in = -5°C
44
0 50 100 150 200 250-15
-10
-5
0
5
10
15
20
25
Flow rate = 12 kg/min
Tf1 Tf3 Tf5
HTF
Tem
pera
ture
o C
Time in minutes
0 50 100 150 200 250
-10
-5
0
5
10
15
20
25
Flow rate = 12 kg/min
TP1 TP3 TP5
PCM
Tem
pera
ture
o C
Time in minutes
Figure 3.14 Variation of HTF temperature with time for Tf,in = -8°C
Figure 3.15 Variation of PCM temperature at center of capsules with
time for Tf,in = -8°C
45
0 50 100 150 200-15
-10
-5
0
5
10
15
20
25
Flow rate = 12 kg/min
Tf1 Tf3 Tf5
HTF
Tem
pera
ture
o C
Time in minutes
0 25 50 75 100 125 150 175 200-15
-10
-5
0
5
10
15
20
25
Flow rate = 12 kg/min
TP1 TP3 TP5
PCM
Tem
pera
ture
o C
Time in minutes
Figure 3.16 Variation of HTF temperature with time for Tf,in = -10°C
Figure 3.17 Variation of PCM temperature at centre of capsules with
time for Tf,in = -10°C

46
3.6.2 Energy stored in CTES at different HTF inlet temperature
Porosity determines the quantity of cool thermal energy that can be stored and it is varied by changing the number of PCM capsules in the storage tank. Figure 3.18 shows the variation of cool energy stored with time at
different inlet HTF temperature for porosity ε = 36% and .
m f = 12 kg/min.
The influence of inlet HTF temperature during charging on cool thermal energy storage has been studied by decreasing inlet HTF temperature from -2°C to -15°C without changing the flow rate and porosity. As in the case of -2°C, the energy is stored only in the form of sensible cooling in the HTF and
PCM. Therefore, the accumulated cool storage does not increase any more while it attains the maximum amount of sensible cooling (2082 kJ) within 150
min and remains constant. For -3°C the cool storage curve rises continuously even after 450 min which shows that the PCM capsules are undergoing the charging process. This is due to small temperature gradient between the HTF and freezing temperature of PCM is not sufficient for the heat flow for the
completion of freezing. For -5°C HTF inlet temperature, the charging has been completed at 450 min and maximum energy charged is about 7267 kJ.
The complete charging curve has two parts, the initial part with a large slope represents the sensible cooling and the later part with a small slope represents the latent cool storage and sensible cooling in frozen PCM. It is observed that when the inlet HTF temperature decreases the time required for complete
charging decreases as high thermal potential difference is available for the heat flow. The maximum cool energy stored for various HTF inlet temperatures of -8°C, -10°C and -15°C are approximately 7455 kJ, 7581 kJ and 7895 kJ respectively. The time for complete charging
with a HTF inlet temperature of -8°C, -10°C and -15°C are 350 min, 250 min and 200 min respectively. It is observed that when the HTF inlet temperature
is maintained below -5 ºC the charging time decreases and energy charged is slightly increased. However production of low temperature HTF is very expensive that reduces the COP of the refrigeration system.

47
0 50 100 150 200 250 300 350 400 4500
1x10³
2x10³
3x10³
4x10³
5x10³
6x10³
7x10³
8x10³
9x103
= 36%
Tf,inoC
-2 -3 -5 -8 -10 -15
Ene
rgy
stor
ed k
J
Time in minutes
Figure 3.18 Variation of cool energy stored with time at different inlet
HTF temperature for = 36%
Figures 3.19 and 3.20 show the variation of cool energy stored with
time at different inlet HTF temperature for ε = 49% and ε = 61% respectively.
It is observed from the figures that for -2°C, the energy is stored only as
sensible cooling even at higher porosities (49% and 61%) due to lower
thermal gradient between HTF and PCM capsules. It is seen from Figure 3.19
that when the HTF inlet temperature is maintained at -3°C, the maximum
possible energy (5760 kJ) is stored within 400 min and at 61% porosity
(Figure 3.20) charging has been completed at 375 min and maximum energy
stored is 5134 kJ. For -5°C, when porosity is increased from 36% to 49% and
61% the charging time is reduced by 22% and 29% respectively and energy
stored is decreased by 14% and 29% respectively. Similarly when the porosity
is increased from 49% to 61%, the time required for complete charging is
reduced to 12.55, 14.3% and 16.6% for HTF inlet temperature of
-8°C, -10°C and -15°C respectively. This is due to increase in porosity that

48
0 50 100 150 200 250 300 350 400 4500
1x10³
2x10³
3x10³
4x10³
5x10³
6x10³
7x10³
8x103 =49%
Tf,inoC
-2 -3 -5 -8 -10 -15
Ener
gy s
tore
d kJ
Time in minutes
0 50 100 150 200 250 300 350 400 4500
1x10³
2x10³
3x10³
4x10³
5x10³
6x10³
7x10³
8x103
= 61%
Tf,in oC
B C D E F G
Ene
rgy
stor
ed k
J
Time in minutes
Figure 3.19 Variation of cool energy stored with time at different inlet
HTF temperature for = 49%
Figure 3.20 Variation of cool energy stored with time at different inlet
HTF temperature for = 61%
49
would result in an increased HTF passage and lower mass of PCM capsules in
the entire storage tank. However, the higher porosity value decreases the
amount of energy stored for a given volume of storage tank and this causes to
increase the size of the storage tank.
3.6.3 Energy stored in PCM and HTF
Figure 3.21 shows the variation of energy stored in PCM and HTF
with HTF inlet temperature for different values of porosity. It is found that the
energy stored in HTF is gradually increasing with decrease in HTF inlet
temperature and the value is higher at higher porosity. When the HTF inlet
temperature is maintained above -3°C, the energy stored in PCM is very low
at all porosity values due to the absence of latent cool energy storage process.
However, when the HTF inlet temperature is maintained below -3ºC the
amount of energy stored in PCM is very considerable. It is also observed that
for the HTF inlet temperature of -5 to -15°C, the energy stored in the PCM
does not vary much as the amount of energy stored during sensible cooling in
solid PCM is negligible compared to the latent cooling process. Hence, for the
application where the requirement is above 0 °C, the HTF inlet temperature to
the storage system may be restricted around -4°C to avoid the high production
cost at lower temperature, which is again subjected to a constraint arising
from the heat exchange process. The amount of latent cool energy stored is
nearly 7, 5.5 and 4 times higher than the sensible heat stored for ε = 36%,
49% and 61% respectively for the HTF inlet temperature of -4°C. While
calculating the quantity of sensible cool energy stored a temperature gradient
of 20°C is considered.
In practical applications, since the actual temperature drop is much
less than 20°C, the ratio of useful latent cool energy stored to the useful
sensible cool energy stored will be much higher and hence the size of the

50
-15 -14 -13 -12 -11 -10 -9 -8 -7 -6 -5 -4 -3 -2 -1 00
1x10³
2x10³
3x10³
4x10³
5x10³
6x10³
7x10³
8x10³
9x10³ HTF PCM = 36% = 36% = 49% = 49% = 61% = 61%
Ener
gy st
ored
kJ
HTF Temperature oC
latent cool energy storage system requirement will be nearly 3 to 6 times less
than the chilled water storage system depending on the porosity and the
application.
Figure 3.21 Variation of energy stored in PCM and HTF with HTF inlet
temperature at different porosity
3.6.4 Average rate of charging and time for complete charging
Figure 3.22 shows the variation of average rate of charging and
time for complete charging with HTF inlet temperature for different porosity
values. It is observed that the average rate of charging increases when the
HTF inlet temperature decreases for all porosity values and it is higher for
higher porosity values. The time for complete charging decreases with
decrease in HTF inlet temperature for all porosity values and it is lesser for
higher porosity values. It is seen from the figure that the increase in rate of
charging or decrease in time for complete charging is higher as it decreases
from 0 to -8°C. Further reducing the HTF inlet temperature does not lead to

51
-15 -14 -13 -12 -11 -10 -9 -8 -7 -6 -5 -4 -3 -20.0
0.2
0.4
0.6
0.8
1.0
Temperarture oC
Rate
of C
harg
ing
kJ/s
ec
= 36% = 49% = 61%
0
100
200
300
400
500
600
700
Tim
e in
min
utes
= 36% = 49% = 61%
the corresponding increase in the rate of charging or decrease in time for
complete charging.
Hence for the application where the required heat transfer cannot be
achieved with the given surface area, the HTF inlet temperature can be
brought down to -8°C. Very low HTF inlet temperature is not augmenting the
heat transfer appreciably and also making the production cost very expensive.
It is also seen from the figure that the porosity has certain influence on the
rate of charging. At lower porosity value during the initial charging process,
the energy that is being absorbed by the PCM is more than that supplied from
the inlet to the storage tank. Hence the temperature of the HTF in the storage
tank increases and it reduces the temperature difference between the HTF and
the PCM, which in turn reduces the heat transfer.
Figure 3.22 Variation of average charging rate and time for complete
charging with HTF inlet temperature at different porosity
52
3.6.5 Specific energy consumption (SEC)
The variations of SEC with HTF inlet temperature for two different
condensing temperatures for the chiller unit with and without storage system
are shown in Figures 3.23 to 3.25 for porosities ε = 36%, 49% and 61%
respectively. It is seen from Figure 3.23 that the SEC of the chiller with and
without storage system increases with decrease in HTF inlet temperature and
it is higher at higher condensing temperature. While comparing the SEC of
the chiller unit with and without storage a 6% to 20% increase in SEC is
observed and this percentage increase is higher at higher HTF temperature. It
is due to the fact that when the HTF inlet temperature is high the time
duration for complete charging is higher that increases the heat loss from the
storage tank and the pumping power for the circulation of HTF. It is also
calculated from the results that 1°C decrease in HTF temperature increases
the SEC between 3% and 4% and 1 ºC increase in condensing temperature
increases the SEC between 2.75% to 3.25%. The above said trends are also
seen for other porosities shown in Figures 3.24 and 3.25. Further, it is seen
from the figures that when the porosity is decreased the SEC increases, which
is already explained in the previous section that the lower porosity decreases
the charging rate that in turn increases the SEC.

53
-15 -14 -13 -12 -11 -10 -9 -8 -7 -6 -5 -4 -3 -2 -11.0
1.5
2.0
2.5
3.0
3.5
4.0
without storage with storage
TC = 38 oC TC = 38 oC
TC = 54 oC TC = 54 oC
SEC
kW
/TR
HTF Temperature oC
-15 -14 -13 -12 -11 -10 -9 -8 -7 -6 -5 -4 -3 -2 -11.00
1.25
1.50
1.75
2.00
2.25
2.50
2.75
3.00 without storage with storage
TC = 38 oC TC = 38 oC
TC = 54 oC TC = 54 oC
SEC
kW
/TR
HTF Temperature oC
Figure 3.23 Variation of SEC with HTF inlet temperature at different
condensing temperature for ε =36% during charging
Figure 3.24 Variation of SEC with HTF inlet temperature at different
condensing temperature for ε = 49% during charging

54
-15 -14 -13 -12 -11 -10 -9 -8 -7 -6 -5 -4 -3 -21.00
1.25
1.50
1.75
2.00
2.25
2.50
2.75
3.00 without storage with storage
TC = 38 oC TC = 38 oC
TC = 54 oC TC = 54 oC
SEC
kW
/TR
HTF Temperature oC
Figure 3.25 Variation of SEC with HTF inlet temperature at different
condensing temperature for ε = 61% during charging
When the chiller is integrated with storage system for any
application, the freezing temperature of the selected PCM should be as high
as possible which depends on the process-cooling requirement to achieve
higher COP or lower SEC. Under any circumstances the chiller has to be
operated at a temperature lesser than the system without storage to achieve the
required temperature potential difference for the heat transfer. This may
reduce the performance of the chiller plant and the energy consumption is
higher at lower operating temperature. However, when the system is
integrated with storage system, the cooling load can be shifted to the night
hours where lower SEC is possible due to lower condensing temperature. This
benefit is not applicable to the system with water-cooled condenser, as the
condensing temperature has no influence due to the ambient condition. In
addition the storage system has the following advantages.
55
(i) The CTES system can be charged during the night hours and
the stored energy can be retrieved during the daytime, hence
the tariff difference during peak hours and off-peak hours can
be exploited.
(ii) Chiller plant can be operated always under full load condition
and hence the efficiency of the system is high.
(iii) Reducing the monthly demand charges for building air
conditioning and industrial refrigeration applications. Further
there are additional savings through reduced size of
refrigeration system components and piping, which resulted in
significant saving in capital and operating cost.