chapter 3 functions and their graphsshubbard/pdfs/ha2 solutions/chapter 3.pdf · chapter 3...
TRANSCRIPT
229 © 2008 Pearson Education, Inc., Upper Saddle River, NJ. All rights reserved. This material is protected under all copyright laws as they currently exist. No portion of this material may be reproduced, in any form or by any means, without permission in writing from the publisher.
Chapter 3
Functions and Their Graphs Section 3.1
1. ( )1,3−
2. ( ) ( ) ( ) ( ) ( )2
12
1 13 2 5 2 3 4 5 22 2
112 102
43 or 21 or 21.52
− − − + = − − −−
= + −
=
3. We must not allow the denominator to be 0. 4 0 4x x+ ≠ ⇒ ≠ − ; Domain: { }4x x ≠ − .
4. 3 2 52 2
1
xxx
− >− >
< −
Solution set: { }| 1x x < − or ( ), 1−∞ −
−1 0
5. independent; dependent
6. range
7. [ ]0,5
We need the intersection of the intervals [ ]0,7
and [ ]2,5− . That is, domain of domain of f g∩ .
7−2 50
7−2 50
7−2 50
f
g
f + g
8. ≠ ; f; g
9. ( )( )g f x− or ( ) ( )g x f x−
10. False; every function is a relation, but not every relation is a function. For example, the relation
2 2 1x y+ = is not a function.
11. True
12. True
13. False; if the domain is not specified, we assume it is the largest set of real numbers for which the value of f is a real number.
14. False; the domain of ( )2 4xf xx−
= is { }| 0x x ≠ .
15. Function Domain: {Elvis, Colleen, Kaleigh, Marissa} Range: {Jan. 8, Mar. 15, Sept. 17}
16. Not a function
17. Not a function
18. Function Domain: {Less than 9th grade, 9th-12th grade, High School Graduate, Some College, College Graduate}
Range: {$18,120, $23,251, $36,055, $45,810, $67,165}
19. Not a function
20. Function Domain: {–2, –1, 3, 4} Range: {3, 5, 7, 12}
21. Function Domain: {1, 2, 3, 4} Range: {3}
22. Function Domain: {0, 1, 2, 3} Range: {–2, 3, 7}
23. Not a function
24. Not a function
25. Function Domain: {–2, –1, 0, 1} Range: {0, 1, 4}
26. Function Domain: {–2, –1, 0, 1} Range: {3, 4, 16}
Chapter 3: Functions and Their Graphs
230 © 2008 Pearson Education, Inc., Upper Saddle River, NJ. All rights reserved. This material is protected under all copyright laws as they currently exist. No portion of this material may be reproduced, in any form or by any means, without permission in writing from the publisher.
27. Graph 2y x= . The graph passes the vertical line test. Thus, the equation represents a function.
28. Graph 3y x= . The graph passes the vertical line test. Thus, the equation represents a function.
29. Graph 1yx
= . The graph passes the vertical line
test. Thus, the equation represents a function.
30. Graph y x= . The graph passes the vertical line test. Thus, the equation represents a function.
31. 2 24y x= −
Solve for 2: 4y y x= ± − For 0, 2x y= = ± . Thus, (0, 2) and (0, –2) are on the graph. This is not a function, since a distinct x-value corresponds to two different y-values.
32. 1 2y x= ± − For 0, 1x y= = ± . Thus, (0, 1) and (0, –1) are on the graph. This is not a function, since a distinct x-value corresponds to two different y-values.
33. 2x y=
Solve for :y y x= ± For 1, 1x y= = ± . Thus, (1, 1) and (1, –1) are on the graph. This is not a function, since a distinct x-value corresponds to two different y-values.
34. 2 1x y+ =
Solve for : 1y y x= ± − For 0, 1x y= = ± . Thus, (0, 1) and (0, –1) are on the graph. This is not a function, since a distinct x-value corresponds to two different y-values.
35. Graph 22 3 4y x x= − + . The graph passes the vertical line test. Thus, the equation represents a function.
36. Graph 3 12
xyx
−=
+. The graph passes the vertical
line test. Thus, the equation represents a function.
37. 2 22 3 1x y+ =
Solve for y: 2 2
2 2
22
2
2 3 1
3 1 2
1 23
1 23
x y
y x
xy
xy
+ =
= −
−=
−= ±
For 10,3
x y= = ± . Thus, 10,3
⎛ ⎞⎜ ⎟⎜ ⎟⎝ ⎠
and
10,3
⎛ ⎞−⎜ ⎟⎜ ⎟
⎝ ⎠are on the graph. This is not a
function, since a distinct x-value corresponds to two different y-values.
Section 3.1: Functions
231 © 2008 Pearson Education, Inc., Upper Saddle River, NJ. All rights reserved. This material is protected under all copyright laws as they currently exist. No portion of this material may be reproduced, in any form or by any means, without permission in writing from the publisher.
38. 2 24 1x y− =
Solve for y: 2 2
2 2
22
2
4 1
4 1
14
12
x y
y x
xy
xy
− =
= −
−=
± −=
For 12,2
x y= = ± . Thus, 12,2
⎛ ⎞⎜ ⎟⎝ ⎠
and
12,2
⎛ ⎞−⎜ ⎟⎝ ⎠
are on the graph. This is not a
function, since a distinct x-value corresponds to two different y-values.
39. ( ) 23 2 4f x x x= + −
a. ( ) ( ) ( )20 3 0 2 0 4 4f = + − = −
b. ( ) ( ) ( )21 3 1 2 1 4 3 2 4 1f = + − = + − =
c. ( ) ( ) ( )21 3 1 2 1 4 3 2 4 3f − = − + − − = − − = −
d. ( ) ( ) ( )2 23 2 4 3 2 4f x x x x x− = − + − − = − −
e. ( ) ( )2 23 2 4 3 2 4f x x x x x− = − + − = − − +
f. ( ) ( ) ( )( )
2
2
2
2
1 3 1 2 1 4
3 2 1 2 2 4
3 6 3 2 2 4
3 8 1
f x x x
x x x
x x x
x x
+ = + + + −
= + + + + −
= + + + + −
= + +
g. ( ) ( ) ( )2 22 3 2 2 2 4 12 4 4f x x x x x= + − = + −
h. ( ) ( ) ( )( )
2
2 2
2 2
3 2 4
3 2 2 2 4
3 6 3 2 2 4
f x h x h x h
x xh h x h
x xh h x h
+ = + + + −
= + + + + −
= + + + + −
40. ( ) 22 1f x x x= − + −
a. ( ) ( )20 2 0 0 1 1f = − + − = −
b. ( ) ( )21 2 1 1 1 2f = − + − = −
c. ( ) ( ) ( )21 2 1 1 1 4f − = − − + − − = −
d. ( ) ( ) ( )2 22 1 2 1f x x x x x− = − − + − − = − − −
e. ( ) ( )2 22 1 2 1f x x x x x− = − − + − = − +
f. ( ) ( ) ( )( )
2
2
2
2
1 2 1 1 1
2 2 1 1 1
2 4 2
2 3 2
f x x x
x x x
x x x
x x
+ = − + + + −
= − + + + + −
= − − − +
= − − −
g. ( ) ( ) ( )2 22 2 2 2 1 8 2 1f x x x x x= − + − = − + −
h. ( ) ( )( )
2
2 2
2 2
2( ) 1
2 2 1
2 4 2 1
f x h x h x h
x xh h x h
x xh h x h
+ = − + + + −
= − + + + + −
= − − − + + −
41. ( ) 2 1xf x
x=
+
a. ( ) 20 00 0
10 1f = = =
+
b. ( ) 21 11
21 1f = =
+
c. ( )( )2
1 1 111 1 21 1
f − −− = = = −
+− +
d. ( )( )2 2 11
x xf xxx
− −− = =
+− +
e. ( ) 2 21 1x xf x
x x−⎛ ⎞− = − =⎜ ⎟+ +⎝ ⎠
f. ( )( )2
2
2
111 1
12 1 1
12 2
xf xx
xx x
xx x
++ =
+ +
+=
+ + ++
=+ +
g. ( )( )2 2
2 224 12 1
x xf xxx
= =++
h. ( )( )2 2 22 11
x h x hf x hx xh hx h
+ ++ = =
+ + ++ +
Chapter 3: Functions and Their Graphs
232 © 2008 Pearson Education, Inc., Upper Saddle River, NJ. All rights reserved. This material is protected under all copyright laws as they currently exist. No portion of this material may be reproduced, in any form or by any means, without permission in writing from the publisher.
42. ( )2 1
4xf xx
−=
+
a. ( )20 1 1 10
0 4 4 4f − −
= = = −+
b. ( )21 1 01 0
1 4 5f −
= = =+
c. ( ) ( )21 1 01 01 4 3
f− −
− = = =− +
d. ( ) ( )2 21 14 4
x xf xx x
− − −− = =
− + − +
e. ( )2 21 1
4 4x xf xx x
⎛ ⎞− − +− = − =⎜ ⎟⎜ ⎟+ +⎝ ⎠
f. ( ) ( )( )
2
2 2
1 11
1 4
2 1 1 25 5
xf x
x
x x x xx x
+ −+ =
+ +
+ + − += =
+ +
g. ( ) ( )2 22 1 4 122 4 2 4x xf xx x
− −= =
+ +
h. ( ) ( )( )
2 2 21 2 14 4
x h x xh hf x hx h x h+ − + + −
+ = =+ + + +
43. ( ) 4f x x= +
a. ( )0 0 4 0 4 4f = + = + =
b. ( )1 1 4 1 4 5f = + = + =
c. ( )1 1 4 1 4 5f − = − + = + =
d. ( ) 4 4f x x x− = − + = +
e. ( ) ( )4 4f x x x− = − + = − −
f. ( )1 1 4f x x+ = + +
g. ( )2 2 4 2 4f x x x= + = +
h. ( ) 4f x h x h+ = + +
44. ( ) 2f x x x= +
a. ( ) 20 0 0 0 0f = + = =
b. ( ) 21 1 1 2f = + =
c. ( ) ( ) ( )21 1 1 1 1 0 0f − = − + − = − = =
d. ( ) ( ) ( )2 2f x x x x x− = − + − = −
e. ( ) ( )2 2f x x x x x− = − + = − +
f. ( ) ( ) ( )2
2
2
1 1 1
2 1 1
3 2
f x x x
x x x
x x
+ = + + +
= + + + +
= + +
g. ( ) ( )2 22 2 2 4 2f x x x x x= + = +
h. ( ) ( ) ( )2
2 22
f x h x h x h
x xh h x h
+ = + + +
= + + + +
45. ( ) 2 13 5
xf xx
+=
−
a. ( ) ( )( )
2 0 1 0 1 103 0 5 0 5 5
f+ +
= = = −− −
b. ( ) ( )( )
2 1 1 2 1 3 313 1 5 3 5 2 2
f+ +
= = = = −− − −
c. ( ) ( )( )
2 1 1 2 1 1 113 1 5 3 5 8 8
f− + − + −
− = = = =− − − − −
d. ( ) ( )( )
2 1 2 1 2 13 5 3 5 3 5
x x xf xx x x
− + − + −− = = =
− − − − +
e. ( ) 2 1 2 13 5 3 5
x xf xx x
+ − −⎛ ⎞− = − =⎜ ⎟− −⎝ ⎠
f. ( ) ( )( )
2 1 1 2 2 1 2 313 1 5 3 3 5 3 2
x x xf xx x x
+ + + + ++ = = =
+ − + − −
g. ( ) ( )( )
2 2 1 4 123 2 5 6 5
x xf xx x
+ += =
− −
h. ( ) ( )( )
2 1 2 2 13 5 3 3 5
x h x hf x hx h x h
+ + + ++ = =
+ − + −
Section 3.1: Functions
233 © 2008 Pearson Education, Inc., Upper Saddle River, NJ. All rights reserved. This material is protected under all copyright laws as they currently exist. No portion of this material may be reproduced, in any form or by any means, without permission in writing from the publisher.
46. ( )( )2
112
f xx
= −+
a. ( )( )2
1 1 30 1 14 40 2
f = − = − =+
b. ( )( )2
1 1 81 1 19 91 2
f = − = − =+
c. ( )( )2
1 11 1 1 011 2
f − = − = − =− +
d. ( )( ) ( )2 2
1 11 12 2
f xx x
− = − = −− + −
e. ( )( ) ( )2 2
1 11 12 2
f xx x
⎛ ⎞⎜ ⎟− = − − = −⎜ ⎟+ +⎝ ⎠
f. ( )( ) ( )2 2
1 11 1 11 2 3
f xx x
+ = − = −+ + +
g. ( )( ) ( )2 2
1 12 1 12 2 4 1
f xx x
= − = −+ +
h. ( )( )2
112
f x hx h
+ = −+ +
47. ( ) 5 4f x x= − +
Domain: { } is any real numberx x
48. 2( ) 2f x x= +
Domain: { } is any real numberx x
49. 2( )1
xf xx
=+
Domain: { } is any real numberx x
50. 2
2( )1
xf xx
=+
Domain: { } is any real numberx x
51. 2( )16
xg xx
=−
2
2
16 0
16 4
x
x x
− ≠
≠ ⇒ ≠ ±
Domain: { }4, 4x x x≠ − ≠
52. 22( )
4xh x
x=
−
2
2
4 0
4 2
x
x x
− ≠
≠ ⇒ ≠ ±
Domain: { }2, 2x x x≠ − ≠
53. 32( ) xF x
x x−
=+
3
2
2
0
( 1) 0
0, 1
x x
x x
x x
+ ≠
+ ≠
≠ ≠ −
Domain: { }0x x ≠
54. 34( )4
xG xx x
+=
−
3
2
2
4 0
( 4) 0
0, 40, 2
x x
x x
x xx x
− ≠
− ≠
≠ ≠≠ ≠ ±
Domain: { }2, 0, 2x x x x≠ − ≠ ≠
55. ( ) 3 12h x x= − 3 12 0
3 124
xxx
− ≥≥≥
Domain: { }4x x ≥
56. ( ) 1G x x= − 1 0
11
xxx
− ≥− ≥ −
≤
Domain: { }1x x ≤
57. 4( )9
f xx
=−
9 09
xx
− >>
Domain: { }9x x >

Chapter 3: Functions and Their Graphs
234 © 2008 Pearson Education, Inc., Upper Saddle River, NJ. All rights reserved. This material is protected under all copyright laws as they currently exist. No portion of this material may be reproduced, in any form or by any means, without permission in writing from the publisher.
58. ( )4
xf xx
=−
4 04
xx
− >>
Domain: { }4x x >
59. 2 2( )1 1
p xx x
= =− −
1 01
xx
− >>
Domain: { }1x x >
60. ( ) 2q x x= − − 2 0
22
xxx
− − ≥− ≥
≤ −
Domain: { }2x x ≤ −
61. ( ) 3 4 ( ) 2 3f x x g x x= + = −
a. ( )( ) 3 4 2 3 5 1f g x x x x+ = + + − = +
Domain: { } is any real numberx x .
b. ( )( ) (3 4) (2 3)3 4 2 3
7
f g x x xx x
x
− = + − −= + − += +
Domain: { } is any real numberx x .
c. 2
2
( )( ) (3 4)(2 3)
6 9 8 12
6 12
f g x x x
x x x
x x
⋅ = + −
= − + −
= − −
Domain: { } is any real numberx x .
d. 3 4( )2 3
f xxg x
⎛ ⎞ +=⎜ ⎟ −⎝ ⎠
32 3 0 2 32
x x x− ≠ ⇒ ≠ ⇒ ≠
Domain: 32
x x⎧ ⎫≠⎨ ⎬
⎩ ⎭.
e. ( )(3) 5(3) 1 15 1 16f g+ = + = + =
f. ( )(4) 4 7 11f g− = + =
g. 2( )(2) 6(2) 2 12 24 2 12 10f g⋅ = − − = − − =
h. 3(1) 4 3 4 7(1) 72(1) 3 2 3 1
fg
⎛ ⎞ + += = = = −⎜ ⎟ − − −⎝ ⎠
62. ( ) 2 1 ( ) 3 2f x x g x x= + = −
a. ( )( ) 2 1 3 2 5 1f g x x x x+ = + + − = −
Domain: { }is any real numberx x .
b. ( )( ) (2 1) (3 2)2 1 3 2
3
f g x x xx xx
− = + − −= + − += − +
Domain: { }is any real numberx x .
c. 2
2
( )( ) (2 1)(3 2)
6 4 3 2
6 2
f g x x x
x x x
x x
⋅ = + −
= − + −
= − −
Domain: { }is any real numberx x .
d. 2 1( )3 2
f xxg x
⎛ ⎞ +=⎜ ⎟ −⎝ ⎠
3 2 023 23
x
x x
− ≠
≠ ⇒ ≠
Domain: 23
x x⎧ ⎫≠⎨ ⎬
⎩ ⎭.
e. ( )(3) 5(3) 1 15 1 14f g+ = − = − =
f. ( )(4) 4 3 1f g− = − + = −
g. 2( )(2) 6(2) 2 26(4) 2 224 2 2 20
f g⋅ = − −= − −= − − =
h. 2(1) 1 2 1 3(1) 33(1) 2 3 2 1
fg
⎛ ⎞ + += = = =⎜ ⎟ − −⎝ ⎠
63. 2( ) 1 ( ) 2f x x g x x= − =
a. 2 2( )( ) 1 2 2 1f g x x x x x+ = − + = + −
Domain: { }is any real numberx x .
b. 2
2
2
( )( ) ( 1) (2 )
1 2
2 1
f g x x x
x x
x x
− = − −
= − −
= − + −
Domain: { }is any real numberx x .
c. 2 3 2( )( ) ( 1)(2 ) 2 2f g x x x x x⋅ = − = −
Domain: { }is any real numberx x .
Section 3.1: Functions
235 © 2008 Pearson Education, Inc., Upper Saddle River, NJ. All rights reserved. This material is protected under all copyright laws as they currently exist. No portion of this material may be reproduced, in any form or by any means, without permission in writing from the publisher.
d. 21( )
2f xxg x
⎛ ⎞ −=⎜ ⎟
⎝ ⎠
Domain: { }0x x ≠ .
e. 2( )(3) 2(3) 3 12(9) 3 118 3 1 20
f g+ = + −= + −= + − =
f. 2( )(4) 2(4) 4 12(16) 4 132 4 1 29
f g− = − + −= − + −= − + − = −
g. 3 2( )(2) 2(2) 2(2)2(8) 2(4)16 8 8
f g⋅ = −= −= − =
h. 2
1 1 0 0(1) 02(1) 22(1)
fg
⎛ ⎞ −= = = =⎜ ⎟
⎝ ⎠
64. 2 3( ) 2 3 ( ) 4 1f x x g x x= + = +
a. 2 3
3 2
( )( ) 2 3 4 1
4 2 4
f g x x x
x x
+ = + + +
= + +
Domain: { } is any real numberx x .
b. ( ) ( )2 3
2 3
3 2
( )( ) 2 3 4 1
2 3 4 1
4 2 2
f g x x x
x x
x x
− = + − +
= + − −
= − + +
Domain: { } is any real numberx x .
c. ( )( )2 3
5 3 2
( )( ) 2 3 4 1
8 12 2 3
f g x x x
x x x
⋅ = + +
= + + +
Domain: { } is any real numberx x .
d. 2
32 3( )4 1
f xxg x
⎛ ⎞ +=⎜ ⎟
+⎝ ⎠
3
3
33 3
4 1 0
4 1
1 1 24 4 2
x
x
x x
+ ≠
≠ −
≠ − ⇒ ≠ − = −
Domain: 3 22
x x⎧ ⎫⎪ ⎪≠ −⎨ ⎬⎪ ⎪⎩ ⎭
.
e. 3 2( )(3) 4(3) 2(3) 44(27) 2(9) 4108 18 4 130
f g+ = + += + += + + =
f. 3 2( )(4) 4(4) 2(4) 24(64) 2(16) 2256 32 2 222
f g− = − + += − + += − + + = −
g. 5 3 2( )(2) 8(2) 12(2) 2(2) 38(32) 12(8) 2(4) 3256 96 8 3 363
f g⋅ = + + += + + += + + + =
h. 2
3
2(1) 3 2(1) 3 2 3 5(1) 14(1) 1 4 1 54(1) 1
fg
⎛ ⎞ + + += = = = =⎜ ⎟ + ++⎝ ⎠
65. ( ) ( ) 3 5f x x g x x= = −
a. ( )( ) 3 5f g x x x+ = + −
Domain: { }0x x ≥ .
b. ( )( ) (3 5) 3 5f g x x x x x− = − − = − +
Domain: { }0x x ≥ .
c. ( )( ) (3 5) 3 5f g x x x x x x⋅ = − = −
Domain: { }0x x ≥ .
d. ( )3 5
f xxg x
⎛ ⎞=⎜ ⎟ −⎝ ⎠
0 and 3 5 05 3 53
x x
x x
≥ − ≠
≠ ⇒ ≠
Domain: 50 and 3
x x x⎧ ⎫≥ ≠⎨ ⎬
⎩ ⎭.
e. ( )(3) 3 3(3) 5
3 9 5 3 4
f g+ = + −
= + − = +
f. ( )(4) 4 3(4) 52 12 5 5
f g− = − += − + = −
g. ( )(2) 3(2) 2 5 2
6 2 5 2 2
f g⋅ = −
= − =
h. 1 1 1 1(1)3(1) 5 3 5 2 2
fg
⎛ ⎞= = = = −⎜ ⎟ − − −⎝ ⎠

Chapter 3: Functions and Their Graphs
236 © 2008 Pearson Education, Inc., Upper Saddle River, NJ. All rights reserved. This material is protected under all copyright laws as they currently exist. No portion of this material may be reproduced, in any form or by any means, without permission in writing from the publisher.
66. ( ) ( )f x x g x x= =
a. ( )( )f g x x x+ = +
Domain: { } is any real numberx x .
b. ( )( )f g x x x− = −
Domain: { } is any real numberx x .
c. ( )( )f g x x x x x⋅ = ⋅ =
Domain: { } is any real numberx x .
d. ( )xf x
g x⎛ ⎞
=⎜ ⎟⎝ ⎠
Domain: { }0x x ≠ .
e. ( )(3) 3 3 3 3 6f g+ = + = + =
f. ( )(4) 4 4 4 4 0f g− = − = − =
g. ( )(2) 2 2 2 2 4f g⋅ = = ⋅ =
h. 1 1(1) 11 1
fg
⎛ ⎞= = =⎜ ⎟
⎝ ⎠
67. 1 1( ) 1 ( )f x g xx x
= + =
a. 1 1 2( )( ) 1 1f g xx x x
+ = + + = +
Domain: { }0x x ≠ .
b. 1 1( )( ) 1 1f g xx x
− = + − =
Domain: { }0x x ≠ .
c. 21 1 1 1( )( ) 1f g xx x x x
⎛ ⎞⋅ = + = +⎜ ⎟⎝ ⎠
Domain: { }0x x ≠ .
d.
1 11 1( ) 11 1 1
xf x xx xx xg x
x x
++⎛ ⎞ +
= = = ⋅ = +⎜ ⎟⎝ ⎠
Domain: { }0x x ≠ .
e. 2 5( )(3) 13 3
f g+ = + =
f. ( )(4) 1f g− =
g. 2
1 1 1 1 3( )(2)2 2 4 4(2)
f g⋅ = + = + =
h. (1) 1 1 2fg
⎛ ⎞= + =⎜ ⎟
⎝ ⎠
68. ( ) 1 ( ) 4f x x g x x= − = −
a. ( )( ) 1 4f g x x x+ = − + − 1 0 and 4 0
1 and 4 4
x xx x
x
− ≥ − ≥≥ − ≥ −
≤
Domain: { }1 4x x≤ ≤ .
b. ( )( ) 1 4f g x x x− = − − − 1 0 and 4 0
1 and 4 4
x xx x
x
− ≥ − ≥≥ − ≥ −
≤
Domain: { }1 4x x≤ ≤ .
c. ( ) ( )2
( )( ) 1 4
5 4
f g x x x
x x
⋅ = − −
= − + −
1 0 and 4 0 1 and 4 4
x xx x
x
− ≥ − ≥≥ − ≥ −
≤
Domain: { }1 4x x≤ ≤ .
d. 1 1( )44
f x xxg xx
⎛ ⎞ − −= =⎜ ⎟ −−⎝ ⎠
1 0 and 4 0 1 and 4 4
x xx x
x
− ≥ − >≥ − > −
<
Domain: { }1 4x x≤ < .
e. ( )(3) 3 1 4 3
2 1 2 1
f g+ = − + −
= + = +
f. ( )(4) 4 1 4 4
3 0 3 0 3
f g− = − − −
= − = − =
g. 2( )(2) (2) 5(2) 4
4 10 4 2
f g⋅ = − + −
= − + − =
h. 1 1 0(1) 0 04 1 3
fg
⎛ ⎞ −= = = =⎜ ⎟ −⎝ ⎠
Section 3.1: Functions
237 © 2008 Pearson Education, Inc., Upper Saddle River, NJ. All rights reserved. This material is protected under all copyright laws as they currently exist. No portion of this material may be reproduced, in any form or by any means, without permission in writing from the publisher.
69. 2 3 4( ) ( )3 2 3 2
x xf x g xx x
+= =
− −
a. 2 3 4( )( )3 2 3 22 3 4 6 3
3 2 3 2
x xf g xx xx x x
x x
++ = +
− −+ + +
= =− −
23
3 2 0
3 2
x
x x
− ≠
≠ ⇒ ≠
Domain: { }23x x ≠ .
b. 2 3 4( )( )3 2 3 22 3 4 2 3
3 2 3 2
x xf g xx xx x x
x x
+− = −
− −+ − − +
= =− −
3 2 023 23
x
x x
− ≠
≠ ⇒ ≠
Domain: 23
x x⎧ ⎫≠⎨ ⎬
⎩ ⎭.
c. 2
22 3 4 8 12( )( )3 2 3 2 (3 2)
x x x xf g xx x x
+ +⎛ ⎞⎛ ⎞⋅ = =⎜ ⎟⎜ ⎟− − −⎝ ⎠⎝ ⎠
3 2 023 23
x
x x
− ≠
≠ ⇒ ≠
Domain: 23
x x⎧ ⎫≠⎨ ⎬
⎩ ⎭.
d.
2 32 3 3 2 2 33 2( )
4 3 2 4 43 2
xf x x xxx
xg x x xx
+⎛ ⎞ + − +−= = ⋅ =⎜ ⎟ −⎝ ⎠
−
3 2 0 and 03 2
23
x xx
x
− ≠ ≠≠
≠
Domain: 2 and 03
x x x⎧ ⎫≠ ≠⎨ ⎬
⎩ ⎭.
e. 6(3) 3 18 3 21( )(3) 33(3) 2 9 2 7
f g + ++ = = = =
− −
f. 2(4) 3 8 3 5 1( )(4)
3(4) 2 12 2 10 2f g
− + − + −− = = = = −
− −
g. ( )
( ) ( )
2
2
2 2
8(2) 12(2)( )(2)3(2) 2
8(4) 24 32 24 56 716 26 2 4
f g +⋅ =
−
+ += = = =
−
h. 2(1) 3 2 3 5(1)
4(1) 4 4fg
⎛ ⎞ + += = =⎜ ⎟
⎝ ⎠
70. 2( ) 1 ( )f x x g xx
= + =
a. 2( )( ) 1f g x xx
+ = + +
1 0 and 01
x xx
+ ≥ ≠≥ −
Domain: { }1, and 0x x x≥ − ≠ .
b. 2( )( ) 1f g x xx
− = + −
1 0 and 01
x xx
+ ≥ ≠≥ −
Domain: { }1, and 0x x x≥ − ≠ .
c. 2 2 1( )( ) 1 xf g x xx x
+⋅ = + ⋅ =
1 0 and 01
x xx
+ ≥ ≠≥ −
Domain: { }1, and 0x x x≥ − ≠ .
d. 1 1( )2 2
f x x xxg
x
⎛ ⎞ + += =⎜ ⎟
⎝ ⎠
1 0 and 01
x xx
+ ≥ ≠≥ −
Domain: { }1, and 0x x x≥ − ≠ .
e. 2 2 2 8( )(3) 3 1 4 23 3 3 3
f g+ = + + = + = + =
f. 2 1( )(4) 4 1 54 2
f g− = + − = −
g. 2 2 1 2 3( )(2) 32 2
f g +⋅ = = =
h. 1 1 1 2(1)2 2
fg
⎛ ⎞ += =⎜ ⎟
⎝ ⎠
Chapter 3: Functions and Their Graphs
238 © 2008 Pearson Education, Inc., Upper Saddle River, NJ. All rights reserved. This material is protected under all copyright laws as they currently exist. No portion of this material may be reproduced, in any form or by any means, without permission in writing from the publisher.
71. 1( ) 3 1 ( )( ) 62
f x x f g x x= + + = −
16 3 1 ( )275 ( )2
7( ) 52
x x g x
x g x
g x x
− = + +
− =
= −
72. 21 1( ) ( )f xf x xx g x x
⎛ ⎞ += =⎜ ⎟
−⎝ ⎠
2
2
2
11
( )1
1( )1 1
1 ( 1) 11 1
x xg xx x
x xxg xx x x
x xx x x
x x x
+=
−
−= = ⋅
+ +−
− −= ⋅ =
+ +
73. ( ) 4 3f x x= + ( ) ( ) 4( ) 3 (4 3)
4 4 3 4 3
4 4
f x h f x x h xh h
x h xh
hh
+ − + + − +=
+ + − −=
= =
74. ( ) 3 1f x x= − + ( ) ( ) 3( ) 1 ( 3 1)
3 3 1 3 1
3 3
f x h f x x h xh h
x h xh
hh
+ − − + + − − +=
− − + + −=
−= = −
75. 2( ) 4f x x x= − +
2 2
2 2 2
2
( ) ( )
( ) ( ) 4 ( 4)
2 4 4
2
2 1
f x h f xh
x h x h x xh
x xh h x h x xh
xh h hh
x h
+ −
+ − + + − − +=
+ + − − + − + −=
+ −=
= + −
76. 2( ) 5 1f x x x= + −
2 2
2 2 2
2
( ) ( )
( ) 5( ) 1 ( 5 1)
2 5 5 1 5 1
2 5 2 5
f x h f xh
x h x h x xh
x xh h x h x xh
xh h h x hh
+ −
+ + + − − + −=
+ + + + − − − +=
+ += = + +
77. ( ) 23 2 6f x x x= − +
( ) ( )
( ) ( )
( )
2 2
2 2 2
2 2 2 2
3 2 6 3 2 6
3 2 2 2 6 3 2 6
3 6 3 2 3 6 3 2
6 3 2
f x h f xh
x h x h x x
hx xh h x h x x
hx xh h h x xh h h
h hx h
+ −
⎡ ⎤ ⎡ ⎤+ − + + − − +⎣ ⎦⎢ ⎥⎣ ⎦=
+ + − − + − + −=
+ + − − + −= =
= + −
78. ( ) 24 5 7f x x x= + −
( ) ( )
( ) ( )
( )
2 2
2 2 2
2 2 2 2
4 5 7 4 5 7
4 2 5 5 7 4 5 7
4 8 4 5 4 8 4 5
8 4 5
f x h f xh
x h x h x x
hx xh h x h x x
hx xh h h x xh h h
h hx h
+ −
⎡ ⎤ ⎡ ⎤+ + + − − + −⎣ ⎦⎢ ⎥⎣ ⎦=
+ + + + − − − +=
+ + + − + += =
= + +
79. 3( ) 2f x x= −
( ) ( )3 3
3 2 2 3 3
2 2 32 2
( ) ( )
2 2
3 3 2 2
3 3 3 3
f x h f xh
x h x
hx x h xh h x
hx h xh h x xh h
h
+ −
+ − − −=
+ + + − − +=
+ += = + +

Section 3.1: Functions
239 © 2008 Pearson Education, Inc., Upper Saddle River, NJ. All rights reserved. This material is protected under all copyright laws as they currently exist. No portion of this material may be reproduced, in any form or by any means, without permission in writing from the publisher.
80. 1( )3
f xx
=+
( )( )( )
( )( )
( )( )
( )( )
1 1( ) ( ) 3 3
3 33 3
3 3 13 3
13 3
13 3
f x h f x x h xh h
x x hx h x
hx x hx h x h
hx h x h
x h x
−+ − + + +=
+ − + ++ + +
=
⎛ ⎞+ − − − ⎛ ⎞= ⎜ ⎟⎜ ⎟⎜ ⎟+ + + ⎝ ⎠⎝ ⎠⎛ ⎞− ⎛ ⎞= ⎜ ⎟⎜ ⎟⎜ ⎟+ + + ⎝ ⎠⎝ ⎠
−=
+ + +
81. 3 2( ) 2 4 5 and (2) 5f x x Ax x f= + + − = 3 2(2) 2(2) (2) 4(2) 5
5 16 4 8 55 4 19
14 414 74 2
f AA
AA
A
= + + −= + + −= +
− =−
= = −
82. 2( ) 3 4 and ( 1) 12f x x Bx f= − + − = : 2( 1) 3( 1) ( 1) 4
12 3 45
f BB
B
− = − − − += + +=
83. 3 8( ) and (0) 22
xf x fx A
+= =
−
3(0) 8(0)2(0)82
2 84
fA
AAA
+=
−
=−
− == −
84. 2 1( ) and (2)3 4 2x Bf x fx
−= =
+
2(2)(2)3(2) 4
1 42 105 4
1
Bf
B
BB
−=
+−
=
= −= −
85. 2( ) and (4) 03
x Af x fx
−= =
−
2(4)(4)4 3
801
0 88
Af
A
AA
−=
−−
=
= −=
f is undefined when 3x = .
86. ( ) , (2) 0 and (1) is undefinedx Bf x f fx A
−= =
−
1 0 12(2)2 120
10 2
2
A ABf
B
BB
− = ⇒ =−
=−−
=
= −=
87. Let x represent the length of the rectangle.
Then, 2x represents the width of the rectangle
since the length is twice the width. The function
for the area is: 2
21( )2 2 2x xA x x x= ⋅ = =
88. Let x represent the length of one of the two equal sides. The function for the area is:
21 1( )2 2
A x x x x= ⋅ ⋅ =
89. Let x represent the number of hours worked. The function for the gross salary is:
( ) 10G x x=
90. Let x represent the number of items sold. The function for the gross salary is:
( ) 10 100G x x= +

Chapter 3: Functions and Their Graphs
240 © 2008 Pearson Education, Inc., Upper Saddle River, NJ. All rights reserved. This material is protected under all copyright laws as they currently exist. No portion of this material may be reproduced, in any form or by any means, without permission in writing from the publisher.
91. a. P is the dependent variable; a is the independent variable
b. 2(20) 0.015(20) 4.962(20) 290.5806 99.24 290.580197.34
P = − += − +=
In 2005 there are 197.34 million people who are 20 years of age or older.
c. 2(0) 0.015(0) 4.962(0) 290.580290.580
P = − +=
In 2005 there are 290.580 million people.
92. a. N is the dependent variable; r is the independent variable
b. 2(3) 1.44(3) 14.52(3) 14.9612.96 43.56 14.96
15.64
N = − + −= − + −=
In 2005, there are 15.64 million housing units with 3 rooms.
93. a. ( ) ( )21 20 4.9 120 4.9 15.1 meters
H = −
= − =
( ) ( )( )
( ) ( )( )
( ) ( )( )
2
2
2
1.1 20 4.9 1.1
20 4.9 1.2120 5.929 14.071 meters
1.2 20 4.9 1.2
20 4.9 1.4420 7.056 12.944 meters
1.3 20 4.9 1.3
20 4.9 1.6920 8.281 11.719 meters
H
H
H
= −
= −
= − =
= −
= −
= − =
= −
= −
= − =
b. ( )2
2
2
15 :
15 20 4.9
5 4.9
1.02041.01 seconds
H x
x
x
xx
=
= −
− = −
≈≈
( )2
2
2
10 :
10 20 4.9
10 4.9
2.04081.43 seconds
H x
x
x
xx
=
= −
− = −
≈≈
( )2
2
2
5 :
5 20 4.9
15 4.9
3.06121.75 seconds
H x
x
x
xx
=
= −
− = −
≈≈
c. ( ) 0H x = 2
2
2
0 20 4.9
20 4.9
4.08162.02 seconds
x
x
xx
= −
− = −
≈≈
94. a. ( ) ( )21 20 13 1 20 13 7 metersH = − = − =
( ) ( ) ( )
( ) ( ) ( )
2
2
1.1 20 13 1.1 20 13 1.2120 15.73 4.27 meters
1.2 20 13 1.2 20 13 1.4420 18.72 1.28 meters
H
H
= − = −
= − =
= − = −
= − =
b. ( )2
2
2
15
15 20 13
5 13
0.38460.62 seconds
H x
x
x
xx
=
= −
− = −
≈≈
( )2
2
2
10
10 20 13
10 13
0.76920.88 seconds
H x
x
x
xx
=
= −
− = −
≈≈
( )2
2
2
5
5 20 13
15 13
1.15381.07 seconds
H x
x
x
xx
=
= −
− = −
≈≈
c. ( ) 0H x = 2
2
2
0 20 13
20 13
1.53851.24 seconds
x
x
xx
= −
− = −
≈≈
Section 3.1: Functions
241 © 2008 Pearson Education, Inc., Upper Saddle River, NJ. All rights reserved. This material is protected under all copyright laws as they currently exist. No portion of this material may be reproduced, in any form or by any means, without permission in writing from the publisher.
95. ( ) 36,00010010xC x
x= + +
a. ( ) 500 36,000500 10010 500
100 50 72$222
C = + +
= + +=
b. ( ) 450 36,000450 10010 450
100 45 80$225
C = + +
= + +=
c. ( ) 600 36,000600 10010 600
100 60 60$220
C = + +
= + +=
d. ( ) 400 36,000400 10010 400
100 40 90$230
C = + +
= + +=
96. ( ) 24 1A x x x= −
a. 2
2
1 1 1 4 8 4 2 24 13 3 3 3 9 3 3
8 2 1.26 ft9
A⎛ ⎞ ⎛ ⎞= ⋅ − = = ⋅⎜ ⎟ ⎜ ⎟⎝ ⎠ ⎝ ⎠
= ≈
b. 2
2
1 1 1 3 34 1 2 22 2 2 4 2
3 1.73 ft
A⎛ ⎞ ⎛ ⎞= ⋅ − = = ⋅⎜ ⎟ ⎜ ⎟⎝ ⎠ ⎝ ⎠
= ≈
c. 2
2
2 2 2 8 5 8 54 13 3 3 3 9 3 3
8 5 1.99 ft9
A⎛ ⎞ ⎛ ⎞= ⋅ − = = ⋅⎜ ⎟ ⎜ ⎟⎝ ⎠ ⎝ ⎠
= ≈
97. ( ) ( ) ( )( )
L xLR x xP P x
⎛ ⎞= =⎜ ⎟⎝ ⎠
98. ( ) ( ) ( ) ( ) ( )T x V P x V x P x= + = +
99. ( ) ( )( ) ( ) ( )H x P I x P x I x= ⋅ = ⋅
100. ( ) ( )( ) ( ) ( )N x I T x I x T x= − = −
101. a.
( ) ( )2 3 2
2 3 2
3 2
( ) ( ) ( )
1.2 220 0.05 2 65 500
1.2 220 0.05 2 65 500
0.05 0.8 155 500
P x R x C x
x x x x x
x x x x x
x x x
= −
= − + − − + +
= − + − + − −
= − + + −
b. 3 2(15) 0.05(15) 0.8(15) 155(15) 500
168.75 180 2325 500
$1836.25
P = − + + −
= − + + −
=
c. When 15 hundred cell phones are sold, the profit is $1836.25.
102. a.
( )2
2
2
( ) ( ) ( )
30 0.1 7 400
30 0.1 7 400
0.1 23 400
P x R x C x
x x x
x x x
x x
= −
= − + +
= − − −
= − + −
b. 2(30) 0.1(30) 23(30) 40090 690 400
$200
P = − + −= − + −=
c. When 30 clocks are sold, the profit is $200.
103. a. ( ) 2h x x=
( ) ( )( ) ( )
2 2 2h a b a b a b
h a h b
+ = + = +
= +
( ) 2h x x= has the property.
b. ( ) 2g x x=
( ) ( )2 2 22g a b a b a ab b+ = + = + + Since
( ) ( )2 2 2 22a ab b a b g a g b+ + ≠ + = + ,2( )g x x= does not have the property.
c. ( ) 5 2F x x= −
( ) ( )5 2 5 5 2F a b a b a b+ = + − = + − Since
( ) ( )5 5 2 5 2 5 2a b a b F a F b+ − ≠ − + − = + ,
( ) 5 2F x x= − does not have the property.

Chapter 3: Functions and Their Graphs
242 © 2008 Pearson Education, Inc., Upper Saddle River, NJ. All rights reserved. This material is protected under all copyright laws as they currently exist. No portion of this material may be reproduced, in any form or by any means, without permission in writing from the publisher.
d. ( ) 1G xx
=
( ) ( ) ( )1 1 1G a b G a G ba b a b
+ = ≠ + = ++
( ) 1G xx
= does not have the property.
104. No. The domain of f is { } is any real numberx x ,
but the domain of g is { }1x x ≠ − .
105. Answers will vary. Section 3.2
1. 2 24 16x y+ = x-intercepts:
( )
( ) ( )
22
2
4 0 16
164 4,0 , 4,0
x
xx
+ =
=
= ± ⇒ −
y-intercepts: ( )
( ) ( )
2 2
2
2
0 4 16
4 164
2 0, 2 , 0,2
y
yyy
+ =
=
=
= ± ⇒ −
2. False; 2 22 2 20 20
x yyy
y
= −− = −
==
The point ( )2,0− is on the graph.
3. vertical
4. ( )5 3f = −
5. ( ) 2 4f x ax= +
( )21 4 2 2a a− + = ⇒ = −
6. False; it would fail the vertical line test.
7. False; e.g. 1yx
= .
8. True
9. a. (0) 3 since (0,3) is on the graph.f = ( 6) 3 since ( 6, 3) is on the graph.f − = − − −
b. (6) 0 since (6, 0) is on the graph.f = (11) 1 since (11, 1) is on the graph.f =
c. (3) is positive since (3) 3.7.f f ≈
d. ( 4) is negative since ( 4) 1.f f− − ≈ −
e. ( ) 0 when 3, 6, and 10.f x x x x= = − = =
f. ( ) 0 when 3 6, and 10 11.f x x x> − < < < ≤
g. The domain of f is { }6 11x x− ≤ ≤ or
[ ]6, 11− .
h. The range of f is { }3 4y y− ≤ ≤ or
[ ]3, 4− .
i. The x-intercepts are 3− , 6, and 10. j. The y-intercept is 3.
k. The line 12
y = intersects the graph 3 times.
l. The line 5x = intersects the graph 1 time.
m. ( ) 3 when 0 and 4.f x x x= = =
n. ( ) 2 when 5 and 8.f x x x= − = − =
10. a. (0) 0 since (0,0) is on the graph.f = (6) 0 since (6,0) is on the graph.f =
b. (2) 2 since (2, 2) is on the graph.f = − − ( 2) 1 since ( 2, 1) is on the graph.f − = −
c. (3) is negative since (3) 1.f f ≈ −
d. ( 1) is positive since ( 1) 1.0.f f− − ≈
e. ( ) 0 when 0, 4, and 6.f x x x x= = = =
f. ( ) 0 when 0 4.f x x< < <
g. The domain of f is { }4 6x x− ≤ ≤ or
[ ]4, 6− .
h. The range of f is { }2 3y y− ≤ ≤ or [ ]2, 3− .
i. The x-intercepts are 0, 4, and 6.
j. The y-intercept is 0.
k. The line 1y = − intersects the graph 2 times.

Section 3.2: The Graph of a Function
243 © 2008 Pearson Education, Inc., Upper Saddle River, NJ. All rights reserved. This material is protected under all copyright laws as they currently exist. No portion of this material may be reproduced, in any form or by any means, without permission in writing from the publisher.
l. The line 1x = intersects the graph 1 time.
m. ( ) 3 when 5.f x x= =
n. ( ) 2 when 2.f x x= − =
11. Not a function since vertical lines will intersect the graph in more than one point.
12. Function
a. Domain: { } is any real numberx x ;
Range: { }0y y >
b. Intercepts: (0,1)
c. None
13. Function
a. Domain: { }x x− π ≤ ≤ π ;
Range: { }1 1y y− ≤ ≤
b. Intercepts: ,0 , ,0 , (0,1)2 2π π⎛ ⎞ ⎛ ⎞−⎜ ⎟ ⎜ ⎟
⎝ ⎠ ⎝ ⎠
c. Symmetry about y-axis.
14. Function
a. Domain: { }x x− π ≤ ≤ π ;
Range: { }1 1y y− ≤ ≤
b. Intercepts: ( ) ( ), 0 , , 0 , (0, 0)−π π
c. Symmetry about the origin.
15. Not a function since vertical lines will intersect the graph in more than one point.
16. Not a function since vertical lines will intersect the graph in more than one point.
17. Function
a. Domain: { }0x x > ;
Range: { } is any real numbery y
b. Intercepts: (1, 0) c. None
18. Function
a. Domain: { }0 4x x≤ ≤ ;
Range: { }0 3y y≤ ≤
b. Intercepts: (0, 0) c. None
19. Function
a. Domain: { } is any real numberx x ;
Range: { }2y y ≤
b. Intercepts: (–3, 0), (3, 0), (0,2) c. Symmetry about y-axis.
20. Function
a. Domain: { }3x x ≥ − ;
Range: { }0y y ≥
b. Intercepts: (–3, 0), (2,0), (0,2) c. None
21. Function
a. Domain: { } is any real numberx x ;
Range: { }3y y ≥ −
b. Intercepts: (1, 0), (3,0), (0,9) c. None
22. Function
a. Domain: { } is any real numberx x ;
Range: { }5y y ≤
b. Intercepts: (–1, 0), (2,0), (0,4) c. None
23. 2( ) 2 1f x x x= − −
a. ( ) ( )2( 1) 2 1 1 1 2f − = − − − − =
The point ( )1, 2− is on the graph of f.
b. ( ) ( )2( 2) 2 2 2 1 9f − = − − − − =
The point ( )2,9− is on the graph of f.
Chapter 3: Functions and Their Graphs
244 © 2008 Pearson Education, Inc., Upper Saddle River, NJ. All rights reserved. This material is protected under all copyright laws as they currently exist. No portion of this material may be reproduced, in any form or by any means, without permission in writing from the publisher.
c. Solve for x :
( )
2
2
12
1 2 1
0 2
0 2 1 0,
x x
x x
x x x x
− = − −
= −
= − ⇒ = =
(0, –1) and ( )12 , 1− are on the graph of f .
d. The domain of f is { } is any real numberx x .
e. x-intercepts: ( )
( )( )
( )
2=0 2 1 012 1 1 0 , 12
1 ,0 and 1,02
f x x x
x x x x
⇒ − − =
+ − = ⇒ = − =
⎛ ⎞−⎜ ⎟⎝ ⎠
f. y-intercept: ( ) ( ) ( )20 =2 0 0 1 1 0, 1f − − = − ⇒ −
24. 2( ) 3 5f x x x= − +
a. ( ) ( )2( 1) 3 1 5 1 8 2 f − = − − + − = − ≠
The point ( )1, 2− is not on the graph of f.
b. ( ) ( )2( 2) 3 2 5 2 = 22f − = − − + − −
The point ( )2, 22− − is on the graph of f.
c. Solve for x :
( )( )
2 2
13
2 3 5 3 5 2 0
3 1 2 0 , 2
x x x x
x x x x
− = − + ⇒ − − =
+ − = ⇒ = − =
(2, –2) and ( )13 , 2− − on the graph of f .
d. The domain of f is{ } is any real numberx x .
e. x-intercepts: ( )( )
( ) ( )
2
53
53
=0 3 5 0
3 5 0 0,
0,0 and ,0
f x x x
x x x x
⇒ − + =
− + = ⇒ = =
f. y-intercept: ( ) ( ) ( ) ( )20 3 0 5 0 0 0,0f = − + = ⇒
25. 2( )6
xf xx
+=
−
a. 3 2 5(3) 143 6 3
f += = − ≠
−
The point ( )3,14 is not on the graph of f.
b. 4 2 6(4) 34 6 2
f += = = −
− −
The point ( )4, 3− is on the graph of f.
c. Solve for x : 226
2 12 214
xx
x xx
+=
−− = +
=
(14, 2) is a point on the graph of f .
d. The domain of f is { }6x x ≠ .
e. x-intercepts:
( )
( )
2=0 06
2 0 2 2,0
xf xx
x x
+⇒ =
−+ = ⇒ = − ⇒ −
f. y-intercept: ( ) 0 2 1 10 0,0 6 3 3
f + ⎛ ⎞= = − ⇒ −⎜ ⎟− ⎝ ⎠
26. 2 2( )
4xf xx
+=
+
a. 21 2 3(1)1 4 5
f += =
+
The point 31,5
⎛ ⎞⎜ ⎟⎝ ⎠
is on the graph of f.
b. 20 2 2 1(0)
0 4 4 2f +
= = =+
The point 10,2
⎛ ⎞⎜ ⎟⎝ ⎠
is on the graph of f.
c. Solve for x :
( )
22
2
1 2 4 2 42 40 2
12 1 0 0 or 2
x x xxx x
x x x x
+= ⇒ + = +
+= −
− = ⇒ = =
1 1 10, and ,2 2 2
⎛ ⎞ ⎛ ⎞⎜ ⎟ ⎜ ⎟⎝ ⎠ ⎝ ⎠
are on the graph of f .

Section 3.2: The Graph of a Function
245 © 2008 Pearson Education, Inc., Upper Saddle River, NJ. All rights reserved. This material is protected under all copyright laws as they currently exist. No portion of this material may be reproduced, in any form or by any means, without permission in writing from the publisher.
d. The domain of f is{ }4x x ≠ − .
e. x-intercepts:
( )2
22=0 0 2 04
xf x xx
+⇒ = ⇒ + =
+
This is impossible, so there are no x-intercepts.
f. y-intercept:
( )20 2 2 1 10 0,
0 4 4 2 2f + ⎛ ⎞= = = ⇒ ⎜ ⎟+ ⎝ ⎠
27. 2
42( )
1xf x
x=
+
a. 2
42( 1) 2( 1) 1
2( 1) 1f −
− = = =− +
The point (–1,1) is on the graph of f.
b. 2
42(2) 8(2)
17(2) 1f = =
+
The point 82,17
⎛ ⎞⎜ ⎟⎝ ⎠
is on the graph of f.
c. Solve for x : 2
4
4 2
4 2
2 2
211
1 22 1 0
( 1) 0
xx
x xx x
x
=+
+ =− + =
− =
2 1 0 1x x− = ⇒ = ± (1,1) and (–1,1) are on the graph of f .
d. The domain of f is { } is any real numberx x .
e. x-intercept:
( )
( )
2
4
2
2=0 01
2 0 0 0,0
xf xx
x x
⇒ =+
= ⇒ = ⇒
f. y-intercept:
( ) ( ) ( )2
4
2 0 00 0 0,00 10 1
f = = = ⇒++
28. 2( )2
xf xx
=−
a.
121 1 22
1 32 322 2
f
⎛ ⎞⎜ ⎟⎛ ⎞ ⎝ ⎠= = = −⎜ ⎟
⎝ ⎠ − −
The point 1 2,2 3
⎛ ⎞−⎜ ⎟⎝ ⎠
is on the graph of f.
b. 2(4) 8(4) 44 2 2
f = = =−
The point ( )4, 4 is on the graph of f.
c. Solve for x : 2 21 2 2
2x xx x
x== ⇒ − ⇒ − =
−
(–2,1) is a point on the graph of f .
d. The domain of f is { }2x x ≠ .
e. x-intercept:
( )
( )
2=0 0 2 02
0 0,0
xf x xx
x
⇒ = ⇒ =−
⇒ = ⇒
f. y-intercept: ( ) ( )00 0 0,00 2
f = = ⇒−
29. ( )2
244 6xh x x
v= − + +
a. ( ) ( ) ( )2
2
44 88 8 6
282816 14784
10.4 feet
h = − + +
= − +
≈
b. ( ) ( ) ( )2
2
44 1212 12 6
286336 18784
9.9 feet
h = − + +
= − +
≈

Chapter 3: Functions and Their Graphs
246 © 2008 Pearson Education, Inc., Upper Saddle River, NJ. All rights reserved. This material is protected under all copyright laws as they currently exist. No portion of this material may be reproduced, in any form or by any means, without permission in writing from the publisher.
c. From part (a) we know the point ( )8,10.4 is on the graph and from part (b) we know the point ( )12,9.9 is on the graph. We could evaluate the function at several more values of x (e.g. 0x = , 15x = , and 20x = ) to obtain additional points.
( ) ( ) ( )
( ) ( ) ( )
( ) ( ) ( )
2
2
2
2
2
2
44 00 0 6 6
28
44 1515 15 6 8.4
28
44 2020 20 6 3.6
28
h
h
h
= − + + =
= − + + ≈
= − + + ≈
Some additional points are ( )0,6 , ( )15,8.4
and ( )20,3.6 . The complete graph is given below.
6
d. ( ) ( ) ( )2
2
44 1515 15 6 8.4 feet
28h = − + + ≈
No; when the ball is 15 feet in front of the foul line, it will be below the hoop. Therefore it cannot go through the hoop.
In order for the ball to pass through the hoop, we need to have ( )15 10h = .
( ) ( )
( )
( )
2
2
2
2
2
2
44 1510 15 6
44 1511
4 225
90030 ft/sec
v
vv
vv
= − + +
− = −
=
==
The ball must be shot with an initial velocity of 30 feet per second in order to go through the hoop.
30. ( )2
2136 2.7 3.5xh x x
v= − + +
a. We want ( )15 10h = .
( ) ( )2
2
2
2
136 152.7 15 3.5 10
30,600 34
90030 ft/sec
v
vvv
− + + =
− = −
==
The ball needs to be thrown with an initial velocity of 30 feet per second.
b. ( )2
2126 2.7 3.5
30xh x x= − + +
which simplifies to
( ) 234 2.7 3.5225
h x x x= − + +
c. Using the velocity from part (b),
( ) ( ) ( )2349 9 2.7 9 3.5 15.56 ft225
h = − + + =
The ball will be 15.56 feet above the floor when it has traveled 9 feet in front of the foul line.
d. Select several values for x and use these to find the corresponding values for h. Use the results to form ordered pairs ( ),x h . Plot the points and connect with a smooth curve.
( ) ( ) ( )
( ) ( ) ( )
( ) ( ) ( )
2
2
2
340 0 2.7 0 3.5 3.5 ft225345 5 2.7 5 3.5 13.2 ft225
2415 15 2.7 15 3.5 10 ft225
h
h
h
= − + + =
= − + + ≈
= − + + ≈
Thus, some points on the graph are ( )0,3.5 ,
( )5,13.2 , and ( )15,10 . The complete graph is given below.
Section 3.2: The Graph of a Function
247 © 2008 Pearson Education, Inc., Upper Saddle River, NJ. All rights reserved. This material is protected under all copyright laws as they currently exist. No portion of this material may be reproduced, in any form or by any means, without permission in writing from the publisher.
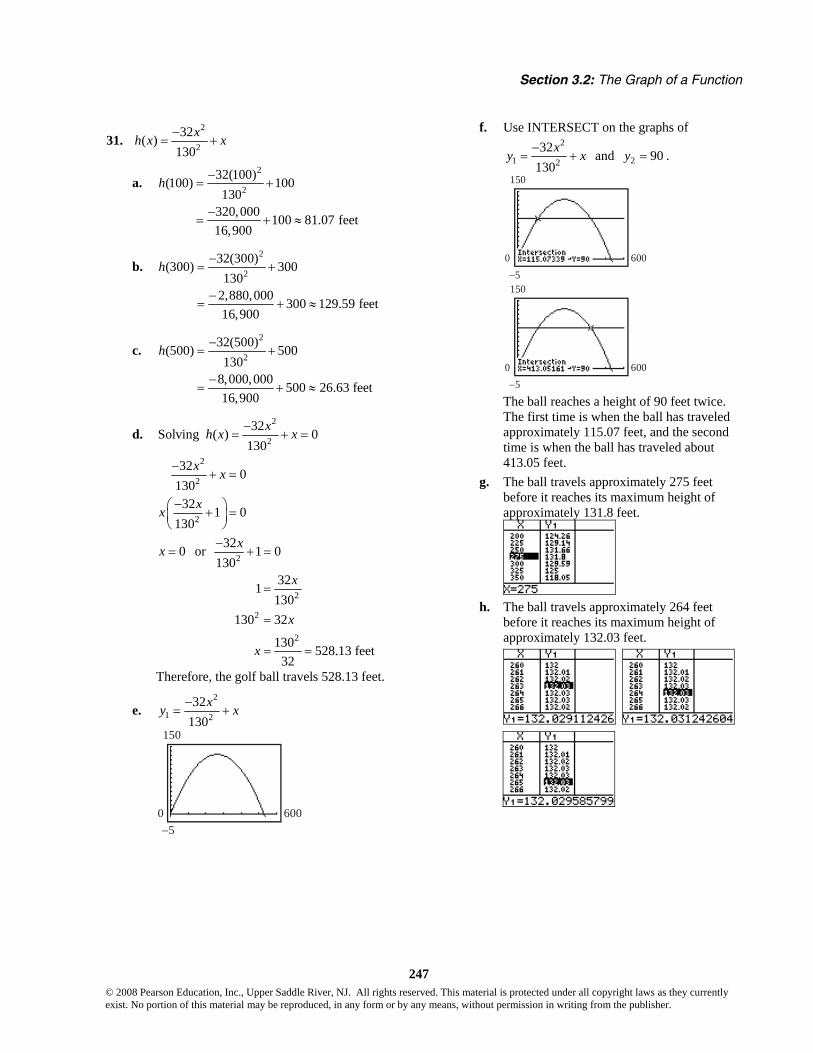
31. 2
232( )
130xh x x−
= +
a. 2
232(100)(100) 100130
320,000 100 81.07 feet16,900
h −= +
−= + ≈
b. 2
232(300)(300) 300
1302,880,000 300 129.59 feet16,900
h −= +
−= + ≈
c. 2
232(500)(500) 500
1308,000,000 500 26.63 feet16,900
h −= +
−= + ≈
d. 2
232Solving ( ) 0
130xh x x−
= + =
2
2
2
32 0130
32 1 0130
x x
xx
−+ =
−⎛ ⎞+ =⎜ ⎟⎝ ⎠
0x = or 2
2
2
2
32 1 0130
321130
130 32
130 528.13 feet32
x
x
x
x
−+ =
=
=
= =
Therefore, the golf ball travels 528.13 feet.
e. 2
1 232
130xy x−
= +
−50
150
600
f. Use INTERSECT on the graphs of 2
1 232
130xy x−
= + and 2 90y = .
−50
150
600
−50
150
600
The ball reaches a height of 90 feet twice.
The first time is when the ball has traveled approximately 115.07 feet, and the second time is when the ball has traveled about 413.05 feet.
g. The ball travels approximately 275 feet before it reaches its maximum height of approximately 131.8 feet.
h. The ball travels approximately 264 feet
before it reaches its maximum height of approximately 132.03 feet.
Chapter 3: Functions and Their Graphs
248 © 2008 Pearson Education, Inc., Upper Saddle River, NJ. All rights reserved. This material is protected under all copyright laws as they currently exist. No portion of this material may be reproduced, in any form or by any means, without permission in writing from the publisher.
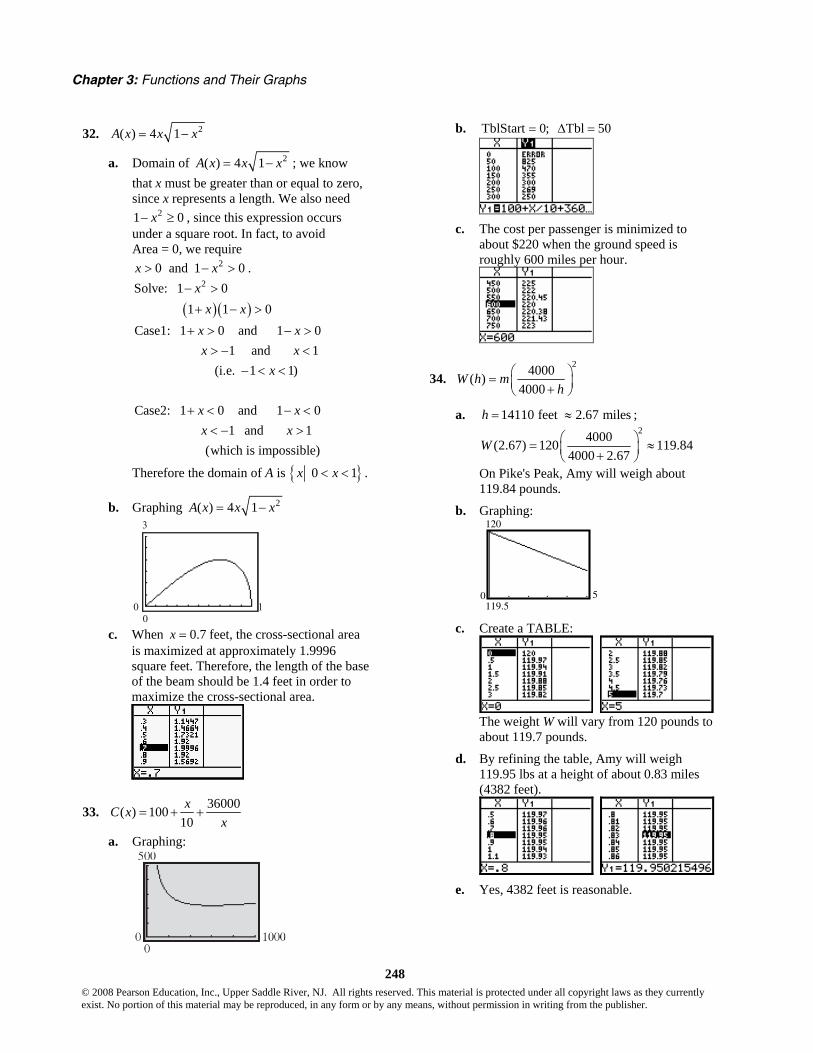
32. 2( ) 4 1A x x x= −
a. Domain of 2( ) 4 1A x x x= − ; we know that x must be greater than or equal to zero, since x represents a length. We also need
21 0x− ≥ , since this expression occurs under a square root. In fact, to avoid Area = 0, we require
20 and 1 0x x> − > .
( )( )
2Solve: 1 0 1 1 0Case1: 1 0 and 1 0 1 and 1 (i.e. 1 1)
Case2: 1 0 and 1 0
xx x
x xx x
x
x x
− >
+ − >
+ > − >> − <
− < <
+ < − <1 and 1
(which is impossible)x x< − >
Therefore the domain of A is { } 0 1x x< < .
b. Graphing 2( ) 4 1A x x x= −
0 10
3
c. When 0.7x = feet, the cross-sectional area
is maximized at approximately 1.9996 square feet. Therefore, the length of the base of the beam should be 1.4 feet in order to maximize the cross-sectional area.
33. 36000( ) 10010xC x
x= + +
a. Graphing:
b. TblStart 0; Tbl 50= Δ =
c. The cost per passenger is minimized to
about $220 when the ground speed is roughly 600 miles per hour.
34. 24000( )
4000W h m
h⎛ ⎞= ⎜ ⎟+⎝ ⎠
a. 14110 feet 2.67 milesh = ≈ ; 24000(2.67) 120 119.84
4000 2.67W ⎛ ⎞= ≈⎜ ⎟+⎝ ⎠
On Pike's Peak, Amy will weigh about 119.84 pounds.
b. Graphing:
50
120
119.5 c. Create a TABLE:
The weight W will vary from 120 pounds to about 119.7 pounds.
d. By refining the table, Amy will weigh 119.95 lbs at a height of about 0.83 miles (4382 feet).
e. Yes, 4382 feet is reasonable.

Section 3.2: The Graph of a Function
249 © 2008 Pearson Education, Inc., Upper Saddle River, NJ. All rights reserved. This material is protected under all copyright laws as they currently exist. No portion of this material may be reproduced, in any form or by any means, without permission in writing from the publisher.
35. a. ( )(2) (2) (2) 2 1 3f g f g+ = + = + =
b. ( )(4) (4) (4) 1 ( 3) 2f g f g+ = + = + − = −
c. ( )(6) (6) (6) 0 1 1f g f g− = − = − = −
d. ( )(6) (6) (6) 1 0 1g f g f− = − = − =
e. ( )(2) (2) (2) 2(1) 2f g f g⋅ = ⋅ = =
f. (4) 1 1(4)(4) 3 3
f fg g
⎛ ⎞= = = −⎜ ⎟ −⎝ ⎠
36. Answers will vary. From a graph, the domain can be found by visually locating the x-values for which the graph is defined. The range can be found in a similar fashion by visually locating the y-values for which the function is defined.
If an equation is given, the domain can be found by locating any restricted values and removing them from the set of real numbers. The range can be found by using known properties of the graph of the equation, or estimated by means of a table of values.
37. The graph of a function can have any number of x-intercepts. The graph of a function can have at most one y-intercept (otherwise the graph would fail the vertical line test).
38. Yes, the graph of a single point is the graph of a function since it would pass the vertical line test. The equation of such a function would be something like the following: ( ) 2f x = , where
7x = .
39. (a) III; (b) IV; (c) I; (d) V; (e) II
40. (a) II; (b) V; (c) IV; (d) III; (e) I
41.
42.
43. a. 2 hours elapsed; Kevin was between 0 and 3
miles from home. b. 0.5 hours elapsed; Kevin was 3 miles from
home. c. 0.3 hours elapsed; Kevin was between 0 and
3 miles from home. d. 0.2 hours elapsed; Kevin was at home. e. 0.9 hours elapsed; Kevin was between 0 and
2.8 miles from home. f. 0.3 hours elapsed; Kevin was 2.8 miles from
home. g. 1.1 hours elapsed; Kevin was between 0 and
2.8 miles from home. h. The farthest distance Kevin is from home is
3 miles. i. Kevin returned home 2 times.
44. a. Michael travels fastest between 7 and 7.4 minutes. That is, ( )7,7.4 .
b. Michael's speed is zero between 4.2 and 6 minutes. That is, ( )4.2,6 .
c. Between 0 and 2 minutes, Michael's speed increased from 0 to 30 miles/hour.
d. Between 4.2 and 6 minutes, Michael was stopped (i.e, his speed was 0 miles/hour).
e. Between 7 and 7.4 minutes, Michael was traveling at a steady rate of 50 miles/hour.
f. Michael's speed is constant between 2 and 4 minutes, between 4.2 and 6 minutes, between 7 and 7.4 minutes, and between 7.6 and 8 minutes. That is, on the intervals (2, 4), (4.2, 6), (7, 7.4), and (7.6, 8).

Chapter 3: Functions and Their Graphs
250 © 2008 Pearson Education, Inc., Upper Saddle River, NJ. All rights reserved. This material is protected under all copyright laws as they currently exist. No portion of this material may be reproduced, in any form or by any means, without permission in writing from the publisher.
45. Answers (graphs) will vary. Points of the form (5, y) and of the form (x, 0) cannot be on the graph of the function.
46. The only such function is ( ) 0f x = because it is
the only function for which ( ) ( )f x f x= − . Any other such graph would fail the vertical line test.
Section 3.3
1. 2 5x< <
2. ( )
8 3 5slope 153 2
yx
Δ −= = = =Δ − −
3. x-axis: y y→ −
( ) 2
2
2
5 1
5 1
5 1 different
y x
y x
y x
− = −
− = −
= − +
y-axis: x x→ −
( )2
2
5 1
5 1 same
y x
y x
= − −
= −
origin: x x→ − and y y→ −
( ) ( )2
2
2
5 1
5 1
5 1 different
y x
y x
y x
− = − −
− = −
= − +
The equation has symmetry with respect to the y-axis only.
4. ( )( ) ( )
( )
1 1
2 5 3
2 5 3
y y m x x
y x
y x
− = −
− − = −
+ = −
5. 2 9y x= − x-intercepts:
2
2
0 9
9 3
x
x x
= −
= → = ±
y-intercept: ( )20 9 9y = − = −
The intercepts are ( )3,0− , ( )3,0 , and ( )0, 9− .
6. increasing
7. even; odd
8. True
9. True
10. False; odd functions are symmetric with respect to the origin. Even functions are symmetric with respect to the y-axis.
11. Yes
12. No, it is increasing.
13. No, it only increases on (5, 10).
14. Yes
15. f is increasing on the intervals
( ) ( ) ( )8, 2 , 0,2 , 5,− − ∞ .
16. f is decreasing on the intervals:
( ) ( ) ( ), 8 , 2,0 , 2,5−∞ − − .
17. Yes. The local maximum at 2 is 10.x =
18. No. There is a local minimum at 5x = ; the local minimum is 0.
19. f has local maxima at 2 and 2x x= − = . The local maxima are 6 and 10, respectively.
20. f has local minima at 8, 0 and 5x x x= − = = . The local minima are –4, 0, and 0, respectively.
21. a. Intercepts: (–2, 0), (2, 0), and (0, 3).
b. Domain: { }4 4x x− ≤ ≤ or [ ]4, 4− ;
Range: { }0 3y y≤ ≤ or [ ]0, 3 .
c. Increasing: (–2, 0) and (2, 4); Decreasing: (–4, –2) and (0, 2).
d. Since the graph is symmetric with respect to the y-axis, the function is even.
22. a. Intercepts: (–1, 0), (1, 0), and (0, 2).
b. Domain: { }3 3x x− ≤ ≤ or [ ]3, 3− ;
Range: { }0 3y y≤ ≤ or [ ]0, 3 .
c. Increasing: (–1, 0) and (1, 3); Decreasing: (–3, –1) and (0, 1).
d. Since the graph is symmetric with respect to the y-axis, the function is even.

Section 3.3: Properties of Functions
251 © 2008 Pearson Education, Inc., Upper Saddle River, NJ. All rights reserved. This material is protected under all copyright laws as they currently exist. No portion of this material may be reproduced, in any form or by any means, without permission in writing from the publisher.
23. a. Intercepts: (0, 1).
b. Domain: { } is any real numberx x ;
Range: { }0y y > or ( )0, ∞ .
c. Increasing: ( , )−∞ ∞ ; Decreasing: never.
d. Since the graph is not symmetric with respect to the y-axis or the origin, the function is neither even nor odd.
24. a. Intercepts: (1, 0).
b. Domain: { }0x x > or ( )0, ∞ ;
Range: { } is any real numbery y .
c. Increasing: (0, )∞ ; Decreasing: never.
d. Since the graph is not symmetric with respect to the y-axis or the origin, the function is neither even nor odd.
25. a. Intercepts: ( ,0), ( ,0), and (0,0)−π π .
b. Domain: { }x x− π ≤ ≤ π or [ ],−π π ;
Range: { }1 1y y− ≤ ≤ or [ ]1, 1− .
c. Increasing: ,2 2π π⎛ ⎞−⎜ ⎟
⎝ ⎠;
Decreasing: , and ,2 2π π⎛ ⎞ ⎛ ⎞−π − π⎜ ⎟ ⎜ ⎟
⎝ ⎠ ⎝ ⎠.
d. Since the graph is symmetric with respect to the origin, the function is odd.
26. a. Intercepts: , 0 , , 0 , and (0, 1)2 2π π⎛ ⎞ ⎛ ⎞−⎜ ⎟ ⎜ ⎟
⎝ ⎠ ⎝ ⎠.
b. Domain: { }x x− π ≤ ≤ π or [ ],−π π ;
Range: { }1 1y y− ≤ ≤ or [ ]1, 1− .
c. Increasing: ( ), 0−π ; Decreasing: ( )0, π .
d. Since the graph is symmetric with respect to the y-axis, the function is even.
27. a. Intercepts: 1 5 1, 0 , , 0 , and 0,3 2 2
⎛ ⎞ ⎛ ⎞ ⎛ ⎞⎜ ⎟ ⎜ ⎟ ⎜ ⎟⎝ ⎠ ⎝ ⎠ ⎝ ⎠
.
b. Domain: { }3 3x x− ≤ ≤ or [ ]3, 3− ;
Range: { }1 2y y− ≤ ≤ or [ ]1, 2− .
c. Increasing: ( )2, 3 ; Decreasing: ( )1, 1− ;
Constant: ( ) ( )3, 1 and 1, 2− −
d. Since the graph is not symmetric with respect to the y-axis or the origin, the function is neither even nor odd.
28. a. Intercepts: ( ) ( ) ( )2.3, 0 , 3, 0 , and 0, 1− .
b. Domain: { }3 3x x− ≤ ≤ or [ ]3, 3− ;
Range: { }2 2y y− ≤ ≤ or [ ]2, 2− .
c. Increasing: ( ) ( )3, 2 and 0, 2− − ;
Decreasing: ( )2, 3 ; Constant: ( )2, 0− .
d. Since the graph is not symmetric with respect to the y-axis or the origin, the function is neither even nor odd.
29. a. f has a local maximum of 3 at 0.x =
b. f has a local minimum of 0 at both 2 and 2.x x= − =
30. a. f has a local maximum of 2 at 0.x =
b. f has a local minimum of 0 at both 1 and 1.x x= − =
31. a. f has a local maximum of 1 at .2
x π=
b. f has a local minimum of –1 at .2
x π= −
32. a. f has a local maximum of 1 at 0.x =
b. f has a local minimum of –1 both at x π= − and x π= .
33. 3( ) 4f x x=
( )3 3( ) 4( ) 4f x x x f x− = − = − = − Therefore, f is odd.
34. 4 2( ) 2f x x x= −
( )4 2 4 2( ) 2( ) ( ) 2f x x x x x f x− = − − − = − = Therefore, f is even.
35. 2( ) 3 5g x x= − −
( )2 2( ) 3( ) 5 3 5g x x x g x− = − − − = − − = Therefore, g is even.

Chapter 3: Functions and Their Graphs
252 © 2008 Pearson Education, Inc., Upper Saddle River, NJ. All rights reserved. This material is protected under all copyright laws as they currently exist. No portion of this material may be reproduced, in any form or by any means, without permission in writing from the publisher.
36. 3( ) 3 5h x x= + 3 3( ) 3( ) 5 3 5h x x x− = − + = − +
h is neither even nor odd.
37. 3( )F x x=
( )3 3( )F x x x F x− = − = − = − Therefore, F is odd.
38. ( )G x x=
( )G x x− = − G is neither even nor odd.
39. ( )f x x x= +
( )f x x x x x− = − + − = − + f is neither even nor odd.
40. 3 2( ) 2 1f x x= +
( )32 23( ) 2( ) 1 2 1f x x x f x− = − + = + = Therefore, f is even.
41. 21( )g xx
=
( )2 21 1( )
( )g x g x
x x− = = =
−
Therefore, g is even.
42. 2( )1
xh xx
=−
( )2 2( )( ) 1 1
x xh x h xx x− −− = = = −
− − −
Therefore, h is odd.
43. 3
2( )3 9
xh xx−=
−
( )3 3
2 2( )( )
3( ) 9 3 9x xh x h x
x x− −
− = = = −− − −
Therefore, h is odd.
44. 2( ) xF xx
=
( )22( )( ) xxF x F xx x
−−− = = = −
−
Therefore, F is odd.
45. ( ) 3 3 2f x x x= − + on the interval ( )2, 2− Use MAXIMUM and MINIMUM on the graph of 3
1 3 2y x x= − + .
local maximum at: ( )1, 4− ;
local minimum at: ( )1,0
f is increasing on: ( ) ( )2, 1 and 1, 2− − ;
f is decreasing on: ( )1,1−
46. ( ) 3 23 5f x x x= − + on the interval ( )1,3− Use MAXIMUM and MINIMUM on the graph of 3 2
1 3 5y x x= − + .
local maximum at: ( )0,5 ;
local minimum at: ( )2,1
f is increasing on: ( ) ( )1,0 and 2,3− ;
f is decreasing on: ( )0, 2
Section 3.3: Properties of Functions
253 © 2008 Pearson Education, Inc., Upper Saddle River, NJ. All rights reserved. This material is protected under all copyright laws as they currently exist. No portion of this material may be reproduced, in any form or by any means, without permission in writing from the publisher.
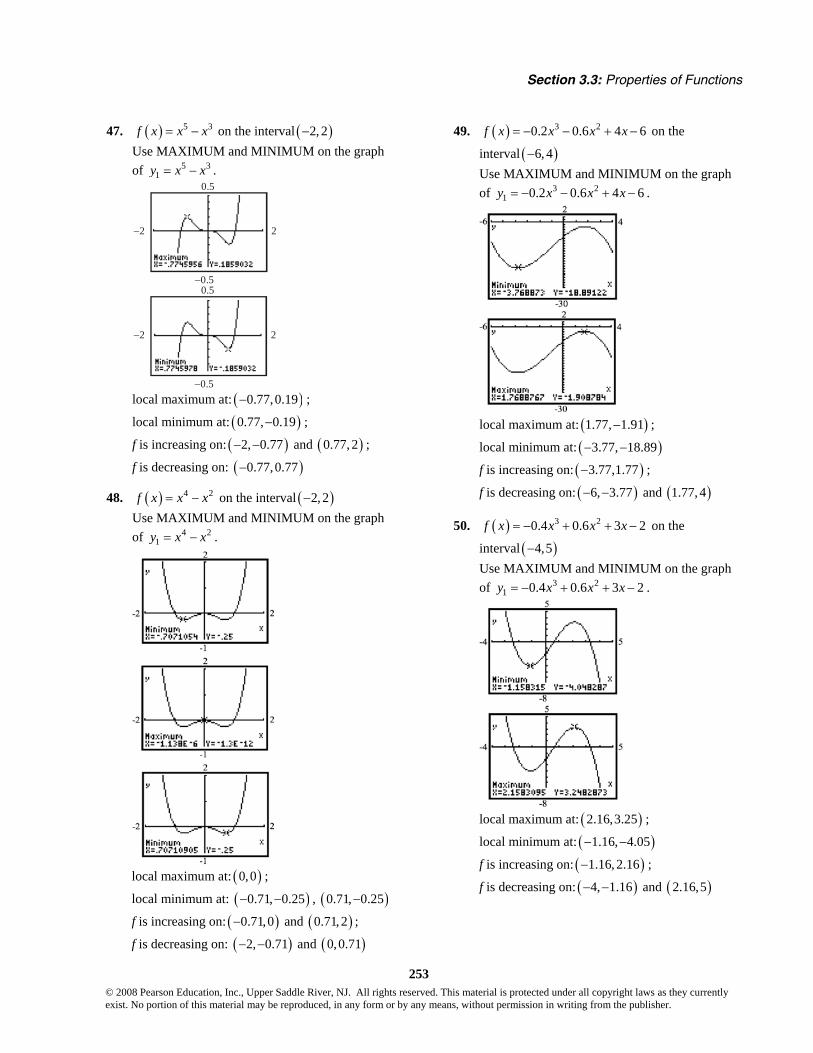
47. ( ) 5 3f x x x= − on the interval ( )2, 2− Use MAXIMUM and MINIMUM on the graph of 5 3
1y x x= − .
−0.5
0.5
−2 2
−0.5
0.5
−2 2
local maximum at: ( )0.77,0.19− ;
local minimum at: ( )0.77, 0.19− ;
f is increasing on: ( ) ( )2, 0.77 and 0.77, 2− − ;
f is decreasing on: ( )0.77,0.77−
48. ( ) 4 2f x x x= − on the interval ( )2, 2− Use MAXIMUM and MINIMUM on the graph of 4 2
1y x x= − .
local maximum at: ( )0,0 ;
local minimum at: ( )0.71, 0.25− − , ( )0.71, 0.25−
f is increasing on: ( ) ( )0.71,0 and 0.71,2− ;
f is decreasing on: ( ) ( )2, 0.71 and 0,0.71− −
49. ( ) 3 20.2 0.6 4 6f x x x x= − − + − on the
interval ( )6, 4− Use MAXIMUM and MINIMUM on the graph of 3 2
1 0.2 0.6 4 6y x x x= − − + − .
local maximum at: ( )1.77, 1.91− ;
local minimum at: ( )3.77, 18.89− −
f is increasing on: ( )3.77,1.77− ;
f is decreasing on: ( ) ( )6, 3.77 and 1.77, 4− −
50. ( ) 3 20.4 0.6 3 2f x x x x= − + + − on the
interval ( )4,5− Use MAXIMUM and MINIMUM on the graph of 3 2
1 0.4 0.6 3 2y x x x= − + + − .
local maximum at: ( )2.16,3.25 ;
local minimum at: ( )1.16, 4.05− −
f is increasing on: ( )1.16, 2.16− ;
f is decreasing on: ( ) ( )4, 1.16 and 2.16,5− −
Chapter 3: Functions and Their Graphs
254 © 2008 Pearson Education, Inc., Upper Saddle River, NJ. All rights reserved. This material is protected under all copyright laws as they currently exist. No portion of this material may be reproduced, in any form or by any means, without permission in writing from the publisher.
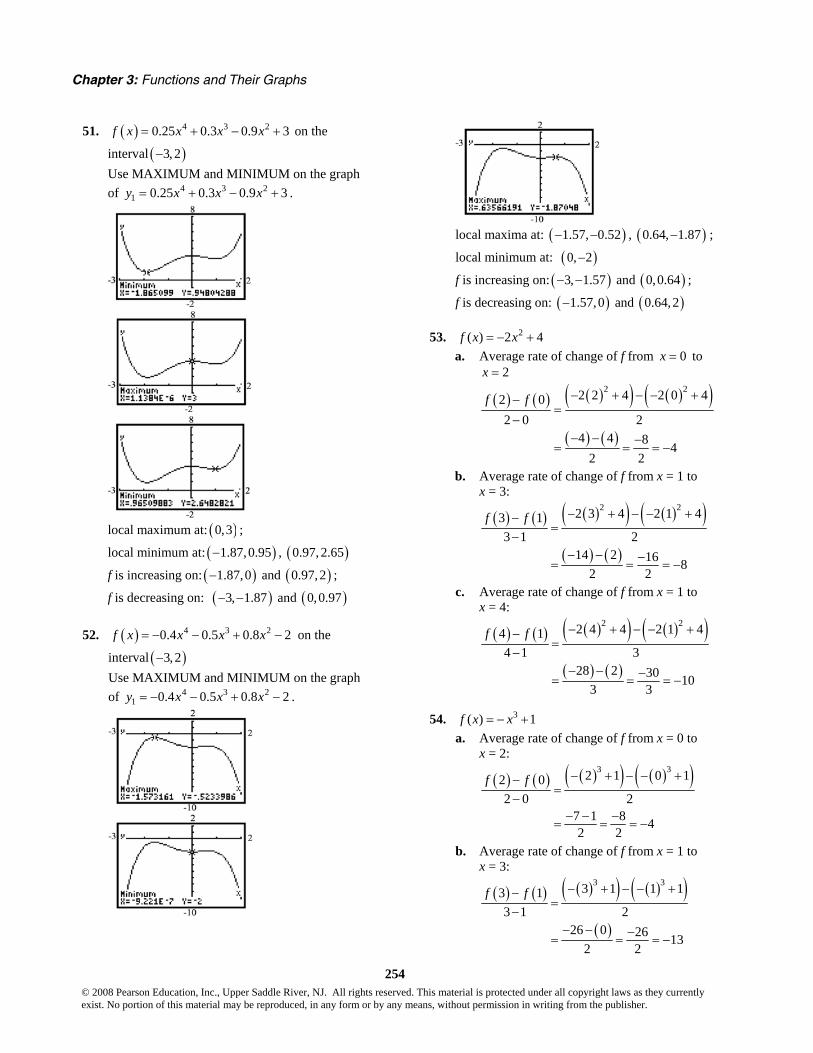
51. ( ) 4 3 20.25 0.3 0.9 3f x x x x= + − + on the
interval ( )3,2− Use MAXIMUM and MINIMUM on the graph of 4 3 2
1 0.25 0.3 0.9 3y x x x= + − + .
local maximum at: ( )0,3 ;
local minimum at: ( )1.87,0.95− , ( )0.97, 2.65
f is increasing on: ( ) ( )1.87,0 and 0.97,2− ;
f is decreasing on: ( ) ( )3, 1.87 and 0,0.97− −
52. ( ) 4 3 20.4 0.5 0.8 2f x x x x= − − + − on the
interval ( )3,2− Use MAXIMUM and MINIMUM on the graph of 4 3 2
1 0.4 0.5 0.8 2y x x x= − − + − .
local maxima at: ( )1.57, 0.52− − , ( )0.64, 1.87− ;
local minimum at: ( )0, 2−
f is increasing on: ( ) ( )3, 1.57 and 0,0.64− − ;
f is decreasing on: ( ) ( )1.57,0 and 0.64,2−
53. 2( ) 2 4f x x= − + a. Average rate of change of f from 0x = to
2x =
( ) ( ) ( )( ) ( )( )( ) ( )
2 22 2 4 2 0 42 02 0 2
4 4 8 42 2
f f − + − − +−=
−− − −
= = = −
b. Average rate of change of f from x = 1 to x = 3:
( ) ( ) ( )( ) ( )( )( ) ( )
2 22 3 4 2 1 43 13 1 2
14 2 16 82 2
f f − + − − +−=
−− − −= = = −
c. Average rate of change of f from x = 1 to x = 4:
( ) ( ) ( )( ) ( )( )( ) ( )
2 22 4 4 2 1 44 14 1 3
28 2 30 103 3
f f − + − − +−=
−− − −= = = −
54. 3( ) 1f x x= − + a. Average rate of change of f from x = 0 to
x = 2:
( ) ( ) ( )( ) ( )( )3 32 1 0 12 02 0 2
7 1 8 42 2
f f − + − − +−=
−− − −= = = −
b. Average rate of change of f from x = 1 to x = 3:
( ) ( ) ( )( ) ( )( )( )
3 33 1 1 13 13 1 2
26 0 26 132 2
f f − + − − +−=
−− − −= = = −
Section 3.3: Properties of Functions
255 © 2008 Pearson Education, Inc., Upper Saddle River, NJ. All rights reserved. This material is protected under all copyright laws as they currently exist. No portion of this material may be reproduced, in any form or by any means, without permission in writing from the publisher.
c. Average rate of change of f from x = –1 to x = 1:
( ) ( )( )
( )( ) ( )( )3 31 1 1 11 121 1
0 2 2 12 2
f f − + − − − +− −=
− −
− −= = = −
55. ( ) 3 2 1g x x x= − +
a. Average rate of change of g from 3x = − to 2x = − :
( ) ( )( )
( ) ( ) ( ) ( )
( ) ( )
3 3
2 32 3
2 2 2 1 3 2 3 1
13 20 17 17
1 1
g g− − −− − −
⎡ ⎤ ⎡ ⎤− − − + − − − − +⎣ ⎦ ⎣ ⎦=
− − −= = =
b. Average rate of change of g from 1x = − to 1x = :
( ) ( )( )
( ) ( ) ( ) ( )
( ) ( )
3 3
1 11 1
1 2 1 1 1 2 1 1
20 2 2 1
2 2
g g− −− −
⎡ ⎤ ⎡ ⎤− + − − − − +⎣ ⎦ ⎣ ⎦=
− −= = = −
c. Average rate of change of g from 1x = to 3x = :
( ) ( )
( ) ( ) ( ) ( )
( ) ( )
3 3
3 13 1
3 2 3 1 1 2 1 1
222 0 22 11
2 2
g g−−
⎡ ⎤ ⎡ ⎤− + − − +⎣ ⎦ ⎣ ⎦=
−= = =
56. ( ) 2 2 3h x x x= − +
a. Average rate of change of h from 1x = − to 1x = :
( ) ( )( )
( ) ( ) ( ) ( )
( ) ( )
2 2
1 11 1
1 2 1 3 1 2 1 3
22 6 4 2
2 2
h h− −− −
⎡ ⎤ ⎡ ⎤− + − − − − +⎣ ⎦ ⎣ ⎦=
− −= = = −
b. Average rate of change of h from 0x = to 2x = :
( ) ( )
( ) ( ) ( ) ( )
( ) ( )
2 2
2 02 0
2 2 2 3 0 2 0 3
23 3 0 0
2 2
h h−−
⎡ ⎤ ⎡ ⎤− + − − +⎣ ⎦ ⎣ ⎦=
−= = =
c. Average rate of change of h from 2x = to 5x = :
( ) ( )
( ) ( ) ( ) ( )
( ) ( )
2 2
5 25 2
5 2 5 3 2 2 2 3
318 3 15 5
3 3
h h−−
⎡ ⎤ ⎡ ⎤− + − − +⎣ ⎦ ⎣ ⎦=
−= = =
57. ( ) 5 2f x x= − a. Average rate of change of f from 1 to 3:
( ) ( )3 1 13 3 10 53 1 3 1 2
f fyx
−Δ −= = = =Δ − −
Thus, the average rate of change of f from 1 to 3 is 5.
b. From (a), the slope of the secant line joining ( )( )1, 1f and ( )( )3, 3f is 5. We use the
point-slope form to find the equation of the secant line:
( )( )
1 sec 1
3 5 13 5 5
5 2
y y m x x
y xy x
y x
− = −
− = −
− = −= −
58. ( ) 4 1f x x= − +
a. Average rate of change of f from 2 to 5: ( ) ( ) ( )5 2 19 7
5 2 5 212 43
f fyx
− − − −Δ= =
Δ − −−= = −
Therefore, the average rate of change of f from 2 to 5 is 4− .

Chapter 3: Functions and Their Graphs
256 © 2008 Pearson Education, Inc., Upper Saddle River, NJ. All rights reserved. This material is protected under all copyright laws as they currently exist. No portion of this material may be reproduced, in any form or by any means, without permission in writing from the publisher.
b. From (a), the slope of the secant line joining ( )( )2, 2f and ( )( )5, 5f is 4− . We use the
point-slope form to find the equation of the secant line:
( )( ) ( )
1 sec 1
7 4 27 4 8
4 1
y y m x x
y xy x
y x
− = −
− − = − −
+ = − += − +
59. ( ) 2 2g x x= − a. Average rate of change of g from 2− to 1:
( ) ( )( ) ( )
1 2 1 2 3 131 2 1 2
g gyx
− −Δ − − −= = = = −Δ − − − −
Therefore, the average rate of change of g from 2− to 1 is 1− .
b. From (a), the slope of the secant line joining ( )( )2, 2g− − and ( )( )1, 1g is 1− .We use the
point-slope form to find the equation of the secant line:
( )( )( )
1 sec 1
2 1 2
2 2
y y m x x
y x
y xy x
− = −
− = − − −
− = − −= −
60. ( ) 2 1g x x= + a. Average rate of change of g from 1− to 2:
( ) ( )( ) ( )
2 1 5 2 3 132 1 2 1
g gyx
− −Δ −= = = =Δ − − − −
Therefore, the average rate of change of g from 1− to 2 is 1.
b. From (a), the slope of the secant line joining ( )( )1, 1g− − and ( )( )2, 2g is 1. We use the
point-slope form to find the equation of the secant line:
( )( )( )
1 sec 1
2 1 12 1
3
y y m x xy xy x
y x
− = −
− = − −
− = += +
61. ( ) 2 2h x x x= − a. Average rate of change of h from 2 to 4:
( ) ( )4 2 8 0 8 44 2 4 2 2
h hyx
−Δ −= = = =Δ − −
Therefore, the average rate of change of h from 2 to 4 is 4.
b. From (a), the slope of the secant line joining ( )( )2, 2h and ( )( )4, 4h is 4. We use the
point-slope form to find the equation of the secant line:
( )( )
1 sec 1
0 4 24 8
y y m x x
y xy x
− = −
− = −
= −
62. ( ) 22h x x x= − + a. Average rate of change from 0 to 3:
( ) ( )3 0 15 03 0 3 0
15 53
h hyx
−Δ − −= =Δ − −
−= = −
Therefore, the average rate of change of h from 0 to 3 is 5− .
b. From (a), the slope of the secant line joining ( )0, (0)h and ( )3, (3)h is 5− . We use the point-slope form to find the equation of the secant line:
( )( )
1 sec 1
0 5 05
y y m x x
y xy x
− = −
− = − −
= −
63. a. length = 24 2x− ; width = 24 2x− ; height = x
2( ) (24 2 )(24 2 ) (24 2 )V x x x x x x= − − = −
b. 2 2(3) 3(24 2(3)) 3(18)3(324) 972 cu.in.
V = − == =
c. 2 2(10) 10(24 2(10)) 10(4)10(16) 160 cu.in.
V = − == =
d. 21 (24 2 )y x x= −
120
1100
0 Use MAXIMUM.
0 12
1100
0 The volume is largest when 4x = inches.

Section 3.3: Properties of Functions
257 © 2008 Pearson Education, Inc., Upper Saddle River, NJ. All rights reserved. This material is protected under all copyright laws as they currently exist. No portion of this material may be reproduced, in any form or by any means, without permission in writing from the publisher.
64. a. Let amount of materialA = , length of the basex = , heighth = , and volumeV = .
22
1010V x h hx
= = ⇒ =
( ) ( )( )
( )
base side2
22
2
2
Total Area Area 4 Area
4104
40
40
A
x xh
x xx
xx
A x xx
= +
= +
⎛ ⎞= + ⎜ ⎟⎝ ⎠
= +
= +
b. ( ) 2 2401 1 1 40 41 ft1
A = + = + =
c. ( ) 2 2402 2 4 20 24 ft2
A = + = + =
d. 21
40y xx
= +
100
100
0
0 10
100
0 The amount of material is least when
2.71x = ft.
65. a. 2( ) 16 80 6s t t t= − + +
00
6
110
b. Use MAXIMUM. The maximum height occurs when 2.5 seconds.t =
0 6
110
0 c. From the graph, the maximum height is 106
feet.
66. a. ( ) 217.28 100y s t t t= = − +
0 8
200
−25 b. Use the Maximum option on the CALC
menu.
0 8
200
−25 The object reaches its maximum height after about 2.89 seconds.
c. From the graph in part (b), the maximum height is about 144.68 feet.
d. ( ) 216 100s t t t= − +
0 8
200
−25 On Earth, the object would reach a maximum height of 156.25 feet after 3.125 seconds. The maximum height is slightly higher than on Saturn.
Chapter 3: Functions and Their Graphs
258 © 2008 Pearson Education, Inc., Upper Saddle River, NJ. All rights reserved. This material is protected under all copyright laws as they currently exist. No portion of this material may be reproduced, in any form or by any means, without permission in writing from the publisher.
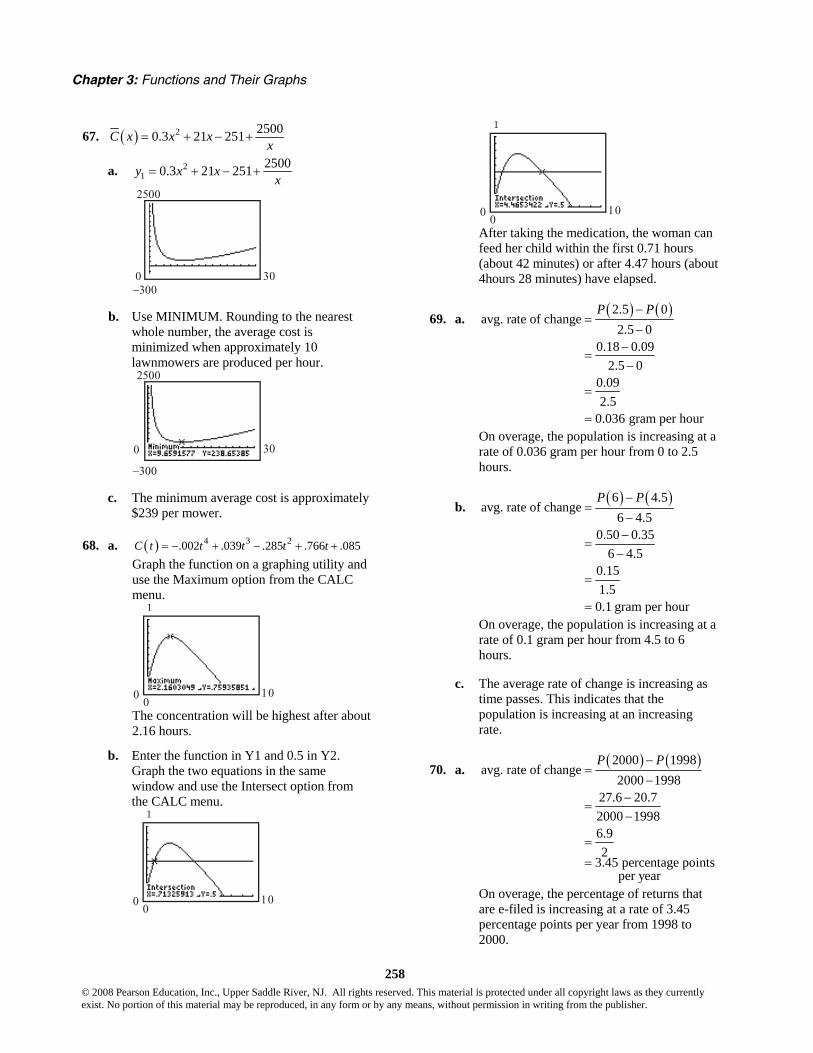
67. ( ) 2 25000.3 21 251C x x xx
= + − +
a. 21
25000.3 21 251y x xx
= + − +
0 30
2500
−300
b. Use MINIMUM. Rounding to the nearest whole number, the average cost is minimized when approximately 10 lawnmowers are produced per hour.
0 30
2500
−300
c. The minimum average cost is approximately $239 per mower.
68. a. ( ) 4 3 2.002 .039 .285 .766 .085C t t t t t= − + − + + Graph the function on a graphing utility and use the Maximum option from the CALC menu.
100
0
1
The concentration will be highest after about 2.16 hours.
b. Enter the function in Y1 and 0.5 in Y2. Graph the two equations in the same window and use the Intersect option from the CALC menu.
100
0
1
100
0
1
After taking the medication, the woman can feed her child within the first 0.71 hours (about 42 minutes) or after 4.47 hours (about 4hours 28 minutes) have elapsed.
69. a. ( ) ( )2.5 0avg. rate of change
2.5 00.18 0.09
2.5 00.092.5
0.036 gram per hour
P P−=
−−
=−
=
=
On overage, the population is increasing at a rate of 0.036 gram per hour from 0 to 2.5 hours.
b. ( ) ( )6 4.5avg. rate of change
6 4.50.50 0.35
6 4.50.151.5
0.1 gram per hour
P P−=
−−
=−
=
=
On overage, the population is increasing at a rate of 0.1 gram per hour from 4.5 to 6 hours.
c. The average rate of change is increasing as time passes. This indicates that the population is increasing at an increasing rate.
70. a. ( ) ( )2000 1998
avg. rate of change2000 1998
27.6 20.72000 19986.92
3.45 percentage points per year
P P−=
−−
=−
=
=
On overage, the percentage of returns that are e-filed is increasing at a rate of 3.45 percentage points per year from 1998 to 2000.
Section 3.3: Properties of Functions
259 © 2008 Pearson Education, Inc., Upper Saddle River, NJ. All rights reserved. This material is protected under all copyright laws as they currently exist. No portion of this material may be reproduced, in any form or by any means, without permission in writing from the publisher.
b. ( ) ( )2003 2001
avg. rate of change2003 2001
40.2 30.72003 20019.52
4.75 percentage points per year
P P−=
−−
=−
=
=
On overage, the percentage of returns that are e-filed is increasing at a rate of 4.75 percentage points per year from 2001 to 2003.
c. ( ) ( )2006 2004
avg. rate of change2006 2004
57.1 46.52006 200410.6
25.3 percentage points
per year
P P−=
−−
=−
=
=
On overage, the percentage of returns that are e-filed is increasing at a rate of 5.3 percentage points per year from 2004 to 2006.
d. The average rate of change is increasing as time passes. This indicates that the percentage of e-filers is increasing at an increasing rate.
71. 2( )f x x=
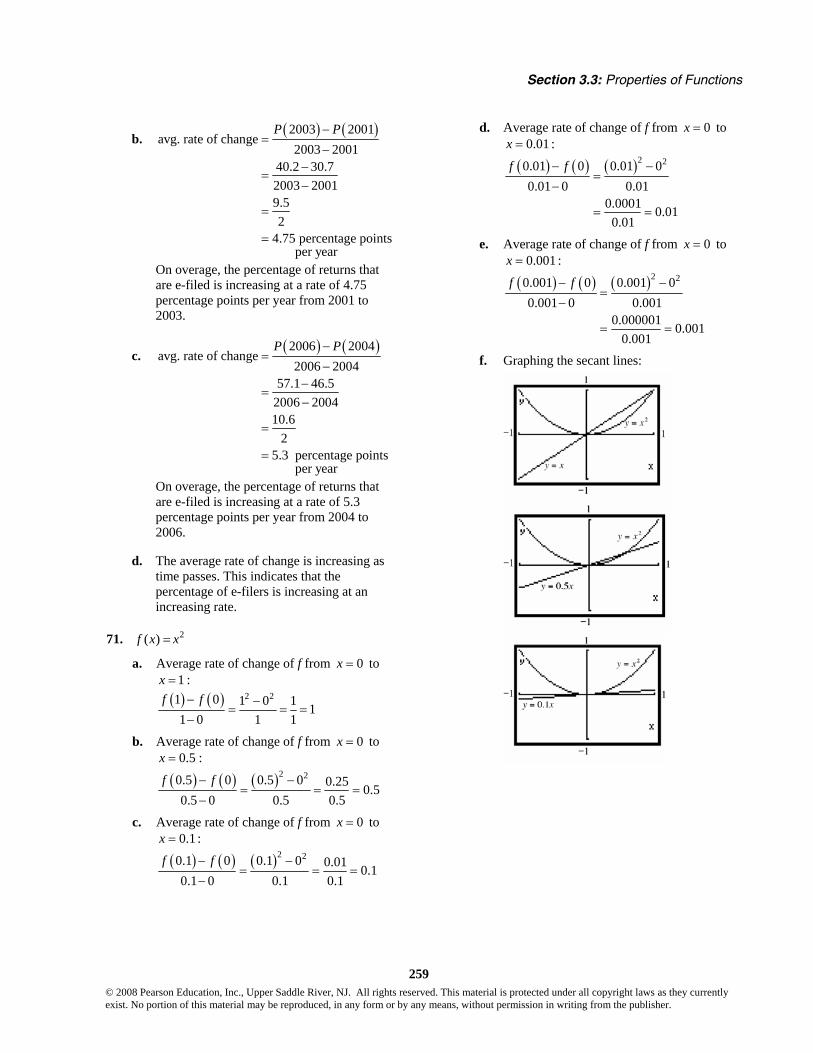
a. Average rate of change of f from 0x = to 1x = :
( ) ( ) 2 21 0 1 0 1 11 0 1 1
f f− −= = =
−
b. Average rate of change of f from 0x = to 0.5x = :
( ) ( ) ( )2 20.5 0 0.5 0 0.25 0.50.5 0 0.5 0.5
f f− −= = =
−
c. Average rate of change of f from 0x = to 0.1x = :
( ) ( ) ( )2 20.1 0 0.1 0 0.01 0.10.1 0 0.1 0.1
f f− −= = =
−
d. Average rate of change of f from 0x = to 0.01x = :
( ) ( ) ( )2 20.01 0 0.01 00.01 0 0.01
0.0001 0.010.01
f f− −=
−
= =
e. Average rate of change of f from 0x = to 0.001x = :
( ) ( ) ( )2 20.001 0 0.001 00.001 0 0.001
0.000001 0.0010.001
f f− −=
−
= =
f. Graphing the secant lines:
Chapter 3: Functions and Their Graphs
260 © 2008 Pearson Education, Inc., Upper Saddle River, NJ. All rights reserved. This material is protected under all copyright laws as they currently exist. No portion of this material may be reproduced, in any form or by any means, without permission in writing from the publisher.
g. The secant lines are beginning to look more
and more like the tangent line to the graph of f at the point where 0x = .
h. The slopes of the secant lines are getting smaller and smaller. They seem to
be
approaching the number zero.
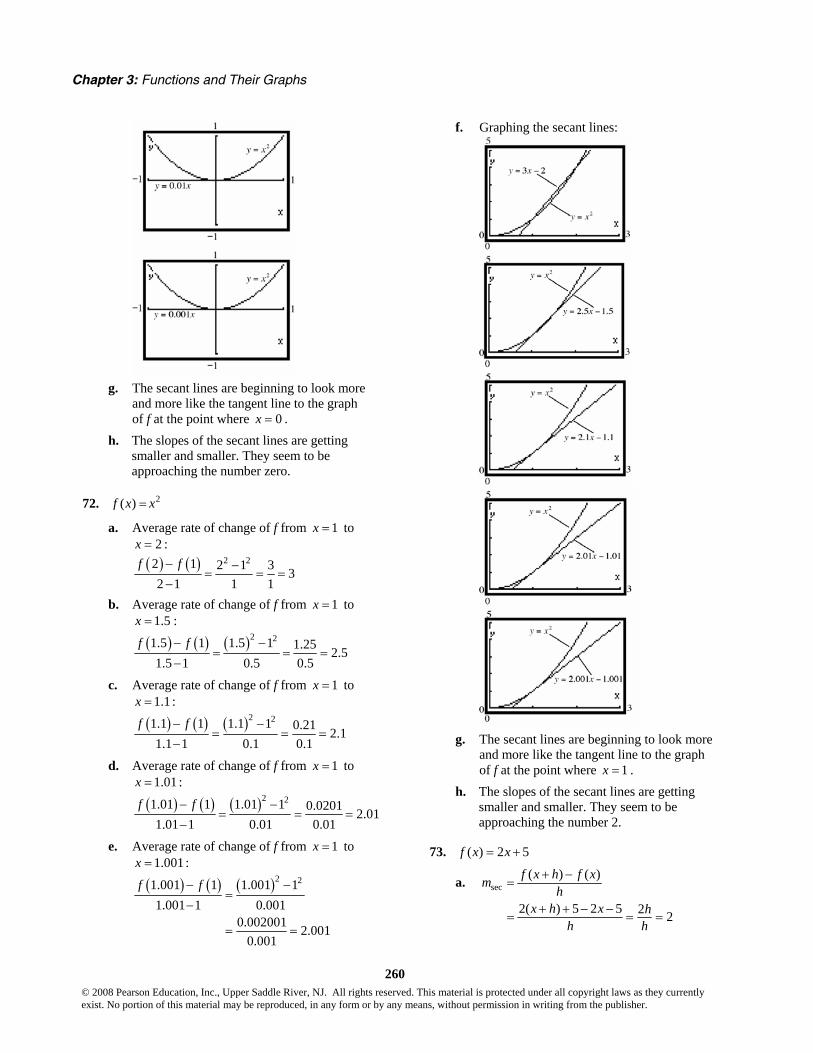
72. 2( )f x x=
a. Average rate of change of f from 1x = to 2x = :
( ) ( ) 2 22 1 2 1 3 32 1 1 1
f f− −= = =
− b. Average rate of change of f from 1x = to
1.5x = :
( ) ( ) ( )2 21.5 1 1.5 1 1.25 2.51.5 1 0.5 0.5
f f− −= = =
−
c. Average rate of change of f from 1x = to 1.1x = :
( ) ( ) ( )2 21.1 1 1.1 1 0.21 2.1
1.1 1 0.1 0.1f f− −
= = =−
d. Average rate of change of f from 1x = to 1.01x = :
( ) ( ) ( )2 21.01 1 1.01 1 0.0201 2.01
1.01 1 0.01 0.01f f− −
= = =−
e. Average rate of change of f from 1x = to 1.001x = :
( ) ( ) ( )2 21.001 1 1.001 1
1.001 1 0.0010.002001 2.001
0.001
f f− −=
−
= =
f. Graphing the secant lines:
g. The secant lines are beginning to look more and more like the tangent line to the graph of f at the point where 1x = .
h. The slopes of the secant lines are getting smaller and smaller. They seem to be approaching the number 2.
73. ( ) 2 5f x x= +
a. sec( ) ( )
2( ) 5 2 5 2 2
f x h f xmh
x h x hh h
+ −=
+ + − −= = =

Section 3.3: Properties of Functions
261 © 2008 Pearson Education, Inc., Upper Saddle River, NJ. All rights reserved. This material is protected under all copyright laws as they currently exist. No portion of this material may be reproduced, in any form or by any means, without permission in writing from the publisher.
b. When 1x = : sec0.5 2h m= ⇒ = sec0.1 2h m= ⇒ =
sec0.01 2h m= ⇒ = secas 0, 2h m→ →
c. Using the point ( )( ) ( )1, 1 1,7f = and slope, 2m = , we get the secant line:
( )7 2 17 2 2
2 5
y xy x
y x
− = −
− = −= +
d. Graphing:
The graph and the secant line coincide.
74. ( ) 3 2f x x= − +
a. sec( ) ( )
3( ) 2 ( 3 2) 3 3
f x h f xmh
x h x hh h
+ −=
− + + − − + −= = = −
b. When x = 1, sec0.5 3h m= ⇒ = − sec0.1 3h m= ⇒ = −
sec0.01 3h m= ⇒ = − secas 0, 3h m→ → −
c. Using point ( )( ) ( )1, 1 1, 1f = − and slope = 3− , we get the secant line:
( ) ( )1 3 11 3 3
3 2
y xy x
y x
− − = − −
+ = − += − +
d. Graphing:
The graph and the secant line coincide.
75. 2( ) 2f x x x= +
a. sec
2 2
2 2 2
2
( ) ( )
( ) 2( ) ( 2 )
2 2 2 2
2 2
2 2
f x h f xmh
x h x h x xh
x xh h x h x xh
xh h hh
x h
+ −=
+ + + − +=
+ + + + − −=
+ +=
= + +
b. When x = 1, sec0.5 2 1 0.5 2 4.5h m= ⇒ = ⋅ + + =
sec0.1 2 1 0.1 2 4.1h m= ⇒ = ⋅ + + =
sec0.01 2 1 0.01 2 4.01h m= ⇒ = ⋅ + + =
secas 0, 2 1 0 2 4h m→ → ⋅ + + =
c. Using point ( )( ) ( )1, 1 1,3f = and slope = 4.01, we get the secant line:
( )3 4.01 13 4.01 4.01
4.01 1.01
y xy x
y x
− = −
− = −= −
d. Graphing:
76. 2( ) 2f x x x= +
a. sec( ) ( )f x h f xm
h+ −
=
2 2
2 2 2
2 2 2
2
2( ) ( ) (2 )
2( 2 ) 2
2 4 2 2
4 2
4 2 1
x h x h x xh
x xh h x h x xh
x xh h x h x xh
xh h hh
x h
+ + + − +=
+ + + + − −=
+ + + + − −=
+ +=
= + +

Chapter 3: Functions and Their Graphs
262 © 2008 Pearson Education, Inc., Upper Saddle River, NJ. All rights reserved. This material is protected under all copyright laws as they currently exist. No portion of this material may be reproduced, in any form or by any means, without permission in writing from the publisher.
b. When x = 1, ( )sec0.5 4 1 2 0.5 1 6h m= ⇒ = ⋅ + + =
( )sec0.1 4 1 2 0.1 1 5.2h m= ⇒ = ⋅ + + =
( )sec0.01 4 1 2 0.01 1 5.02h m= ⇒ = ⋅ + + =
( )secas 0, 4 1 2 0 1 5h m→ → ⋅ + + =
c. Using point ( )( ) ( )1, 1 1,3f = and slope = 5.02, we get the secant line:
( )3 5.02 13 5.02 5.02
5.02 2.02
y xy x
y x
− = −
− = −= −
d. Graphing:
77. 2( ) 2 3 1f x x x= − +
a. sec( ) ( )f x h f xm
h+ −
=
( ) ( ) ( )2 2 2
2 2 2
2 2
2
2( 2 ) 3 3 1 2 3 1
2 4 2 3 3 1 2 3 1
2 3 1 2 3 1
4 2 3
4 2 3
x xh h x h x xh
x xh h x h x xh
x h x h x xh
xh h hh
x h
+ + − − + − + −=
+ + − − + − + −=
+ − + + − − +=
+ −=
= + −
b. When x = 1, ( )sec0.5 4 1 2 0.5 3 2h m= ⇒ = ⋅ + − = ( )sec0.1 4 1 2 0.1 3 1.2h m= ⇒ = ⋅ + − =
( )sec0.01 4 1 2 0.01 3 1.02h m= ⇒ = ⋅ + − = ( )secas 0, 4 1 2 0 3 1h m→ → ⋅ + − =
c. Using point ( )( ) ( )1, 1 1,0f = and slope = 1.02, we get the secant line:
( )0 1.02 11.02 1.02
y xy x
− = −
= −
d. Graphing:
78. 2( ) 3 2f x x x= − + −
a. sec( ) ( )f x h f xm
h+ −
=
( ) ( ) ( )2 2 2
2 2 2
2 2
2
( 2 ) 3 3 2 3 2
2 3 3 2 3 2
3 2 3 2
2 3
2 3
x xh h x h x xh
x xh h x h x xh
x h x h x xh
xh h hh
x h
− + + + + − + − +=
− − − + + − + − +=
− + + + − − − + −=
− − +=
= − − +
b. When x = 1, sec0.5 2 1 0.5 3 0.5h m= ⇒ = − ⋅ − + =
sec0.1 2 1 0.1 3 0.9h m= ⇒ = − ⋅ − + =
sec0.01 2 1 0.01 3 0.99h m= ⇒ = − ⋅ − + =
secas 0, 2 1 0 3 1h m→ → − ⋅ − + =
c. Using point ( )( ) ( )1, 1 1,0f = and slope = 0.99, we get the secant line:
( )0 0.99 10.99 0.99
y xy x
− = −
= −
d. Graphing:

Section 3.3: Properties of Functions
263 © 2008 Pearson Education, Inc., Upper Saddle River, NJ. All rights reserved. This material is protected under all copyright laws as they currently exist. No portion of this material may be reproduced, in any form or by any means, without permission in writing from the publisher.
79. 1( )f xx
=
a.
( )( )
( ) ( )
( )
sec( ) ( )
1 1
1 1
1
f x h f xmh
x x hx h xx h x
h hx x h h
h hx h x x h x
x h x
+ −=
− +⎛ ⎞⎛ ⎞ ⎜ ⎟−⎜ ⎟ ++⎝ ⎠ ⎝ ⎠= =
⎛ ⎞ ⎛ ⎞− − −⎛ ⎞ ⎛ ⎞= =⎜ ⎟ ⎜ ⎟⎜ ⎟ ⎜ ⎟+ +⎝ ⎠ ⎝ ⎠⎝ ⎠ ⎝ ⎠
= −+
b. When x = 1,
0.5h = ⇒( )( )sec
11 0.5 11 2 0.667
1.5 3
m = −+
= − = − ≈ −
0.1h = ⇒( )( )sec
11 0.1 11 10 0.909
1.1 11
m = −+
= − = − ≈ −
0.01h = ⇒( )( )sec
11 0.01 11 100 0.990
1.01 101
m = −+
= − = − ≈ −
as 0, h →( )( )sec
1 1 111 0 1
m → − = − = −+
c. Using point ( )( ) ( )1, 1 1,1f = and
slope = 100101
− , we get the secant line:
( )1001 1101100 1001101 101100 201101 101
y x
y x
y x
− = − −
− = − +
= − +
d. Graphing:
80. 21( )f xx
=
a.
( )
sec
2 2
( ) ( )
1 1
f x h f xmh
xx hh
+ −=
⎛ ⎞⎜ ⎟−⎜ ⎟+⎝ ⎠=
( )( )
( )( )
( )
( ) ( )
22
2 2
2 2 2
2 2
2
2 2
2 2 2 22
2 1
2 1
2 22
x x h
x h xh
x x xh hhx h x
xh hhx h x
x h x hx xh h xx h x
⎛ ⎞− +⎜ ⎟⎜ ⎟+⎝ ⎠=
⎛ ⎞− + + ⎛ ⎞⎜ ⎟= ⎜ ⎟⎜ ⎟⎝ ⎠+⎝ ⎠⎛ ⎞− − ⎛ ⎞⎜ ⎟= ⎜ ⎟⎜ ⎟⎝ ⎠+⎝ ⎠
− − − −= =+ ++
b. When x = 1,
( )sec 2 2
2 1 0.5 100.5 1.111191 0.5 1
h m − ⋅ −= ⇒ = = − ≈ −+
( )sec 2 2
2 1 0.1 2100.1 1.73551211 0.1 1
h m − ⋅ −= ⇒ = = − ≈ −+
( )sec 2 2
2 1 0.010.011 0.01 120,100 1.970410, 201
h m − ⋅ −= ⇒ =+
= − ≈ −
( )sec 2 2
2 1 0as 0, 21 0 1
h m − ⋅ −→ → = −+
c. Using point ( )( ) ( )1, 1 1,1f = and slope = 1.9704− , we get the secant line:
( )1 1.9704 11 1.9704 1.9704
1.9704 2.9704
y xy x
y x
− = − −
− = − += − +
d. Graphing:

Chapter 3: Functions and Their Graphs
264 © 2008 Pearson Education, Inc., Upper Saddle River, NJ. All rights reserved. This material is protected under all copyright laws as they currently exist. No portion of this material may be reproduced, in any form or by any means, without permission in writing from the publisher.
81. Answers will vary. One possibility follows:
−2 4
−5
y
2
(0, 3)−
(3, 0)
(2, 6)−
( 1, 2)− −
82. Answers will vary. See solution to Problem 81 for one possibility.
83. A function that is increasing on an interval can have at most one x-intercept on the interval. The graph of f could not "turn" and cross it again or it would start to decrease.
84. An increasing function is a function whose graph goes up as you read from left to right.
5
−5
y
−3 3
A decreasing function is a function whose graph goes down as you read from left to right.
5
−5
y
−3 3
85. To be an even function we need ( ) ( )f x f x− = and to be an odd function we need
( ) ( )f x f x− = − . In order for a function be both
even and odd, we would need ( ) ( )f x f x= − .
This is only possible if ( ) 0f x = .
86. The graph of 5y = is a horizontal line.
The local maximum is 5y = and it occurs at
each x-value in the interval. Section 3.4
1. y = x
2. y =1x
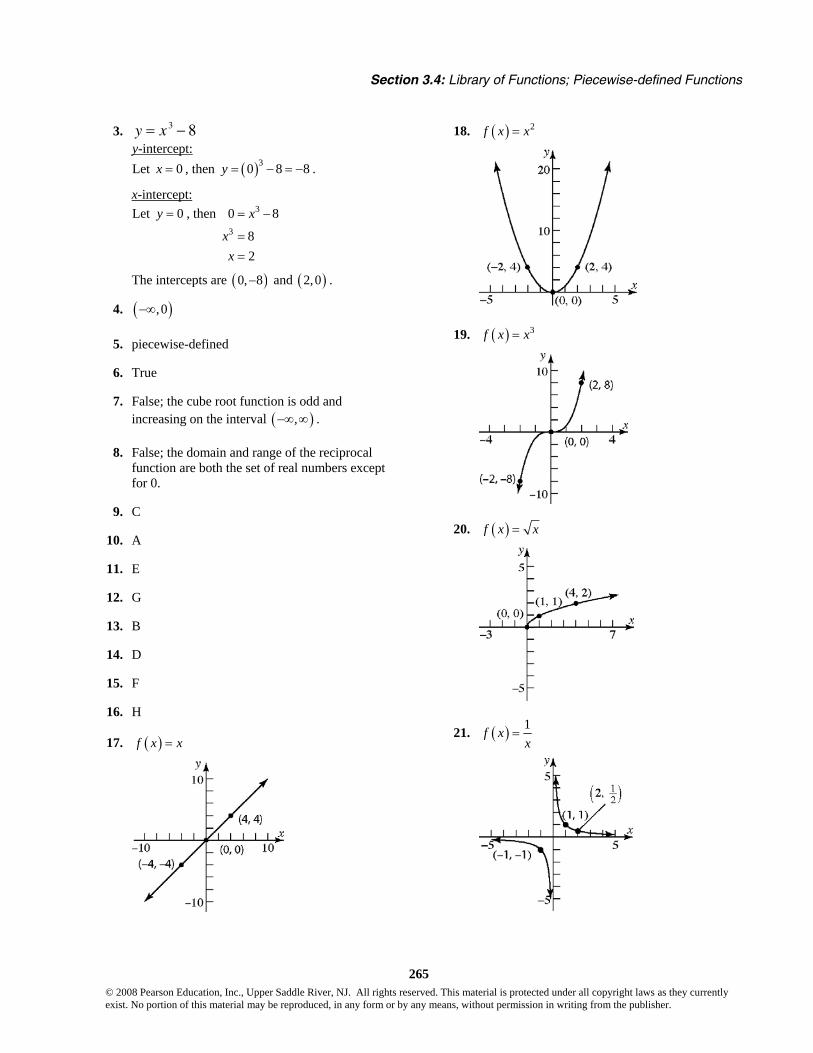
Section 3.4: Library of Functions; Piecewise-defined Functions
265 © 2008 Pearson Education, Inc., Upper Saddle River, NJ. All rights reserved. This material is protected under all copyright laws as they currently exist. No portion of this material may be reproduced, in any form or by any means, without permission in writing from the publisher.
3. y = x 3 − 8 y-intercept: Let 0x = , then ( )30 8 8y = − = − .
x-intercept: Let 0y = , then 3
3
0 8
82
x
xx
= −
==
The intercepts are ( )0, 8− and ( )2,0 .
4. ( ),0−∞
5. piecewise-defined
6. True
7. False; the cube root function is odd and increasing on the interval ( ),−∞ ∞ .
8. False; the domain and range of the reciprocal function are both the set of real numbers except for 0.
9. C
10. A
11. E
12. G
13. B
14. D
15. F
16. H
17. ( )f x x=
18. ( ) 2f x x=
19. ( ) 3f x x=
20. ( )f x x=
21. ( ) 1f xx
=
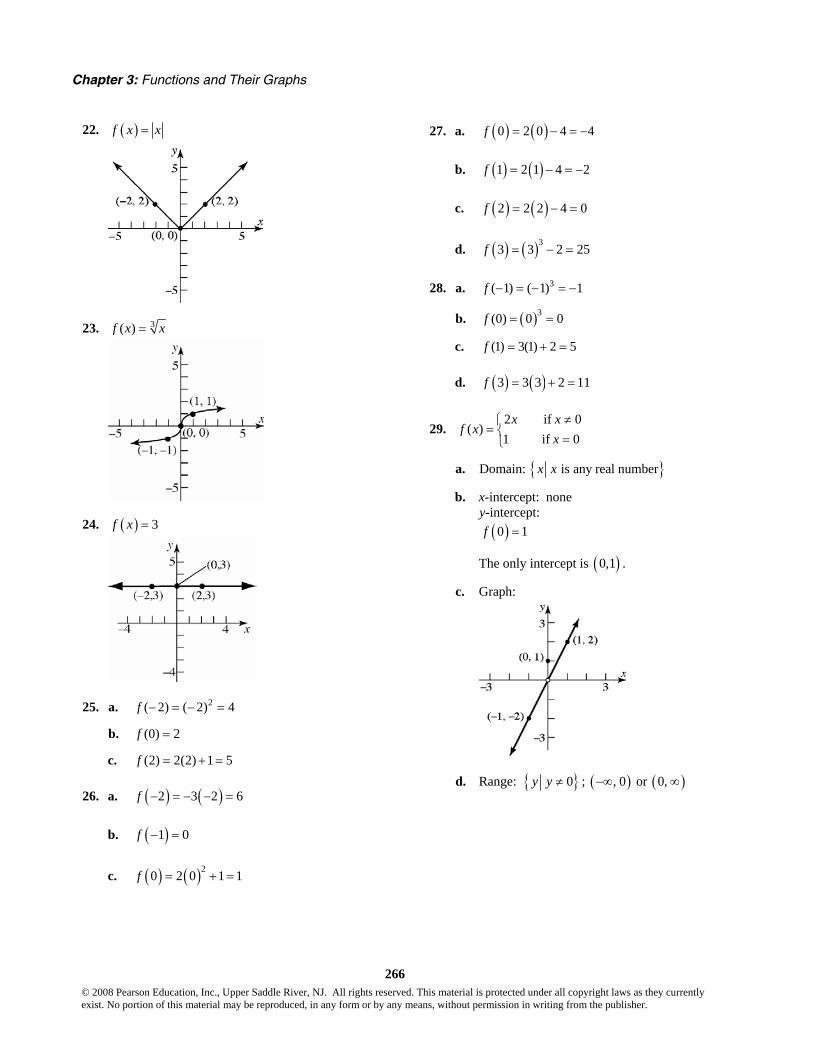
Chapter 3: Functions and Their Graphs
266 © 2008 Pearson Education, Inc., Upper Saddle River, NJ. All rights reserved. This material is protected under all copyright laws as they currently exist. No portion of this material may be reproduced, in any form or by any means, without permission in writing from the publisher.
22. ( )f x x=
23. 3( )f x x=
24. ( ) 3f x =
25. a. 2( 2) ( 2) 4f − = − =
b. (0) 2f =
c. (2) 2(2) 1 5f = + =
26. a. ( ) ( )2 3 2 6f − = − − =
b. ( )1 0f − =
c. ( ) ( )20 2 0 1 1f = + =
27. a. ( ) ( )0 2 0 4 4f = − = −
b. ( ) ( )1 2 1 4 2f = − = −
c. ( ) ( )2 2 2 4 0f = − =
d. ( ) ( )33 3 2 25f = − =
28. a. 3( 1) ( 1) 1f − = − = −
b. ( )3(0) 0 0f = =
c. (1) 3(1) 2 5f = + =
d. ( ) ( )3 3 3 2 11f = + =
29. 2 if 0
( )1 if 0
x xf x
x≠⎧
= ⎨ =⎩
a. Domain: { }is any real numberx x
b. x-intercept: none y-intercept:
( )0 1f =
The only intercept is ( )0,1 .
c. Graph:
d. Range: { }0y y ≠ ; ( ) ( ), 0 or 0,−∞ ∞

Section 3.4: Library of Functions; Piecewise-defined Functions
267 © 2008 Pearson Education, Inc., Upper Saddle River, NJ. All rights reserved. This material is protected under all copyright laws as they currently exist. No portion of this material may be reproduced, in any form or by any means, without permission in writing from the publisher.
30. 3 if 0
( )4 if 0x x
f xx
≠⎧= ⎨ =⎩
a. Domain: { } is any real numberx x
b. x-intercept: none y-intercept: ( )0 4f =
The only intercept is ( )0,4 .
c. Graph:
5
−5
y
5−5
(0, 4)(1, 3)
(−1, −3)
d. Range: { }0y y ≠ ; ( ) ( ), 0 or 0,−∞ ∞
31. 2 3 if 1
( )3 2 if 1
x xf x
x x− + <⎧
= ⎨ − ≥⎩
a. Domain: { } is any real numberx x
b. x-intercept: none y-intercept: ( ) ( )0 2 0 3 3f = − + =
The only intercept is ( )0,3 .
c. Graph:
d. Range: { }1y y ≥ ; [ )1, ∞
32. 3 if 2
( )2 3 if 2
x xf x
x x+ < −⎧
= ⎨− − ≥ −⎩
a. Domain: { } is any real numberx x
b. 3 03
xx
+ == −
2 3 02 3
32
xx
x
− − =− =
= −
x-intercepts: 33,2
− −
y-intercept: ( ) ( )0 2 0 3 3f = − − = −
The intercepts are ( )3,0− , 3 ,02
⎛ ⎞−⎜ ⎟
⎝ ⎠, and
( )0, 3− .
c. Graph:
d. Range: { }1y y ≤ ; ( ], 1−∞
33. 3 if 2 1
( ) 5 if 12 if 1
x xf x x
x x
+ − ≤ <⎧⎪= =⎨⎪− + >⎩
a. Domain: { }2x x ≥ − ; [ )2,− ∞
b. 3 03
(not in domain)
xx
+ == −
2 02
2
xxx
− + =− = −
=
x-intercept: 2
y-intercept: ( )0 0 3 3f = + =
The intercepts are ( )2,0 and ( )0,3 .

Chapter 3: Functions and Their Graphs
268 © 2008 Pearson Education, Inc., Upper Saddle River, NJ. All rights reserved. This material is protected under all copyright laws as they currently exist. No portion of this material may be reproduced, in any form or by any means, without permission in writing from the publisher.
c. Graph:
d. Range: { }4 and 5y y y< = ;
( ) { }, 4 5−∞ ∪
34. 2 5 if 3 0
( ) 3 if 05 if 0
x xf x x
x x
+ − ≤ <⎧⎪= − =⎨⎪− >⎩
a. Domain: { }3x x ≥ − ; [ )3,− ∞
b. 2 5 02 5
52
xx
x
+ == −
= −
5 00
(not in domain of piece)
xx− =
=
x-intercept: 52
−
y-intercept: ( )0 3f = −
The intercepts are 5 ,02
⎛ ⎞−⎜ ⎟
⎝ ⎠ and ( )0, 3− .
c. Graph:
d. Range: { }5y y < ; ( ), 5−∞
35. 21 if 0
( )if 0
x xf x
x x+ <⎧= ⎨ ≥⎩
a. Domain: { }is any real numberx x
b. 1 01
xx
+ == −
2 00
xx
==
x-intercepts: 1,0−
y-intercept: ( ) 20 0 0f = =
The intercepts are ( )1,0− and ( )0,0 .
c. Graph:
d. Range: { }is any real numbery y
36. 3
1 if 0( )
if 0
xxf xx x
⎧ <⎪= ⎨⎪ ≥⎩
a. Domain: { }is any real numberx x
b. 1 0
(no solution)x
= 3 00
xx
==
x-intercept: 0
y-intercept: ( ) 30 0 0f = =
The only intercept is ( )0,0 .
c. Graph:
d. Range: { }is any real numbery y

Section 3.4: Library of Functions; Piecewise-defined Functions
269 © 2008 Pearson Education, Inc., Upper Saddle River, NJ. All rights reserved. This material is protected under all copyright laws as they currently exist. No portion of this material may be reproduced, in any form or by any means, without permission in writing from the publisher.
37. 3
if 2 0( )
if 0
x xf x
x x
⎧ − ≤ <⎪= ⎨>⎪⎩
a. Domain: { }2 0 and 0x x x− ≤ < > or
{ }| 2, 0x x x≥ − ≠ ; ) ( )2,0 0,− ∪ ∞⎡⎣ .
b. x-intercept: none There are no x-intercepts since there are no values for x such that ( ) 0f x = .
y-intercept: There is no y-intercept since 0x = is not in the domain.
c. Graph:
d. Range: { }0y y > ; ( )0, ∞
38. 2 if 3 1
( ) if 1
x xf x
x x
− − ≤ <⎧⎪= ⎨>⎪⎩
a. Domain: { }3 1 and 1x x x− ≤ < > or
{ }| 3, 1x x x≥ − ≠ ; ) ( )3,1 1,− ∪ ∞⎡⎣ .
b. 2 02
xx
− ==
00
(not in domain of piece)
xx
==
no x-intercepts
y-intercept: ( )0 2 0 2f = − =
The intercept is ( )0, 2 .
c. Graph: y
5
x−5 5
−5
( 3, 5)−
(0, 2)(4, 2)
d. Range: { }1y y > ; ( )1,∞
39. ( ) 2int( )f x x=
a. Domain: { } is any real numberx x
b. x-intercepts: All values for x such that 0 1.x≤ <
y-intercept: ( ) ( )0 2int 0 0f = =
The intercepts are all ordered pairs ( ,0)x when 0 1.x≤ <
c. Graph:
d. Range: { } is an even integery y
40. ( ) int(2 )f x x=
a. Domain: { } is any real numberx x
b. x-intercepts:
All values for x such that 10 .2
x≤ <
y-intercept: ( ) ( )( ) ( )0 int 2 0 int 0 0f = = =
The intercepts are all ordered pairs ( , 0)x
when 10 .2
x≤ <
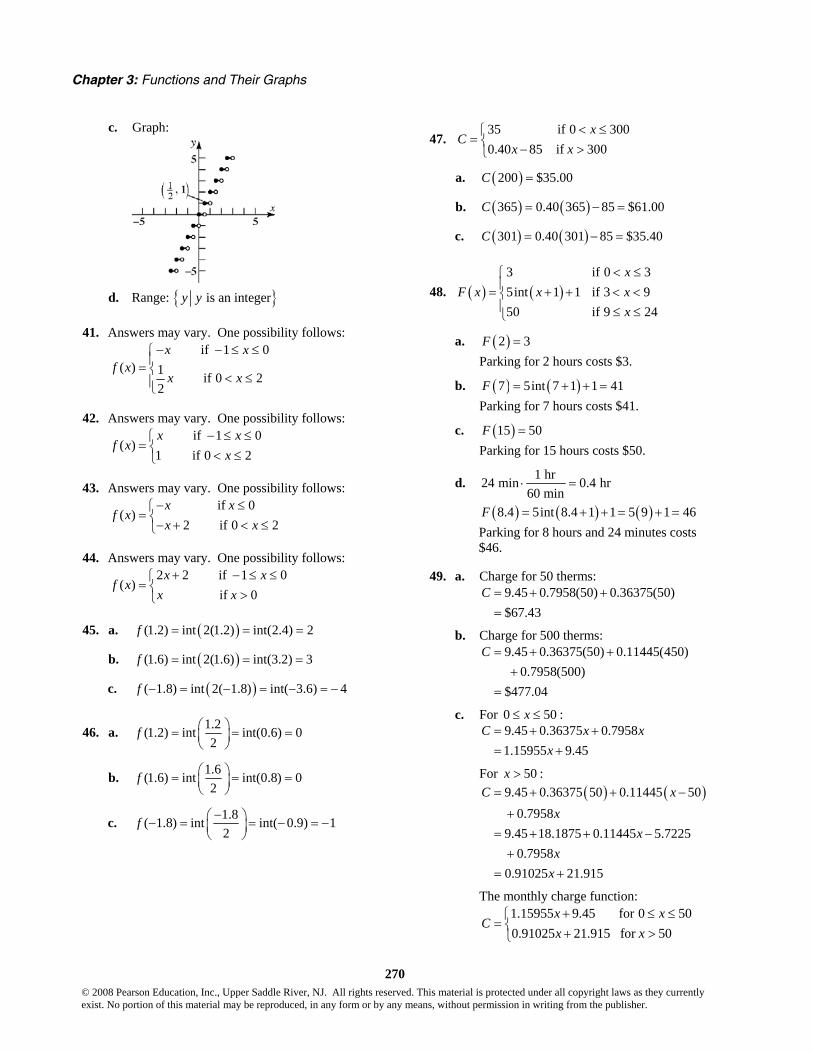
Chapter 3: Functions and Their Graphs
270 © 2008 Pearson Education, Inc., Upper Saddle River, NJ. All rights reserved. This material is protected under all copyright laws as they currently exist. No portion of this material may be reproduced, in any form or by any means, without permission in writing from the publisher.
c. Graph:
d. Range: { } is an integery y
41. Answers may vary. One possibility follows: if 1 0
( ) 1 if 0 22
x xf x
x x
− − ≤ ≤⎧⎪= ⎨
< ≤⎪⎩
42. Answers may vary. One possibility follows: if 1 0
( )1 if 0 2x x
f xx
− ≤ ≤⎧= ⎨ < ≤⎩
43. Answers may vary. One possibility follows: if 0
( )2 if 0 2
x xf x
x x− ≤⎧
= ⎨− + < ≤⎩
44. Answers may vary. One possibility follows: 2 2 if 1 0
( ) if 0
x xf x
x x+ − ≤ ≤⎧
= ⎨ >⎩
45. a. ( )(1.2) int 2(1.2) int(2.4) 2f = = =
b. ( )(1.6) int 2(1.6) int(3.2) 3f = = =
c. ( )( 1.8) int 2( 1.8) int( 3.6) 4f − = − = − = −
46. a. 1.2(1.2) int int(0.6) 02
f ⎛ ⎞= = =⎜ ⎟⎝ ⎠
b. 1.6(1.6) int int(0.8) 02
f ⎛ ⎞= = =⎜ ⎟⎝ ⎠
c. 1.8( 1.8) int int( 0.9) 12
f −⎛ ⎞− = = − = −⎜ ⎟⎝ ⎠
47. 35 if 0 3000.40 85 if 300
xC
x x< ≤⎧
= ⎨ − >⎩
a. ( )200 $35.00C =
b. ( ) ( )365 0.40 365 85 $61.00C = − =
c. ( ) ( )301 0.40 301 85 $35.40C = − =
48. ( ) ( )3 if 0 35int 1 1 if 3 950 if 9 24
xF x x x
x
< ≤⎧⎪= + + < <⎨⎪ ≤ ≤⎩
a. ( )2 3F = Parking for 2 hours costs $3.
b. ( ) ( )7 5int 7 1 1 41F = + + = Parking for 7 hours costs $41.
c. ( )15 50F = Parking for 15 hours costs $50.
d. 1 hr24 min 0.4 hr60 min
⋅ =
( ) ( ) ( )8.4 5int 8.4 1 1 5 9 1 46F = + + = + = Parking for 8 hours and 24 minutes costs $46.
49. a. Charge for 50 therms: 9.45 0.7958(50) 0.36375(50)$67.43
C = + +=
b. Charge for 500 therms: 9.45 0.36375(50) 0.11445(450)
0.7958(500)$477.04
C = + ++
=
c. For 0 50x≤ ≤ : 9.45 0.36375 0.79581.15955 9.45
C x xx
= + += +
For 50x > : ( ) ( )9.45 0.36375 50 0.11445 50
0.79589.45 18.1875 0.11445 5.7225
0.79580.91025 21.915
C xx
xx
x
= + + −
+= + + −
+= +
The monthly charge function: 1.15955 9.45 for 0 500.91025 21.915 for 50
x xC
x x+ ≤ ≤⎧
= ⎨ + >⎩
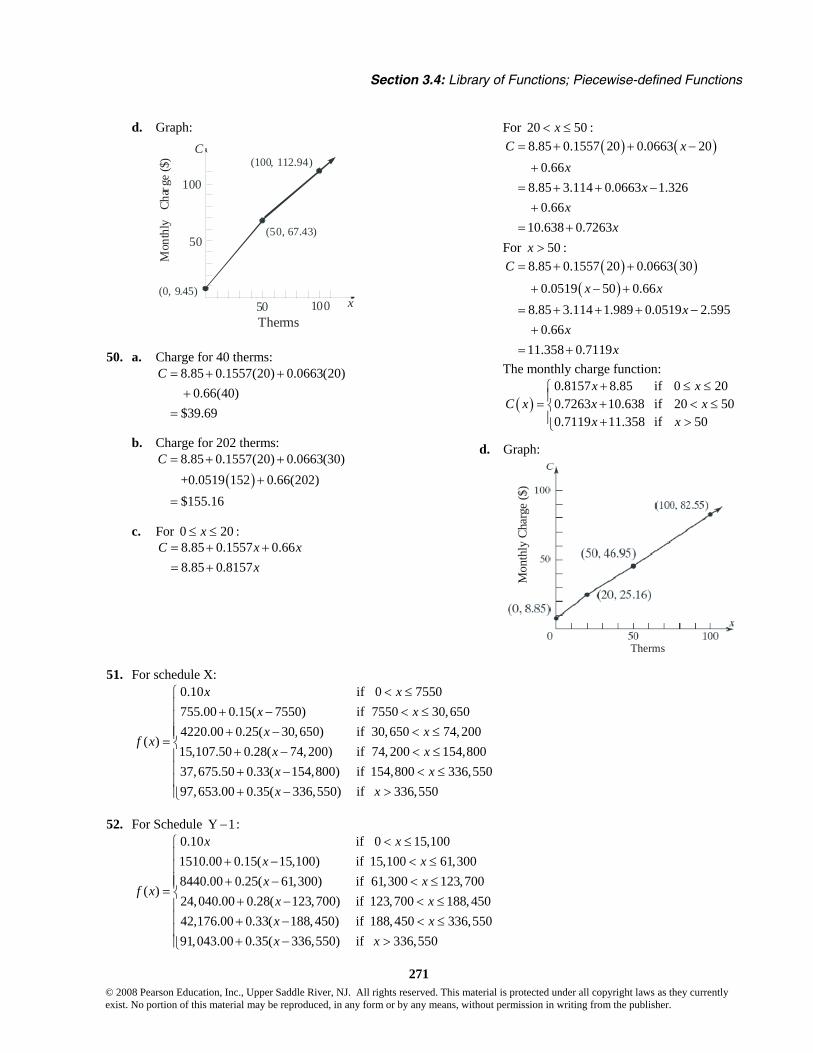
Section 3.4: Library of Functions; Piecewise-defined Functions
271 © 2008 Pearson Education, Inc., Upper Saddle River, NJ. All rights reserved. This material is protected under all copyright laws as they currently exist. No portion of this material may be reproduced, in any form or by any means, without permission in writing from the publisher.
d. Graph:
C
x50 100
50
100
(0, 9.45)
(100, 112.94)
(50, 67.43)
Mon
thly
Ch
arge
($)
Therms
50. a. Charge for 40 therms: 8.85 0.1557(20) 0.0663(20)
0.66(40)$39.69
C = + ++
=
b. Charge for 202 therms:
( )8.85 0.1557(20) 0.0663(30)
+0.0519 152 0.66(202)$155.16
C = + +
+
=
c. For 0 20x≤ ≤ : 8.85 0.1557 0.668.85 0.8157
C x xx
= + += +
For 20 50x< ≤ : ( ) ( )8.85 0.1557 20 0.0663 20
0.668.85 3.114 0.0663 1.326
0.6610.638 0.7263
C xx
xx
x
= + + −
+= + + −
+= +
For 50x > : ( ) ( )
( )8.85 0.1557 20 0.0663 30
0.0519 50 0.668.85 3.114 1.989 0.0519 2.595
0.6611.358 0.7119
C
x xx
xx
= + +
+ − +
= + + + −+
= +
The monthly charge function:
( )0.8157 8.85 if 0 200.7263 10.638 if 20 500.7119 11.358 if 50
x xC x x x
x x
+ ≤ ≤⎧⎪= + < ≤⎨⎪ + >⎩
d. Graph:
Mon
thly
Cha
rge
($)
Therms
51. For schedule X: 0.10 if 0 7550755.00 0.15( 7550) if 7550 30,6504220.00 0.25( 30,650) if 30,650 74,200
( )15,107.50 0.28( 74,200) if 74, 200 154,80037,675.50 0.33( 154,800) if 154,800 336,55097,653.00
x xx x
x xf x
x xx x
< ≤+ − < ≤
+ − < ≤=
+ − < ≤+ − < ≤
0.35( 336,550) if 336,550x x
⎧⎪⎪⎪⎪⎨⎪⎪⎪
+ − >⎪⎩
52. For Schedule Y 1− : 0.10 if 0 15,1001510.00 0.15( 15,100) if 15,100 61,3008440.00 0.25( 61,300) if 61,300 123,700
( )24,040.00 0.28( 123,700) if 123,700 188, 45042,176.00 0.33( 188, 450) if 188,450 336,55
x xx xx x
f xx xx x
< ≤+ − < ≤+ − < ≤
=+ − < ≤+ − < ≤ 0
91,043.00 0.35( 336,550) if 336,550x x
⎧⎪⎪⎪⎪⎨⎪⎪⎪
+ − >⎪⎩

Chapter 3: Functions and Their Graphs
272 © 2008 Pearson Education, Inc., Upper Saddle River, NJ. All rights reserved. This material is protected under all copyright laws as they currently exist. No portion of this material may be reproduced, in any form or by any means, without permission in writing from the publisher.
53. a. Let x represent the number of miles and C be the cost of transportation. 0.50 if 0 1000.50(100) 0.40( 100) if 100 400
( )0.50(100) 0.40(300) 0.25( 400) if 400 8000.50(100) 0.40(300) 0.25(400) 0( 800) if 800 960
x xx x
C xx x
x x
≤ ≤⎧⎪ + − < ≤⎪= ⎨ + + − < ≤⎪⎪ + + + − < ≤⎩
0.50 if 0 10010 0.40 if 100 400
( )70 0.25 if 400 800270 if 800 960
x xx x
C xx x
x
≤ ≤⎧⎪ + < ≤⎪= ⎨ + < ≤⎪⎪ < ≤⎩
b. For hauls between 100 and 400 miles the cost is: ( ) 10 0.40C x x= + .
c. For hauls between 400 and 800 miles the cost is: ( ) 70 0.25C x x= + .
54. Let x = number of days car is used. The cost of renting is given by
( )
95 if 7119 if 7 8143 if 8 9167 if 9 10190 if 10 14
xx
C x xxx
=⎧⎪ < ≤⎪⎪= < ≤⎨⎪ < ≤⎪
< ≤⎪⎩
Days of Rental
Cos
t (do
llars
)
55. Let x = the amount of the bill in dollars. The minimum payment due is given by
( )
if 1010 if 10 50030 if 500 100050 if 1000 150070 if 1500
x xx
f x xx
x
<⎧⎪ ≤ <⎪⎪= ≤ <⎨⎪ ≤ <⎪
≥⎪⎩
Amount of Bill (dollars)
Min
imum
Pay
men
t Due
(dol
lars
)
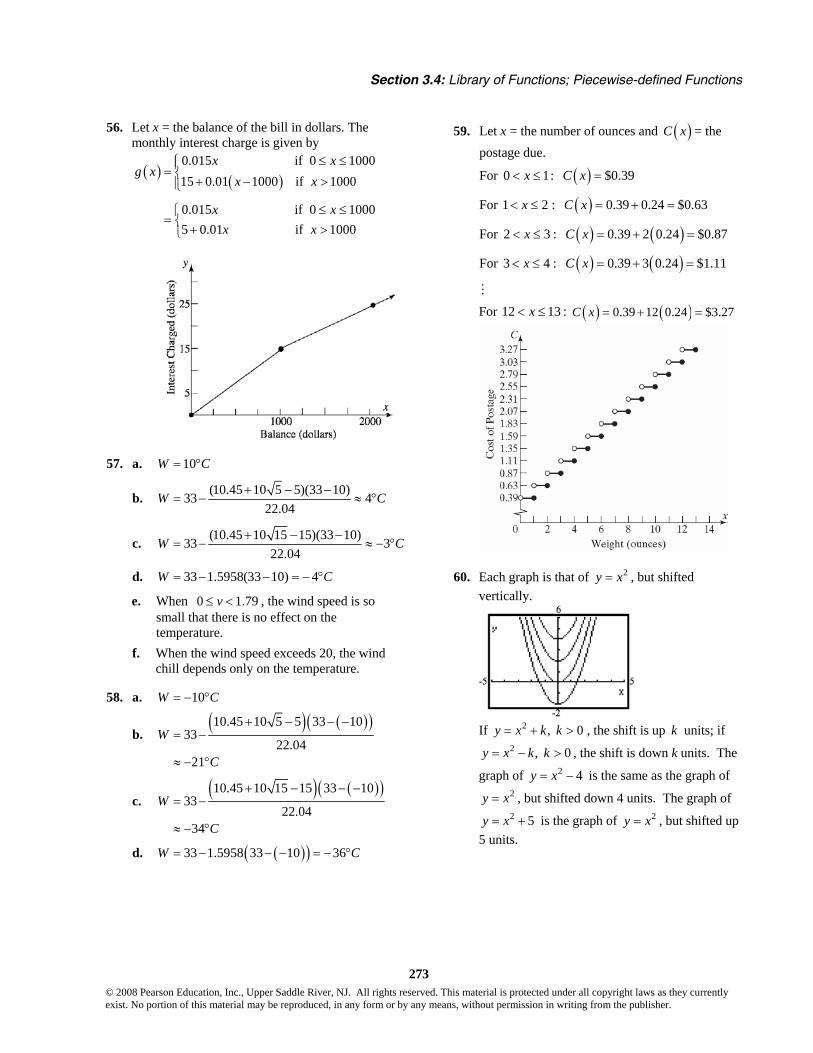
Section 3.4: Library of Functions; Piecewise-defined Functions
273 © 2008 Pearson Education, Inc., Upper Saddle River, NJ. All rights reserved. This material is protected under all copyright laws as they currently exist. No portion of this material may be reproduced, in any form or by any means, without permission in writing from the publisher.
56. Let x = the balance of the bill in dollars. The monthly interest charge is given by
( ) ( )0.015 if 0 100015 0.01 1000 if 1000
0.015 if 0 10005 0.01 if 1000
x xg x
x x
x xx x
≤ ≤⎧⎪= ⎨ + − >⎪⎩
≤ ≤⎧= ⎨ + >⎩
57. a. 10W C= °
b. (10.45 10 5 5)(33 10)33 422.04
W C+ − −= − ≈ °
c. (10.45 10 15 15)(33 10)33 322.04
W C+ − −= − ≈ − °
d. 33 1.5958(33 10) 4W C= − − = − °
e. When 0 1.79v≤ < , the wind speed is so small that there is no effect on the temperature.
f. When the wind speed exceeds 20, the wind chill depends only on the temperature.
58. a. 10W C= − °
b. ( ) ( )( )10.45 10 5 5 33 10
3322.04
21
W
C
+ − − −= −
≈ − °
c. ( ) ( )( )10.45 10 15 15 33 10
3322.04
34
W
C
+ − − −= −
≈ − °
d. ( )( )33 1.5958 33 10 36W C= − − − = − °
59. Let x = the number of ounces and ( )C x = the postage due.
For 0 1x< ≤ : ( ) $0.39C x =
For 1 2x< ≤ : ( ) 0.39 0.24 $0.63C x = + =
For 2 3x< ≤ : ( ) ( )0.39 2 0.24 $0.87C x = + =
For 3 4x< ≤ : ( ) ( )0.39 3 0.24 $1.11C x = + =
For 12 13x< ≤ : ( ) ( )0.39 12 0.24 $3.27C x = + =
60. Each graph is that of 2y x= , but shifted vertically.
If 2 , 0y x k k= + > , the shift is up k units; if
2 , 0y x k k= − > , the shift is down k units. The
graph of 2 4y x= − is the same as the graph of 2y x= , but shifted down 4 units. The graph of 2 5y x= + is the graph of 2y x= , but shifted up
5 units.

Chapter 3: Functions and Their Graphs
274 © 2008 Pearson Education, Inc., Upper Saddle River, NJ. All rights reserved. This material is protected under all copyright laws as they currently exist. No portion of this material may be reproduced, in any form or by any means, without permission in writing from the publisher.
61. Each graph is that of 2y x= , but shifted horizontally.
If 2( ) , 0y x k k= − > , the shift is to the right k
units; if 2( ) , 0y x k k= + > , the shift is to the
left k units. The graph of 2( 4)y x= + is the
same as the graph of 2y x= , but shifted to the
left 4 units. The graph of 2( 5)y x= − is the
graph of 2y x= , but shifted to the right 5 units.
62. Each graph is that of y x= , but either compressed or stretched vertically.
If y k x= and 1k > , the graph is stretched
vertically; if and 0 1y k x k= < < , the graph is
compressed vertically. The graph of 14
y x= is
the same as the graph of y x= , but compressed
vertically. The graph of 5y x= is the same as
the graph of y x= , but stretched vertically.
63. The graph of 2y x= − is the reflection of the
graph of 2y x= about the x-axis.
The graph of y x= − is the reflection of the
graph of y x= about the x-axis.
Multiplying a function by –1 causes the graph to be a reflection about the x-axis of the original function's graph.
64. The graph of y x= − is the reflection about the
y-axis of the graph of y x= .
3
−1
5−5
y x= −
y x=
The same type of reflection occurs when graphing 2 1 and 2( ) 1y x y x= + = − + .
The graph of ( )y f x= − is the reflection about the y-axis of the graph of ( )y f x= .

Section 3.5: Graphing Techniques: Transformations
275 © 2008 Pearson Education, Inc., Upper Saddle River, NJ. All rights reserved. This material is protected under all copyright laws as they currently exist. No portion of this material may be reproduced, in any form or by any means, without permission in writing from the publisher.
65. The graph of 3( 1) 2y x= − + is a shifting of the
graph of 3y x= one unit to the right and two units up. Yes, the result could be predicted.
66. The graphs of ,ny x= n a positive even integer, are all U-shaped and open upward. All go through the points ( 1, 1)− , (0, 0) , and (1, 1) . As n increases, the graph of the function is narrower for 1x > and flatter for 1x < .
67. The graphs of ,ny x= n a positive odd integer, all have the same general shape. All go through the points ( 1, 1)− − , (0, 0) , and (1, 1) . As n increases, the graph of the function increases at a greater rate for 1x > and is flatter around 0 for
1x < .
68. ( )1 if is rational0 if is irrational
xf x
x⎧
= ⎨⎩
Yes, it is a function. Domain = { } is any real numberx x Range = {0,1} y-intercept: 0 is rational 1x x y= ⇒ ⇒ = So the y-intercept is (0, 1).
x-intercept: 0 is irrationaly x= ⇒ So the graph has infinitely many x-intercepts, namely, there is an x-intercept at each irrational value of x.
( ) ( )1f x f x− = = when x is rational;
( ) ( )0f x f x− = = when x is irrational. Thus, f is even.
The graph of f consists of 2 infinite clusters of distinct points, extending horizontally in both directions. One cluster is located 1 unit above the x-axis, and the other is located along the x-axis.
69. For 0 < x < 1, the graph of ,ry x= r rational and 0r > , flattens down toward the x-axis as r gets
bigger. For x > 1, the graph of ry x= increases at a greater rate as r gets bigger.
Section 3.5
1. horizontal; right
2. y
3. 5− , 2− , and 2 (shift left three units)
4. True; the graph of ( )y f x= − is the reflection
about the x-axis of the graph of ( )y f x= .
5. False; to obtain the graph of ( )2 3y f x= + −
you shift the graph of ( )y f x= to the left 2 units and down 3 units.
6. True; to obtain the graph of ( )2y f x= we multiply the y-coordinates of the graph of
( )y f x= by 2. Since the y-coordinate of x-intercepts is 0 and 2 0 0⋅ = , multiplying by a constant does not change the x-intercepts.
7. B
8. E
9. H
10. D
11. I
12. A
13. L
Chapter 3: Functions and Their Graphs
276 © 2008 Pearson Education, Inc., Upper Saddle River, NJ. All rights reserved. This material is protected under all copyright laws as they currently exist. No portion of this material may be reproduced, in any form or by any means, without permission in writing from the publisher.
14. C
15. F
16. J
17. G
18. K
19. 3( 4)y x= −
20. 3( 4)y x= +
21. 3 4y x= +
22. 3 4y x= −
23. ( )3 3y x x= − = −
24. 3y x= −
25. 34y x=
26. 3
31 14 64
y x x⎛ ⎞= =⎜ ⎟⎝ ⎠
27. (1) 2y x= +
( )( )
(2) 2
(3) 2 2
y x
y x x
= − +
= − − + = − − −
28. (1) y x= −
(2) 3
(3) 3 2
y x
y x
= − −
= − − −
29. (1) y x= −
(2) 2
(3) 3 2
y x
y x
= − +
= − + +
30. (1) 2y x= +
(2) 2
(3) ( 3) 2 3 2
y x
y x x
= − +
= − + + = − − +
31. (c); To go from ( )y f x= to ( )y f x= − we reflect about the x-axis. This means we change the sign of the y-coordinate for each point on the graph of ( )y f x= . Thus, the point (3, 0) would remain the same.
32. (d); To go from ( )y f x= to ( )y f x= − , we
reflect each point on the graph of ( )y f x= about the y-axis. This means we change the sign of the x-coordinate for each point on the graph of
( )y f x= . Thus, the point ( )3,0 would become
( )3,0− .
33. (c); To go from ( )y f x= to ( )2y f x= , we multiply the y-coordinate of each point on the graph of ( )y f x= by 2. Thus, the point ( )0,3
would become ( )0,6 .
34. (a); To go from ( )y f x= to ( )12
y f x= , we
multiply the y-coordinate of each point on the
graph of ( )y f x= by 12
. Thus, the point ( )3,0
would remain ( )3,0 .
35. 2( ) 1f x x= −
Using the graph of 2y x= , vertically shift downward 1 unit.
36. 2( ) 4f x x= +
Using the graph of 2y x= , vertically shift upward 4 units.

Section 3.5: Graphing Techniques: Transformations
277 © 2008 Pearson Education, Inc., Upper Saddle River, NJ. All rights reserved. This material is protected under all copyright laws as they currently exist. No portion of this material may be reproduced, in any form or by any means, without permission in writing from the publisher.
37. 3( ) 1g x x= +
Using the graph of 3y x= , vertically shift upward 1 unit.
38. 3( ) 1g x x= −
Using the graph of 3y x= , vertically shift downward 1 unit.
39. ( ) 2h x x= −
Using the graph of y x= , horizontally shift to the right 2 units.
40. ( ) 1h x x= +
Using the graph of y x= , horizontally shift to the left 1 unit.
41. 3( ) ( 1) 2f x x= − +
Using the graph of 3y x= , horizontally shift to
the right 1 unit ( )31y x⎡ ⎤= −⎢ ⎥⎣ ⎦, then vertically
shift up 2 units ( )31 2y x⎡ ⎤= − +⎢ ⎥⎣ ⎦.
42. 3( ) ( 2) 3f x x= + −
Using the graph of 3y x= , horizontally shift to
the left 2 units ( )32y x⎡ ⎤= +⎢ ⎥⎣ ⎦, then vertically
shift down 3 units ( )32 3y x⎡ ⎤= + −⎢ ⎥⎣ ⎦.
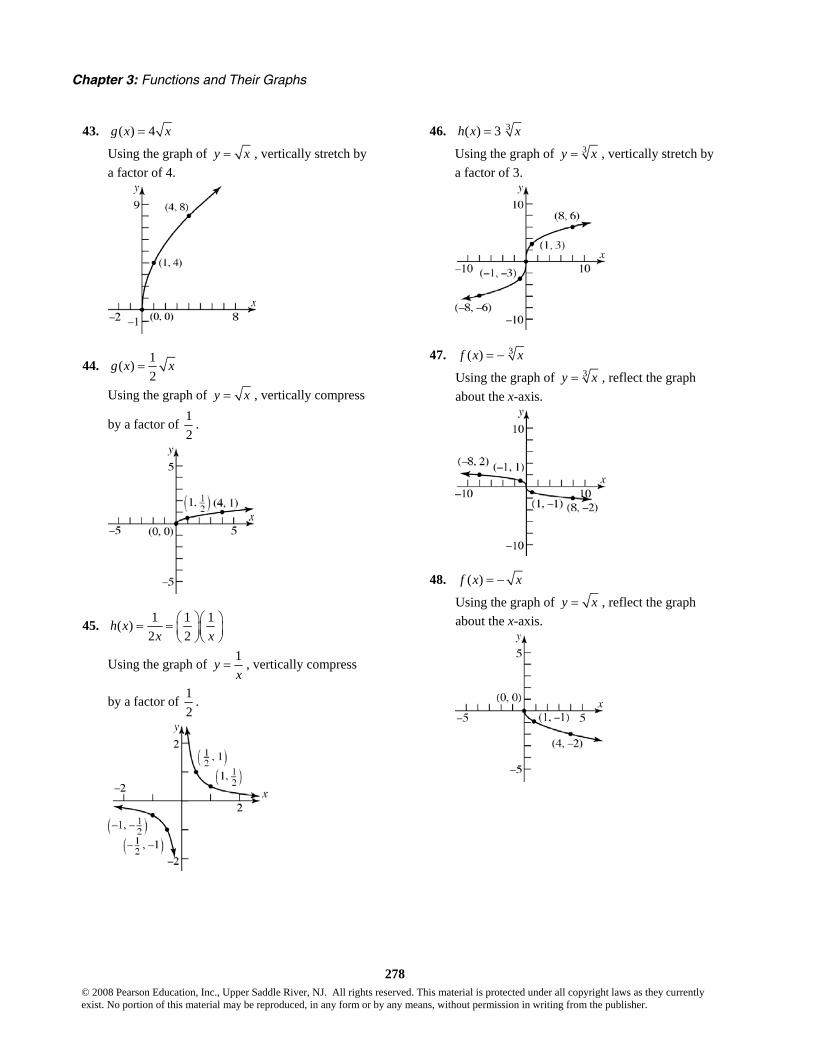
Chapter 3: Functions and Their Graphs
278 © 2008 Pearson Education, Inc., Upper Saddle River, NJ. All rights reserved. This material is protected under all copyright laws as they currently exist. No portion of this material may be reproduced, in any form or by any means, without permission in writing from the publisher.
43. ( ) 4g x x=
Using the graph of y x= , vertically stretch by a factor of 4.
44. 1( )2
g x x=
Using the graph of y x= , vertically compress
by a factor of 12
.
45. 1 1 1( )2 2
h xx x
⎛ ⎞⎛ ⎞= = ⎜ ⎟⎜ ⎟⎝ ⎠⎝ ⎠
Using the graph of 1yx
= , vertically compress
by a factor of 12
.
46. 3( ) 3 h x x=
Using the graph of 3y x= , vertically stretch by a factor of 3.
47. 3( )f x x= −
Using the graph of 3y x= , reflect the graph about the x-axis.
48. ( )f x x= −
Using the graph of y x= , reflect the graph about the x-axis.
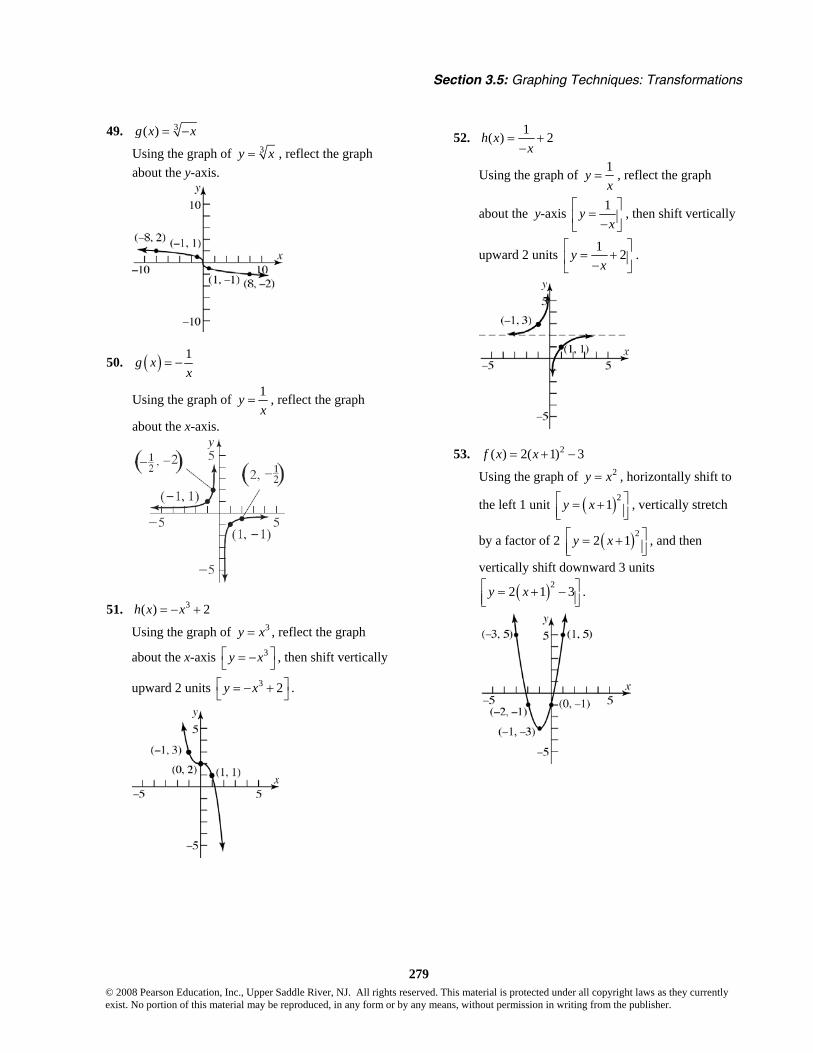
Section 3.5: Graphing Techniques: Transformations
279 © 2008 Pearson Education, Inc., Upper Saddle River, NJ. All rights reserved. This material is protected under all copyright laws as they currently exist. No portion of this material may be reproduced, in any form or by any means, without permission in writing from the publisher.
49. 3( )g x x= −
Using the graph of 3y x= , reflect the graph about the y-axis.
50. ( ) 1g xx
= −
Using the graph of 1yx
= , reflect the graph
about the x-axis.
51. 3( ) 2h x x= − +
Using the graph of 3y x= , reflect the graph
about the x-axis 3y x⎡ ⎤= −⎣ ⎦ , then shift vertically
upward 2 units 3 2y x⎡ ⎤= − +⎣ ⎦ .
52. 1( ) 2h xx
= +−
Using the graph of 1yx
= , reflect the graph
about the y-axis 1yx
⎡ ⎤=⎢ ⎥−⎣ ⎦
, then shift vertically
upward 2 units 1 2yx
⎡ ⎤= +⎢ ⎥−⎣ ⎦
.
53. 2( ) 2( 1) 3f x x= + −
Using the graph of 2y x= , horizontally shift to
the left 1 unit ( )21y x⎡ ⎤= +⎢ ⎥⎣ ⎦, vertically stretch
by a factor of 2 ( )22 1y x⎡ ⎤= +⎢ ⎥⎣ ⎦, and then
vertically shift downward 3 units
( )22 1 3y x⎡ ⎤= + −⎢ ⎥⎣ ⎦.
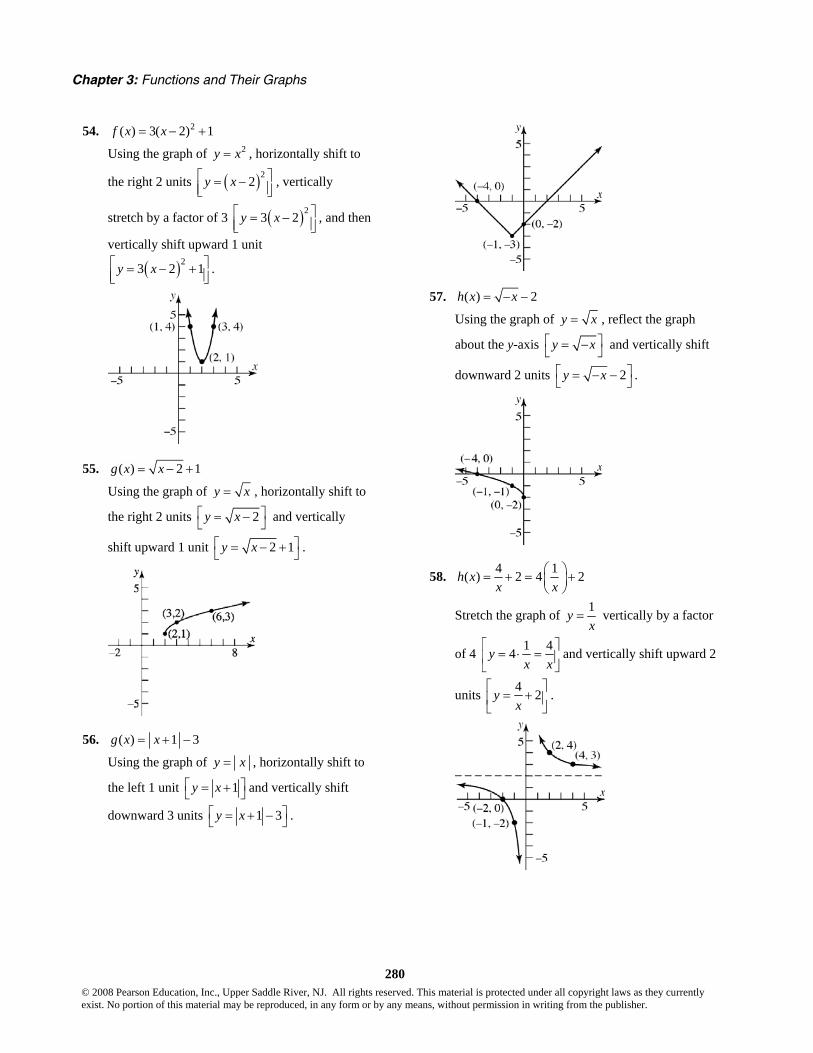
Chapter 3: Functions and Their Graphs
280 © 2008 Pearson Education, Inc., Upper Saddle River, NJ. All rights reserved. This material is protected under all copyright laws as they currently exist. No portion of this material may be reproduced, in any form or by any means, without permission in writing from the publisher.
54. 2( ) 3( 2) 1f x x= − +
Using the graph of 2y x= , horizontally shift to
the right 2 units ( )22y x⎡ ⎤= −⎢ ⎥⎣ ⎦, vertically
stretch by a factor of 3 ( )23 2y x⎡ ⎤= −⎢ ⎥⎣ ⎦, and then
vertically shift upward 1 unit
( )23 2 1y x⎡ ⎤= − +⎢ ⎥⎣ ⎦.
55. ( ) 2 1g x x= − +
Using the graph of y x= , horizontally shift to
the right 2 units 2y x⎡ ⎤= −⎣ ⎦ and vertically
shift upward 1 unit 2 1y x⎡ ⎤= − +⎣ ⎦ .
56. ( ) 1 3g x x= + −
Using the graph of y x= , horizontally shift to
the left 1 unit 1y x⎡ ⎤= +⎣ ⎦ and vertically shift
downward 3 units 1 3y x⎡ ⎤= + −⎣ ⎦ .
57. ( ) 2h x x= − −
Using the graph of y x= , reflect the graph
about the y-axis y x⎡ ⎤= −⎣ ⎦ and vertically shift
downward 2 units 2y x⎡ ⎤= − −⎣ ⎦ .
58. 4 1( ) 2 4 2h xx x
⎛ ⎞= + = +⎜ ⎟⎝ ⎠
Stretch the graph of 1yx
= vertically by a factor
of 4 1 44yx x
⎡ ⎤= ⋅ =⎢ ⎥
⎣ ⎦and vertically shift upward 2
units 4 2yx
⎡ ⎤= +⎢ ⎥
⎣ ⎦.
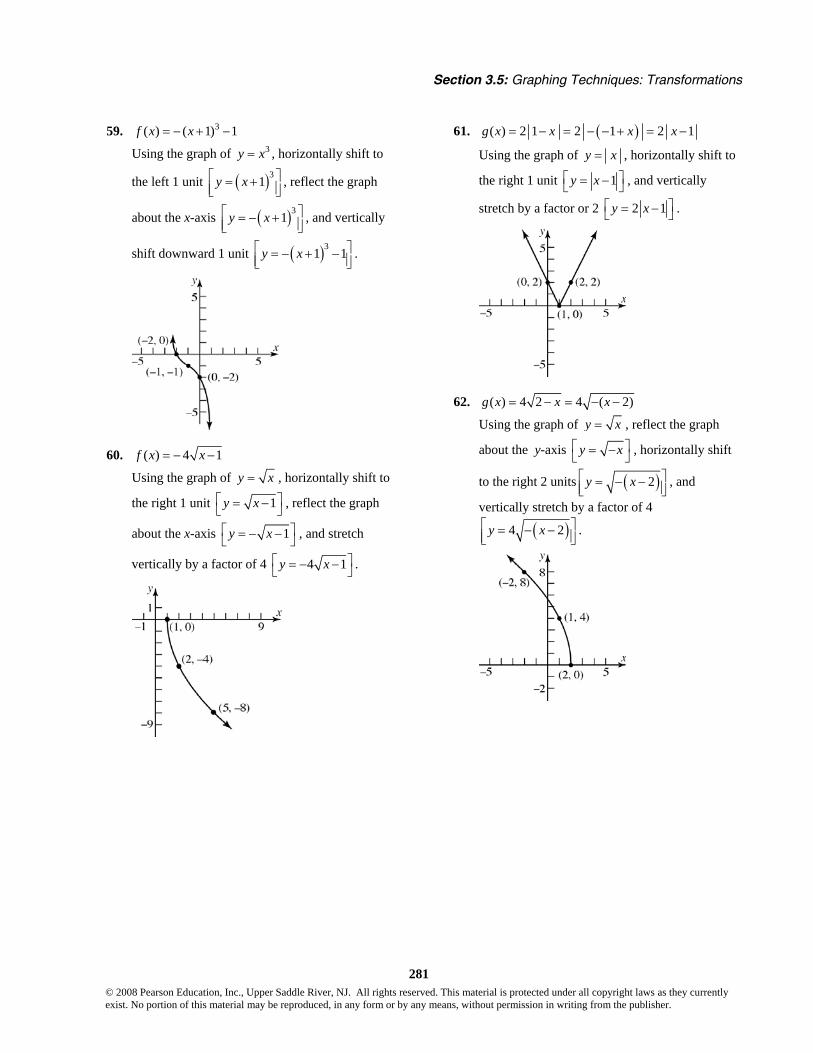
Section 3.5: Graphing Techniques: Transformations
281 © 2008 Pearson Education, Inc., Upper Saddle River, NJ. All rights reserved. This material is protected under all copyright laws as they currently exist. No portion of this material may be reproduced, in any form or by any means, without permission in writing from the publisher.
59. 3( ) ( 1) 1f x x= − + −
Using the graph of 3y x= , horizontally shift to
the left 1 unit ( )31y x⎡ ⎤= +⎢ ⎥⎣ ⎦, reflect the graph
about the x-axis ( )31y x⎡ ⎤= − +⎢ ⎥⎣ ⎦, and vertically
shift downward 1 unit ( )31 1y x⎡ ⎤= − + −⎢ ⎥⎣ ⎦.
60. ( ) 4 1f x x= − −
Using the graph of y x= , horizontally shift to
the right 1 unit 1y x⎡ ⎤= −⎣ ⎦ , reflect the graph
about the x-axis 1y x⎡ ⎤= − −⎣ ⎦ , and stretch
vertically by a factor of 4 4 1y x⎡ ⎤= − −⎣ ⎦ .
61. ( )( ) 2 1 2 1 2 1g x x x x= − = − − + = −
Using the graph of y x= , horizontally shift to
the right 1 unit 1y x⎡ ⎤= −⎣ ⎦ , and vertically
stretch by a factor or 2 2 1y x⎡ ⎤= −⎣ ⎦ .
62. ( ) 4 2 4 ( 2)g x x x= − = − −
Using the graph of y x= , reflect the graph
about the y-axis y x⎡ ⎤= −⎣ ⎦ , horizontally shift
to the right 2 units ( )2y x⎡ ⎤= − −⎢ ⎥⎣ ⎦, and
vertically stretch by a factor of 4
( )4 2y x⎡ ⎤= − −⎢ ⎥⎣ ⎦.

Chapter 3: Functions and Their Graphs
282 © 2008 Pearson Education, Inc., Upper Saddle River, NJ. All rights reserved. This material is protected under all copyright laws as they currently exist. No portion of this material may be reproduced, in any form or by any means, without permission in writing from the publisher.
63. ( ) 2int( 1)h x x= − Using the graph of int( )y x= , horizontally shift to the right 1 unit [ ]int( 1)y x= − , and vertically
stretch by a factor of 2 [ ]2int( 1)y x= − .
64. ( ) int( )h x x= − Reflect the graph of int( )y x= about the y-axis.
65. a. ( ) ( ) 3F x f x= + Shift up 3 units.
b. ( ) ( 2)G x f x= +
Shift left 2 units.
c. ( ) ( )P x f x= − Reflect about the x-axis.
d. ( ) ( 1) 2H x f x= + − Shift left 1 unit and shift down 2 units.
e. 1( ) ( )2
Q x f x=
Compress vertically by a factor of 12
.
f. ( ) ( )g x f x= − Reflect about the y-axis.

Section 3.5: Graphing Techniques: Transformations
283 © 2008 Pearson Education, Inc., Upper Saddle River, NJ. All rights reserved. This material is protected under all copyright laws as they currently exist. No portion of this material may be reproduced, in any form or by any means, without permission in writing from the publisher.
g. ( ) (2 )h x f x=
Compress horizontally by a factor of 12
.
66. a. ( ) ( ) 3F x f x= + Shift up 3 units.
b. ( ) ( 2)G x f x= +
Shift left 2 units.
c. ( ) ( )P x f x= −
Reflect about the x-axis.
d. ( ) ( 1) 2H x f x= + − Shift left 1 unit and shift down 2 units.
e. 1( ) ( )2
Q x f x=
Compress vertically by a factor of 12
.
f. ( ) ( )g x f x= −
Reflect about the y-axis.
g. ( ) (2 )h x f x=
Compress horizontally by a factor of 12
.

Chapter 3: Functions and Their Graphs
284 © 2008 Pearson Education, Inc., Upper Saddle River, NJ. All rights reserved. This material is protected under all copyright laws as they currently exist. No portion of this material may be reproduced, in any form or by any means, without permission in writing from the publisher.
67. a. ( ) ( ) 3F x f x= + Shift up 3 units.
b. ( ) ( 2)G x f x= + Shift left 2 units.
c. ( ) ( )P x f x= − Reflect about the x-axis.
d. ( ) ( 1) 2H x f x= + − Shift left 1 unit and shift down 2 units.
e. 1( ) ( )2
Q x f x=
Compress vertically by a factor of 12
.
f. ( ) ( )g x f x= −
Reflect about the y-axis.
g. ( ) (2 )h x f x=
Compress horizontally by a factor of 12
.
68. a. ( ) ( ) 3F x f x= + Shift up 3 units.

Section 3.5: Graphing Techniques: Transformations
285 © 2008 Pearson Education, Inc., Upper Saddle River, NJ. All rights reserved. This material is protected under all copyright laws as they currently exist. No portion of this material may be reproduced, in any form or by any means, without permission in writing from the publisher.
b. ( ) ( 2)G x f x= + Shift left 2 units.
c. ( ) ( )P x f x= − Reflect about the x-axis.
d. ( ) ( 1) 2H x f x= + − Shift left 1 unit and shift down 2 units.
e. 1( ) ( )2
Q x f x=
Compress vertically by a factor of 12
.
f. ( ) ( )g x f x= − Reflect about the y-axis.
g. ( ) (2 )h x f x=
Compress horizontally by a factor of 12 .
69. a. The graph of ( )2y f x= + is the same as
the graph of ( )y f x= , but shifted 2 units to the left. Therefore, the x-intercepts are 7− and 1.
b. The graph of ( )2y f x= − is the same as
the graph of ( )y f x= , but shifted 2 units to the right. Therefore, the x-intercepts are 3− and 5.
c. The graph of ( )4y f x= is the same as the
graph of ( )y f x= , but stretched vertically by a factor of 4. Therefore, the x-intercepts are still 5− and 3 since the y-coordinate of each is 0.
d. The graph of ( )y f x= − is the same as the
graph of ( )y f x= , but reflected about the y-axis. Therefore, the x-intercepts are 5 and
3− .
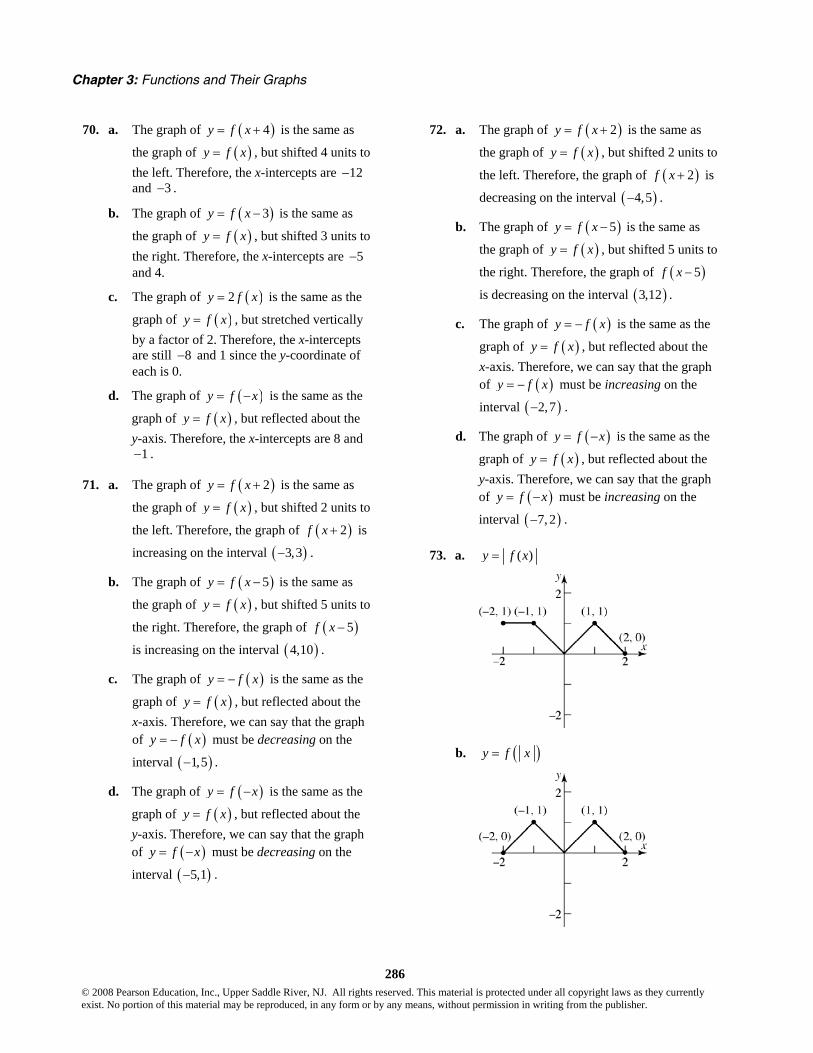
Chapter 3: Functions and Their Graphs
286 © 2008 Pearson Education, Inc., Upper Saddle River, NJ. All rights reserved. This material is protected under all copyright laws as they currently exist. No portion of this material may be reproduced, in any form or by any means, without permission in writing from the publisher.
70. a. The graph of ( )4y f x= + is the same as
the graph of ( )y f x= , but shifted 4 units to the left. Therefore, the x-intercepts are 12− and 3− .
b. The graph of ( )3y f x= − is the same as
the graph of ( )y f x= , but shifted 3 units to the right. Therefore, the x-intercepts are 5− and 4.
c. The graph of ( )2y f x= is the same as the
graph of ( )y f x= , but stretched vertically by a factor of 2. Therefore, the x-intercepts are still 8− and 1 since the y-coordinate of each is 0.
d. The graph of ( )y f x= − is the same as the
graph of ( )y f x= , but reflected about the y-axis. Therefore, the x-intercepts are 8 and
1− .
71. a. The graph of ( )2y f x= + is the same as
the graph of ( )y f x= , but shifted 2 units to
the left. Therefore, the graph of ( )2f x + is
increasing on the interval ( )3,3− .
b. The graph of ( )5y f x= − is the same as
the graph of ( )y f x= , but shifted 5 units to
the right. Therefore, the graph of ( )5f x −
is increasing on the interval ( )4,10 .
c. The graph of ( )y f x= − is the same as the
graph of ( )y f x= , but reflected about the x-axis. Therefore, we can say that the graph of ( )y f x= − must be decreasing on the
interval ( )1,5− .
d. The graph of ( )y f x= − is the same as the
graph of ( )y f x= , but reflected about the y-axis. Therefore, we can say that the graph of ( )y f x= − must be decreasing on the
interval ( )5,1− .
72. a. The graph of ( )2y f x= + is the same as
the graph of ( )y f x= , but shifted 2 units to
the left. Therefore, the graph of ( )2f x + is
decreasing on the interval ( )4,5− .
b. The graph of ( )5y f x= − is the same as
the graph of ( )y f x= , but shifted 5 units to
the right. Therefore, the graph of ( )5f x −
is decreasing on the interval ( )3,12 .
c. The graph of ( )y f x= − is the same as the
graph of ( )y f x= , but reflected about the x-axis. Therefore, we can say that the graph of ( )y f x= − must be increasing on the
interval ( )2,7− .
d. The graph of ( )y f x= − is the same as the
graph of ( )y f x= , but reflected about the y-axis. Therefore, we can say that the graph of ( )y f x= − must be increasing on the
interval ( )7, 2− .
73. a. ( )y f x=
b. ( )y f x=

Section 3.5: Graphing Techniques: Transformations
287 © 2008 Pearson Education, Inc., Upper Saddle River, NJ. All rights reserved. This material is protected under all copyright laws as they currently exist. No portion of this material may be reproduced, in any form or by any means, without permission in writing from the publisher.
74. a. ( )y f x=
b. ( )y f x=
75. 2( ) 2f x x x= + 2
2
( ) ( 2 1) 1
( ) ( 1) 1
f x x x
f x x
= + + −
= + −
Using 2( )f x x= , shift left 1 unit and shift down 1 unit.
76. 2( ) 6f x x x= − 2
2
( ) ( 6 9) 9
( ) ( 3) 9
f x x x
f x x
= − + −
= − −
Using 2( )f x x= , shift right 3 units and shift down 9 units.
77. 2( ) 8 1f x x x= − +
( )( )
2
2
( ) 8 16 1 16
( ) 4 15
f x x x
f x x
= − + + −
= − −
Using 2( )f x x= , shift right 4 units and shift down 15 units.
78. 2( ) 4 2f x x x= + +
( )( )
2
2
( ) 4 4 2 4
( ) 2 2
f x x x
f x x
= + + + −
= + −
Using 2( )f x x= , shift left 2 units and shift down 2 units.
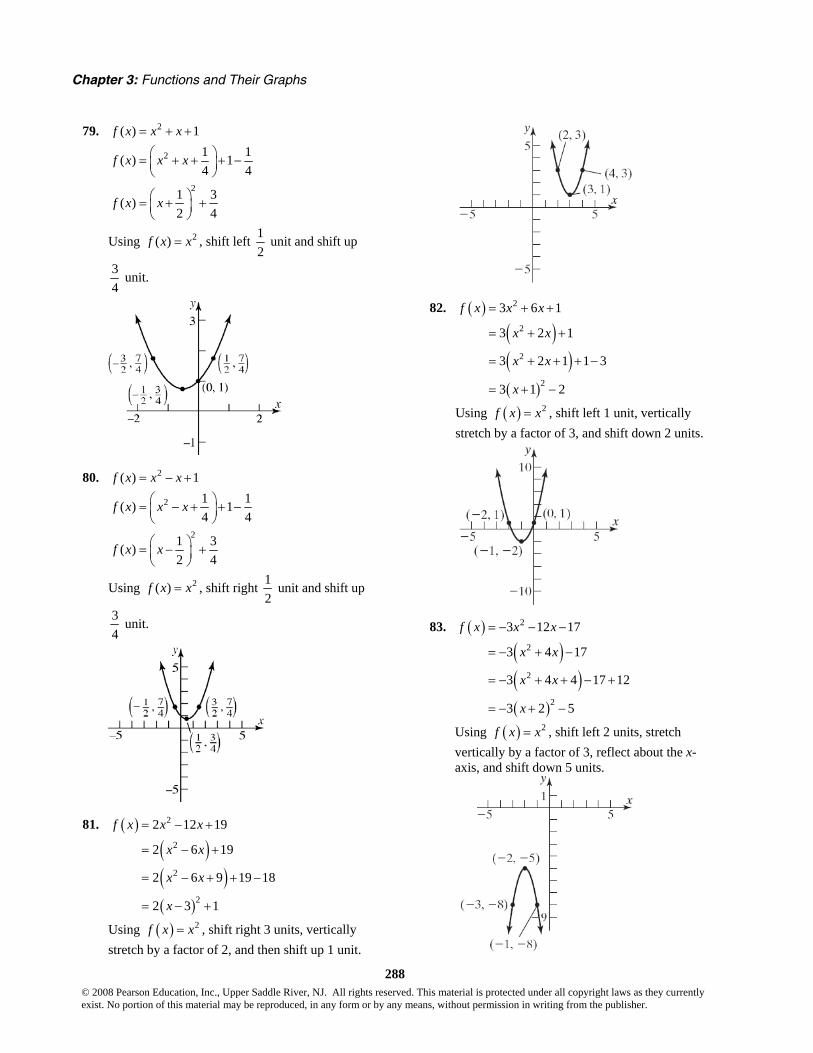
Chapter 3: Functions and Their Graphs
288 © 2008 Pearson Education, Inc., Upper Saddle River, NJ. All rights reserved. This material is protected under all copyright laws as they currently exist. No portion of this material may be reproduced, in any form or by any means, without permission in writing from the publisher.
79. 2( ) 1f x x x= + +
2
2
1 1( ) 14 4
1 3( )2 4
f x x x
f x x
⎛ ⎞= + + + −⎜ ⎟⎝ ⎠
⎛ ⎞= + +⎜ ⎟⎝ ⎠
Using 2( )f x x= , shift left 12
unit and shift up
34
unit.
80. 2( ) 1f x x x= − +
2
2
1 1( ) 14 4
1 3( )2 4
f x x x
f x x
⎛ ⎞= − + + −⎜ ⎟⎝ ⎠
⎛ ⎞= − +⎜ ⎟⎝ ⎠
Using 2( )f x x= , shift right 12
unit and shift up
34
unit.
81. ( )( )( )( )
2
2
2
2
2 12 19
2 6 19
2 6 9 19 18
2 3 1
f x x x
x x
x x
x
= − +
= − +
= − + + −
= − +
Using ( ) 2f x x= , shift right 3 units, vertically stretch by a factor of 2, and then shift up 1 unit.
82. ( )( )( )( )
2
2
2
2
3 6 1
3 2 1
3 2 1 1 3
3 1 2
f x x x
x x
x x
x
= + +
= + +
= + + + −
= + −
Using ( ) 2f x x= , shift left 1 unit, vertically stretch by a factor of 3, and shift down 2 units.
83. ( )
( )( )( )
2
2
2
2
3 12 17
3 4 17
3 4 4 17 12
3 2 5
f x x x
x x
x x
x
= − − −
= − + −
= − + + − +
= − + −
Using ( ) 2f x x= , shift left 2 units, stretch vertically by a factor of 3, reflect about the x-axis, and shift down 5 units.
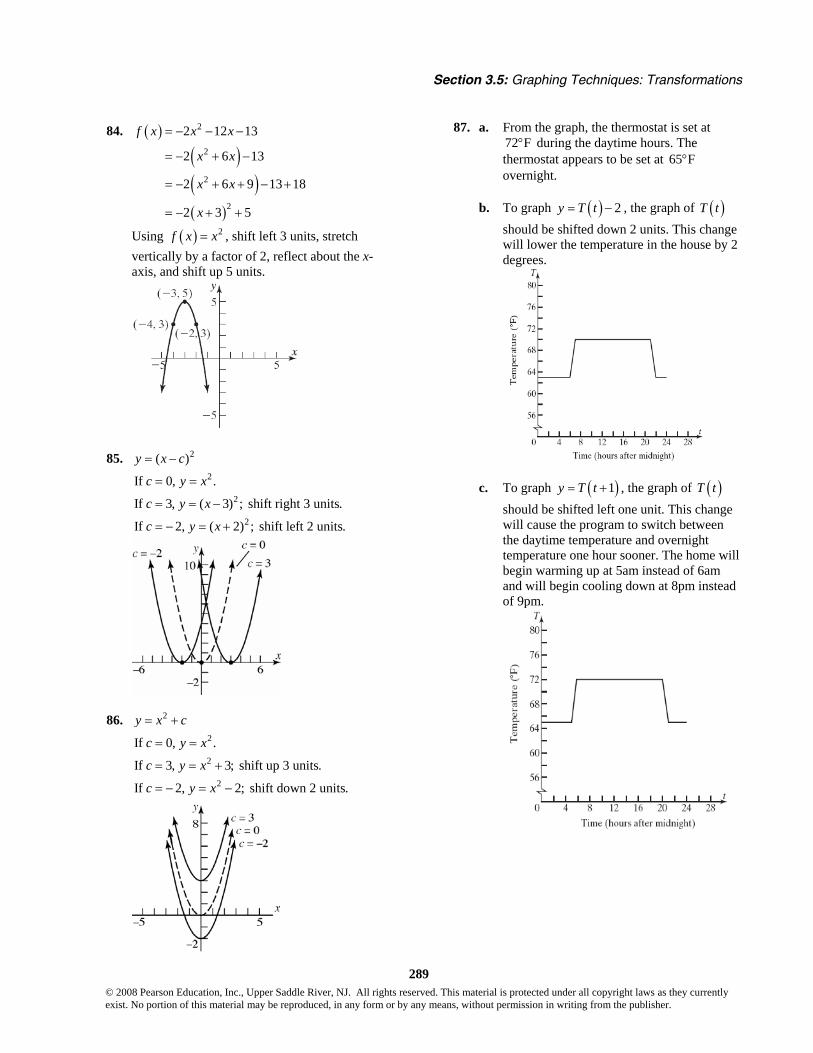
Section 3.5: Graphing Techniques: Transformations
289 © 2008 Pearson Education, Inc., Upper Saddle River, NJ. All rights reserved. This material is protected under all copyright laws as they currently exist. No portion of this material may be reproduced, in any form or by any means, without permission in writing from the publisher.
84. ( )( )( )( )
2
2
2
2
2 12 13
2 6 13
2 6 9 13 18
2 3 5
f x x x
x x
x x
x
= − − −
= − + −
= − + + − +
= − + +
Using ( ) 2f x x= , shift left 3 units, stretch vertically by a factor of 2, reflect about the x-axis, and shift up 5 units.
85. 2( )y x c= − 2
2
2
If 0, .
If 3, ( 3) ; shift right 3 units.
If 2, ( 2) ; shift left 2 units.
c y x
c y x
c y x
= =
= = −
= − = +
86. 2y x c= + 2
2
2
If 0, .
If 3, 3; shift up 3 units.
If 2, 2; shift down 2 units.
c y x
c y x
c y x
= =
= = +
= − = −
87. a. From the graph, the thermostat is set at 72 F° during the daytime hours. The thermostat appears to be set at 65 F° overnight.
b. To graph ( ) 2y T t= − , the graph of ( )T t should be shifted down 2 units. This change will lower the temperature in the house by 2 degrees.
c. To graph ( )1y T t= + , the graph of ( )T t should be shifted left one unit. This change will cause the program to switch between the daytime temperature and overnight temperature one hour sooner. The home will begin warming up at 5am instead of 6am and will begin cooling down at 8pm instead of 9pm.
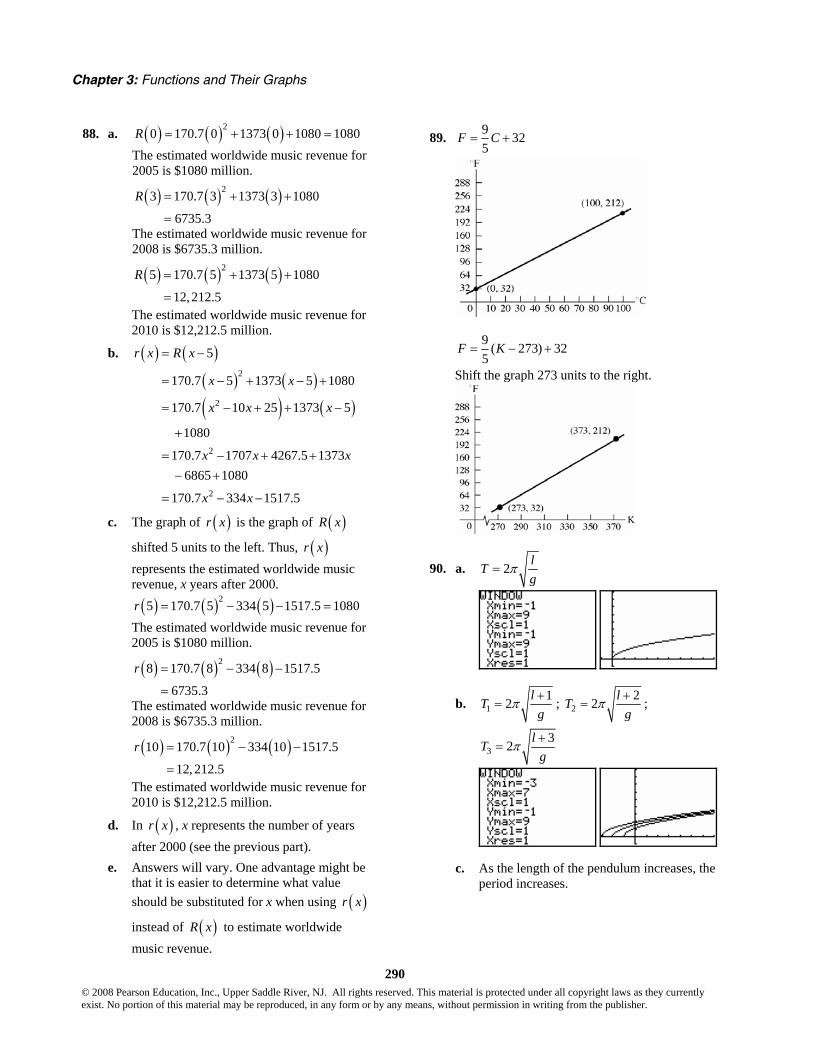
Chapter 3: Functions and Their Graphs
290 © 2008 Pearson Education, Inc., Upper Saddle River, NJ. All rights reserved. This material is protected under all copyright laws as they currently exist. No portion of this material may be reproduced, in any form or by any means, without permission in writing from the publisher.
88. a. ( ) ( ) ( )20 170.7 0 1373 0 1080 1080R = + + = The estimated worldwide music revenue for 2005 is $1080 million.
( ) ( ) ( )23 170.7 3 1373 3 1080
6735.3
R = + +
=
The estimated worldwide music revenue for 2008 is $6735.3 million.
( ) ( ) ( )25 170.7 5 1373 5 1080
12,212.5
R = + +
=
The estimated worldwide music revenue for 2010 is $12,212.5 million.
b. ( ) ( )( ) ( )( ) ( )
2
2
2
2
5
170.7 5 1373 5 1080
170.7 10 25 1373 5
1080
170.7 1707 4267.5 1373 6865 1080
170.7 334 1517.5
r x R x
x x
x x x
x x x
x x
= −
= − + − +
= − + + −
+
= − + +− +
= − −
c. The graph of ( )r x is the graph of ( )R x
shifted 5 units to the left. Thus, ( )r x represents the estimated worldwide music revenue, x years after 2000.
( ) ( ) ( )25 170.7 5 334 5 1517.5 1080r = − − = The estimated worldwide music revenue for 2005 is $1080 million.
( ) ( ) ( )28 170.7 8 334 8 1517.5
6735.3
r = − −
=
The estimated worldwide music revenue for 2008 is $6735.3 million.
( ) ( ) ( )210 170.7 10 334 10 1517.5
12, 212.5
r = − −
=
The estimated worldwide music revenue for 2010 is $12,212.5 million.
d. In ( )r x , x represents the number of years after 2000 (see the previous part).
e. Answers will vary. One advantage might be that it is easier to determine what value should be substituted for x when using ( )r x
instead of ( )R x to estimate worldwide music revenue.
89. 9 325
F C= +
9 ( 273) 325
F K= − +
Shift the graph 273 units to the right.
90. a. 2 lTg
π=
b. 112 lT
gπ +
= ; 222 lT
gπ +
= ;
332 lT
gπ +
=
c. As the length of the pendulum increases, the period increases.

Section 3.6: Mathematical Models: Building Functions
291 © 2008 Pearson Education, Inc., Upper Saddle River, NJ. All rights reserved. This material is protected under all copyright laws as they currently exist. No portion of this material may be reproduced, in any form or by any means, without permission in writing from the publisher.
d. 122 lTg
π= ; 232 lTg
π= ; 342 lTg
π=
e. If the length of the pendulum is multiplied by k , the period is multiplied by k .
91. a. ( ) 20.05 100 2000p x x x= − + −
b. Select the 10% tax since the profits are higher.
c. The graph of Y1 is obtained by shifting the graph of ( )p x vertically down 10,000 units. The graph of Y2 is obtained by multiplying the y-coordinate of the graph of ( )p x by 0.9. Thus, Y2 is the graph of ( )p x vertically compressed by a factor of 0.9.
d. Select the 10% tax since the graph of 21 0.9 ( ) 2 0.05 100 6800Y p x Y x x= ≥ = − + −
for all x in the domain.
92. The graph of 4 ( )y f x= is a vertical stretch of the graph of f by a factor of 4, while the graph of
(4 )y f x= is a horizontal compression of the
graph of f by a factor of 14 .
Section 3.6
1. a. The distance from d P to the origin is 2 2d x y= + . Since P is a point on the
graph of 2 8y x= − , we have: 2 2 2 4 2( ) ( 8) 15 64d x x x x x= + − = − +
b. 4 2(0) 0 15(0) 64 64 8d = − + = =
c. 4 2(1) (1) 15(1) 64
1 15 64 50 5 2 7.07
d = − +
= − + = = ≈
d.
10
−5
−10
40
e. d is smallest when 2.74x ≈ − or when
2.74x ≈ .
2. a. The distance from d P to (0, –1) is 2 2( 1)d x y= + + . Since P is a point on
the graph of 2 8y x= − , we have:
( )
2 2 2
22 2 4 2
( ) ( 8 1)
7 13 49
d x x x
x x x x
= + − +
= + − = − +
b. 4 2(0) 0 13(0) 49 49 7d = − + = =
c. 4 2( 1) ( 1) 13( 1) 49 37 6.08d − = − − − + = ≈
d.
4–4
10
0

Chapter 3: Functions and Their Graphs
292 © 2008 Pearson Education, Inc., Upper Saddle River, NJ. All rights reserved. This material is protected under all copyright laws as they currently exist. No portion of this material may be reproduced, in any form or by any means, without permission in writing from the publisher.
e. d is smallest when 2.55x ≈ − or when 2.55x ≈ .
3. a. The distance from d P to the point (1, 0) is 2 2( 1)d x y= − + . Since P is a point on
the graph of y x= , we have:
( )22 2( ) ( 1) 1d x x x x x= − + = − +
where 0x ≥ .
b.
2
2
00
c. d is smallest when 1
2x = .
4. a. The distance from d P to the origin is 2 2d x y= + . Since P is a point on the
graph of 1yx
= , we have:
2 42 2
2 2
2
1 1 1( )
1
xd x x xx x x
xx
+⎛ ⎞= + = + =⎜ ⎟⎝ ⎠
+=
b.
5–5
8
0
c. d is smallest when 1x = − or 1x = .
5. By definition, a triangle has area 1 , base, height.2
A b h b h= = = From the figure,
we know that and .b x h y= = Expressing the area of the triangle as a function of x , we have:
( )3 41 1 1( )2 2 2
A x xy x x x= = = .
6. By definition, a triangle has area 1 , =base, height.2
A b h b h= = Because one
vertex of the triangle is at the origin and the other is on the x-axis, we know that
and .b x h y= = Expressing the area of the triangle as a function of x , we have:
( )2 31 1 9 1( ) 92 2 2 2
A x xy x x x x= = − = − .
7. a. ( )2 3( ) 16 16A x xy x x x x= = − = − +
b. Domain: { }0 4x x< <
c. The area is largest when 2.31x ≈ .
4
30
00
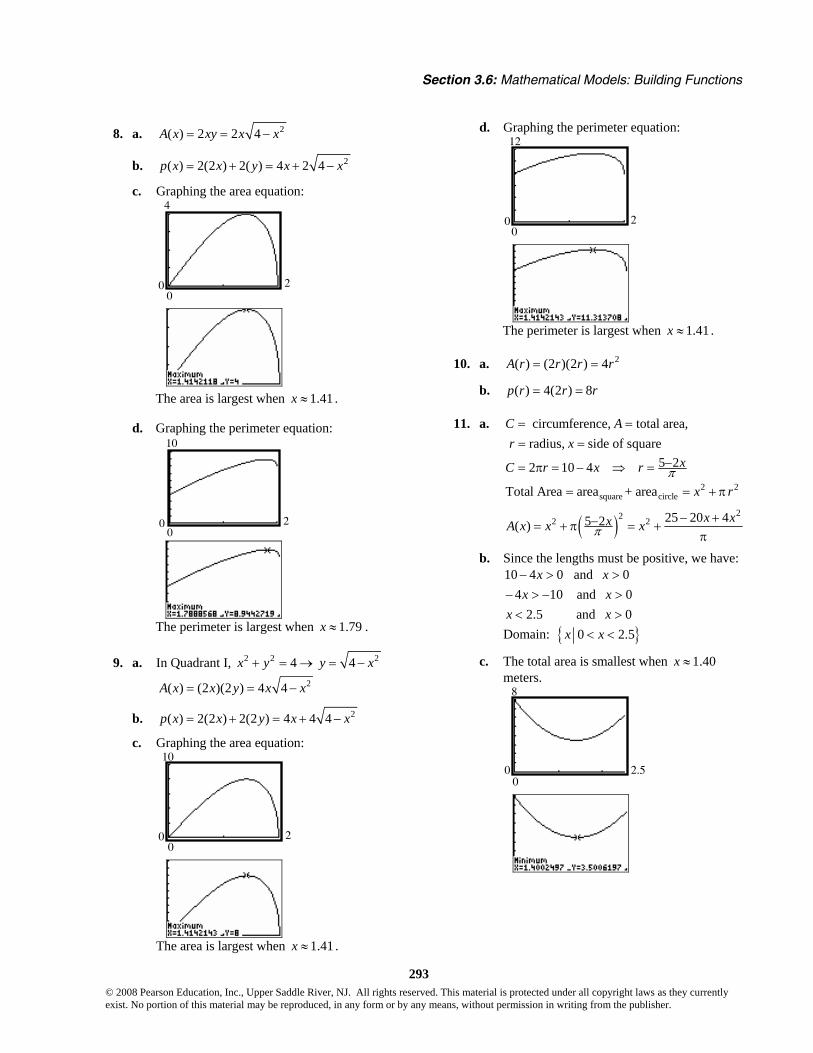
Section 3.6: Mathematical Models: Building Functions
293 © 2008 Pearson Education, Inc., Upper Saddle River, NJ. All rights reserved. This material is protected under all copyright laws as they currently exist. No portion of this material may be reproduced, in any form or by any means, without permission in writing from the publisher.
8. a. 2( ) 2 2 4A x xy x x= = −
b. 2( ) 2(2 ) 2( ) 4 2 4p x x y x x= + = + −
c. Graphing the area equation:
20
4
0
The area is largest when 1.41x ≈ .
d. Graphing the perimeter equation:
20
10
0
The perimeter is largest when 1.79x ≈ .
9. a. In Quadrant I, 2 2 24 4x y y x+ = → = − 2( ) (2 )(2 ) 4 4A x x y x x= = −
b. 2( ) 2(2 ) 2(2 ) 4 4 4p x x y x x= + = + −
c. Graphing the area equation:
2
10
00
The area is largest when 1.41x ≈ .
d. Graphing the perimeter equation:
2
12
00
The perimeter is largest when 1.41x ≈ .
10. a. 2( ) (2 )(2 ) 4A r r r r= =
b. ( ) 4(2 ) 8p r r r= =
11. a. circumference, total area, radius, side of squareC Ar x
= == =
5 22 10 4 xC r x r π−= π = − ⇒ =
2 2square circleTotal Area area + area x r= = + π
( )222 25 2 25 20 4( ) x x xA x x xπ
− − += + π = +
π
b. Since the lengths must be positive, we have: 10 4 0 and 0
4 10 and 02.5 and 0
x xx x
x x
− > >− > − >
< >
Domain: { }0 2.5x x< <
c. The total area is smallest when 1.40x ≈ meters.
2.5
8
00
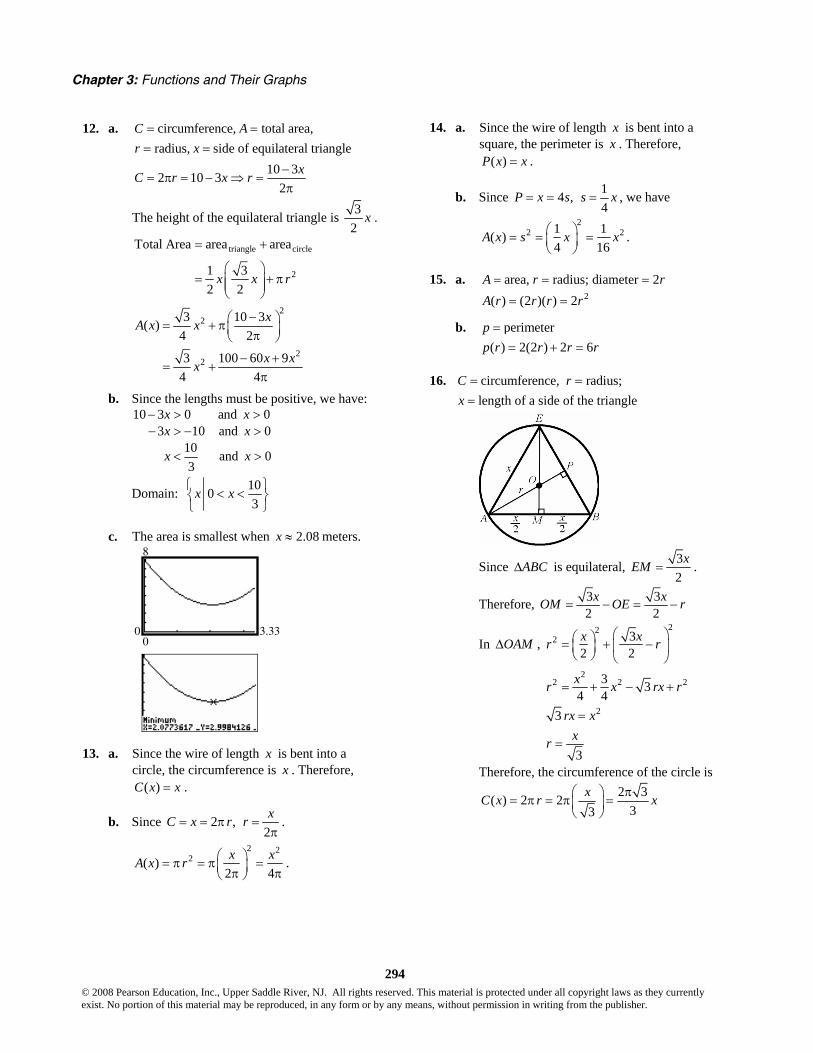
Chapter 3: Functions and Their Graphs
294 © 2008 Pearson Education, Inc., Upper Saddle River, NJ. All rights reserved. This material is protected under all copyright laws as they currently exist. No portion of this material may be reproduced, in any form or by any means, without permission in writing from the publisher.
12. a. circumference, total area, radius, side of equilateral triangle
C Ar x
= == =
10 32 10 32
xC r x r −= π = − ⇒ =
π
The height of the equilateral triangle is 32
x .
triangle circle
2
Total Area area area
1 32 2
x x r
= +
⎛ ⎞= + π⎜ ⎟⎜ ⎟
⎝ ⎠
22
22
3 10 3( )4 2
3 100 60 94 4
xA x x
x xx
−⎛ ⎞= + π⎜ ⎟π⎝ ⎠
− += +
π
b. Since the lengths must be positive, we have:
10 3 0 and 03 10 and 0
10 and 03
x xx x
x x
− > >− > − >
< >
Domain: 1003
x x⎧ ⎫< <⎨ ⎬
⎩ ⎭
c. The area is smallest when 2.08x ≈ meters.
3.330
8
0
13. a. Since the wire of length x is bent into a circle, the circumference is x . Therefore,
( )C x x= .
b. Since 2 ,2xC x r r= = π =π
.
2 22( )
2 4x xA x r ⎛ ⎞= π = π =⎜ ⎟π π⎝ ⎠
.
14. a. Since the wire of length x is bent into a square, the perimeter is x . Therefore,
( )P x x= .
b. Since 14 ,4
P x s s x= = = , we have
22 21 1( )
4 16A x s x x⎛ ⎞= = =⎜ ⎟
⎝ ⎠.
15. a. area, radius; diameter 2A r r= = = 2( ) (2 )( ) 2A r r r r= =
b. perimeterp = ( ) 2(2 ) 2 6p r r r r= + =
16. circumference, radius;length of a side of the triangle
C rx
= ==
Since ABCΔ is equilateral, 32
xEM = .
Therefore, 3 32 2
x xOM OE r= − = −
In OAMΔ , 22
2
22 2 2
2
32 2
3 34 4
3
3
x xr r
xr x rx r
rx xxr
⎛ ⎞⎛ ⎞= + −⎜ ⎟⎜ ⎟⎝ ⎠ ⎝ ⎠
= + − +
=
=
Therefore, the circumference of the circle is 2 3( ) 2 2
33xC x r xπ⎛ ⎞
= π = π =⎜ ⎟⎝ ⎠
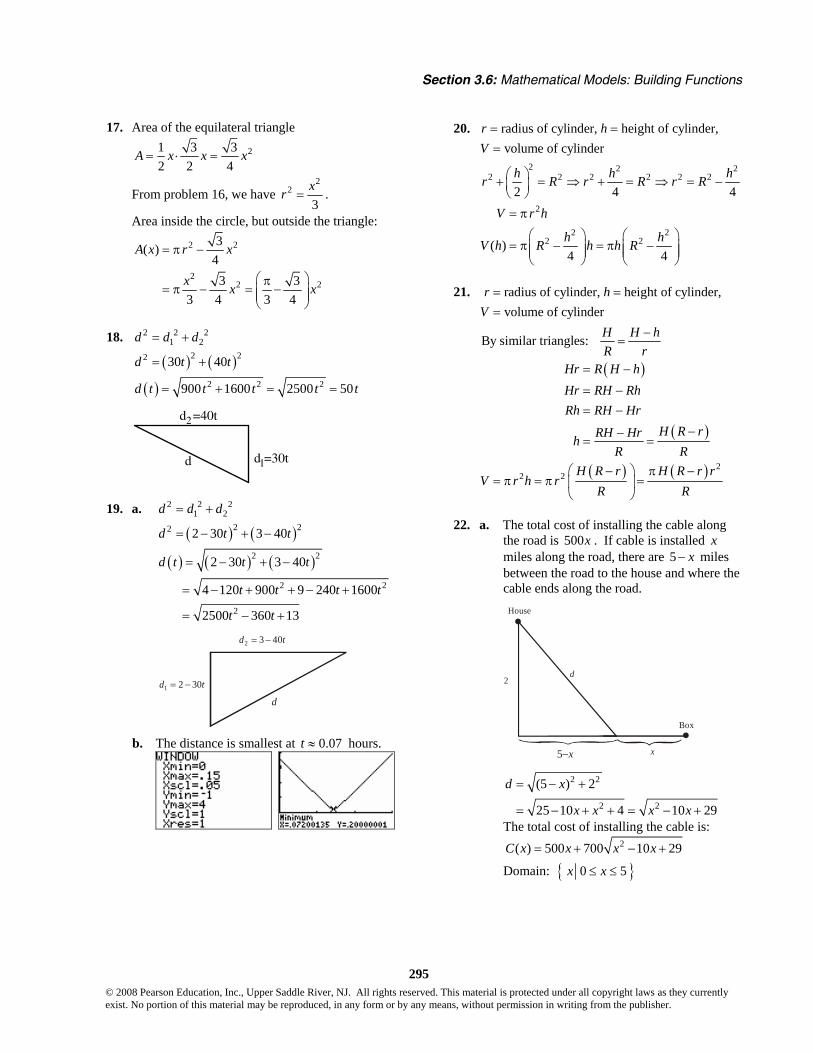
Section 3.6: Mathematical Models: Building Functions
295 © 2008 Pearson Education, Inc., Upper Saddle River, NJ. All rights reserved. This material is protected under all copyright laws as they currently exist. No portion of this material may be reproduced, in any form or by any means, without permission in writing from the publisher.
17. Area of the equilateral triangle
21 3 32 2 4
A x x x= ⋅ =
From problem 16, we have 2
2
3xr = .
Area inside the circle, but outside the triangle:
2 2
22 2
3( )4
3 33 4 3 4
A x r x
x x x
= π −
⎛ ⎞π= π − = −⎜ ⎟⎜ ⎟
⎝ ⎠
18.
( ) ( )
( )
2 2 21 2
2 22
2 2 2
30 40
900 1600 2500 50
d d d
d t t
d t t t t t
= +
= +
= + = =
d
d =40t
d =30t1
2
19. a.
( ) ( )
( ) ( ) ( )
2 2 21 2
2 22
2 2
2 2
2
2 30 3 40
2 30 3 40
4 120 900 9 240 1600
2500 360 13
d d d
d t t
d t t t
t t t t
t t
= +
= − + −
= − + −
= − + + − +
= − +
1 2 30d t= −
2 3 40d t= −
d
b. The distance is smallest at 0.07t ≈ hours.
20. radius of cylinder, height of cylinder,volume of cylinder
r hV
= ==
2 2 2
2 2 2 2 2 2
2 4 4h h hr R r R r R⎛ ⎞+ = ⇒ + = ⇒ = −⎜ ⎟
⎝ ⎠
2
2 22 2( )
4 4
V r h
h hV h R h h R
= π
⎛ ⎞ ⎛ ⎞= π − = π −⎜ ⎟ ⎜ ⎟⎜ ⎟ ⎜ ⎟
⎝ ⎠ ⎝ ⎠
21. radius of cylinder, height of cylinder,volume of cylinder
r hV
= ==
( )
( )
By similar triangles: H H hR r
Hr R H hHr RH RhRh RH Hr
H R rRH HrhR R
−=
= −
= −= −
−−= =
( ) ( ) 22 2 H R r H R r r
V r h rR R
− π −⎛ ⎞= π = π =⎜ ⎟
⎝ ⎠
22. a. The total cost of installing the cable along the road is 500x . If cable is installed x miles along the road, there are 5 x− miles between the road to the house and where the cable ends along the road.
House
Box
2d
5−x x
2 2
2 2
(5 ) 2
25 10 4 10 29
d x
x x x x
= − +
= − + + = − +
The total cost of installing the cable is: 2( ) 500 700 10 29C x x x x= + − +
Domain: { }0 5x x≤ ≤

Chapter 3: Functions and Their Graphs
296 © 2008 Pearson Education, Inc., Upper Saddle River, NJ. All rights reserved. This material is protected under all copyright laws as they currently exist. No portion of this material may be reproduced, in any form or by any means, without permission in writing from the publisher.
b. ( ) ( )2(1) 500 1 700 1 10 1 29
500 700 20 $3630.50
C = + − +
= + =
c. ( ) ( )2(3) 500 3 700 3 10 3 29
1500 700 8 $3479.90
C = + − +
= + =
d.
50
4500
3000 e. Using MINIMUM, the graph indicates that
2.96x ≈ miles results in the least cost.
23. a. The time on the boat is given by 1
3d
. The
time on land is given by 125
x− .
x
2
12–x
d1
Island
Town
P
2 2 21 2 4d x x= + = +
The total time for the trip is: 2
112 12 4( )5 3 5 3
dx x xT x − − += + = +
b. Domain: { }0 12x x≤ ≤
c. 212 4 4 4(4)
5 38 20 3.09 hours5 3
T − += +
= + ≈
d. 212 8 8 4(8)
5 34 68 3.55 hours5 3
T − += +
= + ≈
24. Consider the diagrams shown below.
There is a pair of similar triangles in the diagram. Since the smaller triangle is similar to the larger triangle, we have the proportion
4 1 116 4 4
r r r hh h
= ⇒ = ⇒ =
Substituting into the volume formula for the conical portion of water gives
( )2
2 31 1 1 13 3 4 48
V h r h h h hπ π π⎛ ⎞= = =⎜ ⎟⎝ ⎠
.
Chapter 3 Review Exercises
1. This relation represents a function. Domain = {–1, 2, 4}; Range = {0, 3}.
2. This relation does not represent a function, since 4 is paired with two different values.
3. 23( )
1xf x
x=
−
a. 23(2) 6 6(2) 2
4 1 3(2) 1f = = = =
−−

Chapter 3 Review Exercises
297 © 2008 Pearson Education, Inc., Upper Saddle River, NJ. All rights reserved. This material is protected under all copyright laws as they currently exist. No portion of this material may be reproduced, in any form or by any means, without permission in writing from the publisher.
b. 23( 2) 6 6( 2) 2
4 1 3( 2) 1f − − −− = = = = −
−− −
c. 2 23( ) 3( )
( ) 1 1x xf x
x x− −− = =
− − −
d. 2 23 3( )
1 1x xf x
x x−⎛ ⎞− = − =⎜ ⎟
− −⎝ ⎠
e.
( )
2
2 2
3( 2)( 2)( 2) 1
3 23 64 4 1 4 3
xf xx
xxx x x x
−− =
− −
−−= =− + − − +
f. 2 23(2 ) 6(2 )
(2 ) 1 4 1x xf x
x x= =
− −
4. 2
( )1
xf xx
=+
a. 22 4(2)
2 1 3f = =
+
b. ( )22 4( 2) 4
2 1 1f
−− = = = −
− + −
c. 2 2( )( )1 1
x xf xx x
−− = =
− + − +
d. 2 2
( )1 1
x xf xx x
−− = − =+ +
e. ( )22 2( 2)( 2)
( 2) 1 1xxf x
x x−−
− = =− + −
f. 2 2(2 ) 4(2 )
(2 ) 1 2 1x xf x
x x= =
+ +
5. 2( ) 4f x x= −
a. 2(2) 2 4 4 4 0 0f = − = − = =
b. ( )2( 2) 2 4 4 4 0 0f − = − − = − = =
c. 2 2( ) ( ) 4 4f x x x− = − − = −
d. 2( ) 4f x x− = − −
e. 2
2
2
( 2) ( 2) 4
4 4 4
4
f x x
x x
x x
− = − −
= − + −
= −
f.
( )
2 2
2 2
(2 ) (2 ) 4 4 4
4 1 2 1
f x x x
x x
= − = −
= − = −
6. 2( ) 4f x x= −
a. 2(2) 2 4 4 4 0 0f = − = − = =
b. ( )2( 2) 2 4 4 4 0 0f − = − − = − = =
c. 2 2( ) ( ) 4 4f x x x− = − − = −
d. 2( ) 4f x x− = − −
e. 2
2
2
( 2) ( 2) 4
4 4 4
4
f x x
x x
x x
− = − −
= − + −
= −
f.
( )
2 2
2 2
(2 ) (2 ) 4 4 4
4 1 4 1
f x x x
x x
= − = −
= − = −
7. 2
24( ) xf x
x−=
a. 2
22 4 4 4 0(2) 0
4 42f − −= = = =
b. ( )
( )
2
2
2 4 4 4 0( 2) 04 42
f− − −− = = = =
−
c. 2 2
2 2( ) 4 4( )
( )x xf x
x x− − −− = =
−
d. 2 2 2
2 2 24 4 4( ) x x xf x
x x x⎛ ⎞− − −− = − = = −⎜ ⎟⎝ ⎠
e.
( )
2 2
2 2
2
2 2
( 2) 4 4 4 4( 2)( 2) ( 2)
44( 2) ( 2)
x x xf xx x
x xx xx x
− − − + −− = =− −
−−= =− −
Chapter 3: Functions and Their Graphs
298 © 2008 Pearson Education, Inc., Upper Saddle River, NJ. All rights reserved. This material is protected under all copyright laws as they currently exist. No portion of this material may be reproduced, in any form or by any means, without permission in writing from the publisher.
f.
( )
2 2
2 2
2 2
2 2
(2 ) 4 4 4(2 )(2 ) 4
4 1 14
x xf xx x
x xx x
− −= =
− −= =
8. 3
2( )9
xf xx
=−
a. 3
22 8 8 8(2)
4 9 5 52 9f = = = = −
− −−
b. ( )
( )
3
2
2 8 8 8(2)4 9 5 52 9
f− − −= = = =
− −− −
c. 3 3
2 2( )( )
( ) 9 9x xf x
x x− −− = =
− − −
d. 3 3
2 2( )9 9
x xf xx x
−− = − =− −
e. 3
2
3
2
3
2
( 2)( 2)( 2) 9
( 2)4 4 9
( 2)4 5
xf xx
xx x
xx x
−− =
− −
−=
− + −−
=− −
f. 3 3
2 2(2 ) 8(2 )
(2 ) 9 4 9x xf x
x x= =
− −
9. 2( )9
xf xx
=−
The denominator cannot be zero: 2 9 0
( 3)( 3) 03 or 3
xx x
x
− ≠+ − ≠
≠ −
Domain: { }3, 3x x x≠ − ≠
10. 23( )2
xf xx
=−
The denominator cannot be zero: 2 0
2x
x− ≠
≠
Domain: { }2x x ≠
11. ( ) 2f x x= − The radicand must be non-negative: 2 0
2xx
− ≥≤
Domain: { } ( ]2 or , 2x x ≤ −∞
12. ( ) 2f x x= + The radicand must be non-negative:
2 02
xx
+ ≥≥ −
Domain: { } [ )2 or 2,x x ≥ − − ∞
13. ( ) xf xx
=
The radicand must be non-negative and the denominator cannot be zero: 0x > Domain: { } ( )0 or 0,x x > ∞
14. ( )x
g xx
=
The denominator cannot be zero: 0x ≠
Domain: { }0x x ≠
15. 2( )2 3xf x
x x=
+ −
The denominator cannot be zero:
( )( )
{ }
2 2 3 03 1 03 or 1
Domain: 3, 1
x xx x
x
x x x
+ − ≠
+ − ≠
≠ −
≠ − ≠
16. ( ) 213 4
F xx x
=− −
The denominator cannot be zero:
( )( )
{ }
2 3 4 01 4 01 or 4
Domain: 1, 4
x xx x
x
x x x
− − ≠
+ − ≠
≠ −
≠ − ≠

Chapter 3 Review Exercises
299 © 2008 Pearson Education, Inc., Upper Saddle River, NJ. All rights reserved. This material is protected under all copyright laws as they currently exist. No portion of this material may be reproduced, in any form or by any means, without permission in writing from the publisher.
17. ( ) 2 ( ) 3 1f x x g x x= − = +
( )( )( ) ( )2 3 1 2 3
f g x f x g xx x x
+ = +
= − + + = +
Domain: { } is any real numberx x
( )( )
( )( ) ( )
2 3 12 3 1
4 1
f g x f x g x
x xx x
x
− = −
= − − +
= − − −= − +
Domain: { } is any real numberx x
( )( )( )
2
2
( )( ) ( )
2 3 1
6 2 3
3 5 2
f g x f x g x
x x
x x x
x x
⋅ = ⋅
= − +
= + − −
= − + +
Domain: { } is any real numberx x
( )( )
2( )3 1
f xf xxg xg x
−⎛ ⎞ = =⎜ ⎟ +⎝ ⎠
3 1 013 13
x
x x
+ ≠
≠ − ⇒ ≠ −
1Domain: 3
x x⎧ ⎫≠ −⎨ ⎬⎩ ⎭
18. ( ) 2 1 ( ) 2 1f x x g x x= − = +
( )( )( ) ( )2 1 2 14
f g x f x g xx xx
+ = +
= − + +=
Domain: { } is any real numberx x
( )( )
( )( ) ( )
2 1 2 12 1 2 1
2
f g x f x g x
x xx x
− = −
= − − +
= − − −= −
Domain: { } is any real numberx x
( )( )( )
2
( )( ) ( )
2 1 2 1
4 1
f g x f x g x
x x
x
⋅ = ⋅
= − +
= −
Domain: { } is any real numberx x
( )( )
2 1( )2 1
f xf xxg xg x
−⎛ ⎞ = =⎜ ⎟ +⎝ ⎠
12 1 0 2 12
x x x+ ≠ ⇒ ≠ − ⇒ ≠ −
{ }12Domain: x x ≠ −
19. 2( ) 3 1 ( ) 3f x x x g x x= + + =
( )2
2
( )( ) ( )
3 1 3
3 4 1
f g x f x g x
x x x
x x
+ = +
= + + +
= + +
Domain: { }is any real numberx x
( )2
2
( )( ) ( )
3 1 3
3 2 1
f g x f x g x
x x x
x x
− = −
= + + −
= − +
Domain: { }is any real numberx x
( )( )( )2
3 2
( )( ) ( )
3 1 3
9 3 3
f g x f x g x
x x x
x x x
⋅ = ⋅
= + +
= + +
Domain: { }is any real numberx x
( )( )
23 1( )3
f xf x xxg xg x
+ +⎛ ⎞ = =⎜ ⎟⎝ ⎠
3 0 0x x≠ ⇒ ≠ { }Domain: 0x x ≠
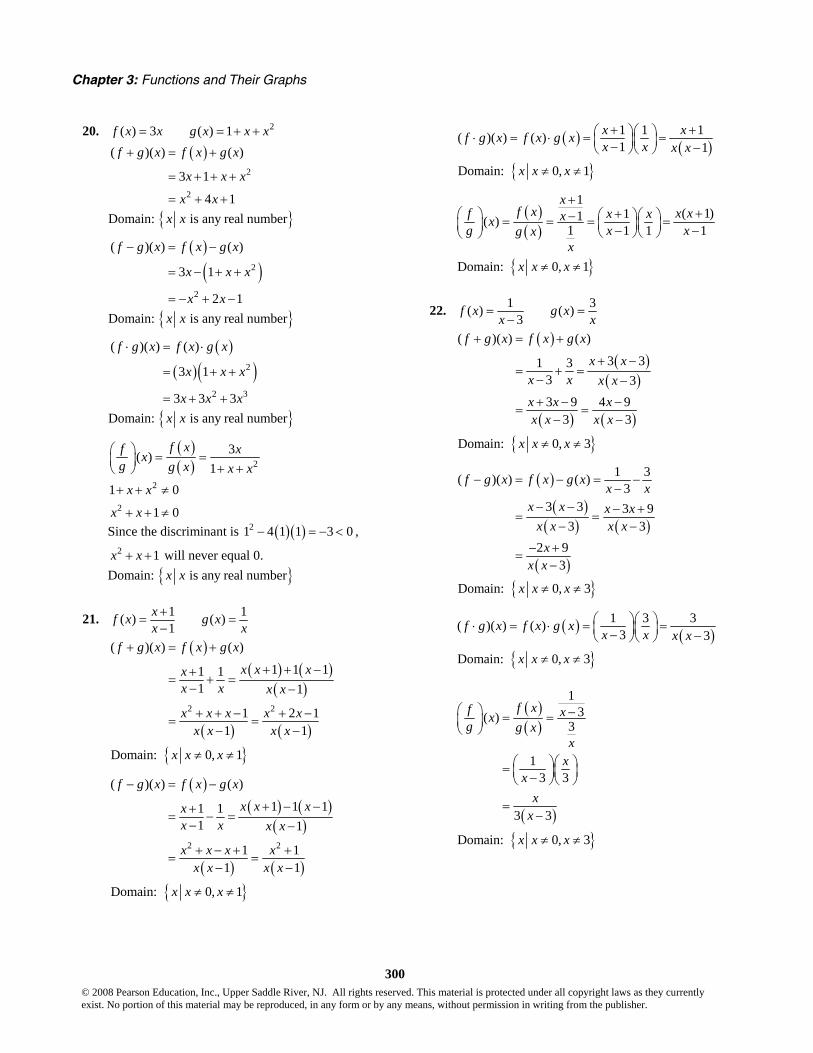
Chapter 3: Functions and Their Graphs
300 © 2008 Pearson Education, Inc., Upper Saddle River, NJ. All rights reserved. This material is protected under all copyright laws as they currently exist. No portion of this material may be reproduced, in any form or by any means, without permission in writing from the publisher.
20. 2( ) 3 ( ) 1f x x g x x x= = + +
( )2
2
( )( ) ( )
3 1
4 1
f g x f x g x
x x x
x x
+ = +
= + + +
= + +
Domain: { } is any real numberx x
( )( )2
2
( )( ) ( )
3 1
2 1
f g x f x g x
x x x
x x
− = −
= − + +
= − + −
Domain: { } is any real numberx x
( )( )( )2
2 3
( )( ) ( )
3 1
3 3 3
f g x f x g x
x x x
x x x
⋅ = ⋅
= + +
= + +
Domain: { } is any real numberx x
( )( ) 2
3( )1
f xf xxg g x x x
⎛ ⎞ = =⎜ ⎟ + +⎝ ⎠
2
2
1 0
1 0
x x
x x
+ + ≠
+ + ≠
Since the discriminant is ( )( )21 4 1 1 3 0− = − < , 2 1x x+ + will never equal 0.
Domain: { } is any real numberx x
21. 1 1( ) ( )1
xf x g xx x
+= =−
( )( ) ( )
( )
( ) ( )2 2
( )( ) ( )
1 1 11 11 1
1 2 11 1
f g x f x g x
x x xxx x x x
x x x x xx x x x
+ = +
+ + −+= + =− −
+ + − + −= =− −
{ }Domain: 0, 1x x x≠ ≠
( )( ) ( )
( )
( ) ( )2 2
( )( ) ( )
1 1 11 11 1
1 11 1
f g x f x g x
x x xxx x x x
x x x xx x x x
− = −
+ − −+= − =− −
+ − + += =− −
{ }Domain: 0, 1x x x≠ ≠
( ) ( )1 1 1( )( ) ( )1 1
x xf g x f x g xx x x x
+ +⎛ ⎞⎛ ⎞⋅ = ⋅ = =⎜ ⎟⎜ ⎟− −⎝ ⎠⎝ ⎠
{ }Domain: 0, 1x x x≠ ≠
( )( )
1( 1)11( )
1 1 1 1
xf xf x xx xxx
g x xg xx
+++⎛ ⎞ ⎛ ⎞⎛ ⎞−= = = =⎜ ⎟⎜ ⎟⎜ ⎟ − −⎝ ⎠⎝ ⎠⎝ ⎠
{ }Domain: 0, 1x x x≠ ≠
22. 1 3( ) ( )3
f x g xx x
= =−
( )( )
( )
( ) ( )
( )( ) ( )
3 31 33 33 9 4 9
3 3
f g x f x g x
x xx x x xx x xx x x x
+ = +
+ −= + =
− −
+ − −= =− −
{ }Domain: 0, 3x x x≠ ≠
( )
( )( ) ( )
( )
1 3( )( ) ( )3
3 3 3 93 3
2 93
f g x f x g xx x
x x x xx x x x
xx x
− = − = −−
− − − += =− −
− +=−
{ }Domain: 0, 3x x x≠ ≠
( ) ( )1 3 3( )( ) ( )
3 3f g x f x g x
x x x x⎛ ⎞⎛ ⎞⋅ = ⋅ = =⎜ ⎟⎜ ⎟− −⎝ ⎠⎝ ⎠
{ }Domain: 0, 3x x x≠ ≠
( )( )
( )
13( )
3
13 3
3 3
f xf xxg g x
xx
xx
x
⎛ ⎞ −= =⎜ ⎟⎝ ⎠
⎛ ⎞⎛ ⎞= ⎜ ⎟⎜ ⎟−⎝ ⎠⎝ ⎠
=−
{ }Domain: 0, 3x x x≠ ≠

Chapter 3 Review Exercises
301 © 2008 Pearson Education, Inc., Upper Saddle River, NJ. All rights reserved. This material is protected under all copyright laws as they currently exist. No portion of this material may be reproduced, in any form or by any means, without permission in writing from the publisher.
23. 2( ) 2 1f x x x= − + +
( ) ( )
( ) ( ) ( )
( )
( )
2 2
2 2 2
2 2 2
2
2 1 2 1
2 2 1 2 1
2 4 2 1 2 1
4 2 14 2
4 2 1
f x h f xh
x h x h x xh
x xh h x h x xh
x xh h x h x xh
h x hxh h hh h
x h
+ −
− + + + + − − + +=
− + + + + + + − −=
− − − + + + + − −=
− − +− − += =
= − − +
24. 2( ) 3 2 4f x x x= − + ( ) ( )
( ) ( ) ( )
( )
( )
2 2
2 2 2
2 2 2
2
3 2 4 3 2 4
3 2 2 2 4 3 2 4
3 6 3 2 2 4 3 2 4
6 3 26 3 2
6 3 2
f x h f xh
x h x h x xh
x xh h x h x xh
x xh h x h x xh
h x hxh h hh h
x h
+ −
+ − + + − − +=
+ + − − + − + −=
+ + − − + − + −=
+ −+ −= =
= + −
25. a. Domain:{ }4 3x x− ≤ ≤ ; [ ]4, 3−
Range: { }3 3y y− ≤ ≤ ; [ ]3, 3−
b. x-intercept: ( )0,0 ; y-intercept: ( )0,0
c. ( )2 1f − = −
d. ( ) 3f x = − when x = –4
e. ( ) 0f x > when 0 3x< ≤
f. To graph ( )3y f x= − , shift the graph of f horizontally 3 units to the right.
g. To graph 12
y f x⎛ ⎞= ⎜ ⎟⎝ ⎠
, stretch the graph of
f horizontally by a factor of 2.
h. To graph ( )y f x= − , reflect the graph of f vertically about the y-axis.
26. a. Domain: { }5 4x x− ≤ ≤ ; [ ]5, 4−
Range: { }3 1y y− ≤ ≤ ; [ ]3, 1−
b. ( 1) 1g − =
c. x-intercepts: 0,4 ; y-intercept: 0
d. ( ) 3g x = − when 3x =
e. ( ) 0g x > when 5 0x− ≤ <
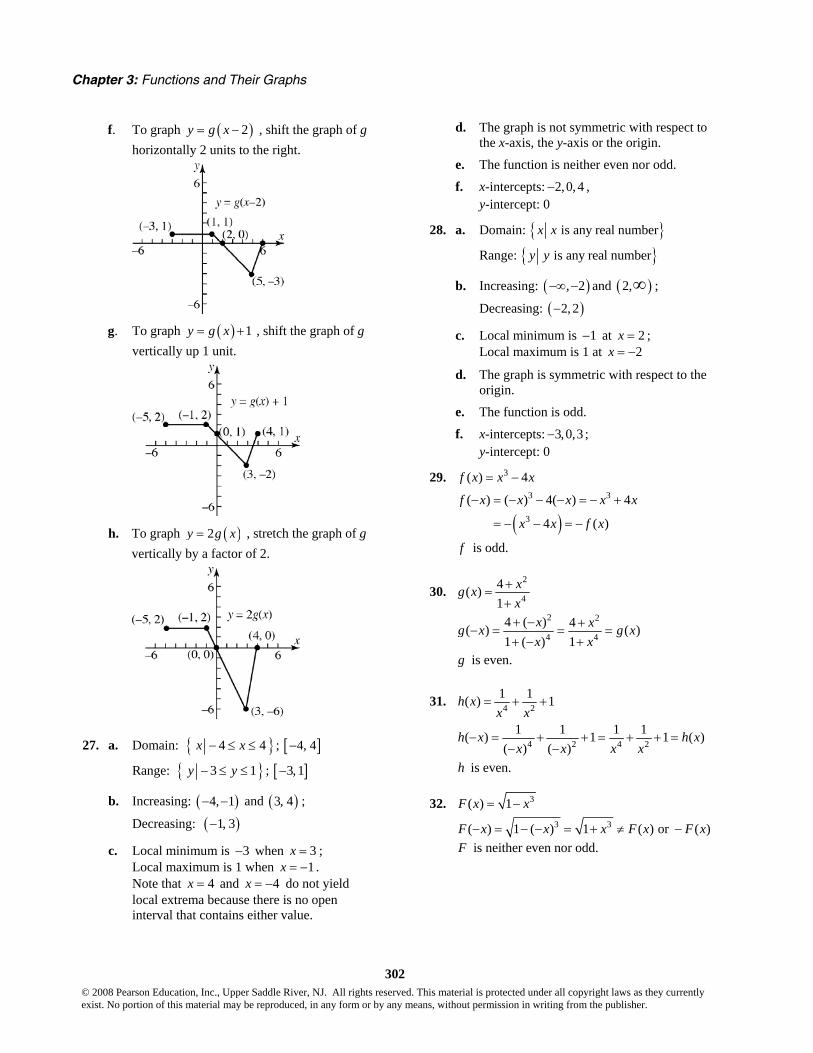
Chapter 3: Functions and Their Graphs
302 © 2008 Pearson Education, Inc., Upper Saddle River, NJ. All rights reserved. This material is protected under all copyright laws as they currently exist. No portion of this material may be reproduced, in any form or by any means, without permission in writing from the publisher.
f. To graph ( )2y g x= − , shift the graph of g horizontally 2 units to the right.
g. To graph ( ) 1y g x= + , shift the graph of g
vertically up 1 unit.
h. To graph ( )2y g x= , stretch the graph of g
vertically by a factor of 2.
27. a. Domain: { }4 4x x− ≤ ≤ ; [ ]4, 4−
Range: { }3 1y y− ≤ ≤ ; [ ]3, 1−
b. Increasing: ( )4, 1− − and ( )3, 4 ;
Decreasing: ( )1, 3−
c. Local minimum is 3− when 3x = ; Local maximum is 1 when 1x = − . Note that 4x = and 4x = − do not yield local extrema because there is no open interval that contains either value.
d. The graph is not symmetric with respect to the x-axis, the y-axis or the origin.
e. The function is neither even nor odd.
f. x-intercepts: 2,0, 4− , y-intercept: 0
28. a. Domain: { }is any real numberx x
Range: { }is any real numbery y
b. Increasing: ( ), 2−∞ − and ( )2,∞ ;
Decreasing: ( )2, 2−
c. Local minimum is 1− at 2x = ; Local maximum is 1 at 2x = −
d. The graph is symmetric with respect to the origin.
e. The function is odd.
f. x-intercepts: 3,0,3− ; y-intercept: 0
29. 3( ) 4f x x x= −
( )3 3
3
( ) ( ) 4( ) 4
4 ( )
f x x x x x
x x f x
− = − − − = − +
= − − = −
f is odd.
30. 2
44( )1
xg xx
+=+
2 2
4 44 ( ) 4( ) ( )1 ( ) 1
x xg x g xx x
+ − +− = = =+ − +
g is even.
31. 4 21 1( ) 1h xx x
= + +
4 2 4 21 1 1 1( ) 1 1 ( )
( ) ( )h x h x
x x x x− = + + = + + =
− −
h is even.
32. 3( ) 1F x x= − 3 3( ) 1 ( ) 1 ( ) or ( )F x x x F x F x− = − − = + ≠ −
F is neither even nor odd.

Chapter 3 Review Exercises
303 © 2008 Pearson Education, Inc., Upper Saddle River, NJ. All rights reserved. This material is protected under all copyright laws as they currently exist. No portion of this material may be reproduced, in any form or by any means, without permission in writing from the publisher.
33. 3( ) 1G x x x= − + 3
3
( ) 1 ( ) ( )
1 ( ) or ( )
G x x x
x x G x G x
− = − − + −
= + − ≠ −
G is neither even nor odd.
34. 2( ) 1H x x x= + + 2
2
( ) 1 ( ) ( )
1 ( ) or ( )
H x x x
x x H x H x
− = + − + −
= − + ≠ −
H is neither even nor odd.
35. 2( )1
xf xx
=+
2 2( ) ( )1 ( ) 1
x xf x f xx x
− −− = = = −+ − +
f is odd.
36. 2
31( ) xg x
x+=
2 2 2
3 3 31 ( ) 1 1( ) ( )
( )x x xg x g x
x x x+ − + +− = = = − = −− −
g is odd.
37. ( ) 32 5 1f x x x= − + on the interval ( )3,3− Use MAXIMUM and MINIMUM on the graph of 3
1 2 5 1y x x= − + .
20
−3 3
−20
20
−3 3
−20 local maximum at: ( 0.91, 4.04)− ; local minimum at: (0.91, 2.04)− ; f is increasing on: ( 3, 0.91)− − and (0.91,3) ; f is decreasing on: ( 0.91,0.91)− .
38. ( ) 3 3 5f x x x= − + − on the interval ( 3, 3)− Use MAXIMUM and MINIMUM on the graph of 3
1 3 5y x x= − + − .
20
−3 3
−20
20
−3 3
−20 local maximum at: (1, 3)− ; local minimum at: ( 1, 7)− − ; f is increasing on: ( 1, 1)− ; f is decreasing on: ( 3, 1)− − and (1, 3) .
39. ( ) 4 32 5 2 1f x x x x= − + + on the interval ( )2,3− Use MAXIMUM and MINIMUM on the graph of 4 3
1 2 5 2 1y x x x= − + + .
−2
20
3
−10
−2
20
3
−10
−2
20
3
−10 local maximum at: (0.41, 1.53) ; local minima at: ( 0.34, 0.54)− and (1.80, 3.56)− ; f is increasing on: ( 0.34, 0.41)− and (1.80, 3) ; f is decreasing on: ( 2, 0.34)− − and (0.41, 1.80) .
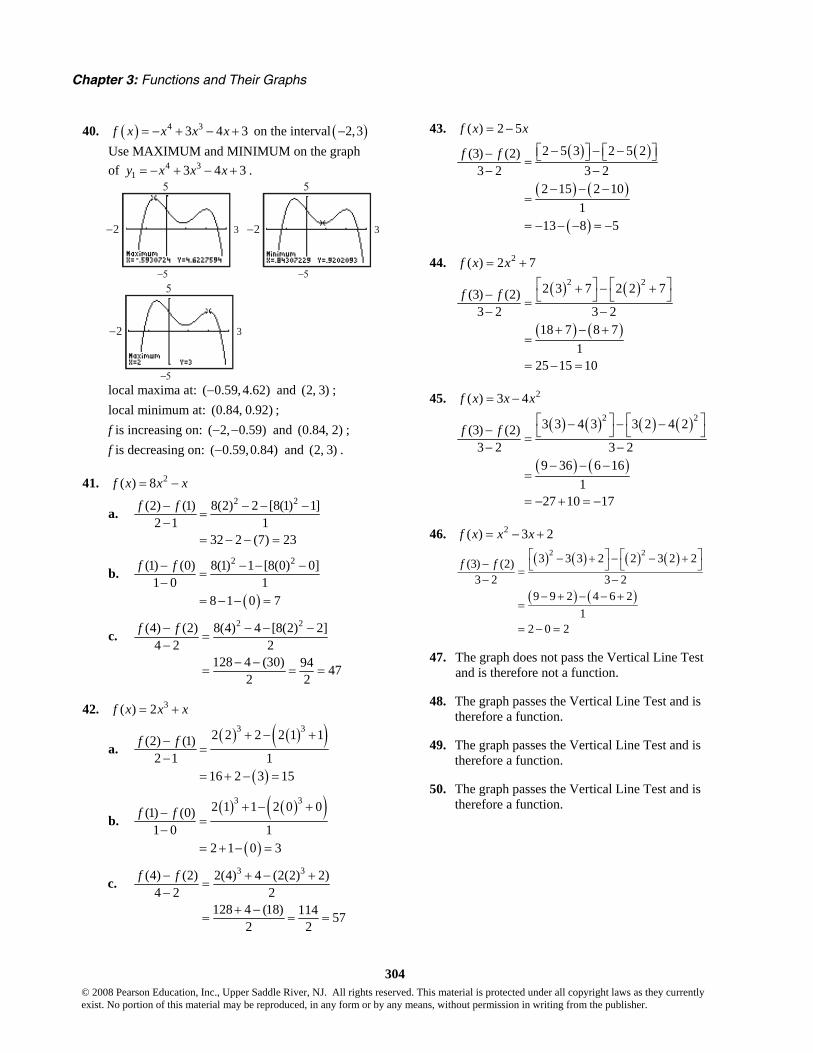
Chapter 3: Functions and Their Graphs
304 © 2008 Pearson Education, Inc., Upper Saddle River, NJ. All rights reserved. This material is protected under all copyright laws as they currently exist. No portion of this material may be reproduced, in any form or by any means, without permission in writing from the publisher.
40. ( ) 4 33 4 3f x x x x= − + − + on the interval ( )2,3− Use MAXIMUM and MINIMUM on the graph of 4 3
1 3 4 3y x x x= − + − + .
5
−5
−2 3
5
−5
−2 3
5
−5
−2 3
local maxima at: ( 0.59, 4.62)− and (2, 3) ; local minimum at: (0.84, 0.92) ; f is increasing on: ( 2, 0.59)− − and (0.84, 2) ; f is decreasing on: ( 0.59,0.84)− and (2, 3) .
41. 2( ) 8f x x x= −
a. 2 2(2) (1) 8(2) 2 [8(1) 1]
2 1 132 2 (7) 23
f f− − − −=
−= − − =
b.
( )
2 2(1) (0) 8(1) 1 [8(0) 0]1 0 1
8 1 0 7
f f− − − −=
−= − − =
c. 2 2(4) (2) 8(4) 4 [8(2) 2]
4 2 2128 4 (30) 94 47
2 2
f f− − − −=
−− −
= = =
42. 3( ) 2f x x x= +
a. ( ) ( )( )
( )
3 32 2 2 2 1 1(2) (1)2 1 1
16 2 3 15
f f + − +−=
−= + − =
b. ( ) ( )( )
( )
3 32 1 1 2 0 0(1) (0)1 0 1
2 1 0 3
f f + − +−=
−= + − =
c. 3 3(4) (2) 2(4) 4 (2(2) 2)
4 2 2128 4 (18) 114 57
2 2
f f− + − +=
−+ −
= = =
43. ( ) 2 5f x x= −
( ) ( )
( ) ( )
( )
2 5 3 2 5 2(3) (2)3 2 3 2
2 15 2 101
13 8 5
f f − − −⎡ ⎤ ⎡ ⎤− ⎣ ⎦ ⎣ ⎦=− −
− − −=
= − − − = −
44. 2( ) 2 7f x x= +
( ) ( )
( ) ( )
2 22 3 7 2 2 7(3) (2)3 2 3 2
18 7 8 71
25 15 10
f f⎡ ⎤ ⎡ ⎤+ − +− ⎣ ⎦ ⎣ ⎦=
− −+ − +
=
= − =
45. 2( ) 3 4f x x x= −
( ) ( ) ( ) ( )
( ) ( )
2 23 3 4 3 3 2 4 2(3) (2)3 2 3 2
9 36 6 161
27 10 17
f f⎡ ⎤ ⎡ ⎤− − −− ⎣ ⎦ ⎣ ⎦=
− −− − −
=
= − + = −
46. 2( ) 3 2f x x x= − +
( ) ( ) ( ) ( )
( ) ( )
2 23 3 3 2 2 3 2 2(3) (2)3 2 3 2
9 9 2 4 6 21
2 0 2
f f⎡ ⎤ ⎡ ⎤− + − − +− ⎣ ⎦ ⎣ ⎦=
− −− + − − +
=
= − =
47. The graph does not pass the Vertical Line Test and is therefore not a function.
48. The graph passes the Vertical Line Test and is therefore a function.
49. The graph passes the Vertical Line Test and is therefore a function.
50. The graph passes the Vertical Line Test and is therefore a function.

Chapter 3 Review Exercises
305 © 2008 Pearson Education, Inc., Upper Saddle River, NJ. All rights reserved. This material is protected under all copyright laws as they currently exist. No portion of this material may be reproduced, in any form or by any means, without permission in writing from the publisher.
51. ( )f x x=
52. 3( )f x x=
53. ( )f x x=
54. 1( )f xx
=
55. ( ) 4F x x= − . Using the graph of y x= , vertically shift the graph downward 4 units.
Intercepts: (–4,0), (4,0), (0,–4) Domain: { }is any real numberx x
Range: { }4y y ≥ − or [ )4,− ∞
56. ( ) 4f x x= + . Using the graph of y x= , vertically shift the graph upward 4 units.
Intercepts: (0, 4) Domain: { }is any real numberx x
Range: { }4y y ≥ or [ )4, ∞
57. ( ) 2g x x= − . Reflect the graph of y x= about the x-axis and vertically stretch the graph by a factor of 2.
Intercepts: (0, 0) Domain: { }is any real numberx x
Range: { }0y y ≤ or ( ], 0−∞
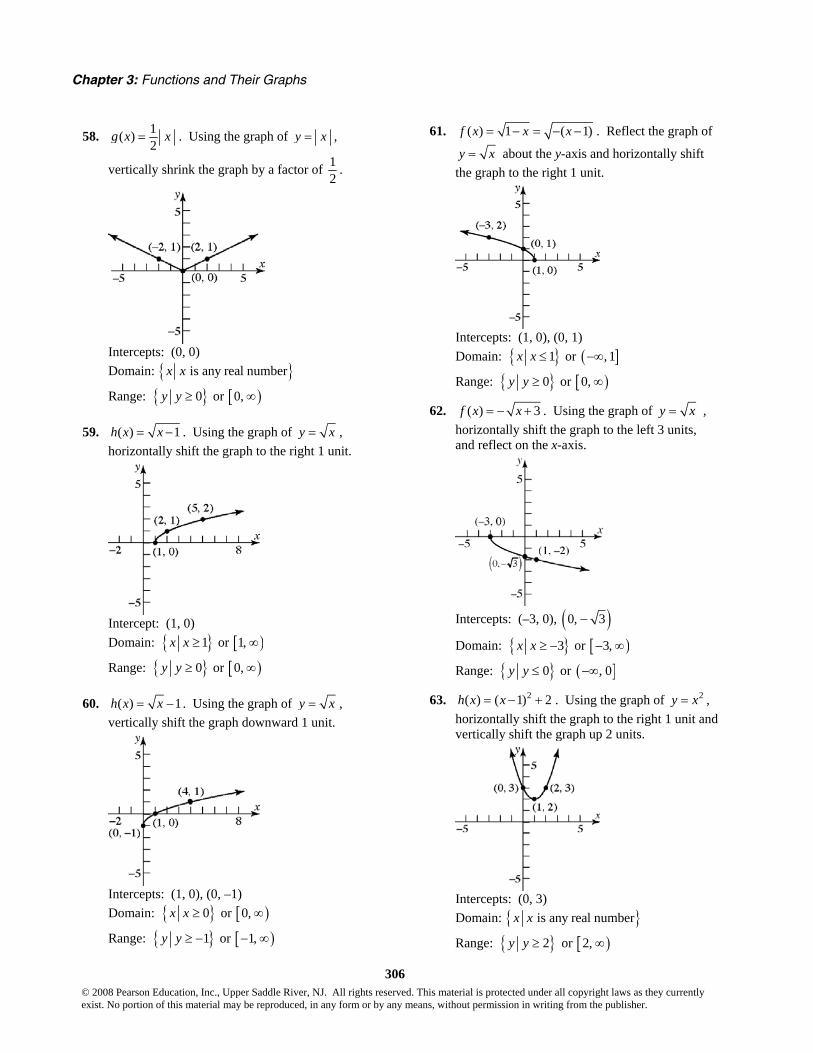
Chapter 3: Functions and Their Graphs
306 © 2008 Pearson Education, Inc., Upper Saddle River, NJ. All rights reserved. This material is protected under all copyright laws as they currently exist. No portion of this material may be reproduced, in any form or by any means, without permission in writing from the publisher.
58. 1( )2
g x x= . Using the graph of y x= ,
vertically shrink the graph by a factor of 12
.
Intercepts: (0, 0) Domain: { } is any real numberx x
Range: { }0y y ≥ or [ )0, ∞
59. ( ) 1h x x= − . Using the graph of y x= , horizontally shift the graph to the right 1 unit.
Intercept: (1, 0) Domain: { }1x x ≥ or [ )1, ∞
Range: { }0y y ≥ or [ )0, ∞
60. ( ) 1h x x= − . Using the graph of y x= , vertically shift the graph downward 1 unit.
Intercepts: (1, 0), (0, –1) Domain: { }0x x ≥ or [ )0, ∞
Range: { }1y y ≥ − or [ )1,− ∞
61. ( ) 1 ( 1)f x x x= − = − − . Reflect the graph of
y x= about the y-axis and horizontally shift the graph to the right 1 unit.
Intercepts: (1, 0), (0, 1) Domain: { }1x x ≤ or ( ], 1−∞
Range: { }0y y ≥ or [ )0, ∞
62. ( ) 3f x x= − + . Using the graph of y x= , horizontally shift the graph to the left 3 units, and reflect on the x-axis.
Intercepts: (–3, 0), ( )0, 3−
Domain: { }3x x ≥ − or [ )3,− ∞
Range: { }0y y ≤ or ( ], 0−∞
63. 2( ) ( 1) 2h x x= − + . Using the graph of 2y x= , horizontally shift the graph to the right 1 unit and vertically shift the graph up 2 units.
Intercepts: (0, 3) Domain: { }is any real numberx x
Range: { }2y y ≥ or [ )2, ∞
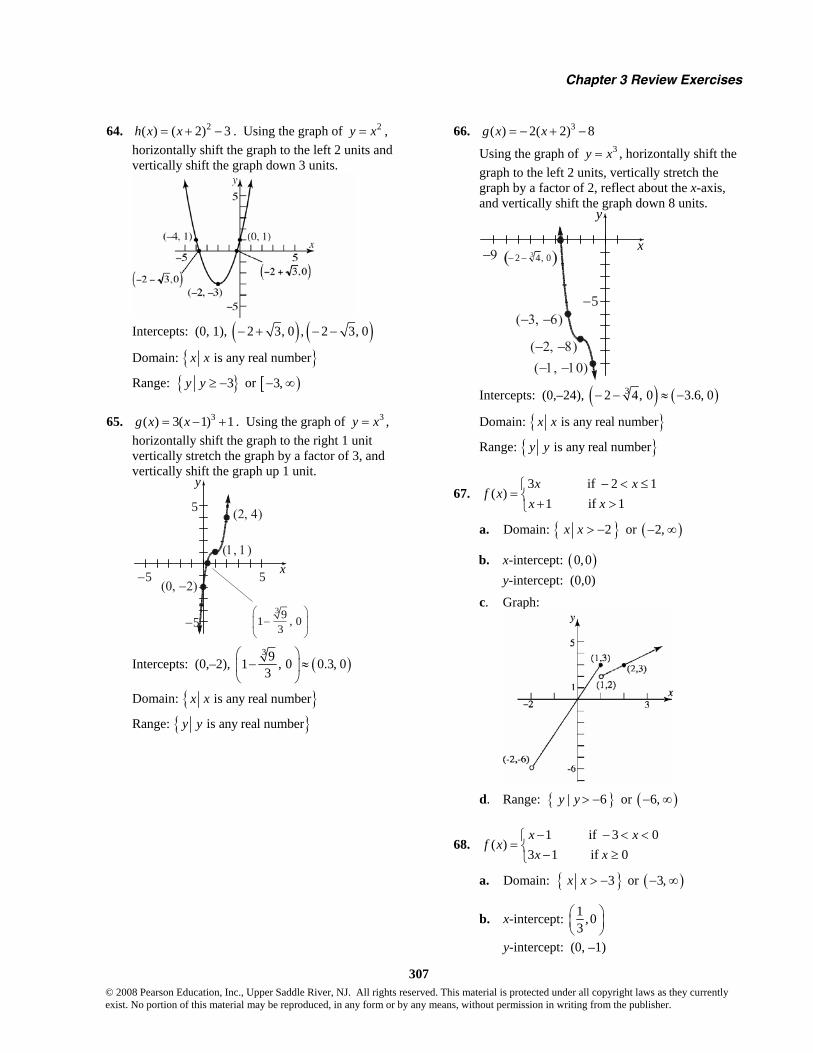
Chapter 3 Review Exercises
307 © 2008 Pearson Education, Inc., Upper Saddle River, NJ. All rights reserved. This material is protected under all copyright laws as they currently exist. No portion of this material may be reproduced, in any form or by any means, without permission in writing from the publisher.
64. 2( ) ( 2) 3h x x= + − . Using the graph of 2y x= , horizontally shift the graph to the left 2 units and vertically shift the graph down 3 units.
Intercepts: (0, 1), ( ) ( )2 3, 0 , 2 3, 0− + − −
Domain: { } is any real numberx x
Range: { }3y y ≥ − or [ )3,− ∞
65. 3( ) 3( 1) 1g x x= − + . Using the graph of 3y x= , horizontally shift the graph to the right 1 unit vertically stretch the graph by a factor of 3, and vertically shift the graph up 1 unit.
−5
y
x5
5
−5
(0, −2)
(1, 1)
(2, 4)
3 91 , 03
⎛ ⎞−⎜ ⎟
⎝ ⎠
Intercepts: (0,–2), ( )3 91 , 0 0.3, 03
⎛ ⎞− ≈⎜ ⎟
⎝ ⎠
Domain: { } is any real numberx x
Range: { } is any real numbery y
66. 3( ) 2( 2) 8g x x= − + −
Using the graph of 3y x= , horizontally shift the graph to the left 2 units, vertically stretch the graph by a factor of 2, reflect about the x-axis, and vertically shift the graph down 8 units.
−9
y
x
−5(−3, −6)
(−2, −8)(−1, −10)
( )32 4, 0− −
Intercepts: (0,–24), ( ) ( )32 4, 0 3.6, 0− − ≈ −
Domain: { }is any real numberx x
Range: { }is any real numbery y
67. 3 if 2 1
( )1 if 1
x xf x
x x− < ≤⎧
= ⎨ + >⎩
a. Domain: { }2x x > − or ( )2,− ∞
b. x-intercept: ( )0,0 y-intercept: (0,0)
c. Graph:
d. Range: { }| 6y y > − or ( )6,− ∞
68. 1 if 3 0
( )3 1 if 0x x
f xx x− − < <⎧
= ⎨ − ≥⎩
a. Domain: { }3x x > − or ( )3,− ∞
b. x-intercept: 1 ,03
⎛ ⎞⎜ ⎟⎝ ⎠
y-intercept: (0, –1)

Chapter 3: Functions and Their Graphs
308 © 2008 Pearson Education, Inc., Upper Saddle River, NJ. All rights reserved. This material is protected under all copyright laws as they currently exist. No portion of this material may be reproduced, in any form or by any means, without permission in writing from the publisher.
c. Graph:
d. Range: { }4y > − or ( )4,− ∞
69. if 4 0
( ) 1 if 03 if 0
x xf x x
x x
− ≤ <⎧⎪= =⎨⎪ >⎩
a. Domain: { }4x x ≥ − or [ )4,− ∞
b. x-intercept: none y-intercept: (0, 1)
c. Graph:
d. Range: { }4, 0y y y≥ − ≠
70. 2 if 2 2( )
2 1 if 2x xf x
x x⎧ − ≤ ≤⎪= ⎨
− >⎪⎩
a. Domain: { }2x x ≥ − or [ )2,− ∞
b. x-intercept: (0, 0) y-intercept: (0, 0)
c. Graph:
d. Range: { }0y y ≥ or [ )0, ∞
71. 5( ) and (1) 46 2Axf x f
x+= =−
(1) 5 46(1) 2
5 44
5 1611
A
A
AA
+=
−+ =
+ ==
72. 28( ) and ( 1) 0Ag x g
x x= + − =
28 0
1 ( 1)8 0
8
A
AA
+ =− −
− + ==
73. 24S r= π ; 343
V rπ=
Let 2R r= , 2 = new surface areaS , and
2 new volumeV = .
( ) ( ) ( )2
22 2 2
4
4 2 4 4 4 4 4
S R
r r r S
π
π π π
=
= = = =
( ) ( )
32
3 3 3
434 4 42 8 8 83 3 3
V R
r r r V
π
π π π
=
⎛ ⎞= = = =⎜ ⎟⎝ ⎠
Thus, if the radius of the sphere doubles, the surface area is 4 times as large and the volume is 8 times as large as for the original sphere.

Chapter 3 Review Exercises
309 © 2008 Pearson Education, Inc., Upper Saddle River, NJ. All rights reserved. This material is protected under all copyright laws as they currently exist. No portion of this material may be reproduced, in any form or by any means, without permission in writing from the publisher.
74. a. The printed region is a rectangle. Its area is given by
( )( ) ( )( )( ) ( )( )
length width 11 2 8.5 2
11 2 8.5 2
A x x
A x x x
= = − −
= − −
b. For the domain of ( ) (11 2 )(8.5 2 )A x x x= − − recall that the dimensions of a rectangle must be non-negative.
0x ≥ and 11 2 02 11
5.5
xxx
− >− > −
<
and 8.5 2 0
2 8.5
4.25
x
x
x
− >
− >
<
The domain is given by 0 4.25x≤ < . The range of ( ) (11 2 )(8.5 2 )A x x x= − − is given by (4.25) (0)A A A< ≤ ⇒ 0 93.5A< ≤ .
c. ( ) ( )( ) ( )( )2
1 11 2 1 8.5 2 1
9 6.5 58.5 in
A = − −
= ⋅ =
( ) ( )( ) ( )( )2
1.2 11 2 1.2 8.5 2 1.2
8.6 6.1 52.46 in
A = − −
= ⋅ =
( ) ( )( )2
1.5 11 2(1.5) 8.5 2(1.5)
8 5.5 44 in
A = − −
= ⋅ =
d. ( )( )1 11 2 8.5 2y x x= − −
e. Using TRACE,
70 when 0.643 inchesA x≈ ≈ 50 when 1.28 inchesA x= ≈
75. a. We are given that the volume is 100 cubic feet, so we have
22
100100V r h hr
ππ
= = ⇒ =
The amount of material needed to construct the drum is the surface area of the barrel. The cylindrical body of the barrel can be viewed as a rectangle whose dimensions are given by
2πr
h
( )
top bottom body
2 2 2
2 22
area area area
2 2 2100 2002 2 2
A
r r rh r rh
A r r r rrr
π π π π π
π π ππ
= + +
= + + = +
⎛ ⎞= + = +⎜ ⎟⎝ ⎠
b. ( ) ( )2
2
2003 2 33
20018 123.22 ft3
A π
π
= +
= + ≈
c. ( ) ( )2
2
2004 2 44
32 50 150.53 ft
A π
π
= +
= + ≈
d. ( ) ( )2
2
2005 2 55
50 40 197.08 ft
A π
π
= +
= + ≈
e. Graphing:
The surface area is smallest when 2.52r ≈
feet.
76. a. Consider the following diagram: P(x,y)
x
y
y = 10 − x 2
The area of the rectangle is A xy= . Thus, the area function for the rectangle is:
2 3( ) (10 ) 10A x x x x x= − = − +
b. The maximum value occurs at the vertex:
The maximum area is roughly:
3(1.83) (1.83) 10(1.83)12.17 square units
A = − +≈

Chapter 3: Functions and Their Graphs
310 © 2008 Pearson Education, Inc., Upper Saddle River, NJ. All rights reserved. This material is protected under all copyright laws as they currently exist. No portion of this material may be reproduced, in any form or by any means, without permission in writing from the publisher.
Chapter 3 Test
1. a. ( ) ( ) ( ) ( ){ }2,5 , 4,6 , 6,7 , 8,8 This relation is a function because there are no ordered pairs that have the same first element and different second elements. Domain: { }2, 4,6,8
Range: { }5,6,7,8
b. ( ) ( ) ( ) ( ){ }1,3 , 4, 2 , 3,5 , 1,7− − This relation is not a function because there are two ordered pairs that have the same first element but different second elements.
c. This relation is not a function because the graph fails the vertical line test.
d. This relation is a function because it passes the vertical line test. Domain: { } is any real numberx x
Range: { }| 2y y ≥ or [ )2, ∞
2. ( ) 4 5f x x= − The function tells us to take the square root of 4 5x− . Only nonnegative numbers have real square roots so we need 4 5 0x− ≥ .
4 5 04 5 4 0 4
5 45 45 5
45
xx
xx
x
− ≥− − ≥ −
− ≥ −− −≤− −
≤
Domain: 45
x x⎧ ⎫≤⎨ ⎬⎩ ⎭
or 4,5
⎛ ⎤−∞⎜ ⎥⎝ ⎦
( ) ( )1 4 5 1 4 5 9 3f − = − − = + = =
3. ( ) 22
xg xx
+=+
The function tells us to divide 2x + by 2x + . Division by 0 is undefined, so the denominator can never equal 0. This means that 2x ≠ − . Domain: { }| 2x x ≠ −
( ) ( )( )
1 2 11 111 2
g− +
− = = =− +
4. ( ) 24
5 36xh x
x x−=
+ −
The function tells us to divide 4x − by 2 5 36x x+ − . Since division by 0 is not defined,
we need to exclude any values which make the denominator 0.
( )( )
2 5 36 09 4 0
x xx x
+ − =
+ − =
9 or 4x x= − = Domain: { }| 9, 4x x x≠ − ≠ (note: there is a common factor of 4x − but we must determine the domain prior to simplifying)
( ) ( )( ) ( )2
1 4 5 1140 81 5 1 36
h− − −− = = =
−− + − −
5. a. To find the domain, note that all the points on the graph will have an x-coordinate between 5− and 5, inclusive. To find the range, note that all the points on the graph will have a y-coordinate between 3− and 3, inclusive. Domain: { }| 5 5x x− ≤ ≤ or [ ]5, 5−
Range: { }| 3 3y y− ≤ ≤ or [ ]3, 3−
b. The intercepts are ( )0, 2 , ( )2,0− , and ( )2,0 . x-intercepts: 2, 2− y-intercept: 2
c. ( )1f is the value of the function when
1x = . According to the graph, ( )1 3f = .
d. Since ( )5, 3− − and ( )3, 3− are the only points on the graph for which
( ) 3y f x= = − , we have ( ) 3f x = − when 5x = − and 3x = .
e. To solve ( ) 0f x < , we want to find x-values such that the graph is below the x-axis. The graph is below the x-axis for values in the domain that are less than 2− and greater than 2. Therefore, the solution set is { }| 5 2 or 2 5x x x− ≤ < − < ≤ . In interval notation we would write the solution set as [ ) ( ]5, 2 2,5− − ∪ .
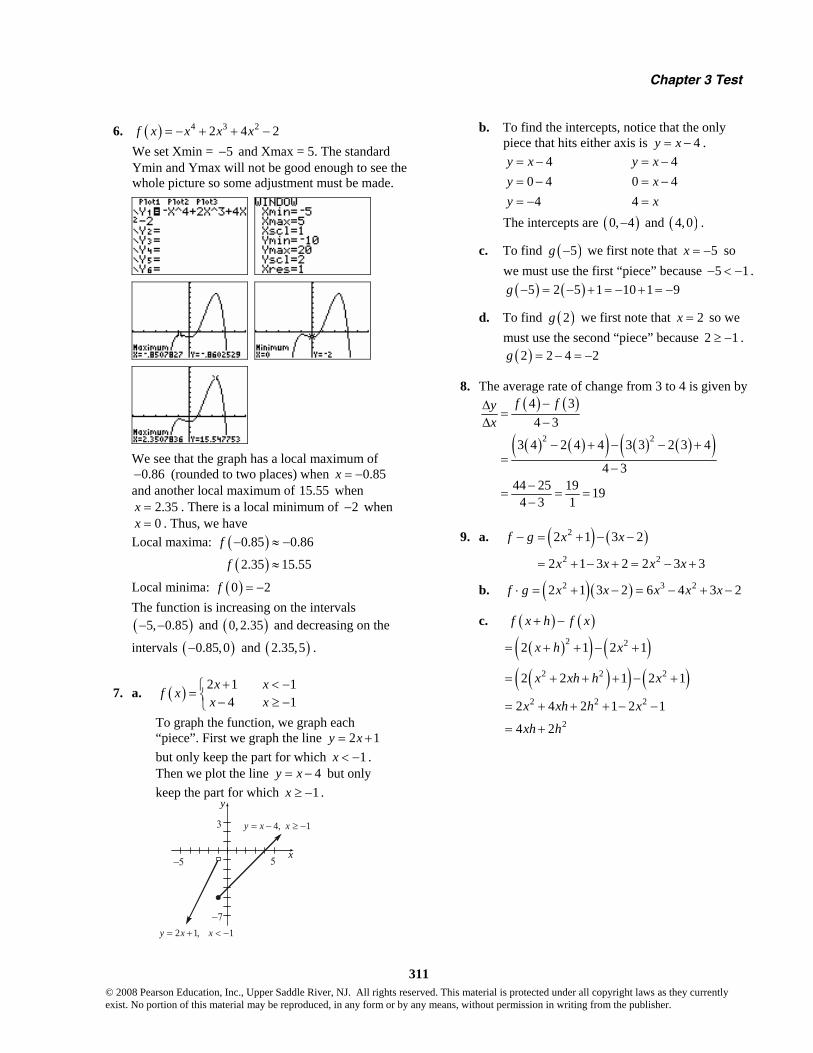
Chapter 3 Test
311 © 2008 Pearson Education, Inc., Upper Saddle River, NJ. All rights reserved. This material is protected under all copyright laws as they currently exist. No portion of this material may be reproduced, in any form or by any means, without permission in writing from the publisher.
6. ( ) 4 3 22 4 2f x x x x= − + + − We set Xmin = 5− and Xmax = 5. The standard Ymin and Ymax will not be good enough to see the whole picture so some adjustment must be made.
We see that the graph has a local maximum of
0.86− (rounded to two places) when 0.85x = − and another local maximum of 15.55 when
2.35x = . There is a local minimum of 2− when 0x = . Thus, we have
Local maxima: ( )( )0.85 0.86
2.35 15.55
f
f
− ≈ −
≈
Local minima: ( )0 2f = − The function is increasing on the intervals ( )5, 0.85− − and ( )0, 2.35 and decreasing on the
intervals ( )0.85,0− and ( )2.35,5 .
7. a. ( ) 2 1 14 1
x xf x
x x+ < −⎧= ⎨ − ≥ −⎩
To graph the function, we graph each “piece”. First we graph the line 2 1y x= + but only keep the part for which 1x < − . Then we plot the line 4y x= − but only keep the part for which 1x ≥ − .
−7
−5
y
x
3
5
4, 1y x x= − ≥ −
2 1, 1y x x= + < −
b. To find the intercepts, notice that the only piece that hits either axis is 4y x= − .
40 4
4
y xyy
= −= −= −
40 44
y xxx
= −= −=
The intercepts are ( )0, 4− and ( )4,0 .
c. To find ( )5g − we first note that 5x = − so we must use the first “piece” because 5 1− < − .
( ) ( )5 2 5 1 10 1 9g − = − + = − + = −
d. To find ( )2g we first note that 2x = so we must use the second “piece” because 2 1≥ − .
( )2 2 4 2g = − = −
8. The average rate of change from 3 to 4 is given by ( ) ( )
( ) ( )( ) ( ) ( )( )2 2
4 34 3
3 4 2 4 4 3 3 2 3 4
4 344 25 19 19
4 3 1
f fyx
−Δ=
Δ −
− + − − +=
−−= = =−
9. a. ( ) ( )2
2 2
2 1 3 2
2 1 3 2 2 3 3
f g x x
x x x x
− = + − −
= + − + = − +
b. ( )( )2 3 22 1 3 2 6 4 3 2f g x x x x x⋅ = + − = − + −
c. ( ) ( )
( )( ) ( )( )( ) ( )
2 2
2 2 2
2 2 2
2
2 1 2 1
2 2 1 2 1
2 4 2 1 2 1
4 2
f x h f x
x h x
x xh h x
x xh h x
xh h
+ −
= + + − +
= + + + − +
= + + + − −
= +
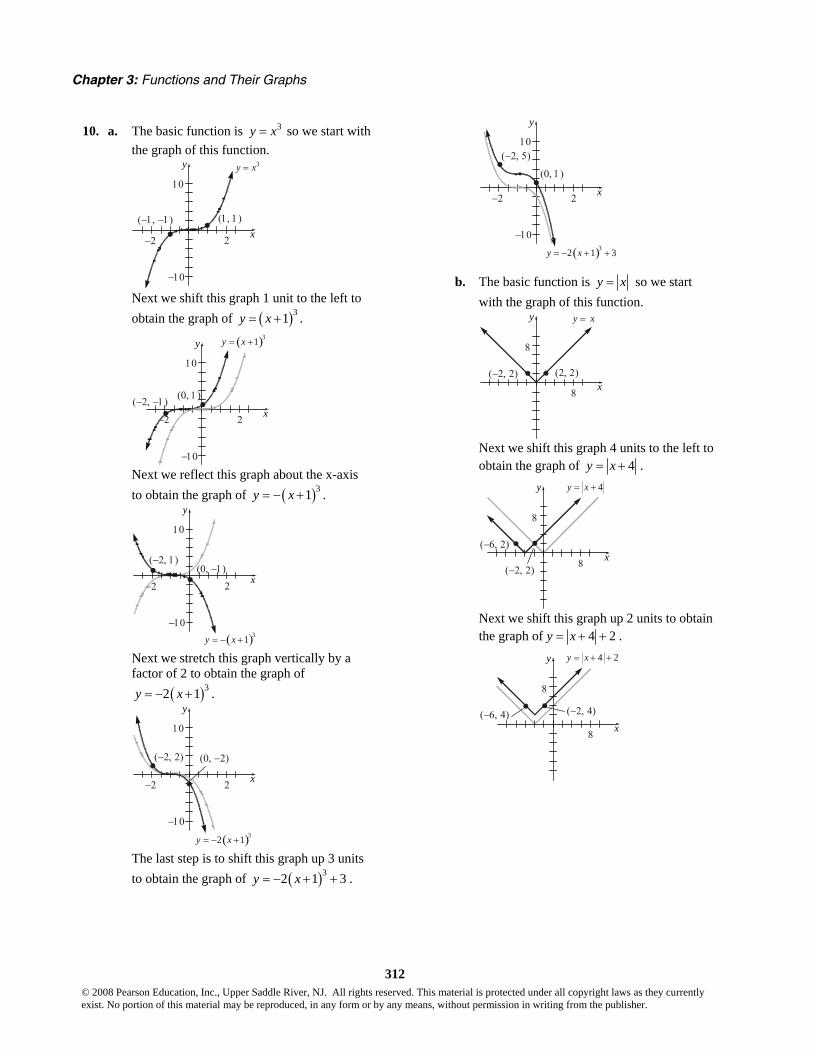
Chapter 3: Functions and Their Graphs
312 © 2008 Pearson Education, Inc., Upper Saddle River, NJ. All rights reserved. This material is protected under all copyright laws as they currently exist. No portion of this material may be reproduced, in any form or by any means, without permission in writing from the publisher.
10. a. The basic function is 3y x= so we start with the graph of this function.
10
−10
y
x2−2
(−1, −1) (1, 1)
3y x=
Next we shift this graph 1 unit to the left to obtain the graph of ( )31y x= + .
10
−10
y
x2−2
( )31y x= +
(−2, −1)(0, 1)
Next we reflect this graph about the x-axis to obtain the graph of ( )31y x= − + .
10
−10
y
x2−2
(−2, 1)(0, −1)
( )31y x= − + Next we stretch this graph vertically by a factor of 2 to obtain the graph of
( )32 1y x= − + .
10
−10
y
x2−2
(−2, 2) (0, −2)
( )32 1y x= − + The last step is to shift this graph up 3 units to obtain the graph of ( )32 1 3y x= − + + .
10
−10
y
x2−2
(−2, 5)
(0, 1)
( )32 1 3y x= − + +
b. The basic function is y x= so we start with the graph of this function.
y
x
8
8
y x=
(−2, 2) (2, 2)
Next we shift this graph 4 units to the left to obtain the graph of 4y x= + .
y
x
8
8
(−6, 2)
(−2, 2)
4y x= +
Next we shift this graph up 2 units to obtain the graph of 4 2y x= + + .
y
x
8
8
(−6, 4) (−2, 4)
4 2y x= + +
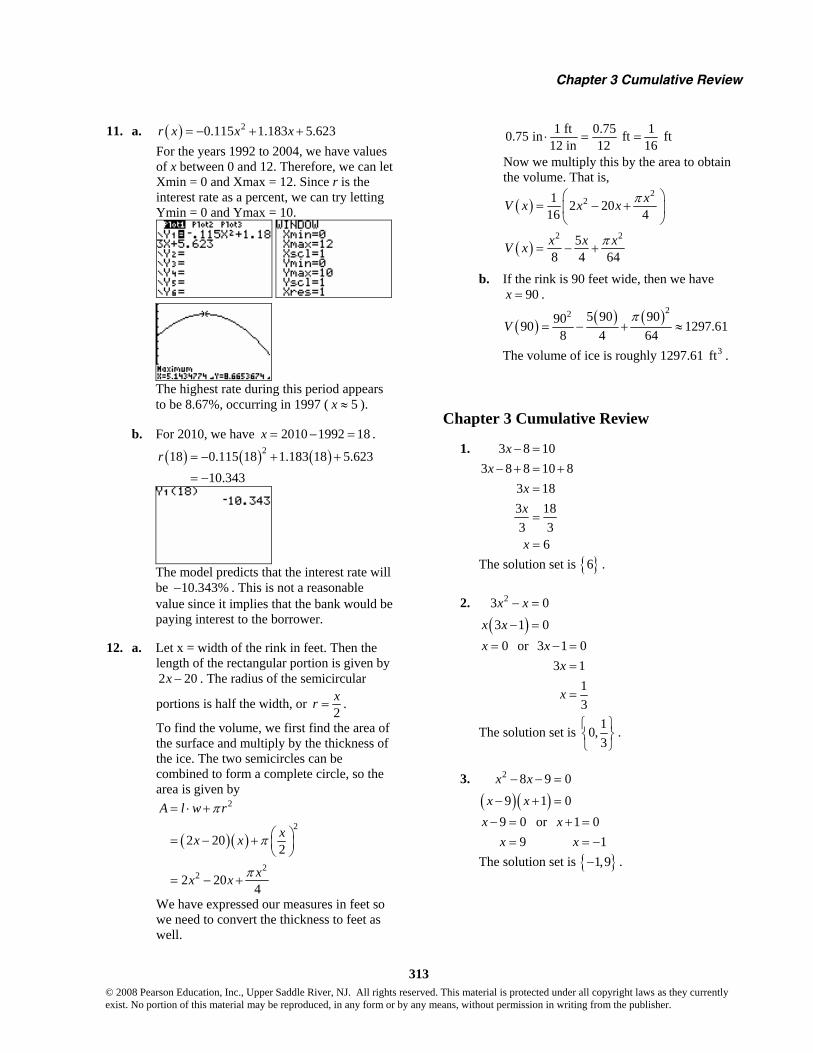
Chapter 3 Cumulative Review
313 © 2008 Pearson Education, Inc., Upper Saddle River, NJ. All rights reserved. This material is protected under all copyright laws as they currently exist. No portion of this material may be reproduced, in any form or by any means, without permission in writing from the publisher.
11. a. ( ) 20.115 1.183 5.623r x x x= − + + For the years 1992 to 2004, we have values of x between 0 and 12. Therefore, we can let Xmin = 0 and Xmax = 12. Since r is the interest rate as a percent, we can try letting Ymin = 0 and Ymax = 10.
The highest rate during this period appears to be 8.67%, occurring in 1997 ( 5x ≈ ).
b. For 2010, we have 2010 1992 18x = − = .
( ) ( ) ( )218 0.115 18 1.183 18 5.62310.343
r = − + +
= −
The model predicts that the interest rate will be 10.343%− . This is not a reasonable value since it implies that the bank would be paying interest to the borrower.
12. a. Let x = width of the rink in feet. Then the length of the rectangular portion is given by 2 20x − . The radius of the semicircular
portions is half the width, or 2xr = .
To find the volume, we first find the area of the surface and multiply by the thickness of the ice. The two semicircles can be combined to form a complete circle, so the area is given by
( ) ( )
2
2
22
2 202
2 204
A l w r
xx x
xx x
π
π
π
= ⋅ +
⎛ ⎞= − + ⎜ ⎟⎝ ⎠
= − +
We have expressed our measures in feet so we need to convert the thickness to feet as well.
1 ft 0.75 10.75 in ft ft12 in 12 16
⋅ = =
Now we multiply this by the area to obtain the volume. That is,
( )
( )
22
2 2
1 2 2016 4
58 4 64
xV x x x
x x xV x
π
π
⎛ ⎞= − +⎜ ⎟
⎝ ⎠
= − +
b. If the rink is 90 feet wide, then we have 90x = .
( ) ( ) ( )22 5 90 909090 1297.618 4 64
Vπ
= − + ≈
The volume of ice is roughly 1297.61 3ft .
Chapter 3 Cumulative Review
1. 3 8 103 8 8 10 8
3 183 183 3
6
xx
xx
x
− =− + = +
=
=
=
The solution set is { }6 .
2.
( )23 0
3 1 0
x x
x x
− =
− =
0x = or 3 1 03 1
13
xx
x
− ==
=
The solution set is 10,3
⎧ ⎫⎨ ⎬⎩ ⎭
.
3.
( )( )2 8 9 0
9 1 0
x x
x x
− − =
− + =
9 09
xx
− ==
or 1 01
xx
+ == −
The solution set is { }1,9− .
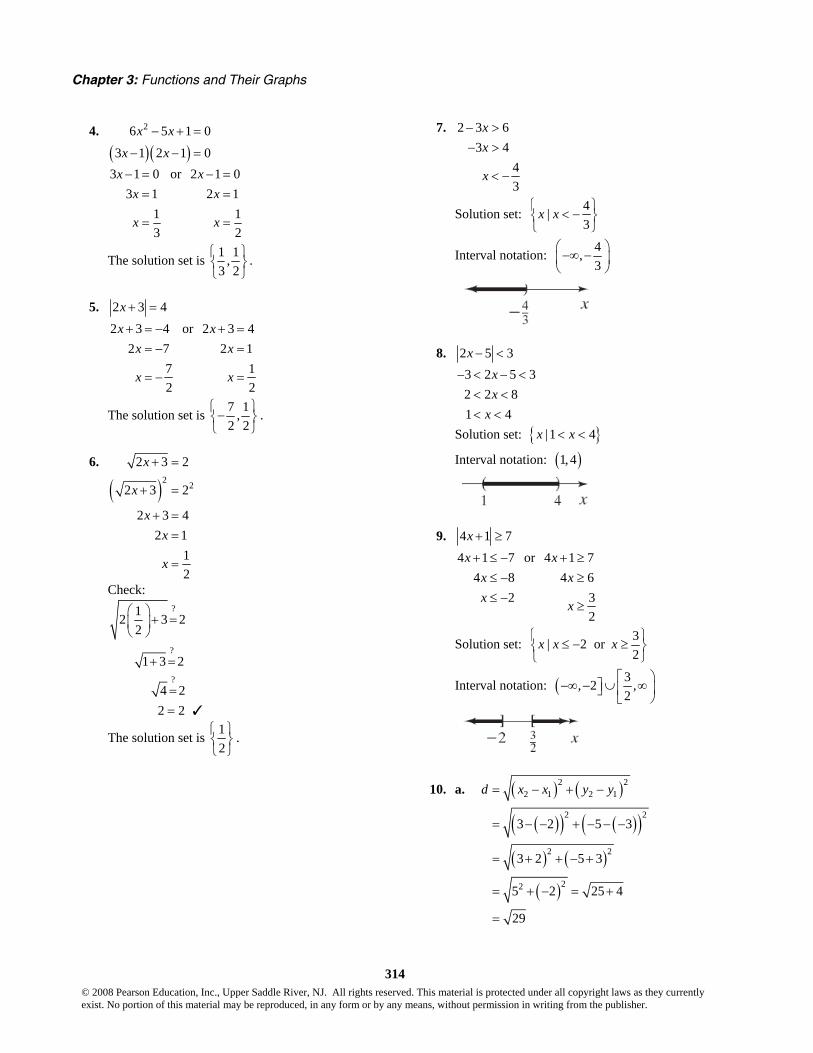
Chapter 3: Functions and Their Graphs
314 © 2008 Pearson Education, Inc., Upper Saddle River, NJ. All rights reserved. This material is protected under all copyright laws as they currently exist. No portion of this material may be reproduced, in any form or by any means, without permission in writing from the publisher.
4.
( ) ( )26 5 1 0
3 1 2 1 0
x x
x x
− + =
− − =
3 1 03 1
13
xx
x
− ==
=
or 2 1 02 1
12
xx
x
− ==
=
The solution set is 1 1,3 2
⎧ ⎫⎨ ⎬⎩ ⎭
.
5. 2 3 4x + = 2 3 4
2 772
xx
x
+ = −= −
= −
or 2 3 42 1
12
xx
x
+ ==
=
The solution set is 7 1,2 2
⎧ ⎫−⎨ ⎬
⎩ ⎭.
6.
( )2 2
2 3 2
2 3 2
2 3 42 1
12
x
x
xx
x
+ =
+ =
+ ==
=
Check: ?
?
?
12 3 22
1 3 2
4 2 2 2
⎛ ⎞+ =⎜ ⎟
⎝ ⎠
+ =
== T
The solution set is 12
⎧ ⎫⎨ ⎬⎩ ⎭
.
7. 2 3 63 4
43
xx
x
− >− >
< −
Solution set: 4|3
x x⎧ ⎫< −⎨ ⎬
⎩ ⎭
Interval notation: 4,3
⎛ ⎞−∞ −⎜ ⎟
⎝ ⎠
8. 2 5 3x − < 3 2 5 32 2 81 4
xx
x
− < − << << <
Solution set: { }|1 4x x< <
Interval notation: ( )1,4
9. 4 1 7x + ≥ 4 1 7
4 82
xxx
+ ≤ −≤ −≤ −
or 4 1 74 6
32
xx
x
+ ≥≥
≥
Solution set: 3| 2 or 2
x x x⎧ ⎫≤ − ≥⎨ ⎬
⎩ ⎭
Interval notation: ( 3, 2 ,2
⎡ ⎞−∞ − ∪ ∞⎤ ⎟⎢⎦
⎣ ⎠
10. a. ( ) ( )
( )( ) ( )( )( ) ( )
( )
2 22 1 2 1
2 2
2 2
22
3 2 5 3
3 2 5 3
5 2 25 4
29
d x x y y= − + −
= − − + − − −
= + + − +
= + − = +
=
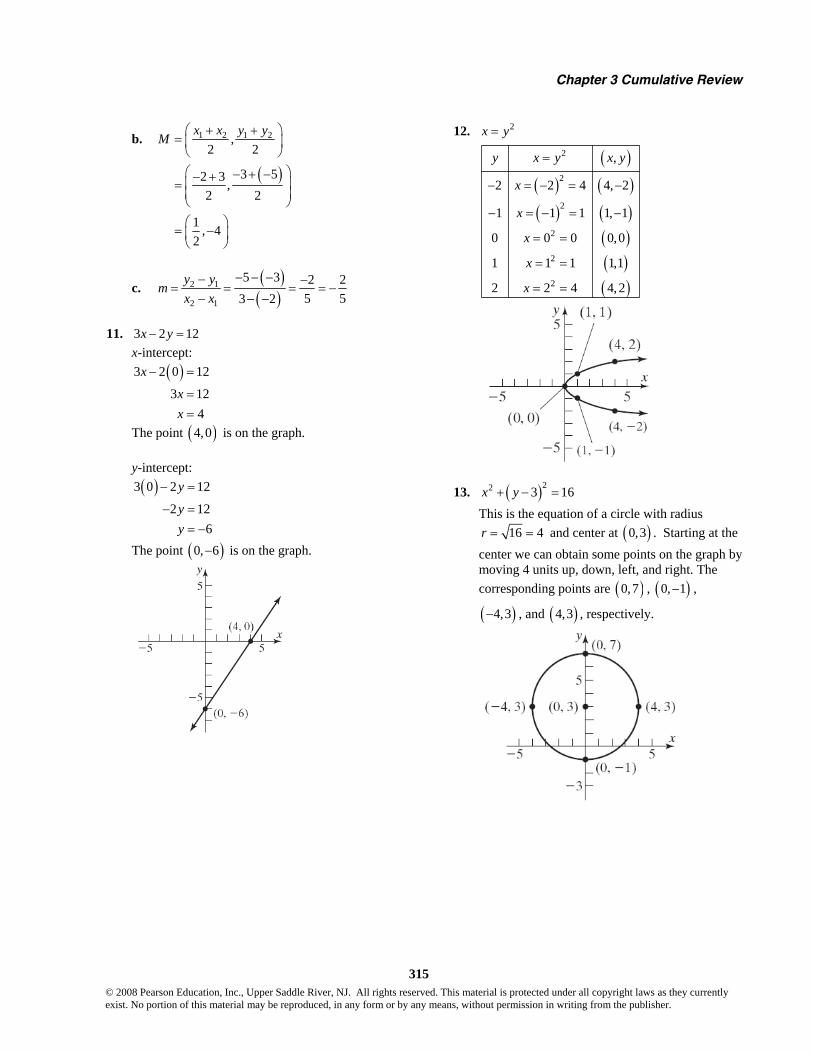
Chapter 3 Cumulative Review
315 © 2008 Pearson Education, Inc., Upper Saddle River, NJ. All rights reserved. This material is protected under all copyright laws as they currently exist. No portion of this material may be reproduced, in any form or by any means, without permission in writing from the publisher.
b.
( )
1 2 1 2,2 2
3 52 3 ,2 2
1 , 42
x x y yM
+ +⎛ ⎞= ⎜ ⎟
⎝ ⎠⎛ ⎞− + −− +⎜ ⎟=⎜ ⎟⎝ ⎠⎛ ⎞
= −⎜ ⎟⎝ ⎠
c. ( )
( )2 1
2 1
5 3 2 25 53 2
y ym
x x− − −− −
= = = = −− − −
11. 3 2 12x y− = x-intercept:
( )3 2 0 12
3 124
x
xx
− =
==
The point ( )4,0 is on the graph.
y-intercept: ( )3 0 2 12
2 126
y
yy
− =
− == −
The point ( )0, 6− is on the graph.
12. 2x y=
( )( ) ( )( ) ( )
( )( )( )
2
2
2
2
2
2
,
2 2 4 4, 2
1 1 1 1, 1
0 0 0 0,0
1 1 1 1,1
2 2 4 4, 2
y x y x y
x
x
x
x
x
=
− = − = −
− = − = −
= =
= =
= =
13. ( )22 3 16x y+ − = This is the equation of a circle with radius
16 4r = = and center at ( )0,3 . Starting at the center we can obtain some points on the graph by moving 4 units up, down, left, and right. The corresponding points are ( )0,7 , ( )0, 1− ,
( )4,3− , and ( )4,3 , respectively.
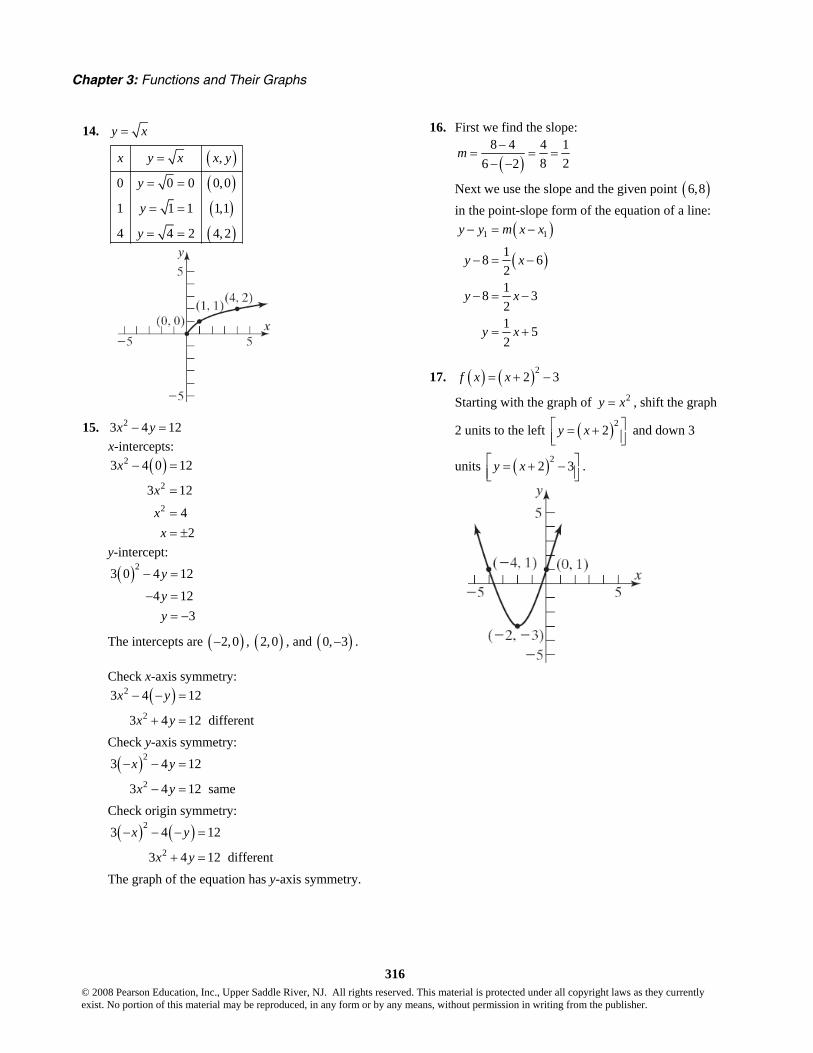
Chapter 3: Functions and Their Graphs
316 © 2008 Pearson Education, Inc., Upper Saddle River, NJ. All rights reserved. This material is protected under all copyright laws as they currently exist. No portion of this material may be reproduced, in any form or by any means, without permission in writing from the publisher.
14. y x=
( )( )( )( )
,
0 0 0 0,0
1 1 1 1,1
4 4 2 4, 2
x y x x y
y
y
y
=
= =
= =
= =
15. 23 4 12x y− = x-intercepts:
( )2
2
2
3 4 0 12
3 12
42
x
x
xx
− =
=
== ±
y-intercept:
( )23 0 4 12
4 123
y
yy
− =
− == −
The intercepts are ( )2,0− , ( )2,0 , and ( )0, 3− .
Check x-axis symmetry: ( )2
2
3 4 12
3 4 12 different
x y
x y
− − =
+ =
Check y-axis symmetry:
( )2
2
3 4 12
3 4 12 same
x y
x y
− − =
− =
Check origin symmetry:
( ) ( )2
2
3 4 12
3 4 12 different
x y
x y
− − − =
+ =
The graph of the equation has y-axis symmetry.
16. First we find the slope:
( )8 4 4 1
8 26 2m −
= = =− −
Next we use the slope and the given point ( )6,8 in the point-slope form of the equation of a line:
( )
( )1 1
18 6218 321 52
y y m x x
y x
y x
y x
− = −
− = −
− = −
= +
17. ( ) ( )22 3f x x= + −
Starting with the graph of 2y x= , shift the graph
2 units to the left ( )22y x⎡ ⎤= +⎢ ⎥⎣ ⎦ and down 3
units ( )22 3y x⎡ ⎤= + −⎢ ⎥⎣ ⎦.
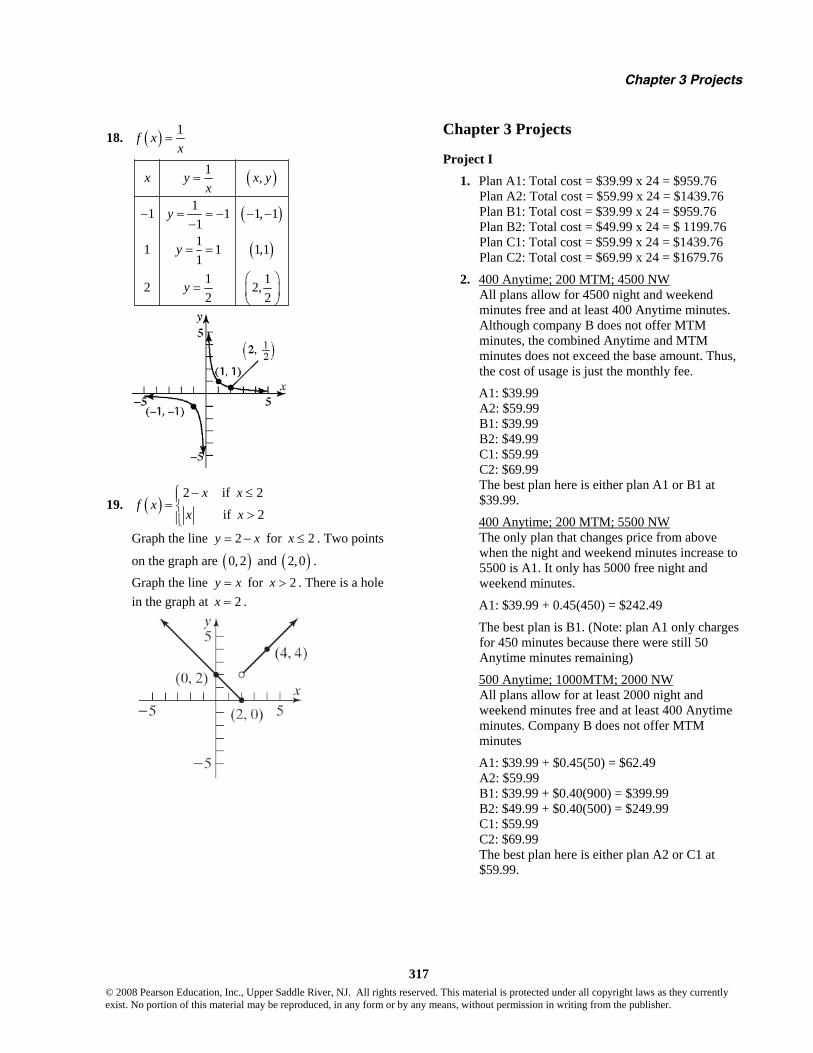
Chapter 3 Projects
317 © 2008 Pearson Education, Inc., Upper Saddle River, NJ. All rights reserved. This material is protected under all copyright laws as they currently exist. No portion of this material may be reproduced, in any form or by any means, without permission in writing from the publisher.
18. ( ) 1f xx
=
( )
( )
( )
1 ,
11 1 1, 1111 1 1,11
1 12 2,2 2
x y x yx
y
y
y
=
− = = − − −−
= =
⎛ ⎞= ⎜ ⎟
⎝ ⎠
19. ( )2 if 2
if 2
x xf x
x x
− ≤⎧⎪= ⎨ >⎪⎩
Graph the line 2y x= − for 2x ≤ . Two points
on the graph are ( )0, 2 and ( )2,0 . Graph the line y x= for 2x > . There is a hole in the graph at 2x = .
Chapter 3 Projects
Project I 1. Plan A1: Total cost = $39.99 x 24 = $959.76
Plan A2: Total cost = $59.99 x 24 = $1439.76 Plan B1: Total cost = $39.99 x 24 = $959.76 Plan B2: Total cost = $49.99 x 24 = $ 1199.76 Plan C1: Total cost = $59.99 x 24 = $1439.76 Plan C2: Total cost = $69.99 x 24 = $1679.76
2. 400 Anytime; 200 MTM; 4500 NW All plans allow for 4500 night and weekend minutes free and at least 400 Anytime minutes. Although company B does not offer MTM minutes, the combined Anytime and MTM minutes does not exceed the base amount. Thus, the cost of usage is just the monthly fee.
A1: $39.99 A2: $59.99 B1: $39.99 B2: $49.99 C1: $59.99 C2: $69.99 The best plan here is either plan A1 or B1 at $39.99.
400 Anytime; 200 MTM; 5500 NW The only plan that changes price from above when the night and weekend minutes increase to 5500 is A1. It only has 5000 free night and weekend minutes.
A1: $39.99 + 0.45(450) = $242.49
The best plan is B1. (Note: plan A1 only charges for 450 minutes because there were still 50 Anytime minutes remaining)
500 Anytime; 1000MTM; 2000 NW All plans allow for at least 2000 night and weekend minutes free and at least 400 Anytime minutes. Company B does not offer MTM minutes
A1: $39.99 + $0.45(50) = $62.49 A2: $59.99 B1: $39.99 + $0.40(900) = $399.99 B2: $49.99 + $0.40(500) = $249.99 C1: $59.99 C2: $69.99 The best plan here is either plan A2 or C1 at $59.99.

Chapter 3: Functions and Their Graphs
318 © 2008 Pearson Education, Inc., Upper Saddle River, NJ. All rights reserved. This material is protected under all copyright laws as they currently exist. No portion of this material may be reproduced, in any form or by any means, without permission in writing from the publisher.
3. For 850 minutes, A1: $39.99 + 0.45(400) = $219.99 A2: $59.99 B1: $39.99 + 0.40(250) = $139.99 B2: $49.99 C1: $59.99 + 5(300/50) = $89.99 C2: $69.99 + 5(50/50) = $74.99 The best priced plan is B2 at $49.99.
For 1050 minutes: A1: $39.99 + 0.45(600) = $309.99 A2: $59.99 + 0.40(150) = $119.99 B1: $39.99 + 0.40(450) = $219.99 B2: $49.99 + 0.40(50) = $69.99 C1: $59.99 + 5(500/50) = $109.99 C2: $69.99 + 5(250/50) = $94.99 The best priced plan is B2 at $69.99.
4. ( )( )Monthly Base charge per # of min. overcost Price minute those included= +
A1: 39.99 0 450
( )0.45 162.51 450
xC x
x x≤ ≤⎧
= ⎨ − >⎩
A2: 59.99 0 900
( )0.40 300.01 900
xC x
x x≤ ≤⎧
= ⎨ − >⎩
B1: 39.99 0 600
( )0.40 200.01 600
xC x
x x≤ ≤⎧
= ⎨ − >⎩
B2: 49.99 0 1000
( )0.40 350.01 1000
xC x
x x≤ ≤⎧
= ⎨ − >⎩
C1:
( )59.99 0 550
( ) 59.99 5{int 550 / 50 +1} 550 1050
0.10 4.99 1050
x
C x x x
x x
≤ ≤⎧⎪
= + − < <⎡ ⎤⎨ ⎣ ⎦⎪ + ≥⎩
C2:
( )69.99 0 800
( ) 69.99 5{int 800 / 50 +1} 800 1300
0.10 10.01 1300
x
C x x x
x x
≤ ≤⎧⎪
= + − < <⎡ ⎤⎨ ⎣ ⎦⎪ − ≥⎩
5. Graph for plan A1:
0
C x( )
Minutes Used
Cos
t (do
llars
)
1600
400
Graph for plan A2:
0
C x( )
Minutes UsedC
ost (
dolla
rs)
1600
400
Graph for plan B1:
0
C x( )
Minutes Used
Cos
t (do
llars
)
1600
400
Graph for plan B2:
0
C x( )
Minutes Used
Cos
t (do
llars
)
1600
400
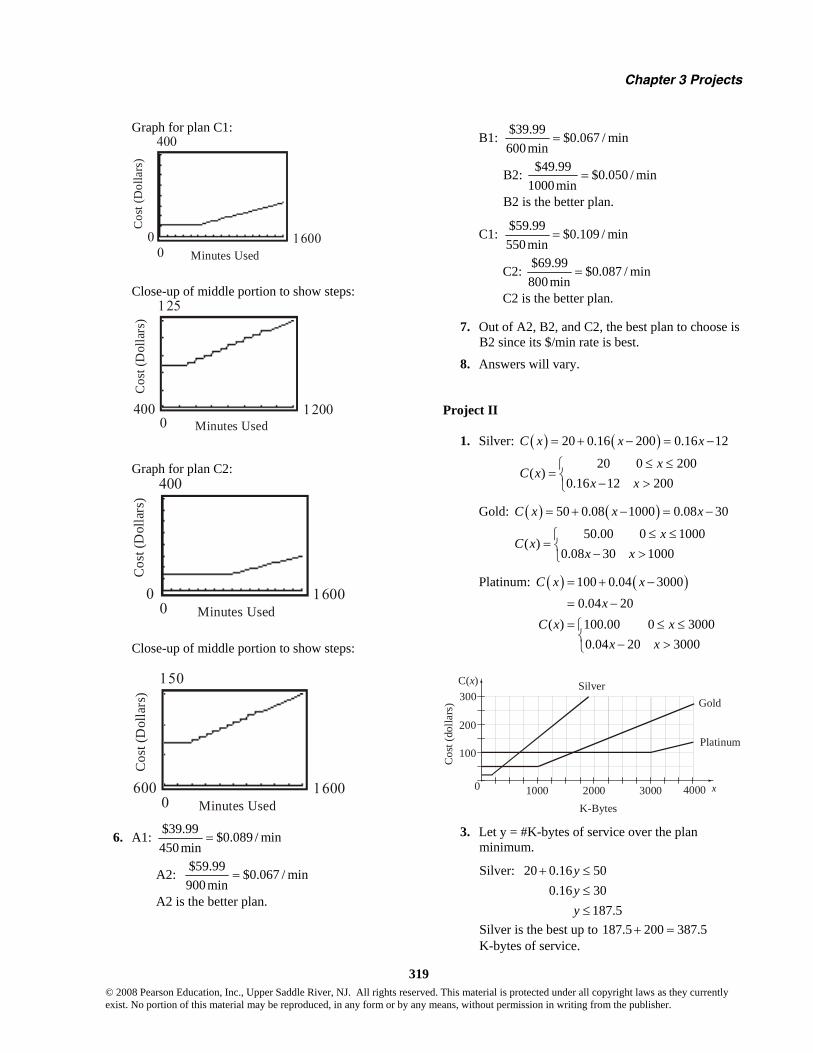
Chapter 3 Projects
319 © 2008 Pearson Education, Inc., Upper Saddle River, NJ. All rights reserved. This material is protected under all copyright laws as they currently exist. No portion of this material may be reproduced, in any form or by any means, without permission in writing from the publisher.
Graph for plan C1:
16000
400
0Minutes Used
Cos
t (D
olla
rs)
Close-up of middle portion to show steps:
12000
125
400Minutes Used
Cos
t (D
olla
rs)
Graph for plan C2:
16000
400
0Minutes Used
Cos
t (D
olla
rs)
Close-up of middle portion to show steps:
16000
150
600Minutes Used
Cos
t (D
olla
rs)
6. A1: $39.99 $0.089 / min450 min
=
A2: $59.99 $0.067 / min900min
=
A2 is the better plan.
B1: $39.99 $0.067 / min600min
=
B2: $49.99 $0.050 / min1000min
=
B2 is the better plan.
C1: $59.99 $0.109 / min550min
=
C2: $69.99 $0.087 / min800min
=
C2 is the better plan.
7. Out of A2, B2, and C2, the best plan to choose is B2 since its $/min rate is best.
8. Answers will vary. Project II
1. Silver: ( ) ( )20 0.16 200 0.16 12
20 0 200( )
0.16 12 200
C x x x
xC x
x x
= + − = −
≤ ≤⎧= ⎨ − >⎩
Gold: ( ) ( )50 0.08 1000 0.08 30
50.00 0 1000( )
0.08 30 1000
C x x x
xC x
x x
= + − = −
≤ ≤⎧= ⎨ − >⎩
Platinum: ( ) ( )100 0.04 30000.04 20
( ) 100.00 0 30000.04 20 3000
C x xx
C x xx x
= + −
= −
= ≤ ≤⎧⎨ − >⎩
x
Cos
t (do
llars
)
K-Bytes
0
C( )x300
100
200
1000 2000 3000 4000
SilverGold
Platinum
3. Let y = #K-bytes of service over the plan
minimum.
Silver: 20 0.16 500.16 30
187.5
yyy
+ ≤≤≤
Silver is the best up to 187.5 200 387.5+ = K-bytes of service.
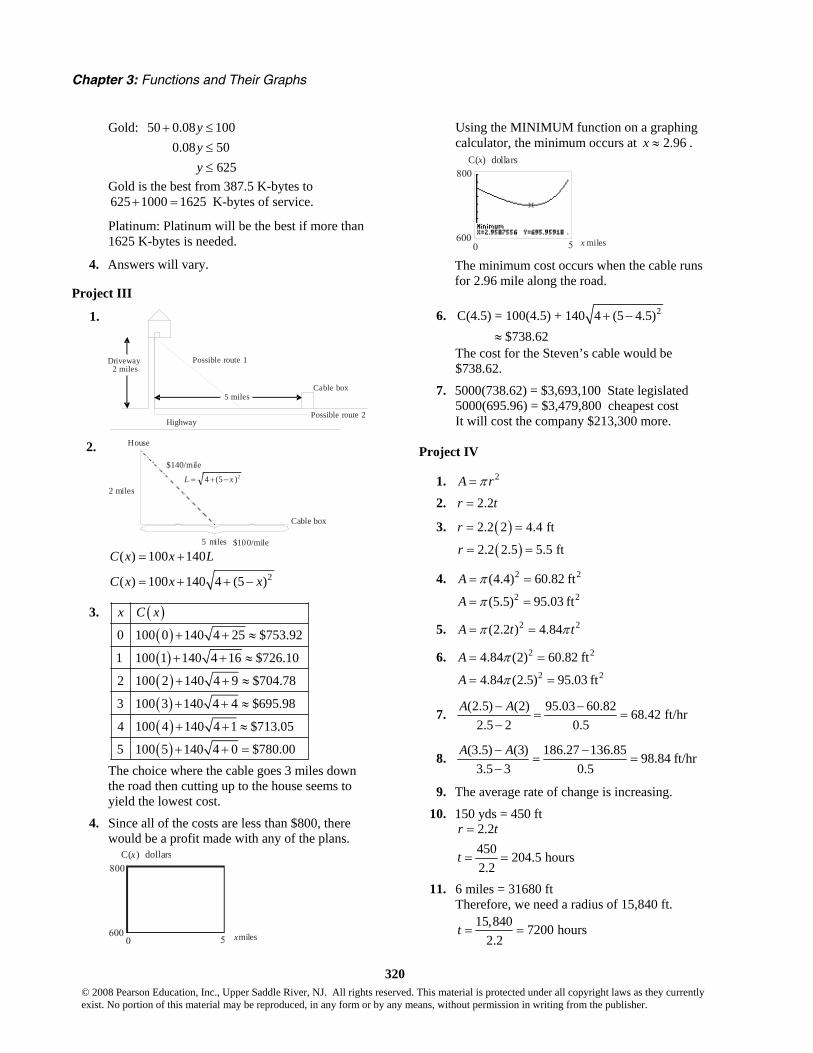
Chapter 3: Functions and Their Graphs
320 © 2008 Pearson Education, Inc., Upper Saddle River, NJ. All rights reserved. This material is protected under all copyright laws as they currently exist. No portion of this material may be reproduced, in any form or by any means, without permission in writing from the publisher.
Gold: 50 0.08 1000.08 50
625
yyy
+ ≤≤≤
Gold is the best from 387.5 K-bytes to 625 1000 1625+ = K-bytes of service.
Platinum: Platinum will be the best if more than 1625 K-bytes is needed.
4. Answers will vary.
Project III
1.
Driveway2 miles
Possible route 1
5 milesCable box
Possible route 2Highway
2.
2 miles
5 miles
Cable box
$100/mile
$140/mile24 (5 )L x= + −
House
( ) 100 140C x x L= +
2( ) 100 140 4 (5 )C x x x= + + −
3. ( )( )( )( )( )( )( )
0 100 0 140 4 25 $753.92
1 100 1 140 4 16 $726.10
2 100 2 140 4 9 $704.78
3 100 3 140 4 4 $695.98
4 100 4 140 4 1 $713.05
5 100 5 140 4 0 $780.00
x C x
+ + ≈
+ + ≈
+ + ≈
+ + ≈
+ + ≈
+ + =
The choice where the cable goes 3 miles down the road then cutting up to the house seems to yield the lowest cost.
4. Since all of the costs are less than $800, there would be a profit made with any of the plans.
50600
800
x miles
C( ) dollarsx
Using the MINIMUM function on a graphing calculator, the minimum occurs at 2.96x ≈ .
50600
800
x miles
C( ) dollarsx
The minimum cost occurs when the cable runs
for 2.96 mile along the road.
6. 2C(4.5) = 100(4.5) + 140 4 (5 4.5)$738.62
+ −
≈
The cost for the Steven’s cable would be $738.62.
7. 5000(738.62) = $3,693,100 State legislated 5000(695.96) = $3,479,800 cheapest cost It will cost the company $213,300 more.
Project IV
1. 2A rπ= 2. 2.2r t=
3. ( )2.2 2 4.4 ftr = =
( )2.2 2.5 5.5 ftr = =
4. 2 2
2 2
(4.4) 60.82 ft
(5.5) 95.03 ft
A
A
π
π
= =
= =
5. 2 2(2.2 ) 4.84A t tπ π= =
6. 2 2
2 2
4.84 (2) 60.82 ft
4.84 (2.5) 95.03 ft
A
A
π
π
= =
= =
7. (2.5) (2) 95.03 60.82 68.42 ft/hr2.5 2 0.5
A A− −= =
−
8. (3.5) (3) 186.27 136.85 98.84 ft/hr3.5 3 0.5
A A− −= =
−
9. The average rate of change is increasing.
10. 150 yds = 450 ft 2.2450 204.5 hours2.2
r t
t
=
= =
11. 6 miles = 31680 ft Therefore, we need a radius of 15,840 ft.
15,840 7200 hours2.2
t = =