chapter 3 hplc method development and validation of ... · chapter 3 hplc method development and...
TRANSCRIPT

Chapter 3
HPLC Method development and validation of protein based drugs
67
CHAPTER 3
HPLC METHOD DEVELOPMENT
AND VALIDATION
OF PROTEIN BASED DRUGS
Chapter 3
HPLC Method development and validation of protein based drugs
68
3.1 INTRODUCTION
The advent of recombinant DNA technology has led to a worldwide zeal to develop
protein pharmaceuticals in the past three decades. These protein pharmaceuticals
include functional regulators and supplements, enzyme activators and inhibitors, poly-
and monoclonal antibodies, and various vaccines. In comparison with small chemical
drugs, protein pharmaceuticals have high specificity and activity at relatively low
concentrations. These features have made protein pharmaceuticals indispensable in
combating human diseases.
Due to advances in analytical separation technology, recombinant proteins can now be
purified to an unprecedented level (Bond et al., 1998). Highly purified protein
pharmaceuticals significantly reduce the known and unknown potential side or even
toxic effects. [1]
However, one of the most challenging tasks remaining in the development of protein
pharmaceuticals is dealing with physical and chemical instabilities of proteins. Protein
instability is one of the two major reasons why protein pharmaceuticals are
administered traditionally through injection rather than taken orally like most small
chemical drugs (Wang, 1996). Protein pharmaceuticals usually have to be stored
under cold conditions or even freeze-dried to a solid form to achieve an acceptable
shelf life. [2]
Pharmaceutical excipients may be added to a formulation to stabilize the protein, to
aid in manufacture of the dosage form, for control or target delivery in the body, or
provide tonicity to minimize pain upon injection. Examples include buffers,
carbohydrates as bulking agents for lyophilization, polymers as viscosity agents for
topical applications, and salts or sugars for adjusting solution osmolality into a
Chapter 3
HPLC Method development and validation of protein based drugs
69
physiological range. Although it is often assumed that pharmaceutical excipients are
essentially inert, some additives may have certain toxicological or biological
activities, and therefore, may play a role in defining the overall safety profile of a
drug. Although excipients are selected for their low toxicity, and are generally well
tolerated, certain excipient classes such as antioxidants and preservatives may have
some level of toxicity associated with them [3-5]. The overall safety profile of a drug
or excipient is not determined independently from each other, since the combination
of drug and excipient together defines the drug product tested in clinical trials [6].
Many pharmaceutical excipients are classified as “generally regarded as safe” or
GRAS and typically have a long history of safe use as food additives [7].
One major hurdle for the formulation scientist to develop stable protein formulations
is the limited number of excipients commonly used in parenteral formulations. The
introduction of novel pharmaceutical excipients to stabilize proteins would be of great
interest, however, the safety and efficacy of these new compounds would need to be
evaluated as part of the drug approval process [6]. Novel pharmaceutical excipients
have been designed to enhance protein stability, for example, low molecular weight
multi-ions [8].
The various classes of pharmaceutical excipients commonly used to formulate and
stabilize protein therapeutic drugs and vaccines are shown in Table 3.1,.(science
protein excipients)
Chapter 3
HPLC Method development and validation of protein based drugs
70
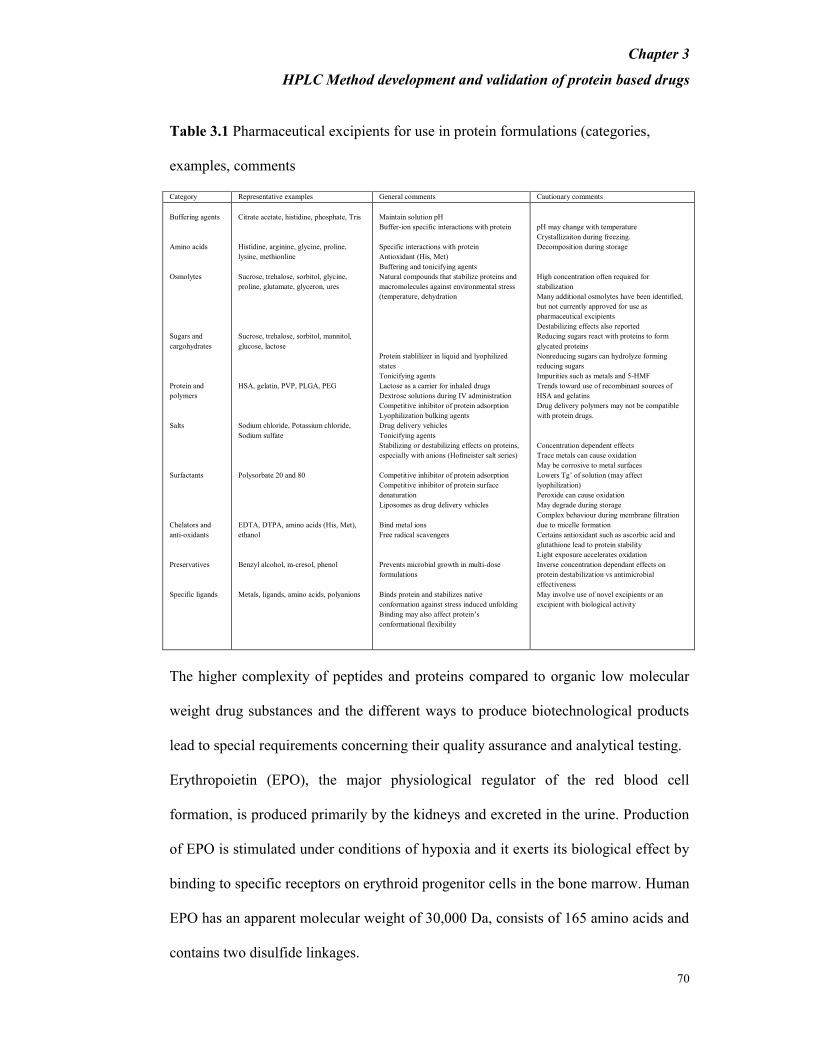
Table 3.1 Pharmaceutical excipients for use in protein formulations (categories,
examples, comments
Category Representative examples General comments Cautionary comments
Buffering agents
Amino acids
Osmolytes
Sugars and
cargohydrates
Protein and
polymers
Salts
Surfactants
Chelators and
anti-oxidants
Preservatives
Specific ligands
Citrate acetate, histidine, phosphate, Tris
Histidine, arginine, glycine, proline,
lysine, methionline
Sucrose, trehalose, sorbitol, glycine,
proline, glutamate, glyceron, ures
Sucrose, trehalose, sorbitol, mannitol,
glucose, lactose
HSA, gelatin, PVP, PLGA, PEG
Sodium chloride, Potassium chloride,
Sodium sulfate
Polysorbate 20 and 80
EDTA, DTPA, amino acids (His, Met),
ethanol
Benzyl alcohol, m-cresol, phenol
Metals, ligands, amino acids, polyanions
Maintain solution pH
Buffer-ion specific interactions with protein
Specific interactions with protein
Antioxidant (His, Met)
Buffering and tonicifying agents
Natural compounds that stabilize proteins and
macromolecules against environmental stress
(temperature, dehydration
Protein stablilizer in liquid and lyophilized
states
Tonicifying agents
Lactose as a carrier for inhaled drugs
Dextrose solutions during IV administration
Competitive inhibitor of protein adsorption
Lyophilization bulking agents
Drug delivery vehicles
Tonicifying agents
Stabilizing or destabilizing effects on proteins,
especially with anions (Hofmeister salt series)
Competitive inhibitor of protein adsorption
Competitive inhibitor of protein surface
denaturation
Liposomes as drug delivery vehicles
Bind metal ions
Free radical scavengers
Prevents microbial growth in multi-dose
formulations
Binds protein and stabilizes native
conformation against stress induced unfolding
Binding may also affect protein’s
conformational flexibility
pH may change with temperature
Crystallizaiton during freezing.
Decomposition during storage
High concentration often required for
stabilization
Many additional osmolytes have been identified,
but not currently approved for use as
pharmaceutical excipients
Destabilizing effects also reported
Reducing sugars react with proteins to form
glycated proteins
Nonreducing sugars can hydrolyze forming
reducing sugars
Impurities such as metals and 5-HMF
Trends toward use of recombinant sources of
HSA and gelatins
Drug delivery polymers may not be compatible
with protein drugs.
Concentration dependent effects
Trace metals can cause oxidation
May be corrosive to metal surfaces
Lowers Tg’ of solution (may affect
lyophilization)
Peroxide can cause oxidation
May degrade during storage
Complex behaviour during membrane filtration
due to micelle formation
Certains antioxidant such as ascorbic acid and
glutathione lead to protein stability
Light exposure accelerates oxidation
Inverse concentration dependant effects on
protein destabilization vs antimicrobial
effectiveness
May involve use of novel excipients or an
excipient with biological activity
The higher complexity of peptides and proteins compared to organic low molecular
weight drug substances and the different ways to produce biotechnological products
lead to special requirements concerning their quality assurance and analytical testing.
Erythropoietin (EPO), the major physiological regulator of the red blood cell
formation, is produced primarily by the kidneys and excreted in the urine. Production
of EPO is stimulated under conditions of hypoxia and it exerts its biological effect by
binding to specific receptors on erythroid progenitor cells in the bone marrow. Human
EPO has an apparent molecular weight of 30,000 Da, consists of 165 amino acids and
contains two disulfide linkages.
Chapter 3
HPLC Method development and validation of protein based drugs
71
The first clinical trials were performed with human erythropoietin purified from urine.
Today it is possible to produce human EPO by recombinant DNA technology (Lin et
al.,1985) [9] (rHuEP0) in mammalian cell cultures receiving much better yields to
supply the pharmaceutical market since its introduction in 1988. Recombinant human
erythropoietin is therapeutically used for the treatment of anemia resulting from
chronic kidney failure or from cancer therapy. Clinical trials with recombinant human
erythropoietin showed its efficacy for reversing anemia related to advanced cancer or
chemotherapy of cancer (Caro et al.,1989) [10]
Proteins or peptides can also be produced in quantities sufficient for pharmaceutical
use by recombinant DNA technology in bacteria, yeasts, or in cell cultures (Nagata et
al., 1980; Murray, 1980). [11, 12] The gene of interest is cloned into the appropriate
host where the recombinant protein is then expressed. After synthesis of the
recombinant protein by the ribosomes of the host cell, it is either directly secreted or
has to be isolated after disruption of the host cell. Depending on the host cell also
post-translational modifications of the recombinant protein occur. The recombinant
protein is then purified to homogeneity in several steps. The pure substance is
characterized and tested for the absence of impurities like host cell proteins or
aggregates. Somatostatin was the first human hormone synthesized in cell cultures.
Nowadays it is possible to produce human erythropoietin (HuEPO) by recombinant
DNA technology (Lin et al.,1985) [9] in mammalian cell cultures [e.g., Chinese
hamster ovary (CHO) cells]. Much higher yields compared to the purification from
urine are of great advantage due to the steadily increasing demand for the product
since its introduction to the market in 1988. Hu EPO consists of a polypeptide
sequence of 165 amino acids and a carbohydrate moiety, which contributes about
Chapter 3
HPLC Method development and validation of protein based drugs
72
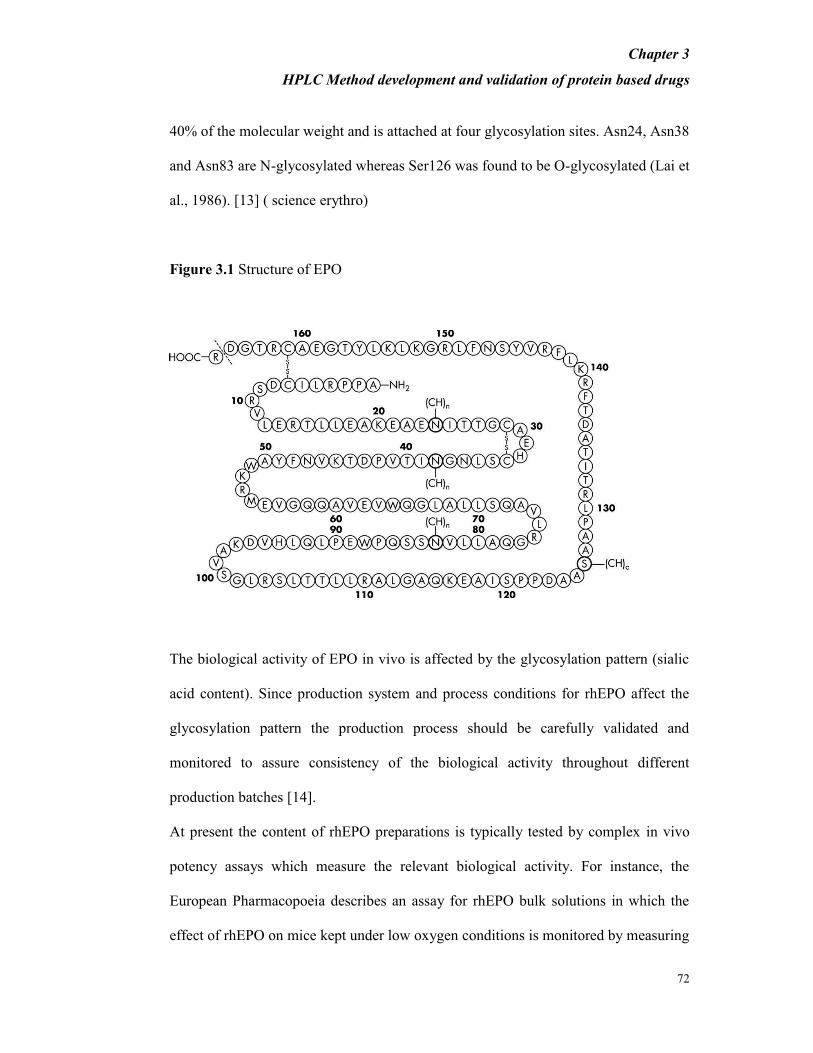
40% of the molecular weight and is attached at four glycosylation sites. Asn24, Asn38
and Asn83 are N-glycosylated whereas Ser126 was found to be O-glycosylated (Lai et
al., 1986). [13] ( science erythro)
Figure 3.1 Structure of EPO
The biological activity of EPO in vivo is affected by the glycosylation pattern (sialic
acid content). Since production system and process conditions for rhEPO affect the
glycosylation pattern the production process should be carefully validated and
monitored to assure consistency of the biological activity throughout different
production batches [14].
At present the content of rhEPO preparations is typically tested by complex in vivo
potency assays which measure the relevant biological activity. For instance, the
European Pharmacopoeia describes an assay for rhEPO bulk solutions in which the
effect of rhEPO on mice kept under low oxygen conditions is monitored by measuring
Chapter 3
HPLC Method development and validation of protein based drugs
73
incorporation of radio-labelled ferric chloride [15]. For assaying the content of rhEPO
preparations in a routine setting these types of bioassays require a significant number
of animals. A rapid and less resource demanding physico-chemical assay may not
specifically mimic bioactivity but it would provide a wider forum for controlling the
quality of these common pharmaceutical products. Moreover, from an analytical point
of view content assays based on physicochemical technology will be more precise
than bioassays. Developing a suitable physicochemical assay for rhEPO preparations
is hampered by the low dose of the micro-heterogeneous glycoprotein in presence of
relatively large amounts of excipients. Particular difficulties are encountered when
human serum albumin (HSA) is present. The protein HSA is obtained from large
pools of human plasma and cannot be considered chemically homogeneous. The
physicochemical assays should have a high degree of selectivity and reproducibility
for rhEPO assay. So far capillary electrophoresis (CE) methods have been developed
to characterize the rhEPO glycoform pattern and a capillary zone electrophoresis
method has been prescribed by the European Pharmacopoeia as an identification test
for rhEPO in concentrated bulk solutions [15]. In addition to this method, another CE
method has been developed that is capable of analysing rhEPO pharmaceutical
preparations containing salts and HSA, and in the concentration range of 0.03–1.92
mg rhEPO/ml [16].
High-performance anion-exchange chromatography (HPAEC) separates proteins
according to their negative electric charge and has been used for EPO assay with
fluorimetric detection by D.M.A.M. Luykx et al. in pharmaceutical products. [17].
Srinivas R. Gunturi et al. have developed a method for the determination of rHu EPO
aggregates in formulations by HPLC method with fluorescence detection [18].
Chapter 3
HPLC Method development and validation of protein based drugs
74
Among the possible methods to eliminate HSA, immunoaffinity chromatography
(IAC) is one of the most effective ones [19]. However, there is no method reported
for the determination of EPO in the presence of HSA without any sample
pretreatment.
HPLC in combination with UV-detection is a separation method that provides a
powerful means for characterising the homogeneity of common biopharmaceuticals
such as somatropin, insulin and interferons. Because of its high resolution, reversed-
phase HPLC is often applied for quantification of the active pharmaceutical ingredient
and for the analysis of closely related protein variants or degradation products (e.g.,
oxidised, deamidated) [20-22].
Although HPLC methodologies have been described previously, they have been
developed either for analysis of purified r-Hu EPO monomeric protein [23-24] or for
investigation of r-Hu EPO (monomer) metabolic pathways [25] in the absence of
HSA.
3.2 CHALLENGES IN RP- HPLC / UPLC ANALYSIS OF PROTEINS AND
PEPTIDES
RP-HPLC / UPLC analysis of biomolecules such as proteins and peptides can be a
challenge as there are often problems associated with analytical systems such as
excessive band broadening, peak tailing or misshaped bands, low recovery, ghost
peaks and the appearance of one protein in two or more distinct bands [26].
Understanding the impact of process variables in RP-HPLC can help minimise or
eliminate these undesirable effects.
The analysis of biochemical entities such as peptides, proteins, and oligo-nucleotides
by RP-HPLC pose different challenges as compared to the analysis of small chemical
Chapter 3
HPLC Method development and validation of protein based drugs
75
molecules since they have larger hydrodynamic radii and different functionalities in
the molecules that may result in different interactions with RP-HPLC stationary and
mobile phases. These factors must be considered in the development of an analytical
method for proteins and peptides [26-27]
However, there is no method reported for the determination of EPO in the presence of
HSA without any sample pretreatment
The objective of the study was to develop methods, using “RP-HPLC, and UPLC”
techniques that enable quantification of EPO in medicinal formulations containing
HSA.
Abbreviations used:
EPO – Erythropoietin
EPO-IRS – EPO Internal Reference Standard
DS (API) – Drug Substance (Active Pharmaceutical Ingredient)
EPO-DS – EPO Drug Substance
DP – Drug Product
EPO-DP – EPO Drug Product
RMP – Reference
rHu – Recombinant Human
HSA – Human Serum Albumin
EP – European Pharmacopoeia

Chapter 3
HPLC Method development and validation of protein based drugs
76
3.3 QUANTIFICATION OF EPO AND METHOD VALIDATION
3.3.1 EXPERIMENTAL
Materials, reagents and chemicals
HPLC grade acetonitrile was purchased from Merck; tri-fluoro-acetic acid (TFA) was
purchased from Sigma Aldrich. Ultra pure water was obtained using Milli-Q® UF-
Plus (Millipore) system. Human Serum Albumin (HSA) with 20% globulin fraction
was obtained from Baxter. EPO internal reference standard (EPO-IRS) having
0.8mg/mL concentration was procured from Intas Biopharmaceuticals Ahmedabad
was used as standard and was qualified using EP reference standard. Formulated EPO
(Drug Product) was used to prepare samples. Other chemicals, such as tri-sodium
dihydrate, sodium chloride and citric acid used were of “highest purity” available.
Preparation of standard, mobile phase and dilution buffer
EPO-IRS was used for preparation of different working standards using dilution
buffer or dilution buffer containing 2.5mg/mL of HSA.
Mobile phase ‘A’ consisted of 0.1% v/v TFA in Milli Q water and mobile phase ‘B’
consisted of 0.1% v/v TFA in acetonitrile.
Dilution buffer (Citrate buffer) containing 5.8 mg/mL tri-sodium dihydrate; 5.8
mg/mL sodium chloride and 0.06 mg/mL citric acid in “Milli Q water” was prepared
and used so as to have a matrix similar to EPO formulation. Dilution buffer with
HSA was prepared by diluting 2.5 mg/mL of HSA in dilution buffer. All dilutions
were made using calibrated digital micro-pipettes.

Chapter 3
HPLC Method development and validation of protein based drugs
77
Chromatographic condition
HPLC – An LC system equipped with an injection valve (quaternary), 215 UV
detector and chemstation software was used for RP-HPLC method. A reverse -phase
C8 column (4.6 mm ID × 250 mm L, porosity 300º A, particle size 5 µm) with guard
column (reverse-phase C18 column of 4.6 mm ID × 35 mm L, porosity 300º A,
particle size 5 µm) was used for separation. To get the optimum results, mobile phase
with a flow rate of 1.5 mL/min and column temperature at 45oC were used. The
gradient programme for mobile phase was optimized using a timed gradient
programme T (min)/%mobile phase A: 0/65, 4/65, 12/50, 14/50, 15/40, 16/65, 20/65.
UPLC – An LC system equipped with an injection valve (binary), a 210 UV detector
and Empower software was used for RP-UPLC method. Reverse-phase C18 column
(2.1 mm ID × 50 mm L, porosity 135ºA, particle size 1.7 µm) was used for
separation. To get the optimum results, mobile phase flow rate was kept constant at
0.35 mL/min and column temperature at 60oC. The gradient programme for mobile
phase was optimized using a timed gradient programme T (min)/%mobile phase A:
0/85, 0.12/85, 0.33/70, 0.62/64, 2.62/35, 3.19/0, 3.76/85 and 4.05/85.
3.3.2. RESULTS AND DISCUSSION
3.3.2.1. RP HPLC method
3.3.2.1.1 Method development
Initially, the gradient HPLC conditions were optimized for EPO in presence of HSA.
Based on the different hydrophobic properties of both proteins in a non-polar
stationary phase, an RP-HPLC in gradient mode was used. JADWIGA et. al. had
reported a HPLC method with an analysis time of about 60 min., with retention times,
of approximately 17 and 33 min for HSA and EPO, respectively The HPLC method
Chapter 3
HPLC Method development and validation of protein based drugs
78
proposed by JADWIGA et al. [28] was taken into consideration for the experiments
and efforts were made to minimize the analysis time which is a must for multi-product
facility. The chromatographic separation was achieved by applying chromatographic
conditions as described in above section 3.4.1.
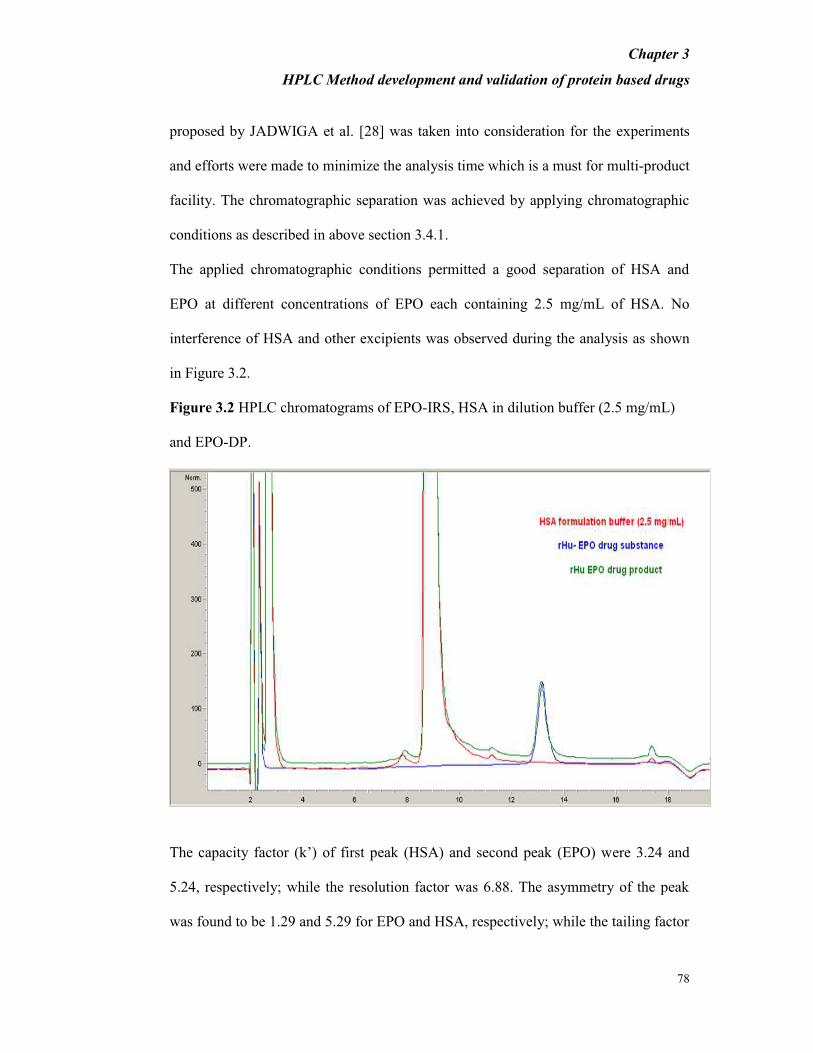
The applied chromatographic conditions permitted a good separation of HSA and
EPO at different concentrations of EPO each containing 2.5 mg/mL of HSA. No
interference of HSA and other excipients was observed during the analysis as shown
in Figure 3.2.
Figure 3.2 HPLC chromatograms of EPO-IRS, HSA in dilution buffer (2.5 mg/mL)
and EPO-DP.
The capacity factor (k’) of first peak (HSA) and second peak (EPO) were 3.24 and
5.24, respectively; while the resolution factor was 6.88. The asymmetry of the peak
was found to be 1.29 and 5.29 for EPO and HSA, respectively; while the tailing factor

Chapter 3
HPLC Method development and validation of protein based drugs
79
parameter was found to be 1.29 and 1.14 for EPO and HSA, respectively. For
replicate injections of EPO-IRS the % RSD of the main peak area was found to be
below 0.7%, and there was no variation in the retention time (less than 0.1 min).
Based on the studied parameters, it was concluded that the EPO and HSA peaks were
well resolved in the developed method and the tailing factor was within limits.
3.3.2.1.2 Method validation
System Suitability:
The chromatographic separation, as explained above was carried out with HPLC to
evaluate the chromatographic parameters. To check the suitability, a known amount
of EPO-IRS was spiked to the dilution buffer and a chromatogram was run.
Representative chromatogram is shown in Figure 3.3, which corresponds to the
chromatographic separation of these substances. The % RSD for the main peak area
of EPO-IRS( measured in triplicate) were found to be below 0.7%, while no variation
in the retention time was observed (less than 0.1 minute). The peaks due to EPO and
HSA were thus considered well resolved.
Figure 3.3: Chromatogram of EPO-DS spiked in dilution buffer containing HSA
2.5mg/mL
min2 4 6 8 10 12 14 16 18
mAU
-100
0
100
200
300
400
500
600
700
13.15
6
One sharp peak of EPO was eluted at 13.1 min along with the HSA peak that was
eluted at 9.0min. The EPO peak was matched with the standard peak of EPO-IRS.

Chapter 3
HPLC Method development and validation of protein based drugs
80
Specificity
To evaluate possible interfering peaks, two different concentrations of EPO-IRS
(0.04, and 0.1 mg/mL) in dilution buffer and HSA containing dilution buffer were
injected into HPLC. No interference was observed as evidenced by the following
observations:
o No peak was observed in the integration window of the chromatogram for
the sample of mobile phase (blank), HSA in dilution buffer, Dilution
buffer.
o Variation in Retention time of main peak between EPO-IRS and EPO-DP
was less than 0.5 min.
o Variation in terms of % recovery of EPO-IRS spiked in HSA dilution
buffer was less than 5.0 % as compared to EPO-IRS spiked in mobile
phase A.
o There was 0.1 min variation in retention time of main peak of EPO-IRS in
mobile phase as compared to the retention time of the main peak of EPO-
IRS solution (0.1mg/mL).
Linearity and Range
EPO-IRS was used for preparation of different concentrations of EPO-IRS ranging
from 0.028 to 0.130 mg/mL, each containing 2.5 mg/mL HSA. Linearity curves were
plotted for 0.04 and 0.1 mg/mL of EPO-IRS (Figure 3.4).
Chapter 3
HPLC Method development and validation of protein based drugs
81
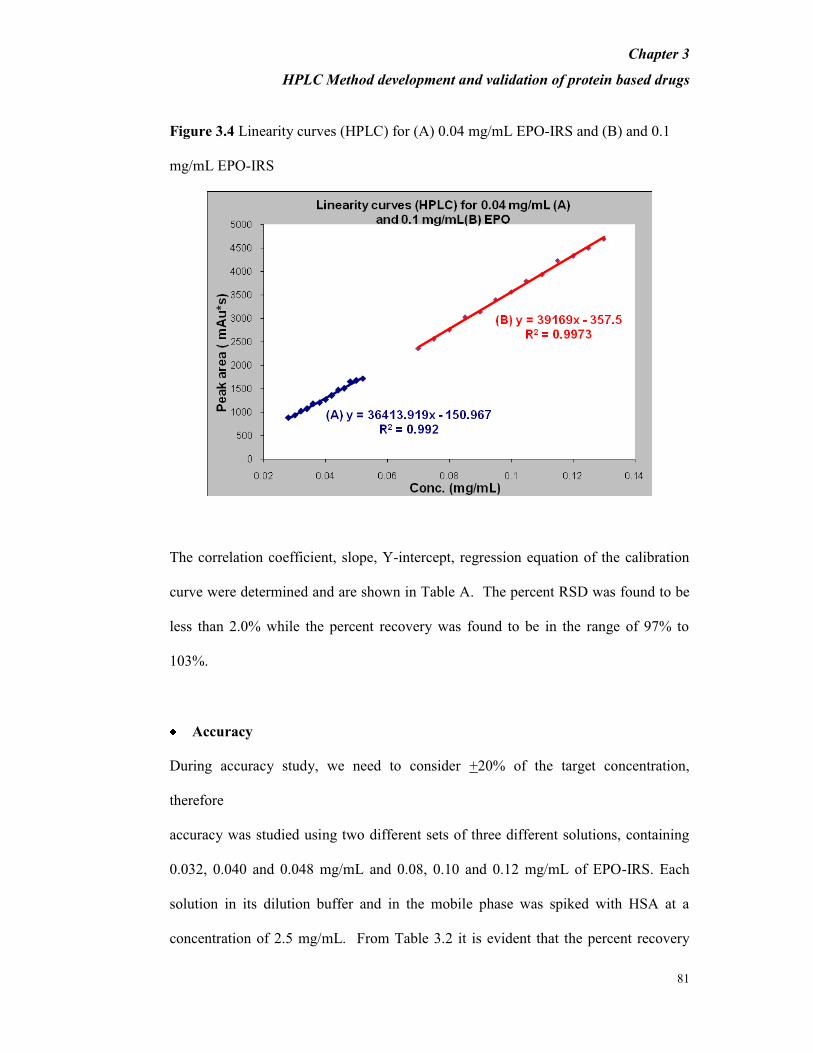
Figure 3.4 Linearity curves (HPLC) for (A) 0.04 mg/mL EPO-IRS and (B) and 0.1
mg/mL EPO-IRS
The correlation coefficient, slope, Y-intercept, regression equation of the calibration
curve were determined and are shown in Table A. The percent RSD was found to be
less than 2.0% while the percent recovery was found to be in the range of 97% to
103%.
Accuracy
During accuracy study, we need to consider +20% of the target concentration,
therefore
accuracy was studied using two different sets of three different solutions, containing
0.032, 0.040 and 0.048 mg/mL and 0.08, 0.10 and 0.12 mg/mL of EPO-IRS. Each
solution in its dilution buffer and in the mobile phase was spiked with HSA at a
concentration of 2.5 mg/mL. From Table 3.2 it is evident that the percent recovery
Chapter 3
HPLC Method development and validation of protein based drugs
82
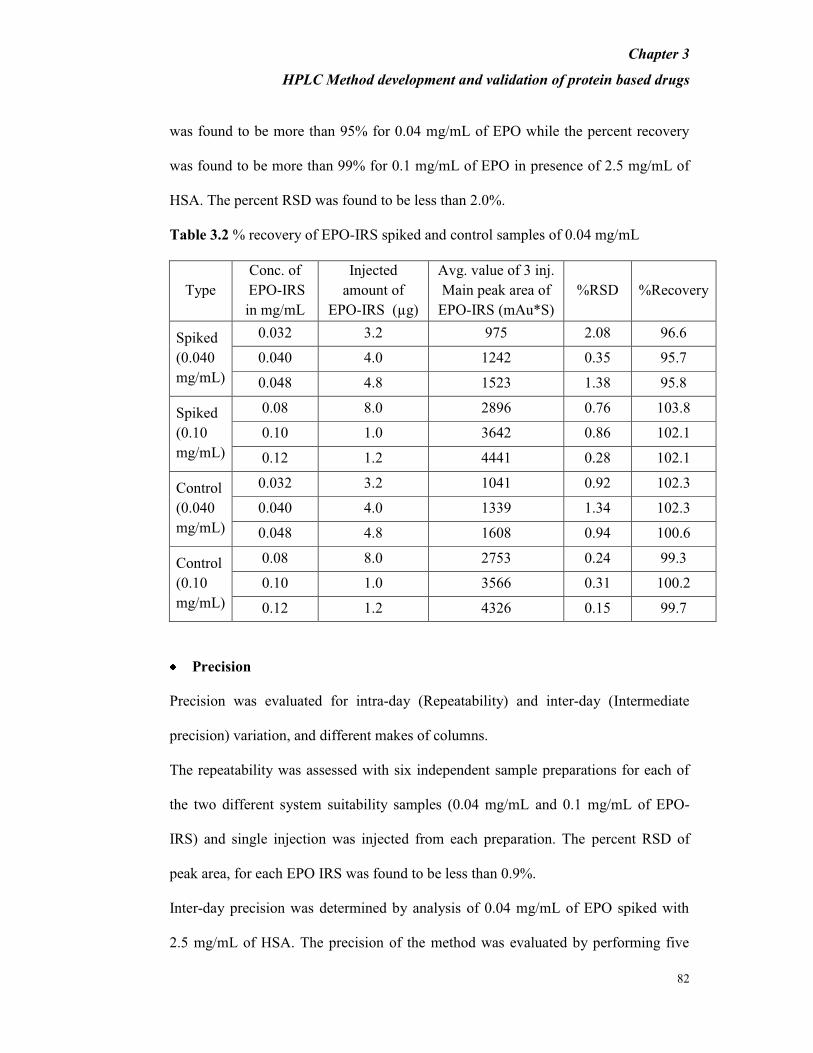
was found to be more than 95% for 0.04 mg/mL of EPO while the percent recovery
was found to be more than 99% for 0.1 mg/mL of EPO in presence of 2.5 mg/mL of
HSA. The percent RSD was found to be less than 2.0%.
Table 3.2 % recovery of EPO-IRS spiked and control samples of 0.04 mg/mL
Type
Conc. of
EPO-IRS
in mg/mL
Injected
amount of
EPO-IRS (µg)
Avg. value of 3 inj.
Main peak area of
EPO-IRS (mAu*S)
%RSD %Recovery
Spiked
(0.040
mg/mL)
0.032 3.2 975 2.08 96.6
0.040 4.0 1242 0.35 95.7
0.048 4.8 1523 1.38 95.8
Spiked
(0.10
mg/mL)
0.08 8.0 2896 0.76 103.8
0.10 1.0 3642 0.86 102.1
0.12 1.2 4441 0.28 102.1
Control
(0.040
mg/mL)
0.032 3.2 1041 0.92 102.3
0.040 4.0 1339 1.34 102.3
0.048 4.8 1608 0.94 100.6
Control
(0.10
mg/mL)
0.08 8.0 2753 0.24 99.3
0.10 1.0 3566 0.31 100.2
0.12 1.2 4326 0.15 99.7
Precision
Precision was evaluated for intra-day (Repeatability) and inter-day (Intermediate
precision) variation, and different makes of columns.
The repeatability was assessed with six independent sample preparations for each of
the two different system suitability samples (0.04 mg/mL and 0.1 mg/mL of EPO-
IRS) and single injection was injected from each preparation. The percent RSD of
peak area, for each EPO IRS was found to be less than 0.9%.
Inter-day precision was determined by analysis of 0.04 mg/mL of EPO spiked with
2.5 mg/mL of HSA. The precision of the method was evaluated by performing five
Chapter 3
HPLC Method development and validation of protein based drugs
83
different conditions (n = 30) (Table 3.4) and calculating the relative standard
deviations (RSD). Three replicate injections of system suitability standards prepared
independently were considered for the study. The percent RSD for the main peak
area of EPO-IRS within each set and between different sets was found to be less than
2.0%. The percent recovery of each EPO -IRS was found to be between 95.0% -
105.0% and the maximum variation between sets was found to be 5.0%.
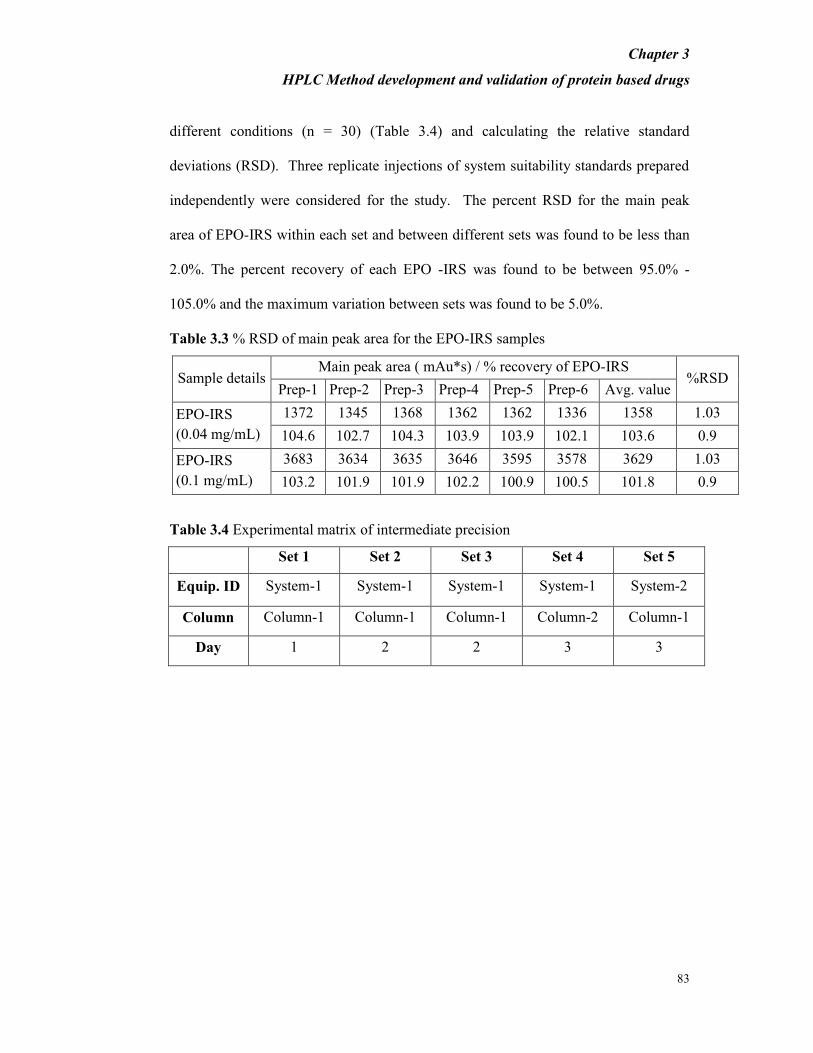
Table 3.3 % RSD of main peak area for the EPO-IRS samples
Sample details Main peak area ( mAu*s) / % recovery of EPO-IRS
%RSD Prep-1 Prep-2 Prep-3 Prep-4 Prep-5 Prep-6 Avg. value
EPO-IRS
(0.04 mg/mL)
1372 1345 1368 1362 1362 1336 1358 1.03
104.6 102.7 104.3 103.9 103.9 102.1 103.6 0.9
EPO-IRS
(0.1 mg/mL)
3683 3634 3635 3646 3595 3578 3629 1.03
103.2 101.9 101.9 102.2 100.9 100.5 101.8 0.9
Table 3.4 Experimental matrix of intermediate precision
Set 1 Set 2 Set 3 Set 4 Set 5
Equip. ID System-1 System-1 System-1 System-1 System-2
Column Column-1 Column-1 Column-1 Column-2 Column-1
Day 1 2 2 3 3
Chapter 3
HPLC Method development and validation of protein based drugs
84
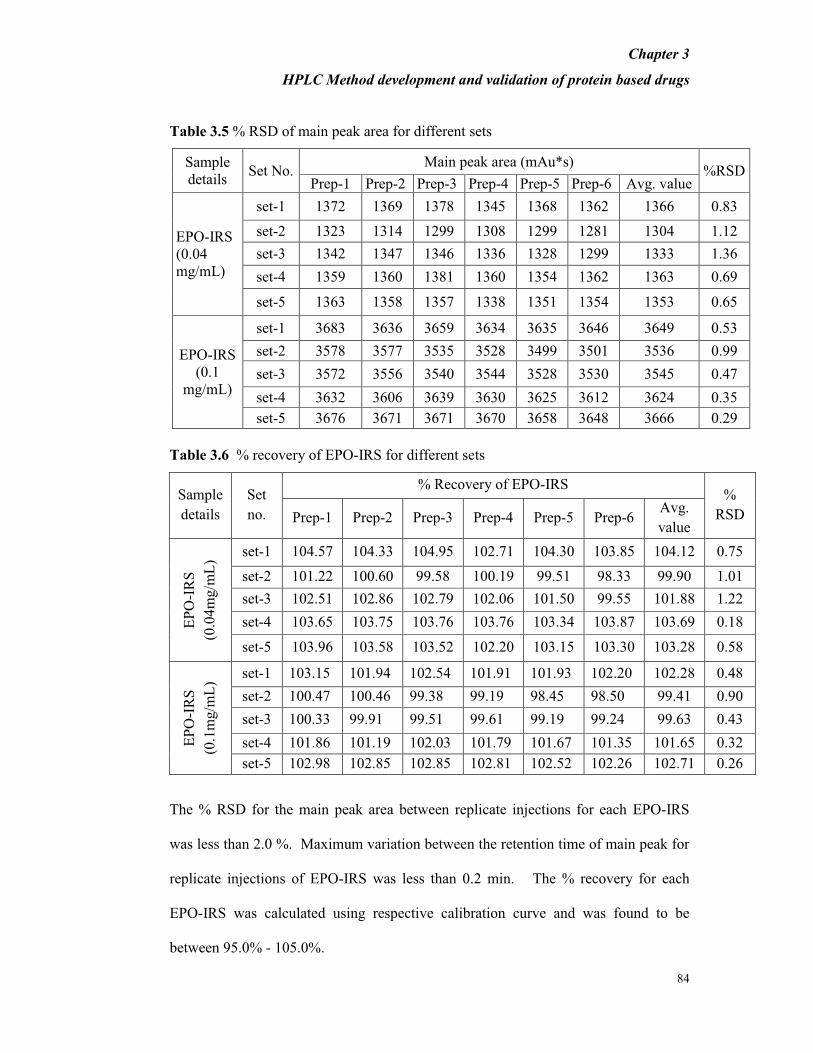
Table 3.5 % RSD of main peak area for different sets
Sample
details Set No.
Main peak area (mAu*s) %RSD
Prep-1 Prep-2 Prep-3 Prep-4 Prep-5 Prep-6 Avg. value
EPO-IRS
(0.04
mg/mL)
set-1 1372 1369 1378 1345 1368 1362 1366 0.83
set-2 1323 1314 1299 1308 1299 1281 1304 1.12
set-3 1342 1347 1346 1336 1328 1299 1333 1.36
set-4 1359 1360 1381 1360 1354 1362 1363 0.69
set-5 1363 1358 1357 1338 1351 1354 1353 0.65
EPO-IRS
(0.1
mg/mL)
set-1 3683 3636 3659 3634 3635 3646 3649 0.53
set-2 3578 3577 3535 3528 3499 3501 3536 0.99
set-3 3572 3556 3540 3544 3528 3530 3545 0.47
set-4 3632 3606 3639 3630 3625 3612 3624 0.35
set-5 3676 3671 3671 3670 3658 3648 3666 0.29
Table 3.6 % recovery of EPO-IRS for different sets
Sample
details
Set
no.
% Recovery of EPO-IRS %
RSD Prep-1 Prep-2 Prep-3 Prep-4 Prep-5 Prep-6 Avg.
value
EP
O-I
RS
(0.0
4m
g/m
L)
set-1 104.57 104.33 104.95 102.71 104.30 103.85 104.12 0.75
set-2 101.22 100.60 99.58 100.19 99.51 98.33 99.90 1.01
set-3 102.51 102.86 102.79 102.06 101.50 99.55 101.88 1.22
set-4 103.65 103.75 103.76 103.76 103.34 103.87 103.69 0.18
set-5 103.96 103.58 103.52 102.20 103.15 103.30 103.28 0.58
EP
O-I
RS
(0.1
mg/m
L)
set-1 103.15 101.94 102.54 101.91 101.93 102.20 102.28 0.48
set-2 100.47 100.46 99.38 99.19 98.45 98.50 99.41 0.90
set-3 100.33 99.91 99.51 99.61 99.19 99.24 99.63 0.43
set-4 101.86 101.19 102.03 101.79 101.67 101.35 101.65 0.32
set-5 102.98 102.85 102.85 102.81 102.52 102.26 102.71 0.26
The % RSD for the main peak area between replicate injections for each EPO-IRS
was less than 2.0 %. Maximum variation between the retention time of main peak for
replicate injections of EPO-IRS was less than 0.2 min. The % recovery for each
EPO-IRS was calculated using respective calibration curve and was found to be
between 95.0% - 105.0%.

Chapter 3
HPLC Method development and validation of protein based drugs
85
The above results and observations proved that the developed method is precise for
the above mentioned EPO samples when analyzed with respect to, different days,
different instruments and different brands columns (Table 3.5 and 3.6) and hence the
parameter of precision stands validated.
Robustness
Robustness was tested by varying age effect of mobile phase and test samples, column
temperature and mobile phase composition.
Age effect of mobile phase and test samples held for seven days
Freshly prepared samples for system suitability (0.04 mg/mL and 0.1 mg/mL of EPO-
IRS) and those prepared seven days ago were analyzed using both freshly prepared
and seven day old mobile phase. There was not much variation in the results as seen
from Table 3.7, with percent variation from initial day to 7 days being about 5% and
percent RSD being less than 0.4%. There was no difference in retention time and
percent recovery was found to be between 90% and 110%. It is thus recommended to
use freshly prepared sample as well as mobile phase for analysis.
Column temperature effect
Experiments were conducted using system suitability samples with column
temperature variation of + 2ºC from the set temperature (60ºC) and the results are
shown in Table 3.7. The percent RSD was found to be less than 0.7%, with no
variation at lower temperature. However, 5% variation was observed at higher
temperature and + 0.1 minute difference in retention time. The percent recovery was
found to be within acceptable limits (95 – 105%).
Chapter 3
HPLC Method development and validation of protein based drugs
86
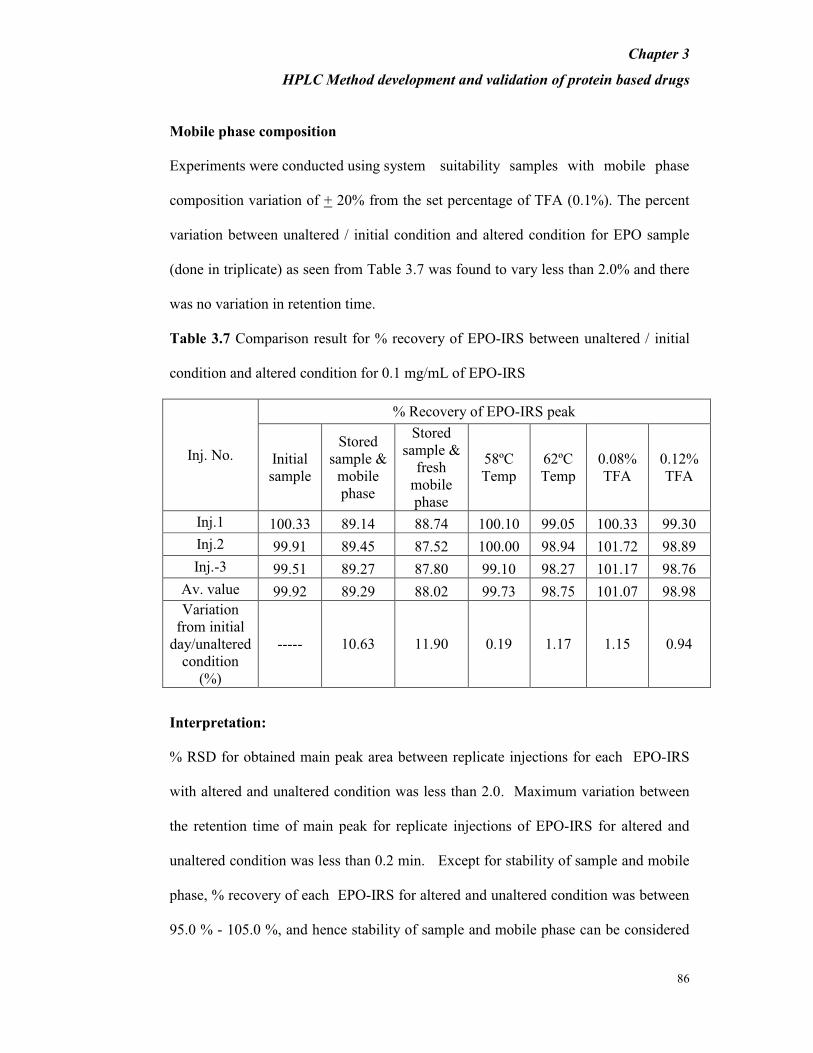
Mobile phase composition
Experiments were conducted using system suitability samples with mobile phase
composition variation of + 20% from the set percentage of TFA (0.1%). The percent
variation between unaltered / initial condition and altered condition for EPO sample
(done in triplicate) as seen from Table 3.7 was found to vary less than 2.0% and there
was no variation in retention time.
Table 3.7 Comparison result for % recovery of EPO-IRS between unaltered / initial
condition and altered condition for 0.1 mg/mL of EPO-IRS
Inj. No.
% Recovery of EPO-IRS peak
Initial
sample
Stored
sample &
mobile
phase
Stored
sample &
fresh
mobile
phase
58ºC
Temp
62ºC
Temp
0.08%
TFA
0.12%
TFA
Inj.1 100.33 89.14 88.74 100.10 99.05 100.33 99.30
Inj.2 99.91 89.45 87.52 100.00 98.94 101.72 98.89
Inj.-3 99.51 89.27 87.80 99.10 98.27 101.17 98.76
Av. value 99.92 89.29 88.02 99.73 98.75 101.07 98.98
Variation
from initial
day/unaltered
condition
(%)
----- 10.63 11.90 0.19 1.17 1.15 0.94
Interpretation:
% RSD for obtained main peak area between replicate injections for each EPO-IRS
with altered and unaltered condition was less than 2.0. Maximum variation between
the retention time of main peak for replicate injections of EPO-IRS for altered and
unaltered condition was less than 0.2 min. Except for stability of sample and mobile
phase, % recovery of each EPO-IRS for altered and unaltered condition was between
95.0 % - 105.0 %, and hence stability of sample and mobile phase can be considered
Chapter 3
HPLC Method development and validation of protein based drugs
87
critical for the method under study. So for routine analysis freshly prepared sample as
well as mobile phase is recommended.
3.3.2.2 UPLC method
3.3.2.2.1 Method development
The basic chromatographic conditions like stationary phase, solvents and UV
detector, employed in HPLC were taken into account while developing the new
UPLC method. The stationary phase C18 was chosen in order to have similar polarity
as that used in HPLC method. The injection volume was scaled down by about 10
fold to that used in HPLC. To get the optimum results, mobile phase flow rate was
kept constant at 0.35 mL/min and column temperature was maintained at 60oC.
The chromatographic separation was achieved as described in Section 3.4.1.
The applied chromatographic conditions permitted a good separation of HSA and
EPO. Different concentrations of EPO-IRS in the range 2.5 to 150 µg with 2.5
mg/mL of HSA were studied and no interference of HSA and other excipients was
observed during the analysis. Representative chromatograms are shown in Figure 3.5.
Chapter 3
HPLC Method development and validation of protein based drugs
88
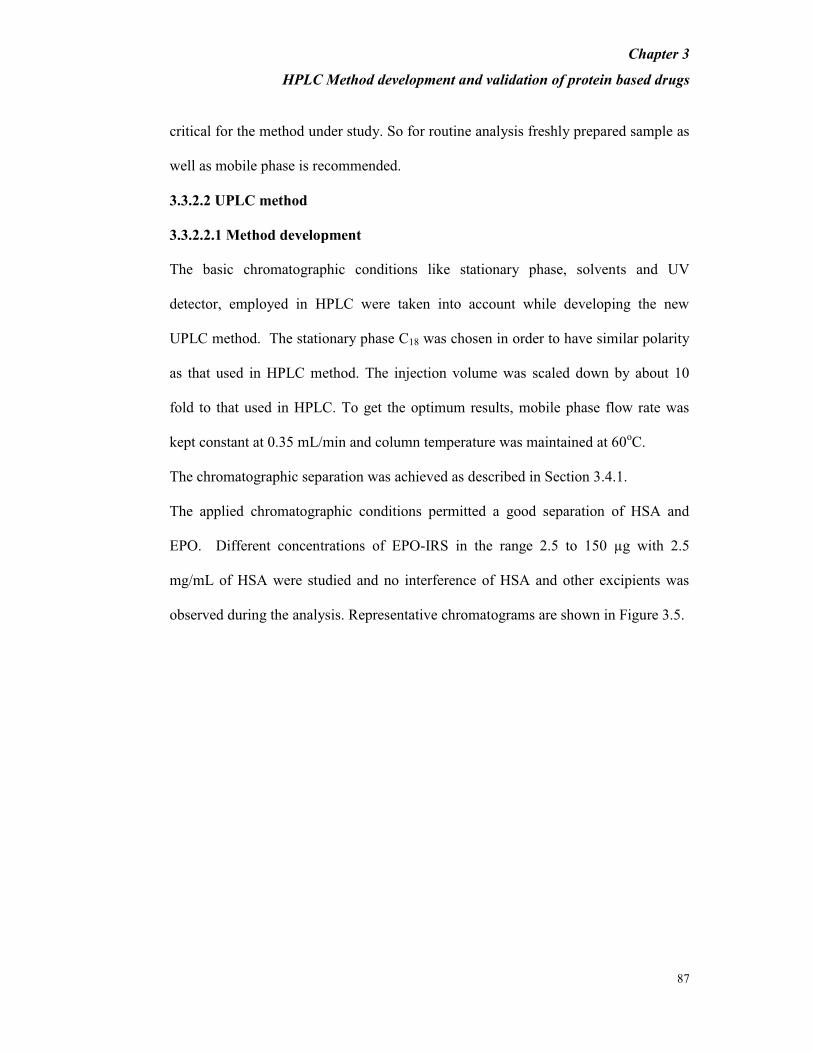
Figure 3.5 UPLC chromatogram of internal EPO-IRS, HSA in dilution buffer (2.5
mg/mL) & EPO-DP.
AU
-0.20
0.00
0.20
0.40
0.60
0.80
1.00
1.20
1.40
1.60
1.80
2.00
2.20
2.40
2.60
2.80
3.00
Minutes
0.00 0.20 0.40 0.60 0.80 1.00 1.20 1.40 1.60 1.80 2.00 2.20 2.40 2.60 2.80 3.00 3.20 3.40 3.60 3.80 4.00
The capacity factor (k’) was 2.45 and 3.9 for the first and second peak respectively,
while the resolution factor was 5.35. The asymmetry of the peak was found to be 5.63
and 1.57 for HSA and EPO respectively. Tailing factor was found to be 3.68 and 1.33
for HSA and EPO, respectively. The percent RSD of the main peak area for replicate
injections of EPO-IRS was found to be below 2.0% while no variation in the retention
time was observed (less than 0.1 minutes).
3.3.2.2.2 Method Validation
System Suitability:
The chromatographic separation, as explained above was carried out with UPLC to
evaluate the chromatographic parameters. A sample containing 0.1 mg/mL EPO-IRS
in 2.5 mg/mL HSA in dilution buffer was run and the representative chromatogram is
shown in Figure 3.6, which corresponds to the chromatographic separation of these
EPO IRS
HSA in formulation buffer
EPO Drug Product
Chapter 3
HPLC Method development and validation of protein based drugs
89
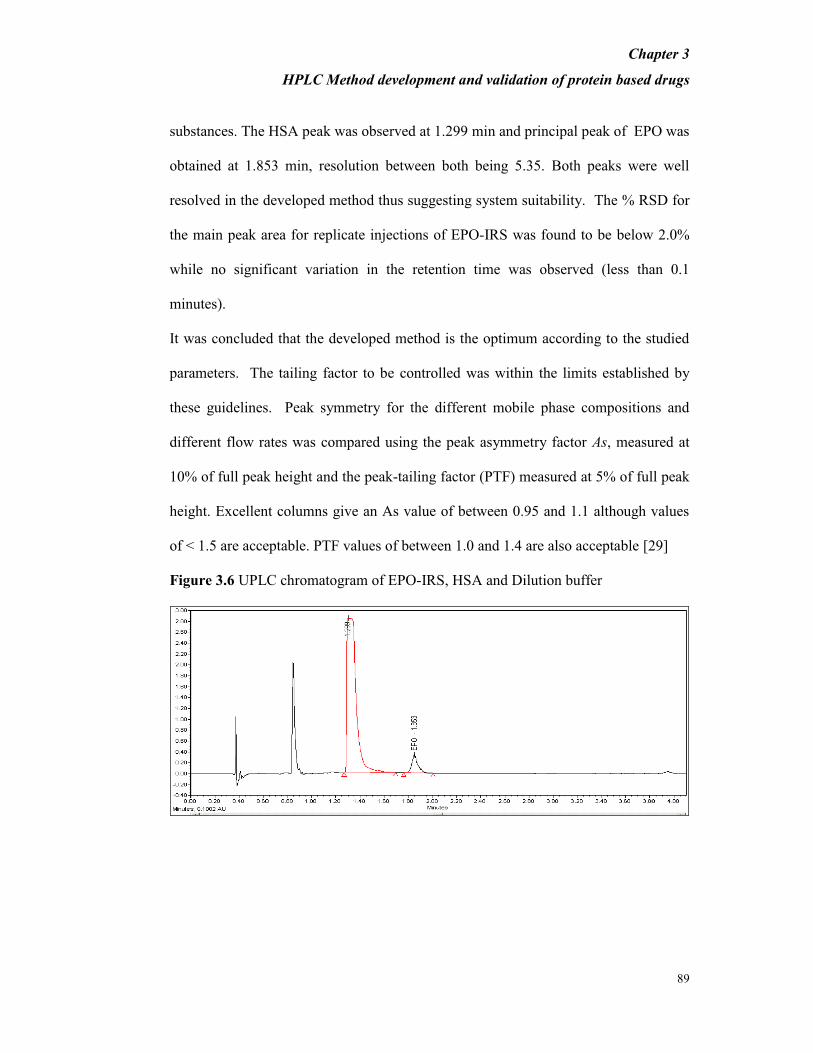
substances. The HSA peak was observed at 1.299 min and principal peak of EPO was
obtained at 1.853 min, resolution between both being 5.35. Both peaks were well
resolved in the developed method thus suggesting system suitability. The % RSD for
the main peak area for replicate injections of EPO-IRS was found to be below 2.0%
while no significant variation in the retention time was observed (less than 0.1
minutes).
It was concluded that the developed method is the optimum according to the studied
parameters. The tailing factor to be controlled was within the limits established by
these guidelines. Peak symmetry for the different mobile phase compositions and
different flow rates was compared using the peak asymmetry factor As, measured at
10% of full peak height and the peak-tailing factor (PTF) measured at 5% of full peak
height. Excellent columns give an As value of between 0.95 and 1.1 although values
of < 1.5 are acceptable. PTF values of between 1.0 and 1.4 are also acceptable [29]
Figure 3.6 UPLC chromatogram of EPO-IRS, HSA and Dilution buffer
Chapter 3
HPLC Method development and validation of protein based drugs
90
Specificity
Separation selectivity is the ability of the method to elicit a response specific for the
analyte in the presence of other components/substances that are present or are likely
to be present with the analyte.
To address separation selectivity, 0.1 mg/mL of EPO-IRS in mobile phase (as positive
control), HSA 2.5 mg/mL in dilution buffer, HSA 2.5 mg/mL in mobile phase, 0.1
mg/mL of EPO-IRS with 2.5mg/mL HSA in dilution buffer, mobile phase (Blank),
Milli Q water and dilution buffer were injected into UPLC column.
HSA in dilution buffer and mobile phase was considered as the matrix components.
Interference by the matrix components was evaluated by spiking known amount of
EPO IRS in dilution buffer with HSA. No interference of matrix components was
observed.
Linearity and Range
EPO IRS was used for preparation of different working concentrations ranging from
0.0025 to 0.150 mg/mL, each containing 2.5 mg/mL of HSA. The peak area was
plotted as shown in Figure 3.7.

Chapter 3
HPLC Method development and validation of protein based drugs
91
Figure 3.7 Linearity curve (UPLC) for EPO-IRS
Calibration curves with concentration versus peak area were plotted with blank
subtraction. The correlation coefficient, slopes and Y-intercepts and regression
equation were determined and are shown in Table A. The correlation coefficient was
found to be 0.999. The percent RSD was found to be less than 2.0% while the percent
recovery was found to be in the range of 97% to 103%.
Chapter 3
HPLC Method development and validation of protein based drugs
92
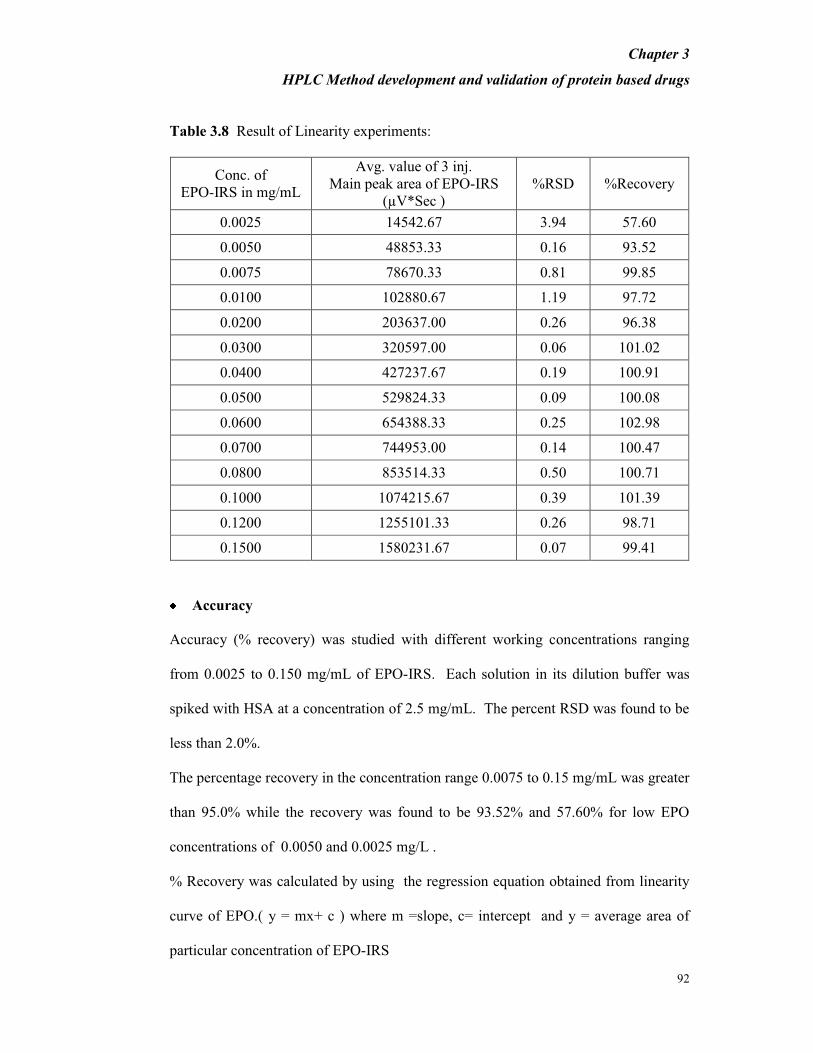
Table 3.8 Result of Linearity experiments:
Conc. of
EPO-IRS in mg/mL
Avg. value of 3 inj.
Main peak area of EPO-IRS
(µV*Sec )
%RSD %Recovery
0.0025 14542.67 3.94 57.60
0.0050 48853.33 0.16 93.52
0.0075 78670.33 0.81 99.85
0.0100 102880.67 1.19 97.72
0.0200 203637.00 0.26 96.38
0.0300 320597.00 0.06 101.02
0.0400 427237.67 0.19 100.91
0.0500 529824.33 0.09 100.08
0.0600 654388.33 0.25 102.98
0.0700 744953.00 0.14 100.47
0.0800 853514.33 0.50 100.71
0.1000 1074215.67 0.39 101.39
0.1200 1255101.33 0.26 98.71
0.1500 1580231.67 0.07 99.41
Accuracy
Accuracy (% recovery) was studied with different working concentrations ranging
from 0.0025 to 0.150 mg/mL of EPO-IRS. Each solution in its dilution buffer was
spiked with HSA at a concentration of 2.5 mg/mL. The percent RSD was found to be
less than 2.0%.
The percentage recovery in the concentration range 0.0075 to 0.15 mg/mL was greater
than 95.0% while the recovery was found to be 93.52% and 57.60% for low EPO
concentrations of 0.0050 and 0.0025 mg/L .
% Recovery was calculated by using the regression equation obtained from linearity
curve of EPO.( y = mx+ c ) where m =slope, c= intercept and y = average area of
particular concentration of EPO-IRS
Chapter 3
HPLC Method development and validation of protein based drugs
93
Back calculated concentration (x)
% Recoveryry
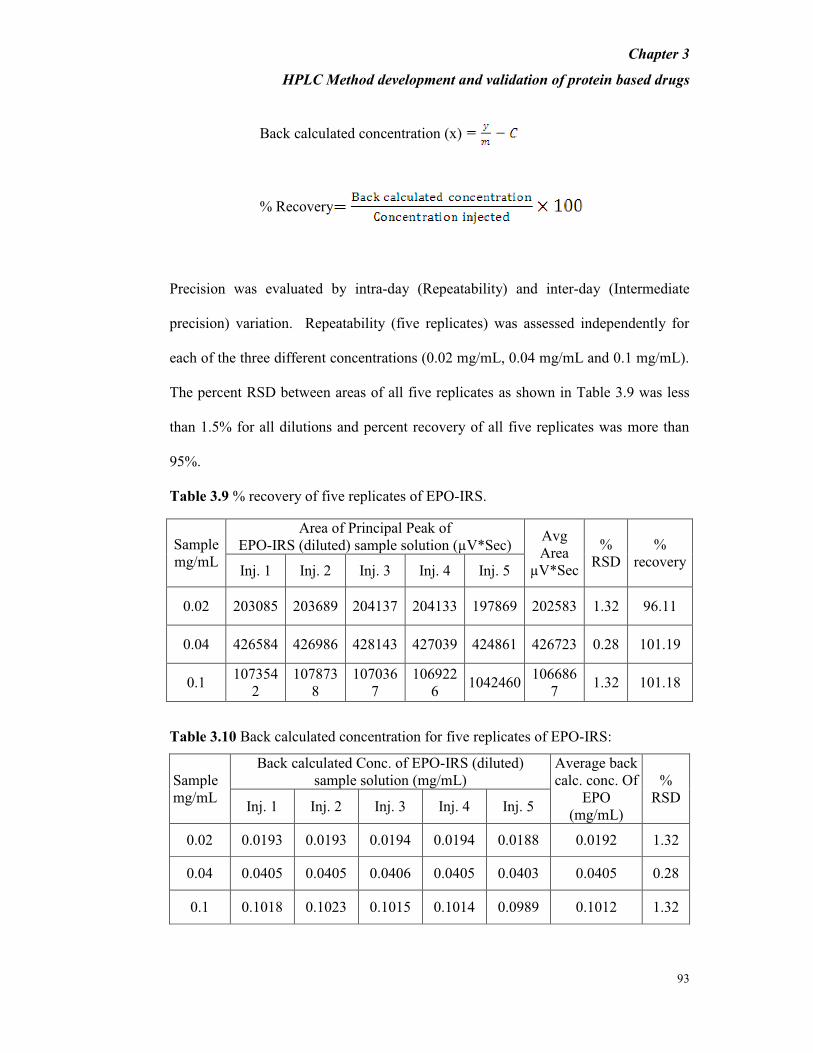
Precision was evaluated by intra-day (Repeatability) and inter-day (Intermediate
precision) variation. Repeatability (five replicates) was assessed independently for
each of the three different concentrations (0.02 mg/mL, 0.04 mg/mL and 0.1 mg/mL).
The percent RSD between areas of all five replicates as shown in Table 3.9 was less
than 1.5% for all dilutions and percent recovery of all five replicates was more than
95%.
Table 3.9 % recovery of five replicates of EPO-IRS.
Table 3.10 Back calculated concentration for five replicates of EPO-IRS:
Sample
mg/mL
Back calculated Conc. of EPO-IRS (diluted)
sample solution (mg/mL)
Average back
calc. conc. Of
EPO
(mg/mL)
%
RSD Inj. 1 Inj. 2 Inj. 3 Inj. 4 Inj. 5
0.02 0.0193 0.0193 0.0194 0.0194 0.0188 0.0192 1.32
0.04 0.0405 0.0405 0.0406 0.0405 0.0403 0.0405 0.28
0.1 0.1018 0.1023 0.1015 0.1014 0.0989 0.1012 1.32
Sample
mg/mL
Area of Principal Peak of
EPO-IRS (diluted) sample solution (µV*Sec) Avg
Area
µV*Sec
%
RSD
%
recovery Inj. 1 Inj. 2 Inj. 3 Inj. 4 Inj. 5
0.02 203085 203689 204137 204133 197869 202583 1.32 96.11
0.04 426584 426986 428143 427039 424861 426723 0.28 101.19
0.1 107354
2
107873
8
107036
7
106922
6 1042460
106686
7 1.32 101.18
Chapter 3
HPLC Method development and validation of protein based drugs
94
The % Recovery of all five replicates was more than 95% for all concentrations of
EPO-IRS studied. The % RSD between areas of the five replicate injection for each
concentration was not more than 2% while the % RSD for retention time of the five
replicate injections of each concentration was not more than 2 %.
From the above results and observations it is established that the developed method
has potential for the quantification of active substance in EPO-DP
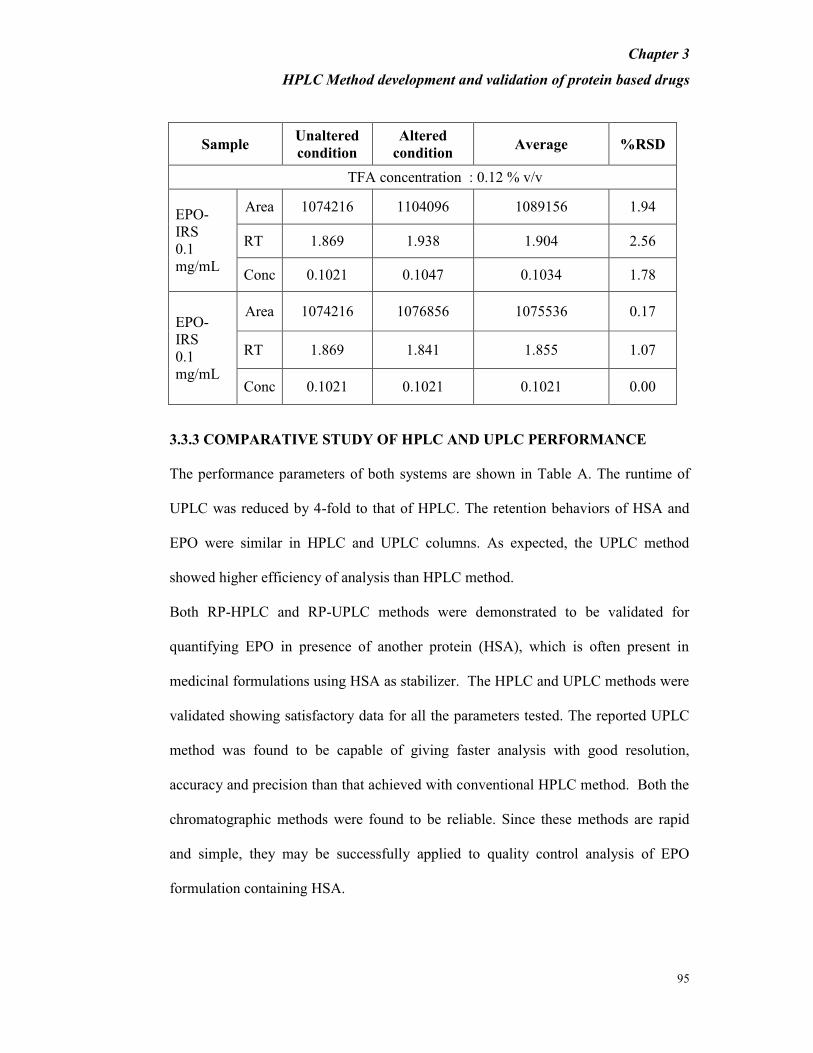
Robustness
To determine the robustness of the method, experimental condition (TFA
concentration) was purposefully altered and the resolution between EPO-IRS and
HSA was examined. The TFA concentration was changed between 0.08% and 0.12%
from the standard composition of 0.1% which was originally used and the results are
tabulated in Table 3.11
The percent recovery was found to be between 95% and 105%. The percent RSD for
the area values obtained with altered and unaltered conditions of the parameter was
found to be less than 2.5%, thus indicating that the developed method is robust and
TFA concentration is not a critical parameter.
Table 3.11 Result of % RSD between the altered and unaltered condition for area,
retention time and concentration.- Percentage TFA-0.08% and 0.12%, EPO-IRS-
0.1mg/mL, Injection volume-5μL, Number of injections-2
Chapter 3
HPLC Method development and validation of protein based drugs
95
Sample Unaltered
condition
Altered
condition Average %RSD
TFA concentration : 0.12 % v/v
EPO-
IRS
0.1
mg/mL
Area 1074216 1104096 1089156 1.94
RT 1.869 1.938 1.904 2.56
Conc 0.1021 0.1047 0.1034 1.78
EPO-
IRS
0.1
mg/mL
Area 1074216 1076856 1075536 0.17
RT 1.869 1.841 1.855 1.07
Conc 0.1021 0.1021 0.1021 0.00
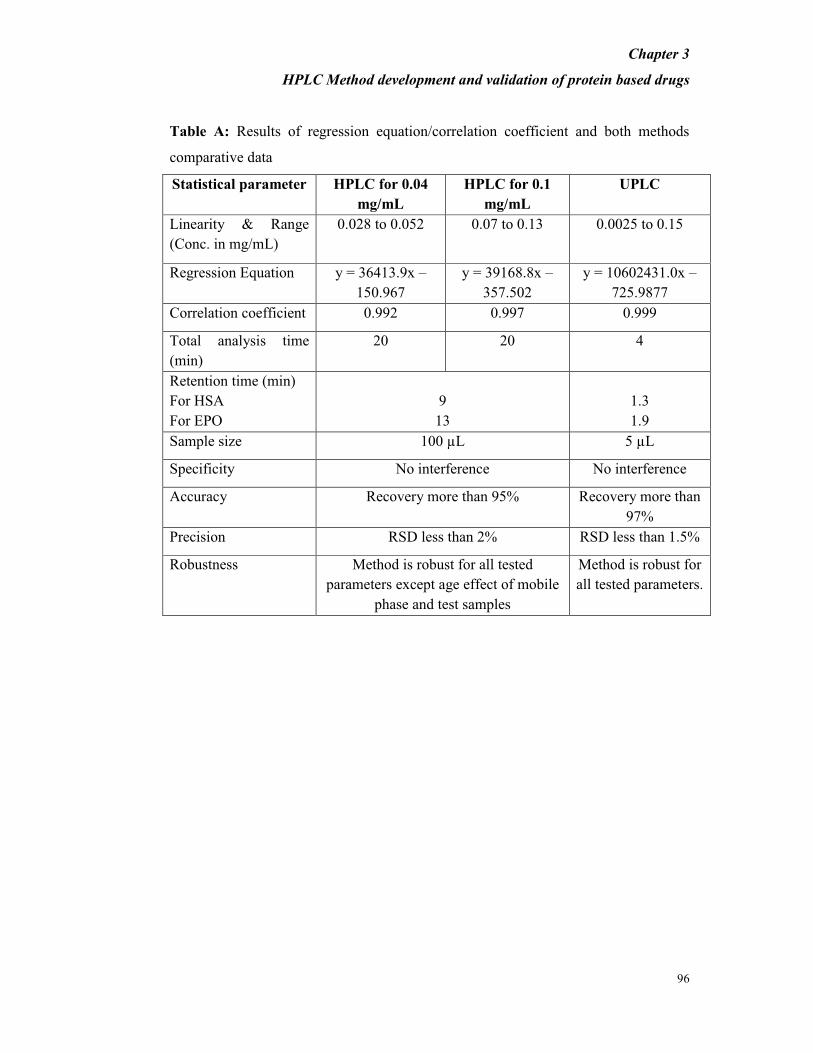
3.3.3 COMPARATIVE STUDY OF HPLC AND UPLC PERFORMANCE
The performance parameters of both systems are shown in Table A. The runtime of
UPLC was reduced by 4-fold to that of HPLC. The retention behaviors of HSA and
EPO were similar in HPLC and UPLC columns. As expected, the UPLC method
showed higher efficiency of analysis than HPLC method.
Both RP-HPLC and RP-UPLC methods were demonstrated to be validated for
quantifying EPO in presence of another protein (HSA), which is often present in
medicinal formulations using HSA as stabilizer. The HPLC and UPLC methods were
validated showing satisfactory data for all the parameters tested. The reported UPLC
method was found to be capable of giving faster analysis with good resolution,
accuracy and precision than that achieved with conventional HPLC method. Both the
chromatographic methods were found to be reliable. Since these methods are rapid
and simple, they may be successfully applied to quality control analysis of EPO
formulation containing HSA.
Chapter 3
HPLC Method development and validation of protein based drugs
96
Table A: Results of regression equation/correlation coefficient and both methods
comparative data
Statistical parameter HPLC for 0.04
mg/mL
HPLC for 0.1
mg/mL
UPLC
Linearity & Range
(Conc. in mg/mL)
0.028 to 0.052 0.07 to 0.13 0.0025 to 0.15
Regression Equation y = 36413.9x –
150.967
y = 39168.8x –
357.502
y = 10602431.0x –
725.9877
Correlation coefficient 0.992 0.997 0.999
Total analysis time
(min)
20 20 4
Retention time (min)
For HSA
For EPO
9
13
1.3
1.9
Sample size 100 µL 5 µL
Specificity No interference No interference
Accuracy Recovery more than 95% Recovery more than
97%
Precision RSD less than 2% RSD less than 1.5%
Robustness Method is robust for all tested
parameters except age effect of mobile
phase and test samples
Method is robust for
all tested parameters.
Chapter 3
HPLC Method development and validation of protein based drugs
97
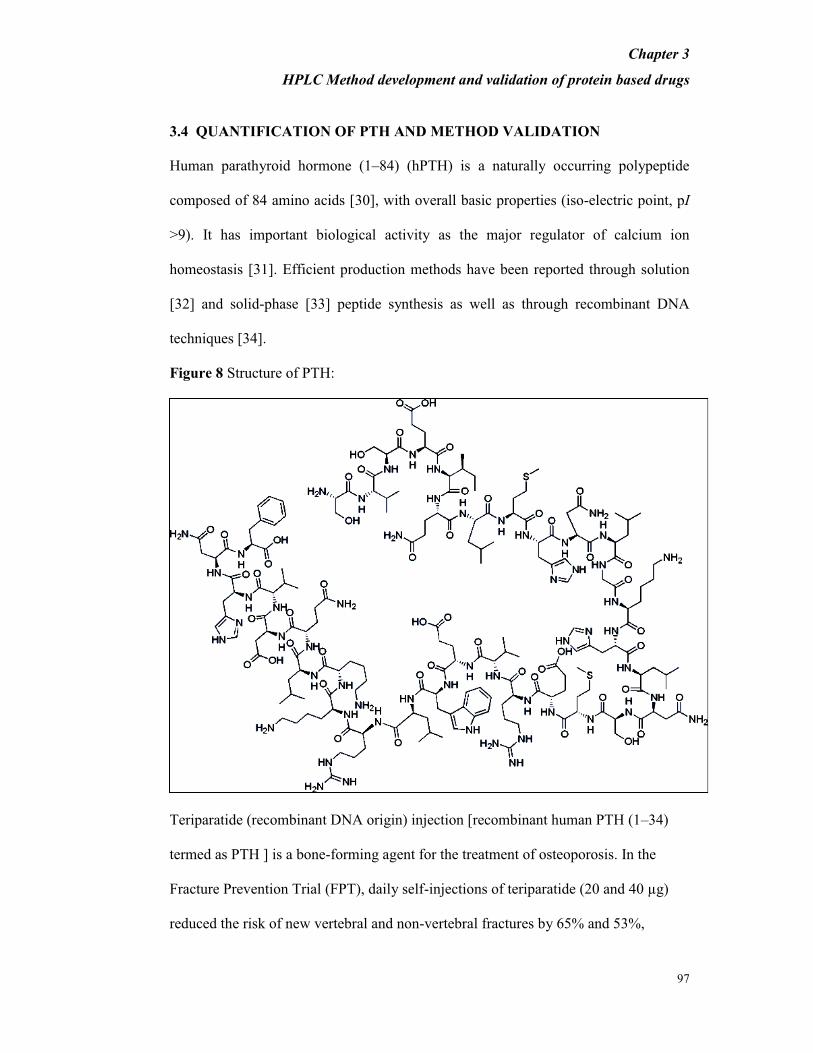
3.4 QUANTIFICATION OF PTH AND METHOD VALIDATION
Human parathyroid hormone (1–84) (hPTH) is a naturally occurring polypeptide
composed of 84 amino acids [30], with overall basic properties (iso-electric point, pI
>9). It has important biological activity as the major regulator of calcium ion
homeostasis [31]. Efficient production methods have been reported through solution
[32] and solid-phase [33] peptide synthesis as well as through recombinant DNA
techniques [34].
Figure 8 Structure of PTH:
Teriparatide (recombinant DNA origin) injection [recombinant human PTH (1–34)
termed as PTH ] is a bone-forming agent for the treatment of osteoporosis. In the
Fracture Prevention Trial (FPT), daily self-injections of teriparatide (20 and 40 µg)
reduced the risk of new vertebral and non-vertebral fractures by 65% and 53%,
Chapter 3
HPLC Method development and validation of protein based drugs
98
respectively, in postmenopausal women with advanced osteoporosis [35]. Once-daily
injection of PTH induced pronounced increase in biochemical markers of bone
turnover [36-41].
Immunoassay is a common technique for measurement of PTH in plasma. The
measurement of PTH and its metabolites has been problematic due to the diversity of
the circulating PTH metabolites, differences in the pharmacokinetic profiles of PTH
and its metabolites and significant differences in specificity and sensitivity of PTH
radioimmunoassay [42-44].
WHO International collaborative study of the proposed 1st international standard for
recombinant human PTH (1-84) was done by RP-HPLC method in different
laboratories [45]. Liquid chromatographic studies on separation of ten PTH amino
acids were carried out using normal phase untreated silica gel plate, C-18 RP
precoated plates and RP-HPLC by R. Bhushan et al. [46]. Separation,
characterization and biological activity of PTH oxidized at methionine8 and
methionine 18* was studied by A.L. Frelinger et al. [47]. PTH was oxidized with
hydrogen peroxide and the biological activity of oxidation products was studied by
Nabuchi et al. [48]. Methionine oxidation in PTH was also studied by Y. Nabuchi et
al. by using RP-HPLC [49].
The PTH (1-34) formulation contains meta-cresol as antimicrobial preservative,
which may interfere with OD280 UV detector of HPLC for either PTH or m-cresol as
well as with colorimetric assays . An RP-HPLC/UPLC method which can specifically
measure the protein component of Active Pharmaceutical Ingredient (API) with
separation of meta-cresol from protein peaks; will be suitable for quantitation of the
active substance in the presence of meta-cresol. The objective was to develop
Chapter 3
HPLC Method development and validation of protein based drugs
99
methods, using RP-HPLC and UPLC techniques to enable quantification of PTH in
medicinal formulations containing meta-cresol as well as a method to quantify meta-
cresol.
PTH formulation (drug product ) contains 250 µg/mL of PTH(API), 3mg/mL meta-
cresol; 45.4mg/mL mannitol; 0.1mg/mL sodium acetate and 0.41mg/mL glacial acetic
acid in water for injection
Abbreviations used:
PTH – Parathyroid Hormone
PTH IRS – PTH (1-34) Internal Reference Standard
DS (API) – Drug Substance (Active Pharmaceutical Ingredient)
PTH-DS – PTH Drug Substance
DP – Drug Product
PTH-DP – PTH Drug Product
RMP – Reference Medicinal Product (Innovator Product – Forteo). It is drug product
rHu – Recombinant Human
EP – European Pharmacopoeia
3.4.1 EXPERIMENTAL
Materials, reagents and chemicals
HPLC grade acetonitrile and methanol were purchased from Merck, tri-fluoro-acetic
acid (TFA) was purchased from Sigma Aldrich. Ultra pure water was obtained using
Milli-Q® UF-Plus (Millipore) system; meta-cresol was obtained from J.T. Baxter/
Hedinger. Reference Medicinal Product (herewith termed as RMP) having a
concentration of 250 µg/mL and PTH-IRS obtained from Intas Biopharmaceuticals
were used for preparation of standards in all experiments. All other chemicals such
Chapter 3
HPLC Method development and validation of protein based drugs
100
as mannitol, sodium acetate and glacial acetic acid were of the highest purity
available.
Preparation of mobile phase, dilution buffer and standard
Mobile phase ‘A’ consisted of 0.1% (v/v) TFA in Milli Q water and mobile phase ‘B’
consisted of 0.1% (v/v) TFA in acetonitrile. Dilution buffer containing 3 mg/mL
meta-cresol; 45.4 mg/mL mannitol; 0.1 mg/mL sodium acetate and 0.41 mg/mL
glacial acetic acid in “Milli Q water” was prepared and used so as to have a matrix
similar to PTH formulation. Diluted PTH-IRS was prepared by using 400 µg/mL of
PTH IRS using mobile phase A. Oxidized form of PTH was prepared by adding 4.0
µL of diluted 0.25 % H2O2 to 62.6 µL of PTH IRS (0.4 mg/mL) and mixing well. The
solution was incubated for 40 minutes at room temperature and then quenched with
37.4 µL of 50 mg/mL methionine [50]. All dilutions were made using calibrated
digital micro-pipettes.
Chromatographic condition
Agilent LC system (1100 and 1200 series) equipped with an injection valve
(quaternary), 210 UV detector and Chemstation software was used for HPLC method.
A reversed-phase C18 column (2.1mm ID × 100mm L, porosity 300ºA, particle size
3µm) with guard column (reversed-phase C18 column of 2.1mm ID × 12.5mm L,
porosity 300ºA, particle size 5µm) was used for separation. To get the optimum
results, mobile phase with a flow rate of 0.3mL/min was used and column
temperature was maintained at 60oC. The gradient programme for mobile phase was
optimized using a timed gradient programme T(min)/mobile phase A (%): 0/80, 6/80,
26.1/45, 28/0, 31/0, 31.5/80, and 40/80.
Chapter 3
HPLC Method development and validation of protein based drugs
101
Waters LC system (ACQUITY) equipped with an injection valve (binary), 215UV
detector and Empower software was used for RP-UPLC method. Reversed-phase C8
column (2.1mm ID × 12.5mm L, porosity 300ºA, particle size 5µm) was used for
separation. To get the optimum results, mobile phase flow rate was kept constant at
0.4mL/min, column temperature at 60oC. The gradient programme for mobile phase
was optimized using a timed gradient programme T(min)/mobile phase A (%): 0/80,
1.2/80, 4.8/0, 5/80, and 6/80.
3.4.2 RESULTS AND DISCUSSION
3.4.2.1. RP-HPLC Method
3.4.2.1.1. Method development
Initially, the gradient HPLC conditions were optimized for determination of PTH IRS
in presence of meta-cresol. The chromatographic separation was achieved by
applying chromatographic conditions described in Section 3.5.1
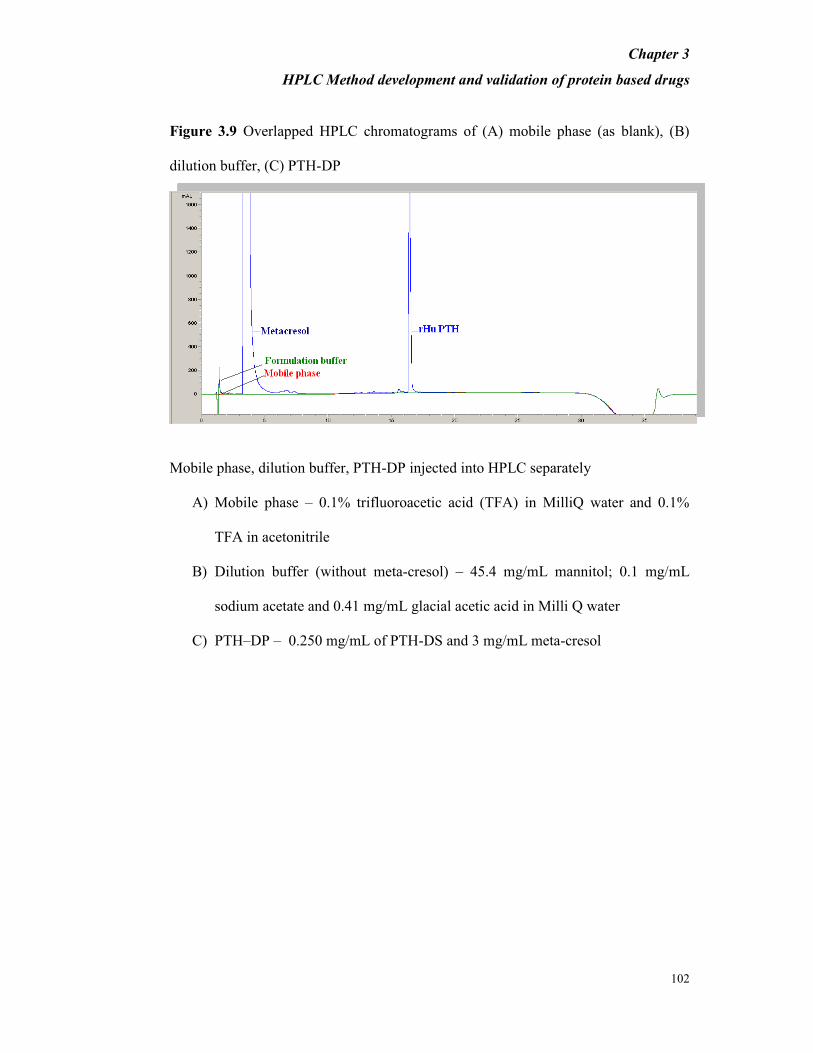
The applied chromatographic conditions permitted a good separation of meta-cresol
and PTH at different concentrations of PTH. No interference of other excipients or
oxidized impurities was observed as shown in Figure 3.9 and Figure 3.10.
Chapter 3
HPLC Method development and validation of protein based drugs
102
Figure 3.9 Overlapped HPLC chromatograms of (A) mobile phase (as blank), (B)
dilution buffer, (C) PTH-DP
Mobile phase, dilution buffer, PTH-DP injected into HPLC separately
A) Mobile phase – 0.1% trifluoroacetic acid (TFA) in MilliQ water and 0.1%
TFA in acetonitrile
B) Dilution buffer (without meta-cresol) – 45.4 mg/mL mannitol; 0.1 mg/mL
sodium acetate and 0.41 mg/mL glacial acetic acid in Milli Q water
C) PTH–DP – 0.250 mg/mL of PTH-DS and 3 mg/mL meta-cresol
Chapter 3
HPLC Method development and validation of protein based drugs
103
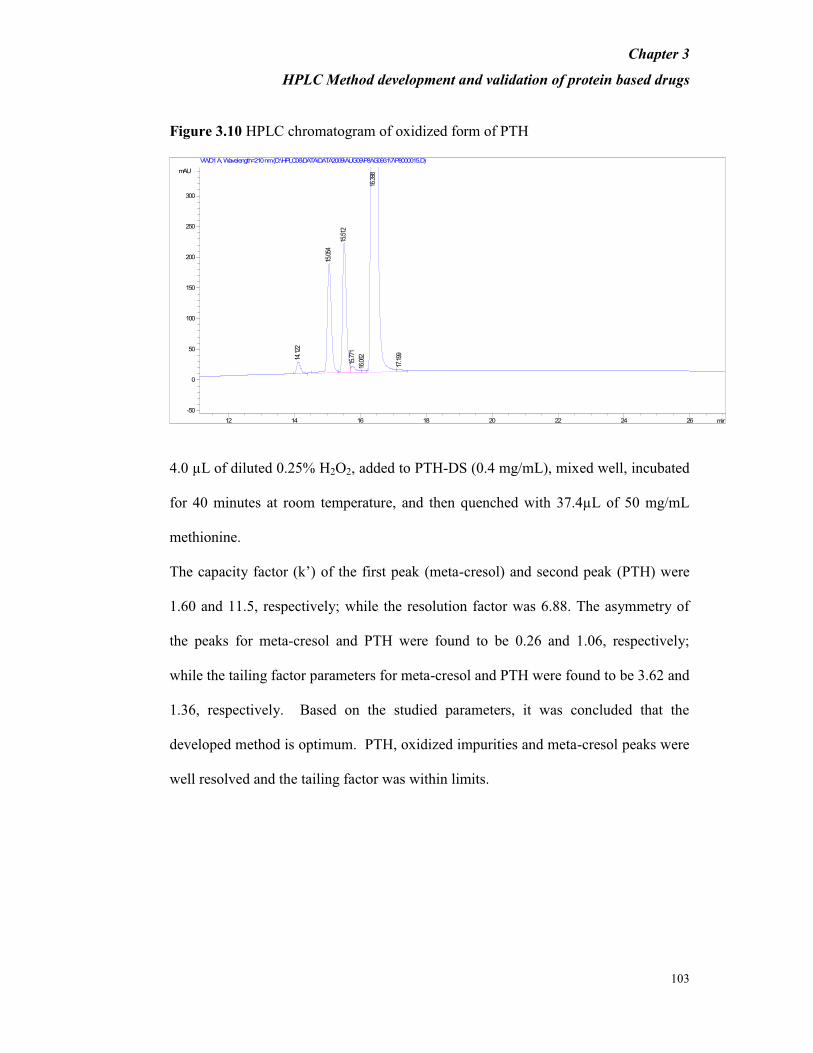
Figure 3.10 HPLC chromatogram of oxidized form of PTH
min12 14 16 18 20 22 24 26
mAU
-50
0
50
100
150
200
250
300
VWD1 A, Wavelength=210 nm (D:\HPLC06\DATA\DATA2009\AUG09\P8AG0931\7\P8000015.D)
14.
122
15.
054
15.
512
15.
771
16.
062
16.
398
17.
199
4.0 µL of diluted 0.25% H2O2, added to PTH-DS (0.4 mg/mL), mixed well, incubated
for 40 minutes at room temperature, and then quenched with 37.4µL of 50 mg/mL
methionine.
The capacity factor (k’) of the first peak (meta-cresol) and second peak (PTH) were
1.60 and 11.5, respectively; while the resolution factor was 6.88. The asymmetry of
the peaks for meta-cresol and PTH were found to be 0.26 and 1.06, respectively;
while the tailing factor parameters for meta-cresol and PTH were found to be 3.62 and
1.36, respectively. Based on the studied parameters, it was concluded that the
developed method is optimum. PTH, oxidized impurities and meta-cresol peaks were
well resolved and the tailing factor was within limits.
Chapter 3
HPLC Method development and validation of protein based drugs
104
3.4.2.1.2. Method validation
System suitability
To verify the interference and resolution, PTH-DP, diluted PTH-DP and oxidized
PTH-DS were injected into HPLC as mentioned below and the observations are
tabulated in Tables 3.13 and 3.14:
Reference solution-1: Innovator product (commercial available in market) Forteo
(RMP)(labeled concentration is 0.25 mg/mL) has been used as reference solution 1.
Reference solution-2: Reference solution -1 was diluted to get 0.005 mg/mL of PTH
in mobile phase A.
Reference solution-3: PTH-IRS (0.4 mg/mL) was used as the stock solution for
preparation of reference solution 3 (Oxidized solution). For preparing 0.25% H2O2,
the commercially available 50% H2O2 was diluted 200 times. 5 µL of H2O2 was added
to 995µL of MilliQ water and mixed well. 4µL of the diluted H2O2 solution was
added to 62.6 µL of PTH-IRS (0.4 mg/mL) and mixed well. The solution was
incubated for 40 minutes at room temperature and then quenched with 37.4µL of 50
mg/mL methionine. Thus the PTH-IRS gets diluted ~1.6 times and the final
concentration of the sample is 0.25 mg/mL
Maximum variation of retention time between principal peak of reference solution 1
and 2 was found to be 0.1 minute (retention time is about 16.3 min.). The %
recovery of the reference solution 2 when compared to 2% of the total area obtained
with reference solution 1 was found to be 92.3%. The % RSD of the 2% solutions
(reference solution 2) ( for three replicate measurements ) is 1.9%. The resolution
between the principal peak and oxidized peak nearest to the principal peak is 3.9. The
variation in retention time of principal peak of the standard reference solutions 1 and

Chapter 3
HPLC Method development and validation of protein based drugs
105
2 is 0.1 minute. The % RSD for the total areas of the standard (Reference solution
1),for three measurements is 0.2%. The %RSD for the total areas of the of the
standard (Reference solution 2) for two measurements is 1.9%. (Refer table 3.14)
Specificity
To evaluate possible interfering peaks, PTH-IRS (250µg/mL) in mobile phase (as
positive control); API; drug product (to verify the separation of interested protein
from other components) and oxidized PTH-DS; (to confirm the separation of oxidized
forms of protein from the interested protein) were injected into HPLC and no
interference was observed as shown in Figure3.10.
Retention time of Forteo (RMP) was found to match exactly with the PTH-IRS and
PTH-DP. Four very well resolved oxidized impurities were observed in the range of
11 to 20 minutes in the chromatogram of PTH-DS. There was no peak observed in the
chromatogram of blank (mobile phase) and dilution buffer without meta cresol. There
were 5 peaks observed in dilution buffer with meta cresol.
In the oxidised spike sample, peak of PTH was eluting after the main peak of Forteo
(RMP), and the resolution obtained was more than 1.0. The %RSD between average
purity percentage of 3µg, 4µg and 5 µg of 0.25 mg/mL PTH-IRS diluted in mobile
phase and dilution buffer without meta cresol was found to be 0.12 and 0.07%
respectively. The %RSD between average purity percentage of 3µg, 4µg and 5 µg of
0.25 mg/mL PTH-DP diluted in mobile phase and dilution buffer with meta-cresol
was found to be 0.17 and 0.08% respectively. The %RSD between total areas of
individual preparation of each amount of 3µg, 4µg and 5 µg of DS & DP diluted in
mobile phase and dilution buffer was found to be not more than 2%. The % RSD
between average purity percentage of 3µg, 4µg & 5 µg of PTH-DP diluted in mobile
Chapter 3
HPLC Method development and validation of protein based drugs
106
phase and dilution buffer with metacresol was found to be 0.02%, 0.03% & 0.24%
respectively.
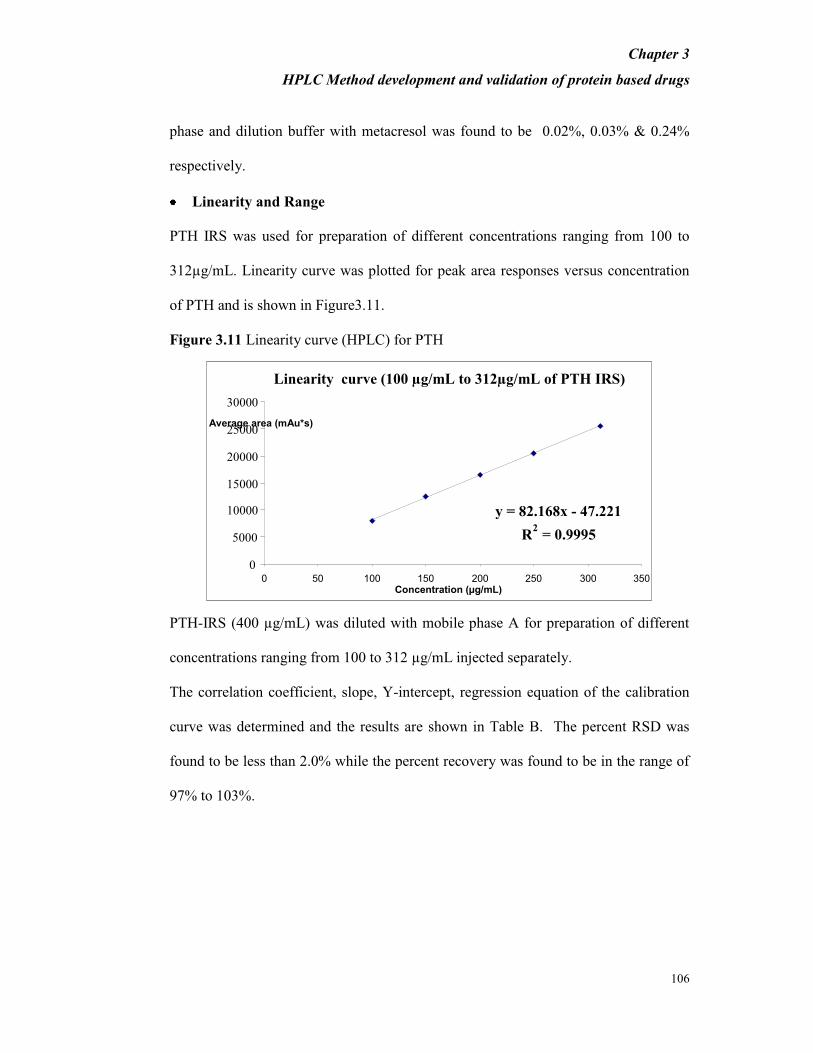
Linearity and Range
PTH IRS was used for preparation of different concentrations ranging from 100 to
312µg/mL. Linearity curve was plotted for peak area responses versus concentration
of PTH and is shown in Figure3.11.
Figure 3.11 Linearity curve (HPLC) for PTH
PTH-IRS (400 µg/mL) was diluted with mobile phase A for preparation of different
concentrations ranging from 100 to 312 µg/mL injected separately.
The correlation coefficient, slope, Y-intercept, regression equation of the calibration
curve was determined and the results are shown in Table B. The percent RSD was
found to be less than 2.0% while the percent recovery was found to be in the range of
97% to 103%.
Linearity curve (100 µg/mL to 312µg/mL of PTH IRS)
y = 82.168x - 47.221
R 2 = 0.9995
0
5000
10000
15000
20000
25000
30000
0 50 100 150 200 250 300 350 Concentration (µg/mL)
Average area (mAu*s)
Chapter 3
HPLC Method development and validation of protein based drugs
107
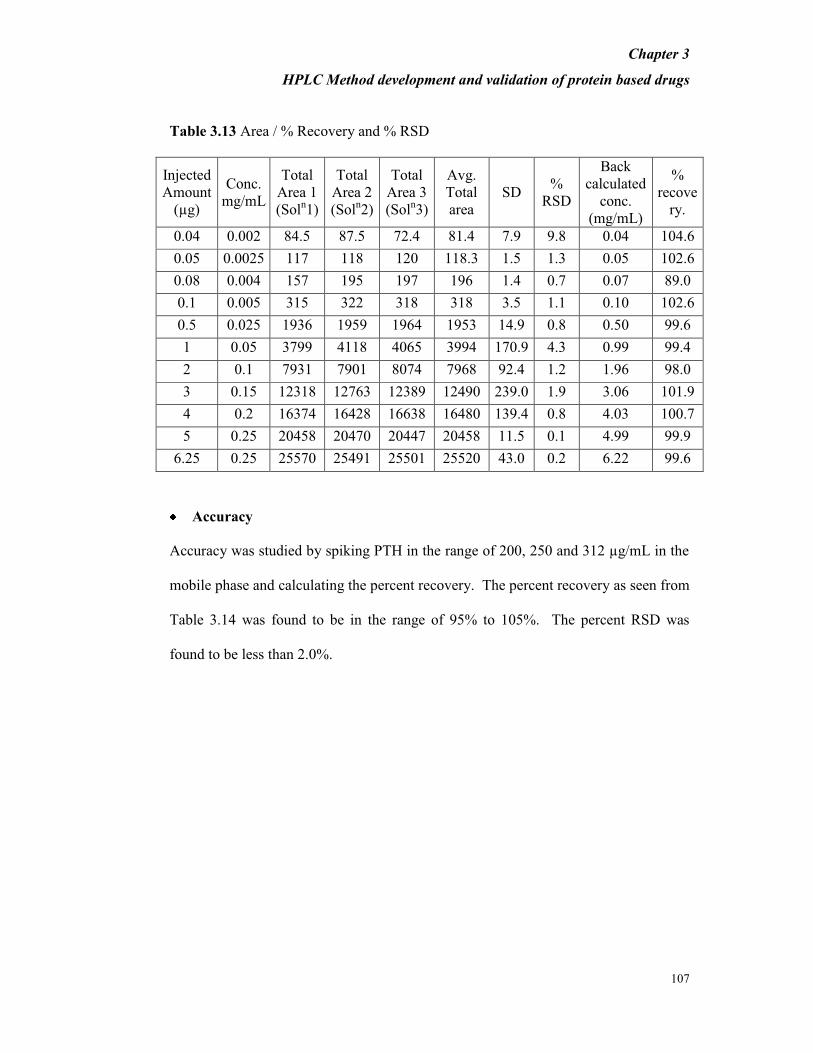
Table 3.13 Area / % Recovery and % RSD
Injected
Amount
(µg)
Conc.
mg/mL
Total
Area 1
(Soln1)
Total
Area 2
(Soln2)
Total
Area 3
(Soln3)
Avg.
Total
area
SD %
RSD
Back
calculated
conc.
(mg/mL)
%
recove
ry.
0.04 0.002 84.5 87.5 72.4 81.4 7.9 9.8 0.04 104.6
0.05 0.0025 117 118 120 118.3 1.5 1.3 0.05 102.6
0.08 0.004 157 195 197 196 1.4 0.7 0.07 89.0
0.1 0.005 315 322 318 318 3.5 1.1 0.10 102.6
0.5 0.025 1936 1959 1964 1953 14.9 0.8 0.50 99.6
1 0.05 3799 4118 4065 3994 170.9 4.3 0.99 99.4
2 0.1 7931 7901 8074 7968 92.4 1.2 1.96 98.0
3 0.15 12318 12763 12389 12490 239.0 1.9 3.06 101.9
4 0.2 16374 16428 16638 16480 139.4 0.8 4.03 100.7
5 0.25 20458 20470 20447 20458 11.5 0.1 4.99 99.9
6.25 0.25 25570 25491 25501 25520 43.0 0.2 6.22 99.6
Accuracy
Accuracy was studied by spiking PTH in the range of 200, 250 and 312 µg/mL in the
mobile phase and calculating the percent recovery. The percent recovery as seen from
Table 3.14 was found to be in the range of 95% to 105%. The percent RSD was
found to be less than 2.0%.

Chapter 3
HPLC Method development and validation of protein based drugs
108
Table 3.14 Area / % Recovery and % RSD
Conc. of
PTH
Amount
of
protein
injected
(µg)
Area of main peak (mAu)
Average %
RSD
Back
calculated
amount
(µg)
%
Recovery
from the
graph Inj.1 Inj.2 Inj.3
0.002
(0.8%) 0.04 84 76 76 79 5.75 0.05 116.5
0.0025
(1.0%) 0.05 92 93 91 92 0.66 0.05 99.3
0.004
(1.6%) 0.08 169 160 172 167 3.80 0.07 83.5
0.2
(80%) 4 15377 15384 15404 15388 0.09 4.14 103.4
0.25
(100%) 5 18845 18883 18880 18869 0.11 5.12 102.4
0.25
(125%) 6.25 22727 22783 22825 22778 0.22 6.23 99.7
Precision
Precision was evaluated for intra-day (Repeatability) and inter-day (Intermediate
precision) variation, and for different columns. Intra-day study was determined by
using six independent preparations of the PTH-DS (250 µg/mL) and PTH-DP (250
µg/mL) as shown in Table 3.15. The percent RSD of main peak area was found to be
less than 0.5%. Inter-day precision was determined by performing five different
conditions along with five replicates for each condition which is equivalent to n = 25
(5 × 5) as shown in Table 3.17. The percent RSD of the main peak area was found to
be less than 0.5% within each set and less than 2.0% between different sets. The
percent recovery was found to be between 95.0% - 105.0 % and the maximum
variation between sets was found to be less than 5.0%.
Chapter 3
HPLC Method development and validation of protein based drugs
109
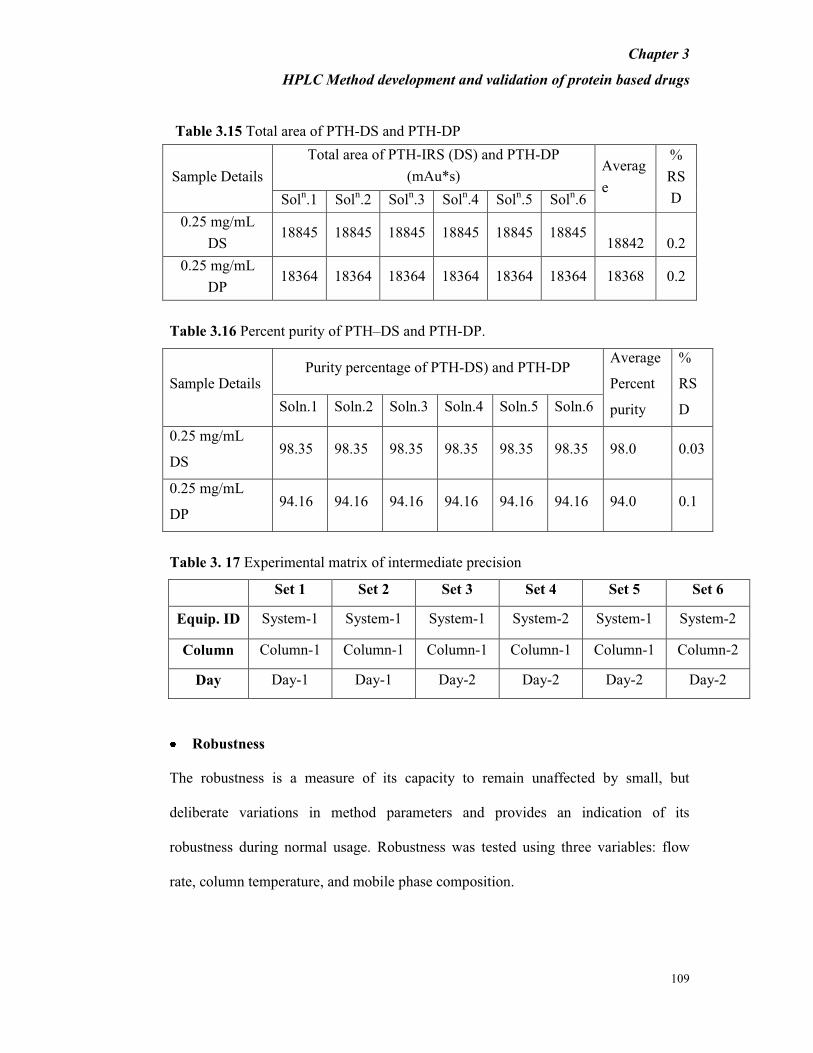
Table 3.15 Total area of PTH-DS and PTH-DP
Sample Details
Total area of PTH-IRS (DS) and PTH-DP
(mAu*s) Averag
e
%
RS
D Soln.1 Sol
n.2 Sol
n.3 Sol
n.4 Sol
n.5 Sol
n.6
0.25 mg/mL
DS 18845 18845 18845 18845 18845 18845
18842 0.2
0.25 mg/mL
DP 18364 18364 18364 18364 18364 18364 18368 0.2
Table 3.16 Percent purity of PTH–DS and PTH-DP.
Sample Details Purity percentage of PTH-DS) and PTH-DP
Average
Percent
purity
%
RS
D Soln.1 Soln.2 Soln.3 Soln.4 Soln.5 Soln.6
0.25 mg/mL
DS 98.35 98.35 98.35 98.35 98.35 98.35 98.0 0.03
0.25 mg/mL
DP 94.16 94.16 94.16 94.16 94.16 94.16 94.0 0.1
Table 3. 17 Experimental matrix of intermediate precision
Set 1 Set 2 Set 3 Set 4 Set 5 Set 6
Equip. ID System-1 System-1 System-1 System-2 System-1 System-2
Column Column-1 Column-1 Column-1 Column-1 Column-1 Column-2
Day Day-1 Day-1 Day-2 Day-2 Day-2 Day-2
Robustness
The robustness is a measure of its capacity to remain unaffected by small, but
deliberate variations in method parameters and provides an indication of its
robustness during normal usage. Robustness was tested using three variables: flow
rate, column temperature, and mobile phase composition.
Chapter 3
HPLC Method development and validation of protein based drugs
110
Flow rate
Experiments were conducted using system suitability samples of concentrations
0.005 and 0.25 mg/mL prepared from Forteo (RMP), with flow rate variation of +10%
from the set flow rate (0.3 mL/min). The percent RSD was found to be less than 2%,
with no variation and +0.1 minute difference in retention time but during lower flow
rate, higher percentage recovery (~ 111%) was obtained as compared to higher flow
rate, we found lower percentage of recovery (~ 93%). Based on recovery, it was
concluded that flow rate is critical parameter.
Column temperature effect
Experiments were conducted using the same system suitability samples (as used in
flow rate studies) with column temperature variation of +5ºC from the set temperature
(60ºC). The percent RSD was found to be less than 2%, with no variation and +0.1
minute difference in retention time. The percent recovery was found to be within
acceptable limits (95%-105%) and hence column temperature was not considered to
be critical parameter.
Mobile phase composition
Experiments were conducted using system suitability samples( same as used in flow
rate) with mobile phase composition variation of + 20% from the set percentage of
TFA (0.1%). Results for triplicate injections (% variation) between unaltered / initial
condition and altered condition for PTH sample were found to vary less than 2.0%
without variation in retention time and hence mobile phase composition was not
considered to be critical parameter.
Chapter 3
HPLC Method development and validation of protein based drugs
111
3.4.2.2. UPLC method
3.4.2.2.1. Method development
The basic chromatographic conditions like stationary phase, solvents and UV
detector, employed in HPLC were taken into account while developing new UPLC
method. The stationary phase C8 was chosen in order to have similar polarity to that
used in the method developed for HPLC. The injection volume was scaled down by
about 5 fold as used in HPLC. To get the optimum results, mobile phase flow rate was
kept constant at 0.4 mL/min and column temperature was maintained at 60oC. The
chromatographic separation was achieved as described in Section 3.5.1
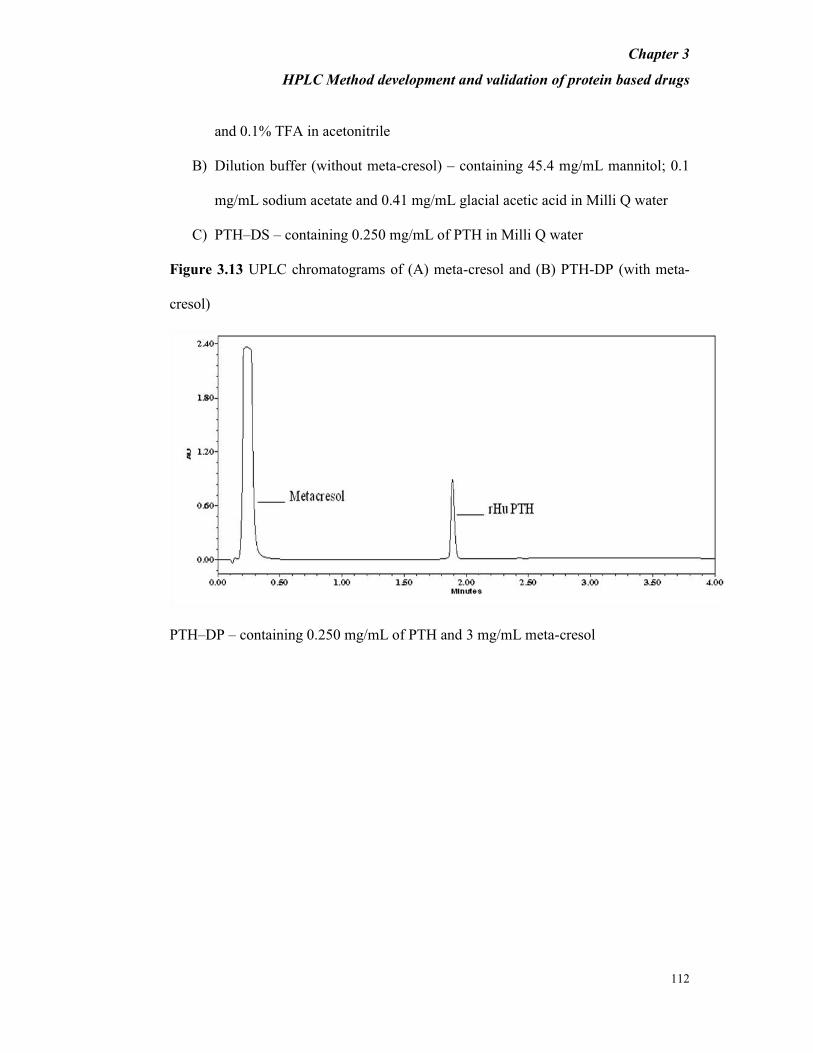
The applied chromatographic conditions permitted a good separation of meta-cresol
and PTH at different concentrations of PTH. No interference of other excipients or
other oxidized impurities was observed during the analysis and are shown in Figure
3.12-3.14.
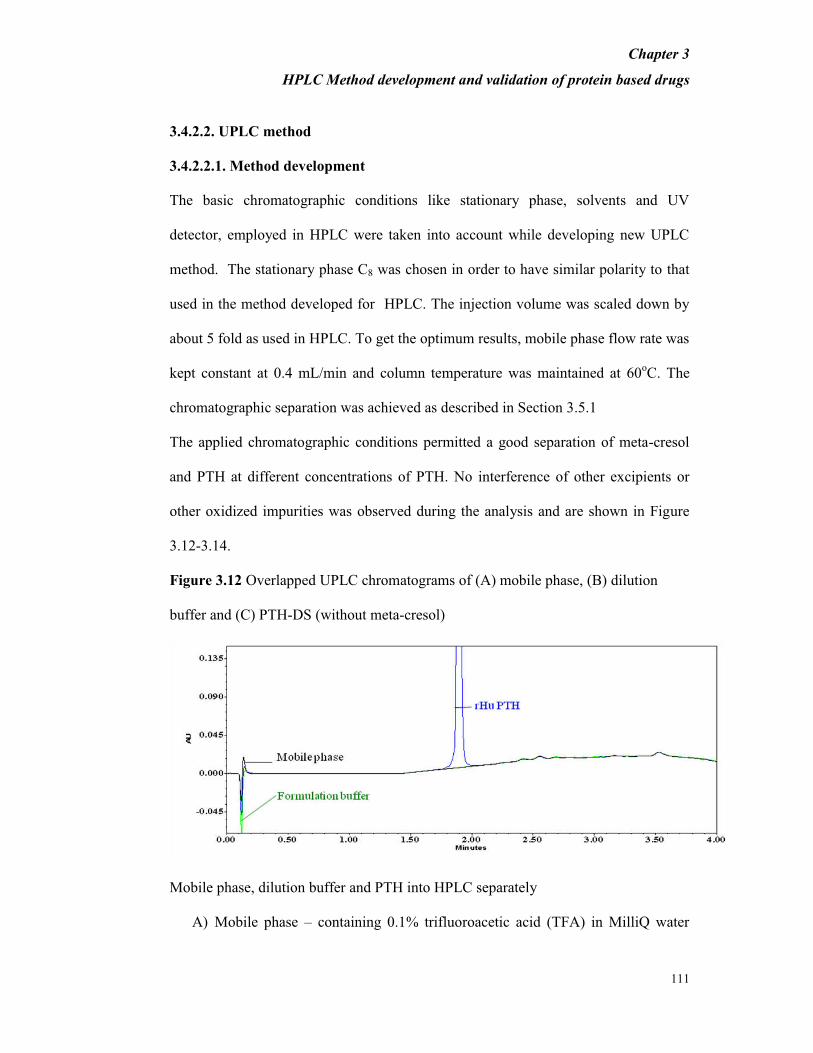
Figure 3.12 Overlapped UPLC chromatograms of (A) mobile phase, (B) dilution
buffer and (C) PTH-DS (without meta-cresol)
Mobile phase, dilution buffer and PTH into HPLC separately
A) Mobile phase – containing 0.1% trifluoroacetic acid (TFA) in MilliQ water
Chapter 3
HPLC Method development and validation of protein based drugs
112
and 0.1% TFA in acetonitrile
B) Dilution buffer (without meta-cresol) – containing 45.4 mg/mL mannitol; 0.1
mg/mL sodium acetate and 0.41 mg/mL glacial acetic acid in Milli Q water
C) PTH–DS – containing 0.250 mg/mL of PTH in Milli Q water
Figure 3.13 UPLC chromatograms of (A) meta-cresol and (B) PTH-DP (with meta-
cresol)
PTH–DP – containing 0.250 mg/mL of PTH and 3 mg/mL meta-cresol

Chapter 3
HPLC Method development and validation of protein based drugs
113
Figure 3.14 UPLC chromatogram of oxidized form of PTH
4.0 µL of diluted 0.25% H2O2, added to PTH-IRS (0.4 mg/mL), mixed well,
incubated for 40 minutes at room temperature, and then quenched with 37.4µL of 50
mg/mL methionine
The capacity factor (k’) of the main peak (PTH) was 11.60; while tailing factor was
found to be 1.24. It can be thus concluded that PTH, oxidized forms of PTH and
meta-cresol peaks were well resolved in the developed method and the tailing factor
was within limits.
3.4.2.2.2. Method Validation
System suitability
Two types of system suitability were evaluated by analyzing PTH-IRS for the
respective parameters through-out the validation study.
System suitability A – The RSD between the areas of the first three injections should
not be more than 1 % while RSD between the areas of peak in five injections should
not be more than 1 %.
Chapter 3
HPLC Method development and validation of protein based drugs
114
System suitability B – The RSD between the areas of the first three injections should
not be more than 1 %. The back calculated concentration based on average area of
first three injections as well as last two injections of the standard sample should not
show variation more than 5% of the pre-determined concentration (150µg /mL) as in
the calibration curve.
System suitability A was evaluated with linearity and range and B was evaluated with
other validation parameters.
Specificity
To evaluate possible interfering peaks, diluted PTH-IRS (150µg/mL) in mobile phase
(as positive control); API; PTH-DP (to verify the separation of interested protein from
other components) and oxidized API; oxidized PTH-DP (to confirm the separation of
oxidized forms of protein from the interested protein) were injected into UPLC and no
interference was observed as seen from Figure 3.14. From Table 3.18 it is evident
that the percent variation in peak areas of PTH-DS and oxidized PTH-DS was found
to be less than 2%.

Chapter 3
HPLC Method development and validation of protein based drugs
115
Table 3.18 – Area / % variation
Sample Name
Average total area
of main peak
(mAu*S)
Conc. of PTH
(µg / mL)
%
Variation
PTH-DS 1681222 145.5 1.5
Oxidized PTH-DS 1654234 143.3
PTH-DP 1686672 146.0 1.6
Oxidized PTH-DP 1659430 143.7
Linearity and Range
PTH RS and samples were chromatographed using the set chromatographic
conditions. Linearity curve was plotted using 50 to 300 µg/mL of PTH and is shown
in Figure 3.15.
Figure 3.15: Linearity curve (UPLC) for PTH:
PTH-IRS (400 µg/mL) was diluted with mobile phase ‘A’ for preparation of different
concentrations ranging from 50 to 300 µg/mL, injected separately.
The linearity of peak area responses versus concentration for PTH was studied and
correlation coefficient, slopes and Y-intercepts and regression equation were
Chapter 3
HPLC Method development and validation of protein based drugs
116
determined and the results are shown in Table B. The correlation coefficient was
found to be 0.999. It is also observed from Table 3.19 that the percent RSD was
found to be less than 2.0% while the percent recovery was found to be in the range of
98% to 105%.
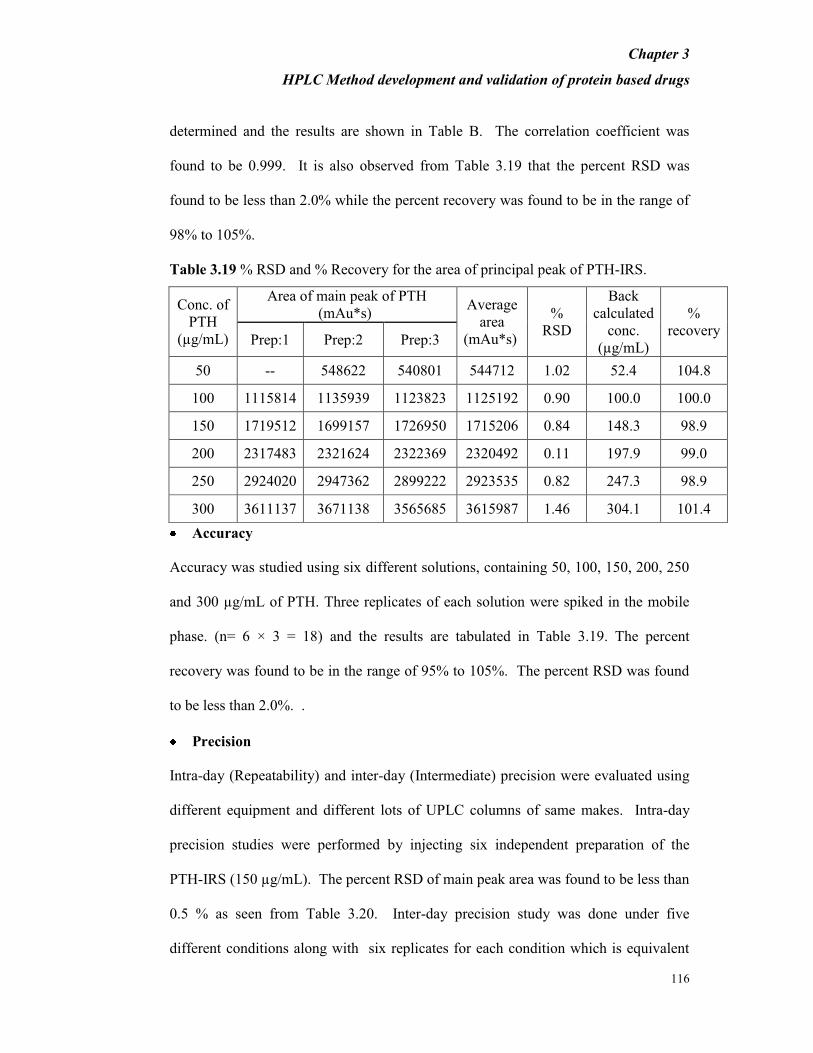
Table 3.19 % RSD and % Recovery for the area of principal peak of PTH-IRS.
Conc. of
PTH
(µg/mL)
Area of main peak of PTH
(mAu*s) Average
area
(mAu*s)
%
RSD
Back
calculated
conc.
(µg/mL)
%
recovery Prep:1 Prep:2 Prep:3
50 -- 548622 540801 544712 1.02 52.4 104.8
100 1115814 1135939 1123823 1125192 0.90 100.0 100.0
150 1719512 1699157 1726950 1715206 0.84 148.3 98.9
200 2317483 2321624 2322369 2320492 0.11 197.9 99.0
250 2924020 2947362 2899222 2923535 0.82 247.3 98.9
300 3611137 3671138 3565685 3615987 1.46 304.1 101.4
Accuracy
Accuracy was studied using six different solutions, containing 50, 100, 150, 200, 250
and 300 µg/mL of PTH. Three replicates of each solution were spiked in the mobile
phase. (n= 6 × 3 = 18) and the results are tabulated in Table 3.19. The percent
recovery was found to be in the range of 95% to 105%. The percent RSD was found
to be less than 2.0%. .
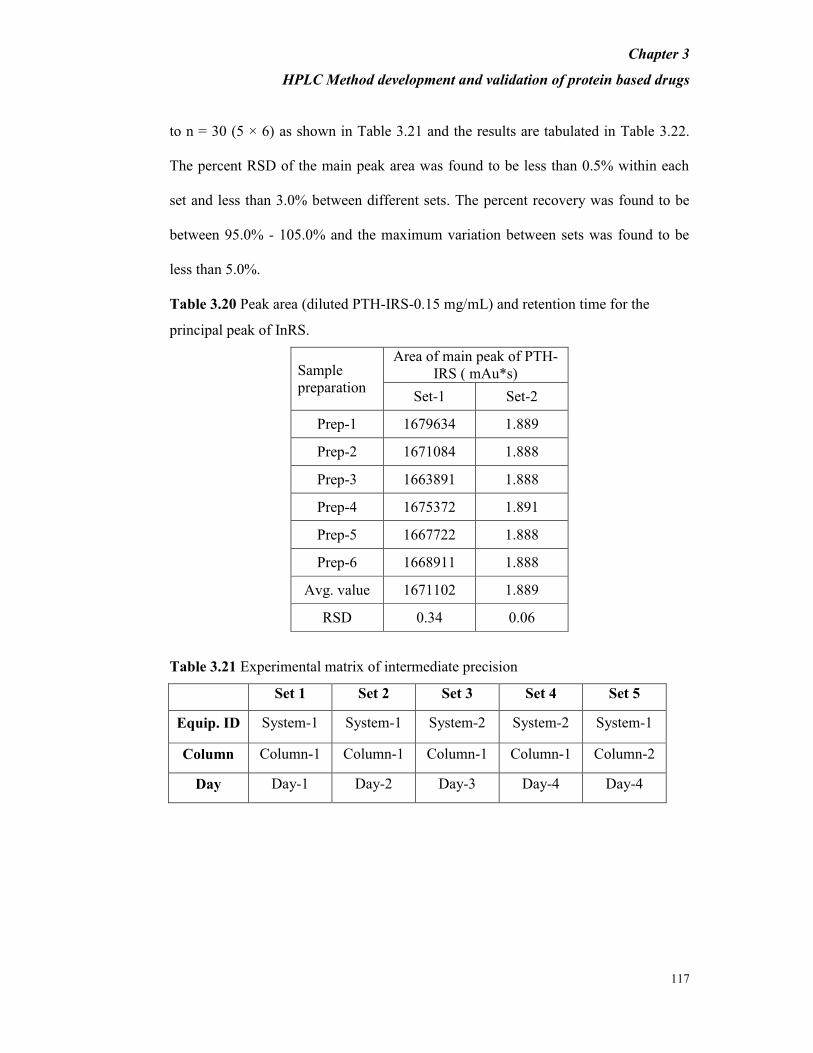
Precision
Intra-day (Repeatability) and inter-day (Intermediate) precision were evaluated using
different equipment and different lots of UPLC columns of same makes. Intra-day
precision studies were performed by injecting six independent preparation of the
PTH-IRS (150 µg/mL). The percent RSD of main peak area was found to be less than
0.5 % as seen from Table 3.20. Inter-day precision study was done under five
different conditions along with six replicates for each condition which is equivalent
Chapter 3
HPLC Method development and validation of protein based drugs
117
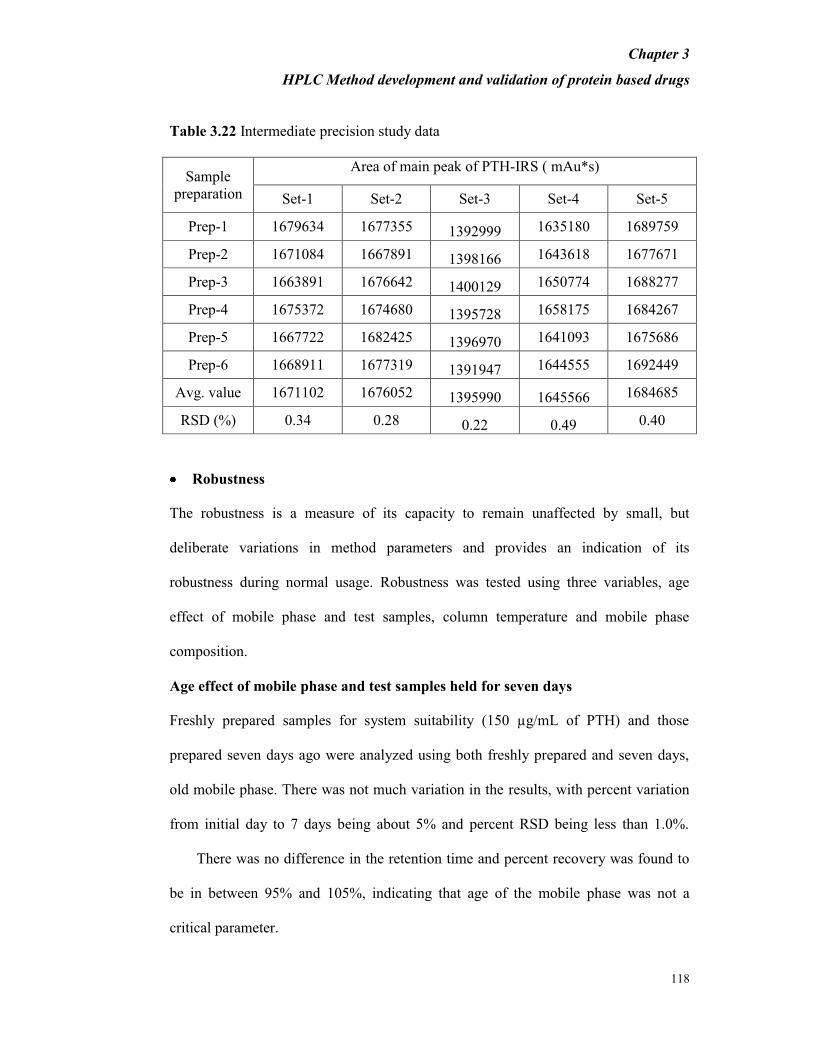
to n = 30 (5 × 6) as shown in Table 3.21 and the results are tabulated in Table 3.22.
The percent RSD of the main peak area was found to be less than 0.5% within each
set and less than 3.0% between different sets. The percent recovery was found to be
between 95.0% - 105.0% and the maximum variation between sets was found to be
less than 5.0%.
Table 3.20 Peak area (diluted PTH-IRS-0.15 mg/mL) and retention time for the
principal peak of InRS.
Sample
preparation
Area of main peak of PTH-
IRS ( mAu*s)
Set-1 Set-2
Prep-1 1679634 1.889
Prep-2 1671084 1.888
Prep-3 1663891 1.888
Prep-4 1675372 1.891
Prep-5 1667722 1.888
Prep-6 1668911 1.888
Avg. value 1671102 1.889
RSD 0.34 0.06
Table 3.21 Experimental matrix of intermediate precision
Set 1 Set 2 Set 3 Set 4 Set 5
Equip. ID System-1 System-1 System-2 System-2 System-1
Column Column-1 Column-1 Column-1 Column-1 Column-2
Day Day-1 Day-2 Day-3 Day-4 Day-4
Chapter 3
HPLC Method development and validation of protein based drugs
118
Table 3.22 Intermediate precision study data
Sample
preparation
Area of main peak of PTH-IRS ( mAu*s)
Set-1 Set-2 Set-3 Set-4 Set-5
Prep-1 1679634 1677355 1392999 1635180 1689759
Prep-2 1671084 1667891 1398166 1643618 1677671
Prep-3 1663891 1676642 1400129 1650774 1688277
Prep-4 1675372 1674680 1395728 1658175 1684267
Prep-5 1667722 1682425 1396970 1641093 1675686
Prep-6 1668911 1677319 1391947 1644555 1692449
Avg. value 1671102 1676052 1395990 1645566 1684685
RSD (%) 0.34 0.28 0.22 0.49 0.40
Robustness
The robustness is a measure of its capacity to remain unaffected by small, but
deliberate variations in method parameters and provides an indication of its
robustness during normal usage. Robustness was tested using three variables, age
effect of mobile phase and test samples, column temperature and mobile phase
composition.
Age effect of mobile phase and test samples held for seven days
Freshly prepared samples for system suitability (150 µg/mL of PTH) and those
prepared seven days ago were analyzed using both freshly prepared and seven days,
old mobile phase. There was not much variation in the results, with percent variation
from initial day to 7 days being about 5% and percent RSD being less than 1.0%.
There was no difference in the retention time and percent recovery was found to
be in between 95% and 105%, indicating that age of the mobile phase was not a
critical parameter.
Chapter 3
HPLC Method development and validation of protein based drugs
119
Column temperature effect
Experiments were conducted using system suitability samples with column
temperature variation of + 5ºC from the set temperature (60ºC). The percent RSD was
found to be less than 2%, with variation of + 0.1 minute in the retention time. The
percent recovery was found to be within acceptable limits (95%–105%) suggesting
that the variation in the results was within acceptable limits for all the parameters
under study and indicating that column temperature was not a critical parameter.
Mobile phase composition
Experiments were conducted using system suitability samples with mobile phase
composition variation of + 20% from the set percentage of TFA (0.1%). Results for
triplicate injections (% variation) between initial condition and altered condition for
PTH sample were found to vary less than 2.0% and there was no variation observed in
the retention time, suggesting that the mobile phase composition was not a critical
parameter.
Chapter 3
HPLC Method development and validation of protein based drugs
120
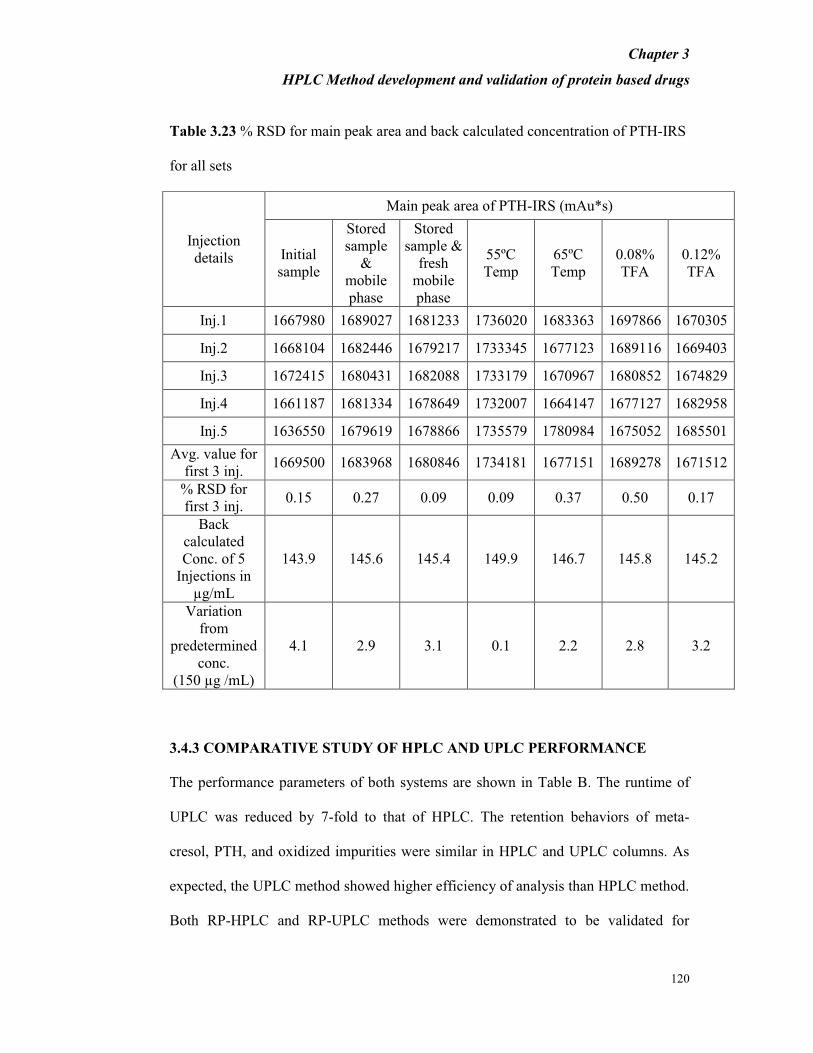
Table 3.23 % RSD for main peak area and back calculated concentration of PTH-IRS
for all sets
Injection
details
Main peak area of PTH-IRS (mAu*s)
Initial
sample
Stored
sample
&
mobile
phase
Stored
sample &
fresh
mobile
phase
55ºC
Temp
65ºC
Temp
0.08%
TFA
0.12%
TFA
Inj.1 1667980 1689027 1681233 1736020 1683363 1697866 1670305
Inj.2 1668104 1682446 1679217 1733345 1677123 1689116 1669403
Inj.3 1672415 1680431 1682088 1733179 1670967 1680852 1674829
Inj.4 1661187 1681334 1678649 1732007 1664147 1677127 1682958
Inj.5 1636550 1679619 1678866 1735579 1780984 1675052 1685501
Avg. value for
first 3 inj. 1669500 1683968 1680846 1734181 1677151 1689278 1671512
% RSD for
first 3 inj. 0.15 0.27 0.09 0.09 0.37 0.50 0.17
Back
calculated
Conc. of 5
Injections in
µg/mL
143.9 145.6 145.4 149.9 146.7 145.8 145.2
Variation
from
predetermined
conc.
(150 µg /mL)
4.1 2.9 3.1 0.1 2.2 2.8 3.2
3.4.3 COMPARATIVE STUDY OF HPLC AND UPLC PERFORMANCE
The performance parameters of both systems are shown in Table B. The runtime of
UPLC was reduced by 7-fold to that of HPLC. The retention behaviors of meta-
cresol, PTH, and oxidized impurities were similar in HPLC and UPLC columns. As
expected, the UPLC method showed higher efficiency of analysis than HPLC method.
Both RP-HPLC and RP-UPLC methods were demonstrated to be validated for
Chapter 3
HPLC Method development and validation of protein based drugs
121
quantifying PTH respectively in presence of other excipients and oxidized impurities
of PTH. The HPLC and UPLC methods were validated showing satisfactory data for
all the parameters tested. The UPLC method was found to be capable of giving faster
analysis with good resolution, accuracy and precision than that achieved with
conventional HPLC method. Both the chromatographic methods described here were
found to be reliable for quantifying PTH. Since these methods are rapid and simple,
they may be successfully applied to quality control analyses of finished (formulated)
product in presence of meta-cresol.
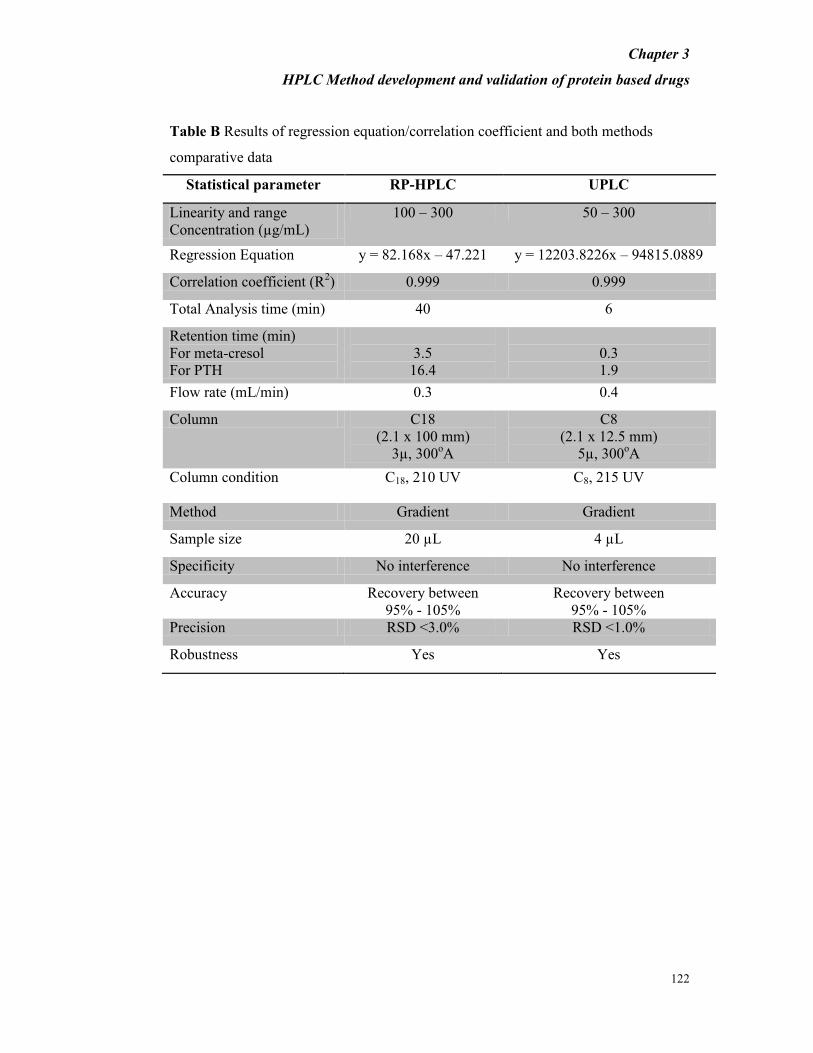
Chapter 3
HPLC Method development and validation of protein based drugs
122
Table B Results of regression equation/correlation coefficient and both methods
comparative data
Statistical parameter RP-HPLC UPLC
Linearity and range
Concentration (µg/mL)
100 – 300 50 – 300
Regression Equation y = 82.168x – 47.221 y = 12203.8226x – 94815.0889
Correlation coefficient (R2) 0.999 0.999
Total Analysis time (min) 40 6
Retention time (min)
For meta-cresol
For PTH
3.5
16.4
0.3
1.9
Flow rate (mL/min) 0.3 0.4
Column C18
(2.1 x 100 mm)
3µ, 300oA
C8
(2.1 x 12.5 mm)
5µ, 300oA
Column condition C18, 210 UV
C8, 215 UV
Method Gradient Gradient
Sample size 20 µL 4 µL
Specificity No interference No interference
Accuracy Recovery between
95% - 105%
Recovery between
95% - 105%
Precision RSD <3.0% RSD <1.0%
Robustness Yes Yes

Chapter 3
HPLC Method development and validation of protein based drugs
123
3.5 QUANTIFICATION OF META-CRESOL AND METHOD VALIDATION
Introduction
Meta-cresol is widely used as bactericide in the biotechnological processing of
pharmaceuticals; preservative in pharmaceutical formulations (injection solutions of
insulin, somatropin, parathyroid hormone); pesticide for the treatment of the stems of
fruit trees and plants. Exposure of humans is possible through the use of m-cresol as
a preservative in pharmaceutical injection solutions.
Meta-cresol, para-cresol and m/p-cresol mixtures are absorbed across the respiratory
and gastrointestinal tracts and through the skin, and are distributed throughout the
body. The primary metabolic pathway for all cresol isomers is conjugation with
glucuronic acid and inorganic sulfates. All isomers are mainly eliminated by renal
excretion in form of above-mentioned conjugates. The oral LD50 of undiluted m-
cresol in rats was 242 mg/kg bw. Clinical signs include hypoactivity, salivation,
tremors, and convulsions. Neither mortality nor clinical signs of toxicity were seen
following exposure to saturated vapour concentration of either m-cresol or p-cresol.
Inhalation of aerosols may however cause death, and mean lethal concentrations in
rats were reported to be 29 mg/m³ for p-cresol and 58 mg/m³ for m-cresol [51].
Reaction to meta-cresol in commercial preparations of insulin to humans was reported
by Dennis et al.[52].
The analysis of cresol- like chemicals in use for a long period of time has evolved
from a number of nonspecific colorimetric methods to more selective separation
techniques using gas chromatography (GC) or high performance liquid
chromatography (HPLC) [53-55].

Chapter 3
HPLC Method development and validation of protein based drugs
124
The objective was hence to develop a rapid and simple RP-HPLC method with UV
detection, useful for routine quality control of m-cresol in parathyroid hormone
formulations (PTH).
To obtain the best chromatographic conditions, the mobile phase composition, column
temperature and flow rate were optimised. The flow rate was varied from 0.8 mL
min−1
to 1.2 mL min−1
. The column temperature was varied between 22oC to 30
oC
and the analysis at 30◦C was preferred on the basis of improved peak symmetry and
resolution. The % of mobile phase was varied + 2% from the set parameters i.e.
60%+2% (58% to 62%). Isocratic chromatographic conditions were optimized for
determination of meta-cresol in PTH pharmaceutical product. The applied
chromatographic conditions permitted a good separation of meta-cresol and PTH at
different concentrations of meta-cresol. No interference of other excipients was
observed as shown in Figures 3.16-3.17.
Figure 3.16: Sample Chromatogram of principal peak of dilution buffer, meta-cresol
standard and mobile phase:
Meta-cresol ref. std.
Mobile phase
Dilution buffer
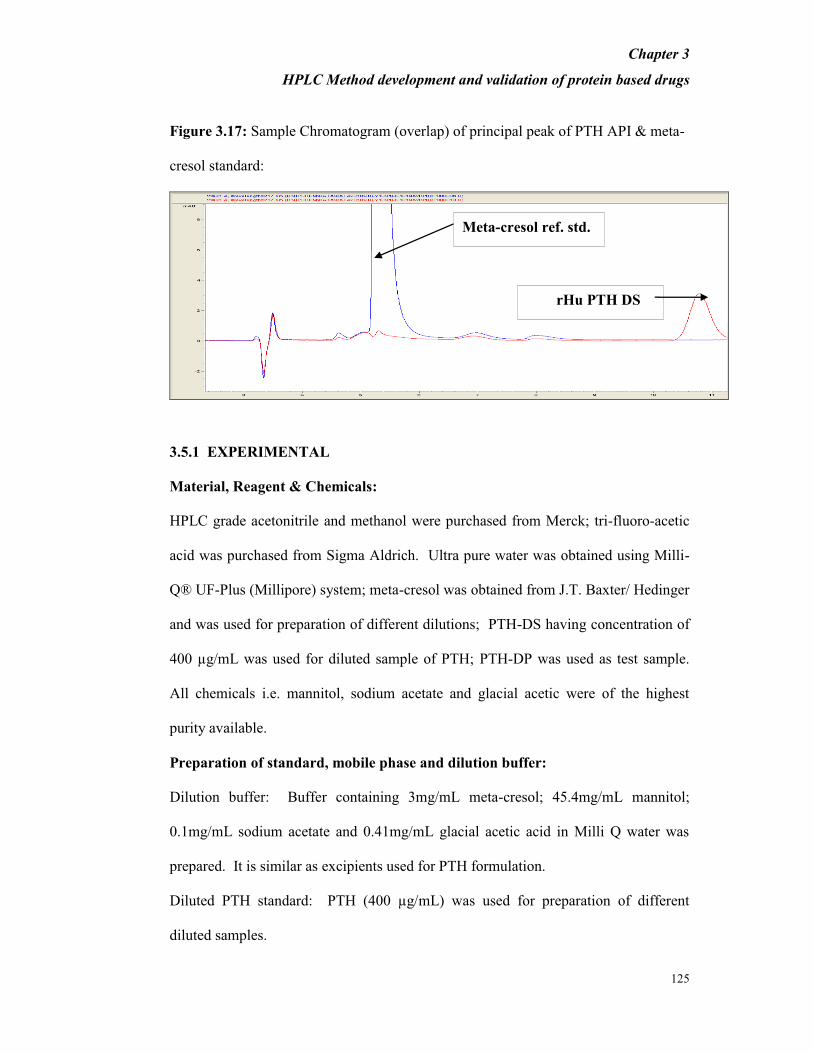
Chapter 3
HPLC Method development and validation of protein based drugs
125
Figure 3.17: Sample Chromatogram (overlap) of principal peak of PTH API & meta-
cresol standard:
3.5.1 EXPERIMENTAL
Material, Reagent & Chemicals:
HPLC grade acetonitrile and methanol were purchased from Merck; tri-fluoro-acetic
acid was purchased from Sigma Aldrich. Ultra pure water was obtained using Milli-
Q® UF-Plus (Millipore) system; meta-cresol was obtained from J.T. Baxter/ Hedinger
and was used for preparation of different dilutions; PTH-DS having concentration of
400 µg/mL was used for diluted sample of PTH; PTH-DP was used as test sample.
All chemicals i.e. mannitol, sodium acetate and glacial acetic were of the highest
purity available.
Preparation of standard, mobile phase and dilution buffer:
Dilution buffer: Buffer containing 3mg/mL meta-cresol; 45.4mg/mL mannitol;
0.1mg/mL sodium acetate and 0.41mg/mL glacial acetic acid in Milli Q water was
prepared. It is similar as excipients used for PTH formulation.
Diluted PTH standard: PTH (400 µg/mL) was used for preparation of different
diluted samples.
rHu PTH DS
Meta-cresol ref. std.
Chapter 3
HPLC Method development and validation of protein based drugs
126
Meta-cresol standard: 3 mg/mL was used for preparation of different dilutions.
Mobile phase consisted of 0.1% v/v TFA in 60% methanol.
All dilutions were made using calibrated digital micro-pipettes.
Chromatographic condition:
LC system equipped with an injection valve (quaternary), 217 UV detector and
Chemstation software was used. A reversed-phase Jupiter C18 column (4.6mm ID ×
250mm L, porosity 300ºA, particle size 5µm) with guard column (reversed-phase C18
column of 4.6mm ID × 12.5mm L, porosity 300ºA, particle size 5µm) was used for
separation. To get the optimum results, mobile phase with a flow rate of 1.0mL/min
was used and column temperature was maintained at 30oC. The isocratic programme
for mobile phase was optimized for 12 minutes.
3.5.2 RESULTS AND DISCUSSION
3.5.2.1 Method development:
The capacity factor (k’) of the first peak (meta-cresol) and second peak (PTH) were
3.24 and 5.24, respectively; while the resolution factor was 6.88. The asymmetry of
the peak for meta-cresol and PTH were found to be 1.29 and 5.29, respectively; while
the tailing factor parameter for meta-cresol and PTH was found to be 1.29 and 1.14,
respectively. For replicate injections of meta-cresol standard; the % RSD of the main
peak area was found to be below 0.7%, and there was insignificant variation in the
retention time (less than 0.1 min).
The PTH, and meta-cresol peaks were thus found to be well resolved and the tailing
factor was within limits. As available PTH formulations in the market contain
100µg/mL of meta cresol the concentration range of m-cresol was selected from

Chapter 3
HPLC Method development and validation of protein based drugs
127
75µg/mL to 120 µg/mL. Detection limit (LOD) and quantification limit (LOQ) were
not done for the study.
Usage of different column brands: –
Regarding the chromatographic procedure, different brands of reverse phase C18
columns were used (Jupiter column and Grace Vydac column) and compared in terms
of percentage variation of principal peak area of meta-cresol standard. Experiments
were conducted using system suitability samples. Percentage variation between
principal peak of meta-cresol was not more than 5% in all samples when compare to
the area of principal peak of meta-cresol from specificity samples. Retention time of
principal peak of meta-cresol was found to be around 5.3 minutes and 3.9 minutes
whereas principal peak of PTH was found to be around 10.9 minutes and 4.7 minutes
on Jupiter and Grace Vydac column respectively. Principal peak in both samples was
separated by base to base while overlapping their chromatograms. Integrable peak
was found at the retention time of the principal peak of meta-cresol in the API
dilution buffer without meta-cresol sample & mobile phase without affecting final
results. Variation in retention time was observed in Jupiter & grace vydac column.
Therefore it was decided to use Jupiter column for method validation.
3.6.2.2 Method validation
Specificity:
Specificity of the method was validated in terms of interference of excipients
including PTH. The excipients in the formulation include PTH, and others like
mannitol, sodium acetate and glacial acetic acid). If peaks due to PTH, mannitol ,
sodium acetate, glacial acetic acid and other buffer excipients would be observed
they could be considered as interfering peaks. To verify any interference, PTH, FB,
Chapter 3
HPLC Method development and validation of protein based drugs
128
mobile phase and meta cresol standard were injected onto HPLC separately.
Triplicate injections of three different concentrations of meta-cresol (75, 100 & 120
µg/mL) prepared in mobile phase and dilution buffer were tested for interference. No
interference was observed as shown in Figure 3.16-3.17.
Linearity & Range:
Meta-cresol standard (3mg/mL) was used for preparation of different concentrations
ranging from 75 to 120µg/mL, by considering 100µg/mL as 100%. Five different
concentrations were considered with three replicates of each concentration (n=15)
Linearity curve was plotted for peak area responses versus concentration of meta-
cresol as shown in Figure 3.18 and results are tabulated in Table C.
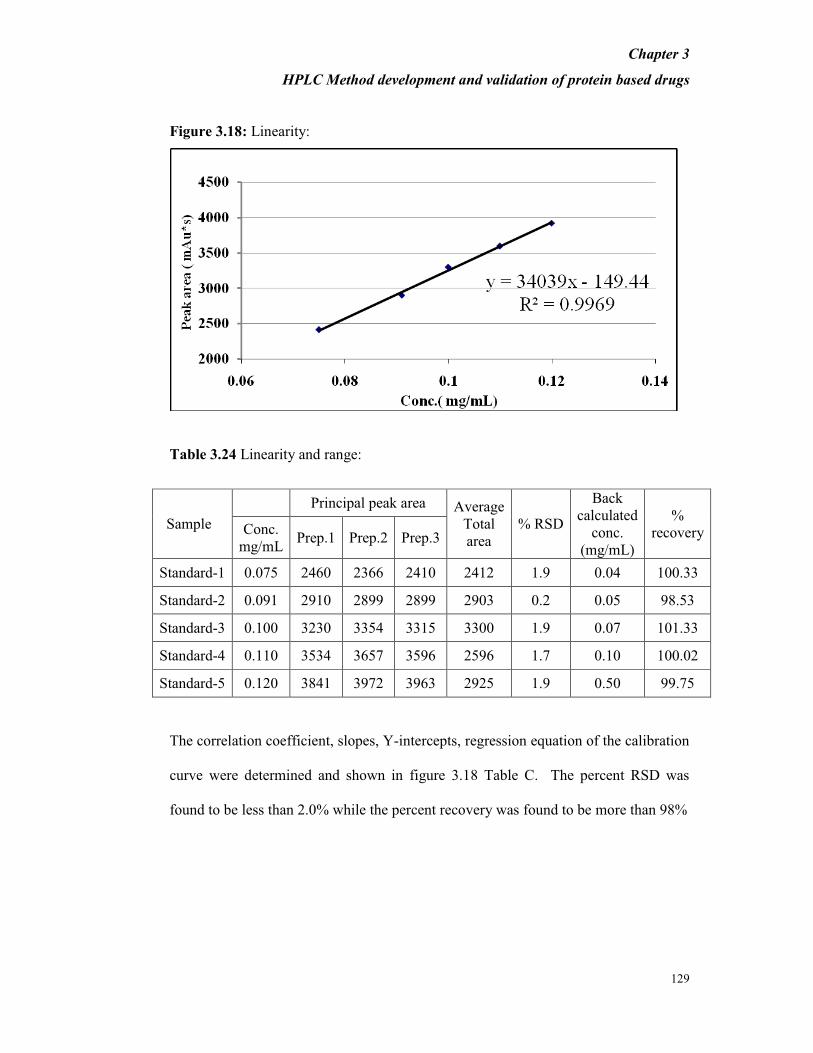
Chapter 3
HPLC Method development and validation of protein based drugs
129
Figure 3.18: Linearity:
Table 3.24 Linearity and range:
Sample
Principal peak area Average
Total
area
% RSD
Back
calculated
conc.
(mg/mL)
%
recovery Conc.
mg/mL Prep.1 Prep.2 Prep.3
Standard-1 0.075 2460 2366 2410 2412 1.9 0.04 100.33
Standard-2 0.091 2910 2899 2899 2903 0.2 0.05 98.53
Standard-3 0.100 3230 3354 3315 3300 1.9 0.07 101.33
Standard-4 0.110 3534 3657 3596 2596 1.7 0.10 100.02
Standard-5 0.120 3841 3972 3963 2925 1.9 0.50 99.75
The correlation coefficient, slopes, Y-intercepts, regression equation of the calibration
curve were determined and shown in figure 3.18 Table C. The percent RSD was
found to be less than 2.0% while the percent recovery was found to be more than 98%
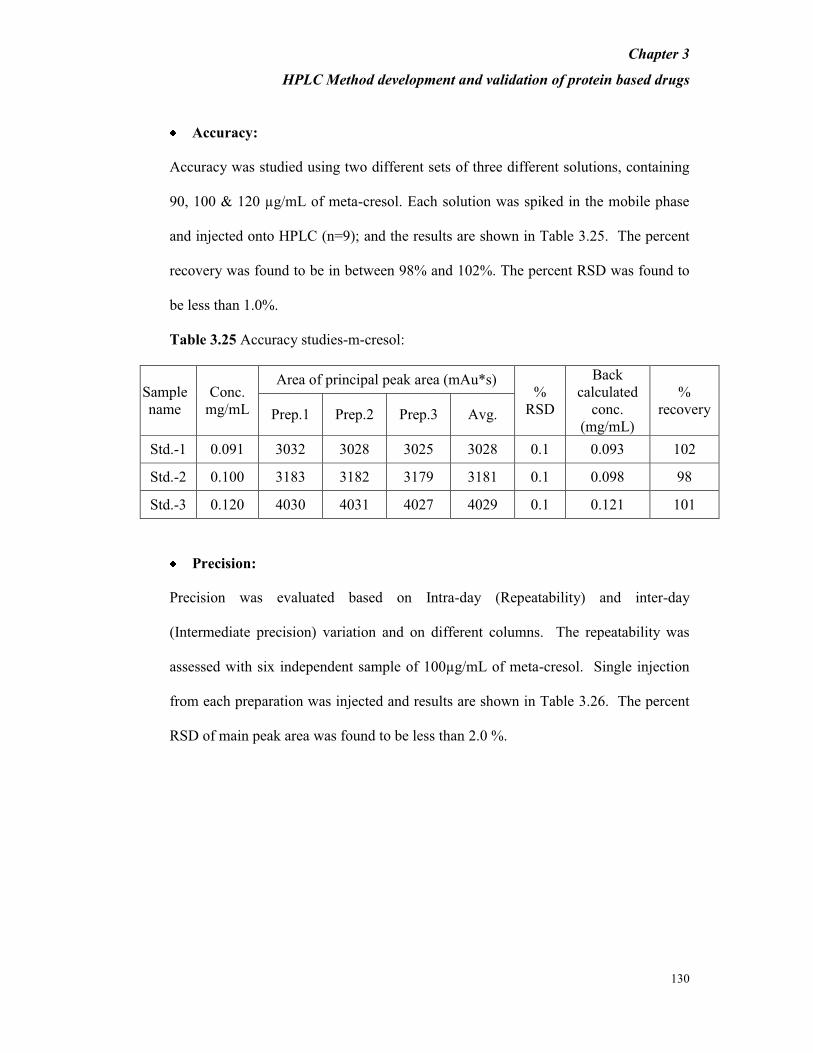
Chapter 3
HPLC Method development and validation of protein based drugs
130
Accuracy:
Accuracy was studied using two different sets of three different solutions, containing
90, 100 & 120 µg/mL of meta-cresol. Each solution was spiked in the mobile phase
and injected onto HPLC (n=9); and the results are shown in Table 3.25. The percent
recovery was found to be in between 98% and 102%. The percent RSD was found to
be less than 1.0%.
Table 3.25 Accuracy studies-m-cresol:
Sample
name
Conc.
mg/mL
Area of principal peak area (mAu*s) %
RSD
Back
calculated
conc.
(mg/mL)
%
recovery Prep.1 Prep.2 Prep.3 Avg.
Std.-1 0.091 3032 3028 3025 3028 0.1 0.093 102
Std.-2 0.100 3183 3182 3179 3181 0.1 0.098 98
Std.-3 0.120 4030 4031 4027 4029 0.1 0.121 101
Precision:
Precision was evaluated based on Intra-day (Repeatability) and inter-day
(Intermediate precision) variation and on different columns. The repeatability was
assessed with six independent sample of 100µg/mL of meta-cresol. Single injection
from each preparation was injected and results are shown in Table 3.26. The percent
RSD of main peak area was found to be less than 2.0 %.

Chapter 3
HPLC Method development and validation of protein based drugs
131
Table 3.26 Intraday precision m-cresol:
Inj.
No.
Area of
principal peak
(mAu*s)
Avg. area of
principal peak
(mAu*S)
%RSD of
principal peak
Rt of principal
peak (min.)
1 3154
3262 1.8
5.3
2 3241 5.3
3 3302 5.3
4 3257 5.3
5 3308 5.3
6 3310 5.3
Using the experimental design and matrix shown in Table 3.27; intermediate
precision was evaluated on different days with different equipments and with different
columns. Three replicate injections of system suitability standards (100µg/mL of
meta-cresol) prepared independently were considered for the study. Intra-day
precision was determined for 100µg/mL of meta-cresol by performing five different
conditions as mentioned in Table 27 (n = 15) and relative standard deviations (RSD)
were calculated.
Table 3.27 Experimental design for intermediate precision:
Set 1 Set 2 Set 3 Set 4 Set 5
Equipment
used System-1 System-2 System-2 System-1 System-1
Day Day-1 Day-2 Day-2 Day-3 Day-3
Column Column-1 Column-2 Column-1 Column-1 Column-1
The percent RSD for the main peak area of meta-cresol standard within each set and
between different sets was found to be less than 2.0%. The percent recovery of meta-
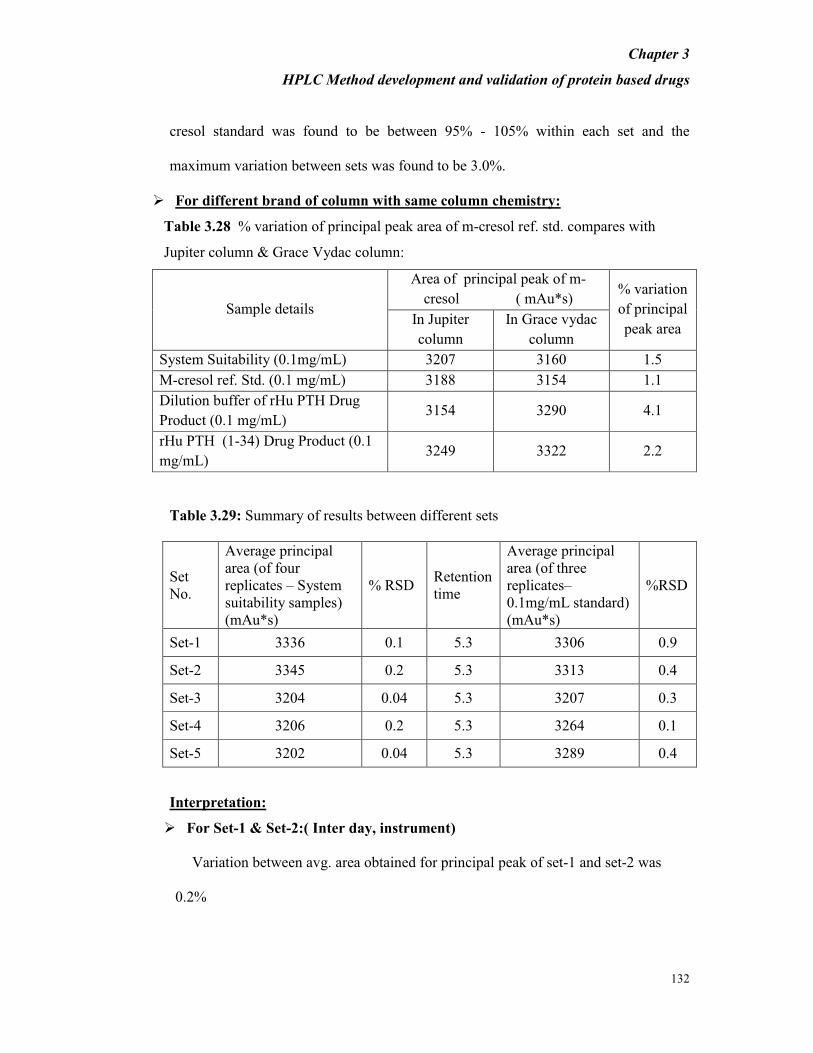
Chapter 3
HPLC Method development and validation of protein based drugs
132
cresol standard was found to be between 95% - 105% within each set and the
maximum variation between sets was found to be 3.0%.
Ø For different brand of column with same column chemistry:
Table 3.28 % variation of principal peak area of m-cresol ref. std. compares with
Jupiter column & Grace Vydac column:
Sample details
Area of principal peak of m-
cresol ( mAu*s) % variation
of principal
peak area In Jupiter
column
In Grace vydac
column
System Suitability (0.1mg/mL) 3207 3160 1.5
M-cresol ref. Std. (0.1 mg/mL) 3188 3154 1.1
Dilution buffer of rHu PTH Drug
Product (0.1 mg/mL) 3154 3290 4.1
rHu PTH (1-34) Drug Product (0.1
mg/mL) 3249 3322 2.2
Table 3.29: Summary of results between different sets
Set
No.
Average principal
area (of four
replicates – System
suitability samples)
(mAu*s)
% RSD Retention
time
Average principal
area (of three
replicates–
0.1mg/mL standard)
(mAu*s)
%RSD
Set-1 3336 0.1 5.3 3306 0.9
Set-2 3345 0.2 5.3 3313 0.4
Set-3 3204 0.04 5.3 3207 0.3
Set-4 3206 0.2 5.3 3264 0.1
Set-5 3202 0.04 5.3 3289 0.4
Interpretation:
Ø For Set-1 & Set-2:( Inter day, instrument)
Variation between avg. area obtained for principal peak of set-1 and set-2 was
0.2%
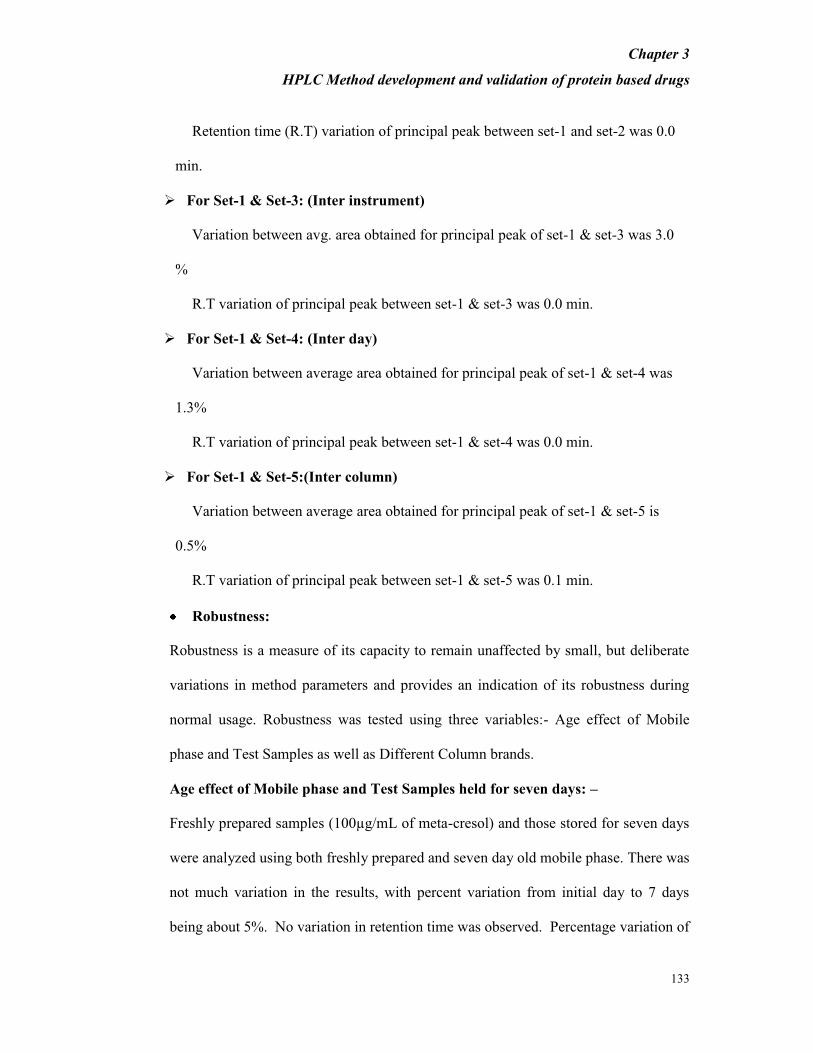
Chapter 3
HPLC Method development and validation of protein based drugs
133
Retention time (R.T) variation of principal peak between set-1 and set-2 was 0.0
min.
Ø For Set-1 & Set-3: (Inter instrument)
Variation between avg. area obtained for principal peak of set-1 & set-3 was 3.0
%
R.T variation of principal peak between set-1 & set-3 was 0.0 min.
Ø For Set-1 & Set-4: (Inter day)
Variation between average area obtained for principal peak of set-1 & set-4 was
1.3%
R.T variation of principal peak between set-1 & set-4 was 0.0 min.
Ø For Set-1 & Set-5:(Inter column)
Variation between average area obtained for principal peak of set-1 & set-5 is
0.5%
R.T variation of principal peak between set-1 & set-5 was 0.1 min.
Robustness:
Robustness is a measure of its capacity to remain unaffected by small, but deliberate
variations in method parameters and provides an indication of its robustness during
normal usage. Robustness was tested using three variables:- Age effect of Mobile
phase and Test Samples as well as Different Column brands.
Age effect of Mobile phase and Test Samples held for seven days: –
Freshly prepared samples (100µg/mL of meta-cresol) and those stored for seven days
were analyzed using both freshly prepared and seven day old mobile phase. There was
not much variation in the results, with percent variation from initial day to 7 days
being about 5%. No variation in retention time was observed. Percentage variation of
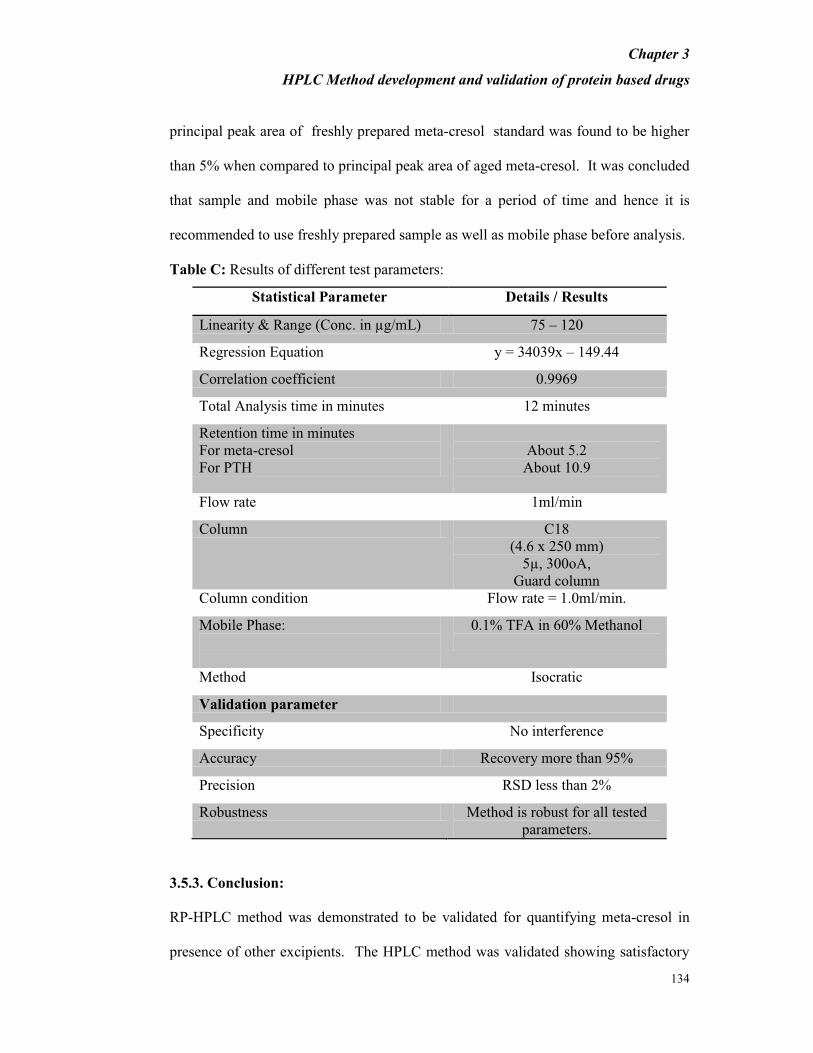
Chapter 3
HPLC Method development and validation of protein based drugs
134
principal peak area of freshly prepared meta-cresol standard was found to be higher
than 5% when compared to principal peak area of aged meta-cresol. It was concluded
that sample and mobile phase was not stable for a period of time and hence it is
recommended to use freshly prepared sample as well as mobile phase before analysis.
Table C: Results of different test parameters:
Statistical Parameter Details / Results
Linearity & Range (Conc. in µg/mL) 75 – 120
Regression Equation y = 34039x – 149.44
Correlation coefficient 0.9969
Total Analysis time in minutes 12 minutes
Retention time in minutes
For meta-cresol
For PTH
About 5.2
About 10.9
Flow rate 1ml/min
Column C18
(4.6 x 250 mm)
5µ, 300oA,
Guard column
Column condition Flow rate = 1.0ml/min.
Mobile Phase:
0.1% TFA in 60% Methanol
Method Isocratic
Validation parameter
Specificity No interference
Accuracy Recovery more than 95%
Precision RSD less than 2%
Robustness Method is robust for all tested
parameters.
3.5.3. Conclusion:
RP-HPLC method was demonstrated to be validated for quantifying meta-cresol in
presence of other excipients. The HPLC method was validated showing satisfactory
Chapter 3
HPLC Method development and validation of protein based drugs
135
data for all the parameters confirmed. The HPLC method was found to be capable of
giving analysis with good resolution, accuracy and precision. The chromatographic
method described here was found to be reliable for quantifying meta-cresol in PTH
formulation. Since the method is simple and rapid, they may be successfully applied
to quality control analysis of meta-cresol in PTH formulations.
Chapter 3
HPLC Method development and validation of protein based drugs
136
3.6 REFERENCES
[1]. Bond, M., Jankowski, M., Patel, H., et al., 1998. Biochemicalcharacterization
of recombinant factor IX. Semin. Hematol.35, 11–17
[2]. Wang, W., 1996. Oral protein drug delivery. J. Drug Target. 4,195–232.
(science liquid protein)
[3]. G. Pifferi, P. Santoro, M. Pedrani, Quality and functionality of excipients,
Farmaco 54 (1999) 1–14.
[4]. L.K. Golightly, S.S. Smolinske, M.L. Bennett, E.W. Sutherland III, B.H.
Rumack, Pharmaceutical excipients. Adverse effects associated with inactive
ingredients in drug products (Part I), Med. Toxicol. Adverse Drug Exp. 3
(1988) 128–165.
[5]. D. Jakel, M. Keck, Purity of excipients, in: M.L. Weiner, L.A. Kotkoskie
(Eds.),Excipient Toxicity and Safety Drugs and the Pharmaceutical Sciences
v.103, M. Dekker, New York, 2000, pp. 21–58.
[6]. M.L. Chen, Lipid excipients and delivery systems for pharmaceutical
development: a regulatory perspective, Adv. Drug Deliv. Rev. 60 (2008) 768–
777.
[7]. P.M. Gaynor, R. Bonnette, E. Garcia, L. Kahl, L. Valerio, FDA's approach to
the GRAS provision: a history of processes, FDA Science Forum, 2006.
[8]. D.S. Maclean, Q. Qian, C.R. Middaugh, Stabilization of proteins by low
molecular weight multi-ions, J. Pharm. Sci. 91 (2002) 2220–2229.
[9]. Lin, F.K., Suggs, S., Lin, C.H., Browne, J.K., Smalling, R., Ergie, J.C., Chen,
K.K., Fox, G.M., Martin, F., Stavbinsky, Z., Badrawi, S.M., Lai, P.H. and
Chapter 3
HPLC Method development and validation of protein based drugs
137
Goldwasser, E. (1985) Cloning and expression of the Human Erythropoietin
gene Proc. Natl. Acad. Sci. USA 82, 7580-7584.
[10]. Caro, J., Schuster, S. and Ramirez, S. (1989) Regulating mechanisms involved
in the expression of the erythropoietin gene. Contrib. Nephrol. 76, 7-13.
[11]. Nagata, S., Taira, H., Hall, A., Johnsrud, L., Streuli, M., Escodi, J., Boll, W.,
Cantell, K. and Weissmann, C. (1980) Synthesis in E. coli of polypeptide with
human leucocyte interferon activity. Nature 284, 3 16-332.
[12]. Murray, K. (1980) Genetic engineering. Philos. Trans. R. Sot. London B 290,
369-386.
[13]. David Gilg, Bettina Riedl, Andreas Zier, Matthias F. Zimmermann Analytical
methods for the characterization and quality control of pharmaceutical
peptides and proteins, using erythropoietin as an example Pharmaceutics Acta
Helvetiae 71 (1996) 383-394
[14]. Haselbeck A., Epoetins: differences and their relevance to immunogenicity,
Curr. Med. Res. Opin. 19, (2003) 430-432.
[15]. L. Jin, S.L. Briggs, S. Chandrasekhar S, et al., Crystal structure of human
parathyroid hormone 1-34 at 0.9-A resolution, J. Biol. Chem. 275 (35) (2000)
27238–27244.
[16]. G. N. Hendy, H. M. Kronengerg, et al., Nucleotide sequence of cloned
cDNAs encoding human preproparathyroid hormone, Proc. Natl. Acad. Sci.
USA 78 (12) (1981) 7365-7369.
[17]. Dion M.A.M. Luykx, Pieter J. Dingemanse, Soenita S. Goerdayal, Peter
M.J.M. Jongen High-performance anion-exchange chromatography combined
Chapter 3
HPLC Method development and validation of protein based drugs
138
with intrinsic fluorescence detection to determine erythropoietin in
pharmaceutical products Journal of Chromatography A, 1078 (2005) 113–119
[18]. Srinivas R. Gunturi, Ibrahim Ghobrial, Basant Sharma, Development of a
sensitive size exclusion HPLC method with fluorescence detection for the
quantitation of recombinant human erythropoietin (r-Hu EPO) aggregates,
Journal of Pharmaceutical and Biomedical Analysis 43 (2007) 213–221
[19]. Pilar Lara-Quintanar, Izaskun Lacunza, Jesus Sanz, Jose Carlos Diez-Masa,
Mercedes de Frutos, Immuno-chromatographic removal of albumin in
erythropoietin biopharmaceutical formulations for its analysis by capillary
electrophoresis, Journal of Chromatography A, 1153 (2007) 227–234
[20]. J. Brange, L. Langkjaer, in: Y.J. Wang, R. Pearlman (Eds.), Stability and
Characterization of Protein and Peptide Drugs, Plenum Press,New York, 1993,
p. 315.
[21]. K.H. Buchheit, A. Daas, K.H. J¨onsson, Pharmeuropa BIO 1 (2002) 7.
[22]. R. Pearlman, T.A. Bewley, in: Y.J. Wang, R. Pearlman (Eds.), Stability and
Characterization of Protein and Peptide Drugs, Plenum Press, New York,
1993, 1–58.
[23]. B.S. Kendrick, B.A. Kerwin, B.S. Chang, J.S. Philo, online size-exclusion
high-performance liquid chromatography light scattering and differential
refractometry methods to determine degree of polymer conjugation to proteins
and protein-protein or protein-ligand association States, Anal. Biochem. 299
(2001) 136–146.
Chapter 3
HPLC Method development and validation of protein based drugs
139
[24]. D. Gilg, B. Riedl, A. Zier, M.F. Zimmermann, Analytical Methods for the
characterization and quality control of pharmaceutical peptides and proteins,
Pharm. Acta. Helv. 71 (1996) 383–394.
[25]. R.D. Lange, R.B. Andrews, D.J. Trent, J.P. Reyniers, P.S. Draganac, W.R.
Farkas, Preparation of purified erythropoietin by high performance liquid
chromatography, Blood Cells. 10 (1984) 305–314.
[26]. K. D. Nugent, W. G. Burton, T. K. Slattery, B. F. Johnson, and L. R. Snyder,
Separation of proteins by reversed-phase high-performance liquid
chromatography : II. Optimizing sample pretreatment and mobile phase
conditions, Journal of Chromatography A, vol. 443, pp. 381-397, 1988.
[27]. L. R. Snyder, J. J. Kirkland, and J. L. Glajch, Practical HPLC Method
Development, 2nd Edition. John Wiley and Sons, Inc, New York. 1997.
[28]. JADWIGA DUDKIEWICZ WILCZY—SKA, IZA ROMAN and ELOBIETA
ANUSZEWSKA THE SEPARATION OF EPO FROM OTHER PROTEINS
IN MEDICAL PRODUCTS FORMULATED WITH DIFFERENT
STABILIZERS, Acta Poloniae Pharmaceutica n Drug Research, Vol. 62 No. 3
pp. 177n182, 2005
[29]. L. R. Snyder, J. J. Kirkland, and J. L. Glajch, Practical HPLC Method
Development, 2nd Edition. John Wiley and Sons, Inc, New York. 1997.
[30]. H.T. Keutmann, M.M. Sauer, G.N. Hendy, J.L.H. O’Riordan J.T. Potts,
Biochemistry 17 (1978) 5723.
[31]. J.T. Potts Jr., H.M. Kronenberg, M. Rosenblatt, Adv. Protein Chem. 35 (1982)
323.

Chapter 3
HPLC Method development and validation of protein based drugs
140
[32]. T. Kimura, M. Takai, K. Yoshizawa, S. Sakakibara, Bio-chem. Biophys. Res.
Commun. 114 (1983) 493.
[33]. N.A. Goud, R.L. Mckee, M.K. Sardana, P.A. Dehaven, E.Huelar, M.M. Syed,
R.A. Goud, S.W. Gibbons, J.E. Fisher, J.J. Levy, J.A. Rodkey, C. Bennett,
H.G. Ramjit, L.H. Caporale, M.P. Caulfield, M. Rosenblatt, J. Bone Miner.
Res.6 (1991) 781.
[34]. H. Gram, P. Ramage, K. Memmert, R. Gamse, H.P. Kocher, Bio/Technology
12 (1994) 1017.
[35]. R. M. Neer, C. D. Arnaud, et al Effect of parathyroid hormone (1–34) on
fractures and bone mineral density in postmenopausal women with
osteoporosis. The New England Journal of Medicine, 344 (2001) 1434–1441
[36]. J. Reeve, J. N. Bradbeer, M. Arlot, et al, hPTH 1–34 treatment of osteoporosis
with added hormone replacement therapy: biochemical, kinetic and
histological responses. Osteoporos International 1 (1991) 162–170
[37]. A. B. Hodsman, L. J. Fraher, T. Ostbye, et al, An evaluation of several
biochemical markers for bone formation and resorption in a protocol utilizing
cyclical parathyroid hormone and calcitonin therapy for osteoporosis. J Clin
Invest 91 (1993) 1138–1148
[38]. A. B. Hodsman, L. J. Fraher, P. H. Watson, et al., A randomized controlled
trial to compare the efficacy of cyclical parathyroid hormone versus cyclical
parathyroid hormone and sequential calcitonin to improve bone mass in
postmenopausal women with osteoporosis. J Clin Endocrinol Metab 82 (1997)
620–628
Chapter 3
HPLC Method development and validation of protein based drugs
141
[39]. R. Lindsay, J. Nieves, C. Formica, et al. Randomised controlled study of effect
of parathyroid hormone on vertebral-bone mass and fracture incidence among
postmenopausal women on oestrogen with osteoporosis, Lancet 350 (1997)
550–555
[40]. N. E. Lane, S. Sanchez, G. W. Modin, et al., Parathyroid hormone treatment
can reverse corticosteroid-induced osteoporosis. Results of a randomized
controlled clinical trial, J Clin Invest 102 (1998) 1627– 1633
[41]. N. E. Lane, S. Sanchez, H. K. Genant, et al., Short-term increases in bone
turnover markers predict parathyroid hormone-induced spinal bone mineral
density gains in postmenopausal women with glucocorticoid- induced
osteoporosis, Osteoporos Int 11 (2000) 434–442
[42]. E. K. Armitage, Parathyrin (Parathyroid Hormone): metabolism and methods
for assay, Clin. Chem., 32 (1986) 418-424.
[43]. D. B. Endres, R. Villanueva, F.R. Singer, et al., Measurement of parathyroid
hormone, Endocrinol Metab Clin North Am., 18 (1989) 611- 629.
[44]. G.V. Segre, J.T. Potts Jr., Differential diagnosis of hypercalcemia. Methods
and clinical applications of parathyroid assays, Endocrinology, Vol. 2, W.B.
Saunders company, Philadelphia, PA, 1989, 984-1001.
[45]. C. Burns, M. Moore, C. Sturgeon et al., WHO International Collaborative
Study of the proposed 1st International Standard for Parathyroid Hormone 1-
84, human, recombinant, (2009) WHO/BS/09.2115.
[46]. R. Bhushan, R. Agarwal, Liquid chromatographic separation of some PTH-
amino acids, 12 (1998) 322-325.
Chapter 3
HPLC Method development and validation of protein based drugs
142
[47]. A. L. Frelinger and James E. Zulls, Oxidized forms of parathyroid hormone
with biological activity – Separation and characterization of hormone forms
oxidized at methionine 8 and methionine 18*, The Journal of Biological
Chemistry 259 (1984) 5507–5513.
[48]. Y. Nabuchi, E. Fujiwara et al., Oxidation of recombinant human parathyroid
hormone: Effect of oxidized position on biological activity, Pharmaceutical
Research 12 (1995) 2049–2052.
[49]. Y. Nabuchi, E. Fujiwara, H. Kuboniwa, et al., Kinetic study of methionine
oxidation in human parathyroid hormone, Analytica Chimica Acta 365 (1998)
301- 307.
[50]. R.D. Lange, R.B. Andrews, D.J. Trent, J.P. Reyniers, P.S. Draganac, W.R.
Farkas, Preparation of purified erythropoietin by high performance liquid
chromatography, Blood Cells. 10 (1984) 305–314.
[51]. m/p Cresol category, UNEP Publication, internet link:,
www.inchem.org/documents/sids/sids/m-p-cresols.pdf
[52]. Dennis Kim, James Baraniuk, Delayed-type hypersensitivity reaction to the
meta-cresol component of insulin, Annals of Allergy, Asthma & Immunology,
Volume 99, Issue 2, August 2007, Pages 194-195.
[53]. D. McNeil, Kirk-Othmer Encyclopedia of Chemical Technology", Vol. 6, 2nd
Edition, John Wiley and Sons, New York; 1965 p. 434 – 444.
[54]. S. Husain, P. Kunzelmann, H. Schildknecht, Separation of isomeric alkyl
phenols by high-performance liquid chromatographic and gas-liquid
chromatographic techniques, J. Chromatogr. 1977; 13: 753 – 60.

Chapter 3
HPLC Method development and validation of protein based drugs
143
[55]. "NIOSH Manual of Analytical Methods", Vol. 3, 2nd Edition, USDHEW,
PHS, CDC, NIOSH, DHEW (NIOSH) Publication No. 77 - 157C, April
1977.