chapter 3 materials and methods - information...
TRANSCRIPT

32
CHAPTER 3
MATERIALS AND METHODS
3.1 GENERAL This chapter deals with the index properties of three natural soils,
three commercial soils (Bentonites), geosynthetics and admixtures
(Sand, flyash and quarry dust). This chapter also brings out the different
test procedures adopted for the determination of the index properties,
swelling, shrinkage, undrained shear strength and compressibility
characteristics of swollen and unswollen clays, with varying number of
geosynthetics, orientation and end confinement. The details of load test
conducted in a model tank on the swollen sample with and without
geosynthetics are also discussed in this chapter.
3.2 MATERIALS 3.2.1 Natural Soils Both natural soils and commercially available Bentonite clay were
selected for the present study such that they exhibit high plasticity,
swelling and compressibility characteristics. Three natural soils were
collected from Anna Nagar, Taramani and Tiruneermalai in Chennai,
Tamil Nadu at a depth of 2.0 m. These samples were air dried before
33
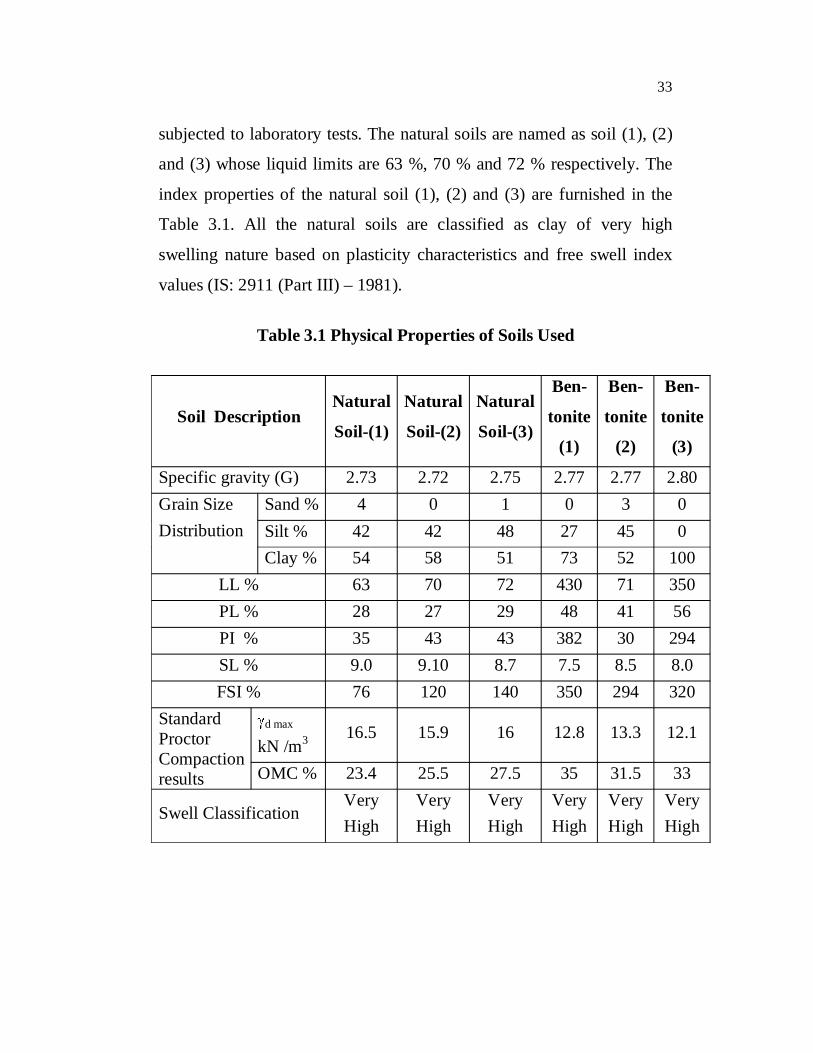
subjected to laboratory tests. The natural soils are named as soil (1), (2)
and (3) whose liquid limits are 63 %, 70 % and 72 % respectively. The
index properties of the natural soil (1), (2) and (3) are furnished in the
Table 3.1. All the natural soils are classified as clay of very high
swelling nature based on plasticity characteristics and free swell index
values (IS: 2911 (Part III) – 1981).
Table 3.1 Physical Properties of Soils Used
Soil DescriptionNatural
Soil-(1)
Natural
Soil-(2)
Natural
Soil-(3)
Ben-
tonite
(1)
Ben-
tonite
(2)
Ben-
tonite
(3)
Specific gravity (G) 2.73 2.72 2.75 2.77 2.77 2.80 Grain Size Distribution
Sand % 4 0 1 0 3 0 Silt % 42 42 48 27 45 0 Clay % 54 58 51 73 52 100
LL % 63 70 72 430 71 350 PL % 28 27 29 48 41 56 PI % 35 43 43 382 30 294 SL % 9.0 9.10 8.7 7.5 8.5 8.0 FSI % 76 120 140 350 294 320
Standard Proctor Compaction results
d max
kN /m3 16.5 15.9 16 12.8 13.3 12.1
OMC % 23.4 25.5 27.5 35 31.5 33
Swell ClassificationVery High
Very High
Very High
Very High
Very High
Very High
34
3.2.2 Bentonites
Three commercial soils (Bentonites) collected from local market
were used along with natural soils for comparison. The Bentonites (1),
(2) and (3) are having liquid limit of 430 %, 70 %, 350 % respectively.
The index properties of the commercials soil (1),(2) and (3) are shown in
the Table 3.1. All these soils are classified as clay very high swelling
nature. These bentonite clays were chosen because of its pure clay
system where changes in swell-shrink, compressibility etc., would be
significant and considerable, unlike the natural soils whose behaviour is
masked by the presence of non-clay fraction in the form of silt and sand.
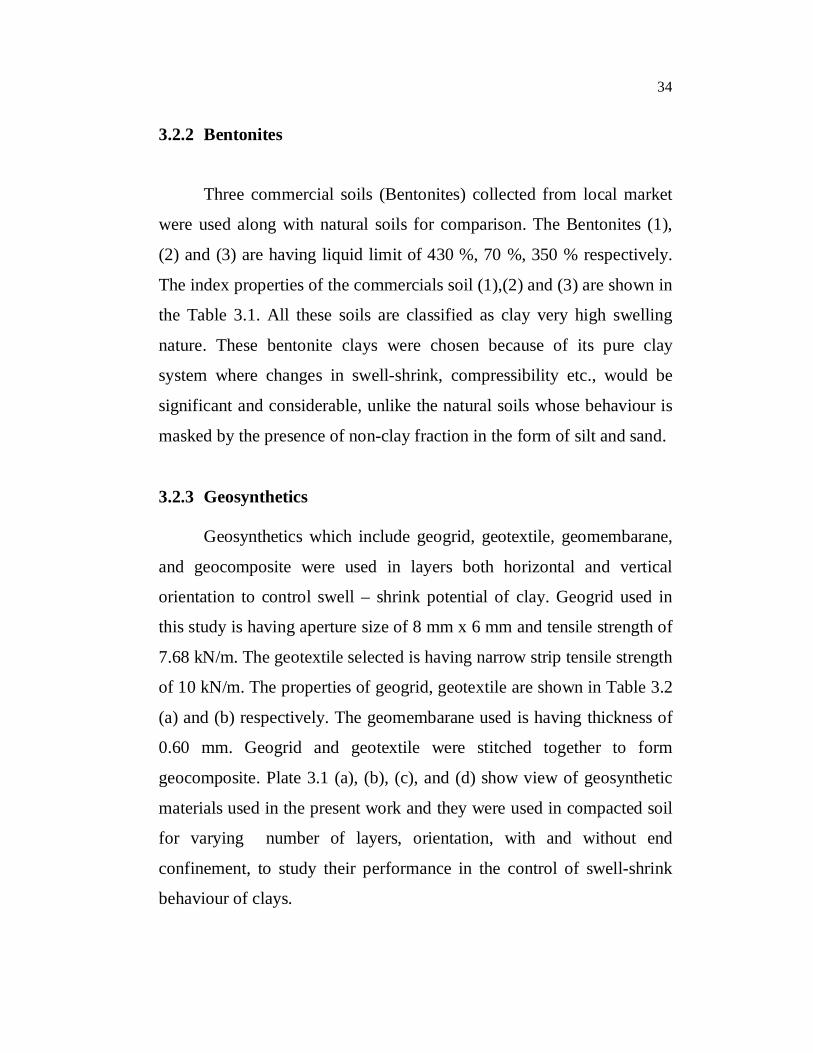
3.2.3 Geosynthetics Geosynthetics which include geogrid, geotextile, geomembarane,
and geocomposite were used in layers both horizontal and vertical
orientation to control swell – shrink potential of clay. Geogrid used in
this study is having aperture size of 8 mm x 6 mm and tensile strength of
7.68 kN/m. The geotextile selected is having narrow strip tensile strength
of 10 kN/m. The properties of geogrid, geotextile are shown in Table 3.2
(a) and (b) respectively. The geomembarane used is having thickness of
0.60 mm. Geogrid and geotextile were stitched together to form
geocomposite. Plate 3.1 (a), (b), (c), and (d) show view of geosynthetic
materials used in the present work and they were used in compacted soil
for varying number of layers, orientation, with and without end
confinement, to study their performance in the control of swell-shrink
behaviour of clays.
35
Table 3.2(a) Properties of Geogrid
Description Values
Type Netlon 121
Aperture size (mm) 8x6
Mesh thickness (mm) 3
Weight (g/m2) 736
Tensile strength (kN/m) 7.68
Extension at maximum load (%) 20.2
Load at 10% extension (kN/m) 6.8
Table 3.2(b) Properties of Geotextile
Description Values
Narrow strip tensile strength (kN/m) 10
CBR plunger load (kN) 0.5
Trapezoidal tear load (kN) 0.27
Stiffness (mg-cm) 9342.72
Diameter of the hole (mm) (using cone
drop test)15
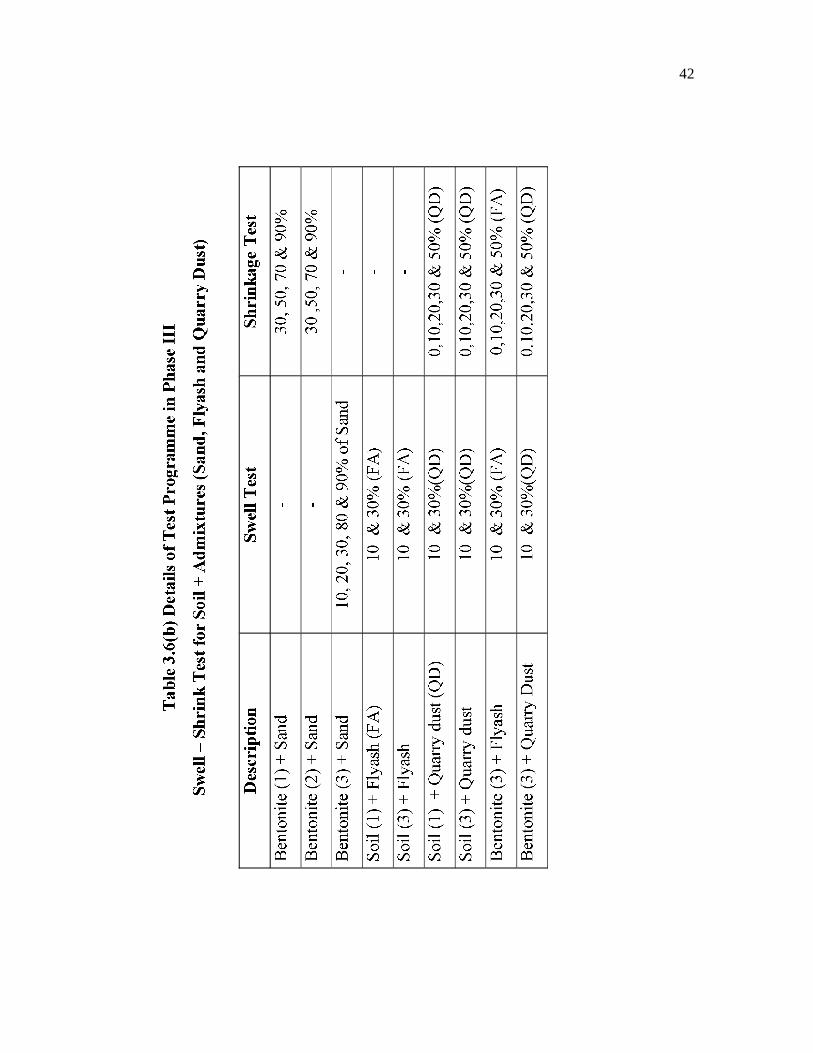
3.2.4 Admixtures (Sand , Quarry dust and Flyash)
The admixture include river sand (size ranging from 600 micron to
2.36 mm), Ennore fly ash, Tamil Nadu (G= 2.0 d max =8.9 kN/m3 and
OMC =41%) and quarry dust (G= 2.6, d max = 18 kN/m3, OMC = 22%)
were used in this investigation. These materials were mixed with
expansive clays at different proportions varying from 0, 10, 20, 30, 50,
and 70 % to control the swell and shrink potential of different expansive

36
clays. Quarry dust is a by-product during quarrying and sizing of
aggregate in crushing plant. Flyash is a by-product of combustion of coal
from thermal power plants. Considerable work has been carried out to
utilize these wastes for the beneficial improvement of problematic clays.
The chemical properties of quarry dust and flyash are shown in
Table 3.3. Both are having CaO content ranging from 2.72 % to 4.68 %.
Table 3.3 Properties of Solid Waste
Description Quarry Dust Flyash
Loss of ignition, % 0.47 1.46
Silica as SiO2 63.63 58.05
Iron as Fe2 O3 % 13.71 7.24
Titanium as TiO2 % 0.38 1.33
Calcium as CaO % 4.68 2.72
Magnesium as MgO, % - -
Sodium as Na2O,% 2.87 -
Potassium as K2O,% 1.35 -
Sulphur,SO3 - 0.99
3.3 METHODS 3.3.1 Test Programme Swelling, shrinkage, consolidation, unconfined compression
strength and load carrying capacity tests were conducted on six different
expansive clays with and without the addition of geosynthetics, sand and
solid waste (Quarry Dust and Flyash).

37
Basically three phases of experiments were conducted in this
investigation. Test details in each phases are shown in Table 3.4, 3.5 and
3.6 respectively for phase I, II, and III. In phase I, swelling and
shrinkage tests were conducted on two natural soils (soil 1 & 3) and a
Bentonite (Bentonite (3)) for varying initial density and initial moisture
content (IMC) ( Table 3.4) using conventional odeometer swell
apparatus. In phase II, unconfined compressive strength and
consolidation tests were conducted on both the swollen and unswollen
natural soil samples (soil (1), (2) and (3) ), for varying initial densities
and moisture content (Table 3.5) in two series. In series (1) keeping
initial density constant, IMC was varied and series (2), the IMC was kept
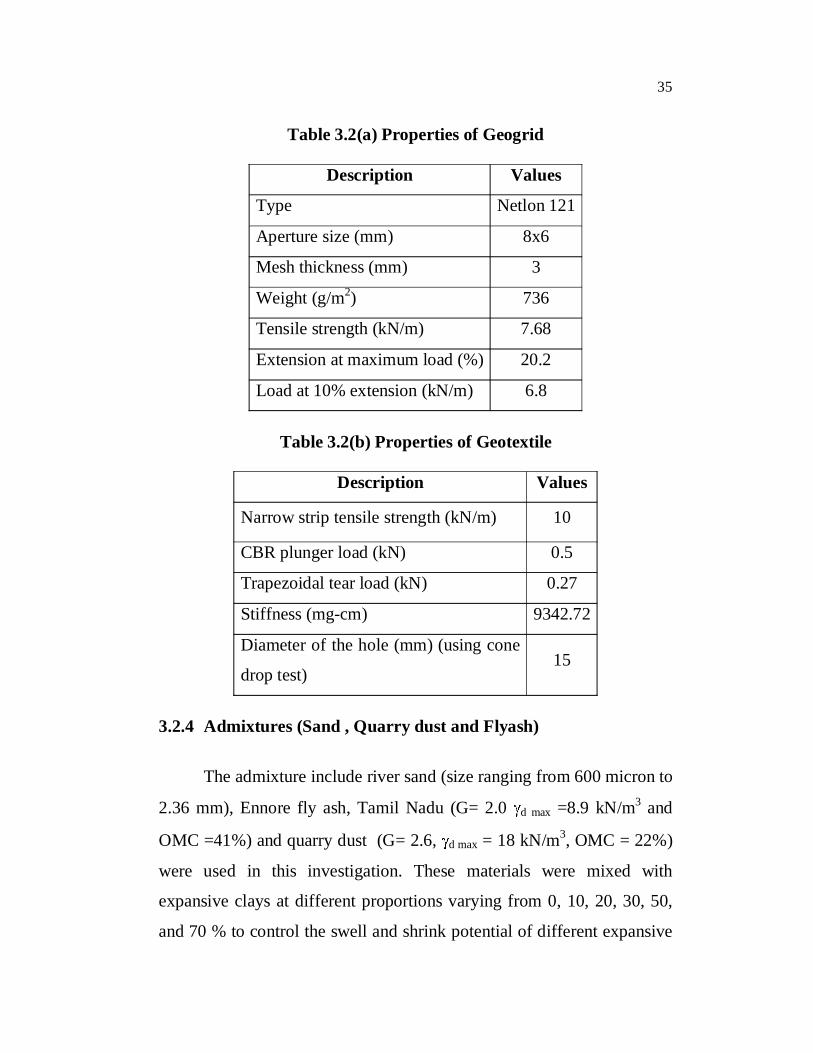
constant and initial density varied. In phase III swelling, shrinkage and
load tests were conducted on soil (2) with geosynthetics (geogrid,
geotextile, geomembarane and geocomposite) for varying number of
layers, orientation and end-confinement (Table 3.6) in the model tank. In
addition, the swell and shrink tests were also conducted on clays (soil
(2), Bentonite (1) and (2)) with increase of % of sand, fly ash and quarry
dust in phase III. The details of IMC and density selected for swelling,
shrinkage, consolidation and UCC strength in phase I and phase II are
shown in Table 3.4 & 3.5. In phase III , swelling tests with and without
geosynthetics, varying orientation, number and type of geosynthetics
were conducted on the soil at a constant initial density of 16.5 kN/m3 and
IMC of 8 %.

38
Table 3.4 Details of Test Programme in Phase I: (Swell – Shrink Test
for Varying Dry Density and IMC)
Description
Swell Test Shrinkage Test
Dry
Density
(kN /m3)
IMC % IMC %
Soil (1)
13.75,
14.6
16.5
0,8,30
0,8,15,25,30
0,15,30
21,31,43,50,
62,73,78,87
Soil (3)
14
15
16
0,15,30
0,8,15,25,30
0,15,30
14,27,41,46,
54,62,69,77
Bentonite (3)
12.1
10.7
15.1
0,8,15,25,30,50
0,15,30
0,15,30
75,224,350,430

39
Table 3.5 (a) Details of Test Programme in Phase II: (UCC and
Consolidation Test on Unswollen Clay for Varying Dry Density and
IMC)
Description
UCC Strength Tests Consolidation Tests
Initial Dry di
(kN / m3)
Initial Water
Content Wi (%)
Initial Dry di
(kN / m3)
Initial Water
ContentWi (%)
Soil (1)
Series (1)
16.516.516.516.5
23.3615.0 10.0 5.0
16.5 - -
16.5
23.36 - -
5.0
Series (2)
16.514.013.012.0
5.0 5.0 5.0 5.0
16.5 - -
12.0
5.0 - -
5.0
Soil (2)
Series (1)
15.915.915.915.9
25.5015.0 10.0 5.0
15.9 - -
15.9
25.5 - -
5.0
Series (2)
15.914.013.012.0
5.0 5.0 5.0 5.0
15.9 - -
12.0
5.0 - -
5.0
Soil (3)
Series (1)
16.016.016.016.0
27.5015.0 10.0 5.0
- - - -
- - - -
Series (2)
16.014.013.012.0
5.0 5.0 5.0 5.0
- - - -
- - - -

40
Table 3.5 (b) Details of Test Programme in Phase II: (UCC and
Consolidation Test on Swollen Clay for Varying Dry Density and
IMC)
Description
UCC strength Tests Consolidation tests Swollen
Dry Density
df
(kN/m3)
Swollen Water
ContentWSW (%)
Swollen Dry
Density df
(kN/m3)
Swollen Water
ContentWSW (%)
Soil (1)
Series (1)
15.67 15.72 15.67 15.69
33.33 34.40 36.85 37.39
- 15.72
- 15.69
- 34.40
- 37.39
Series (2)
15.69 13.39 12.18 11.45
37.39 46.00 42.51 44.73
15.69 13.39 12.18 11.45
37.39 4.60
42.51 44.73
Soil (2)
Series (1)
14.83 15.16 15.27 15.41
33.64 34.05 36.09 37.38
- 15.16
- 1.541
- 34.05
- 37.38
Series (2)
15.41 13.53 12.28 17.17
37.38 40.35 42.87 44.93
15.41 13.53 12.28 17.17
37.38 40.35 42.87 44.93
Soil (3)
Series (1)
14.73 14.76 14.78 14.93
41.27 42.35 43.64 44.92
- - - -
- - - -
Series (2)
14.93 13.30 11.74
44.92 49.50 52.94
- - -
- - -
41
42
43
3.3.2 Basic Tests Liquid and plastic limit of the soils were determined by using
Casagrande apparatus as per IS: 2720 (Part5)-1985. The liquid limit
values are reported an average of two determinations and the plastic limit
values reported are an average of three determinations. Grain size
distribution analysis was performed by hydrometer method (IS:
2720(part4)-185). Free swell test was done as per (IS: 2720(part 40)-
1977). Standard Proctor Compaction tests were conducted as per IS:
2720 (part VII) -1980.
3.3.3 Swelling Test 3.3.3.1 In Odeometer Apparatus Conventional odeometer apparatus was used for the determination
of swelling behaviour of natural soil (1), (2) and bentonite (3) for
phase I. The soil samples were statically compacted in the mould to a
required density at specified water content and inundated with distilled
water and then allowed to swell until it reached equilibrium values of
swelling. The % swell and swell pressure were determined by expanding
volume method as per IS 2720 (part 41) - 1977.
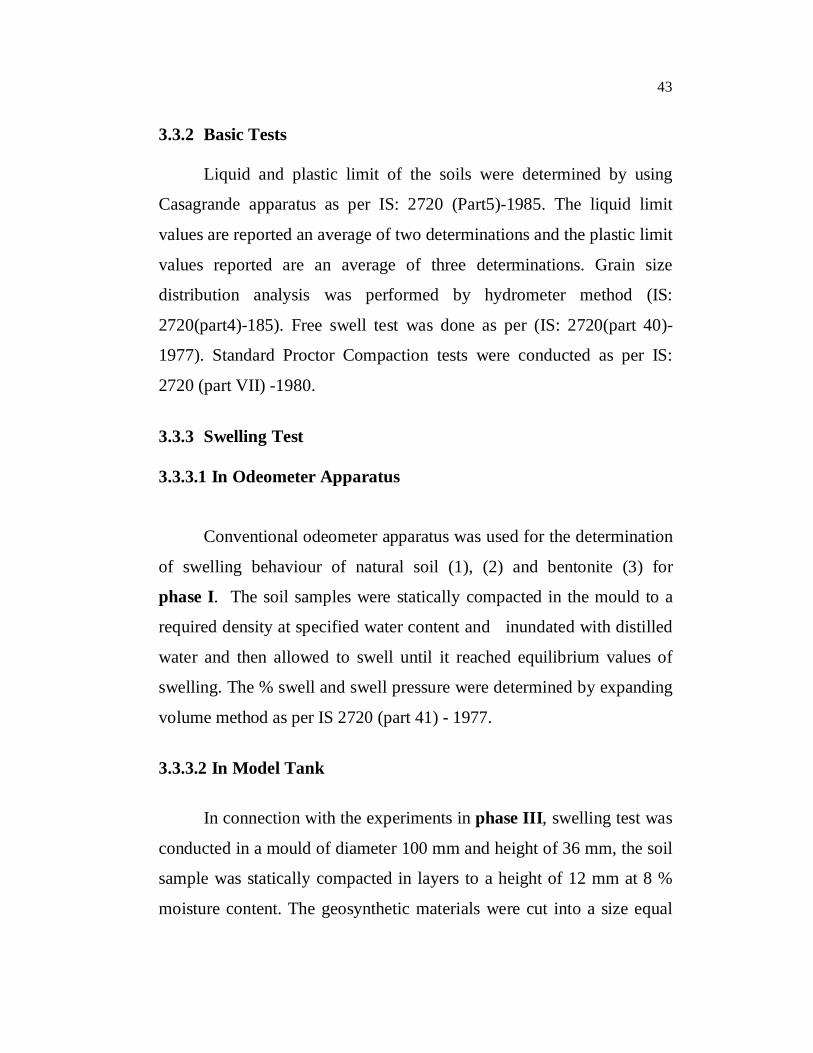
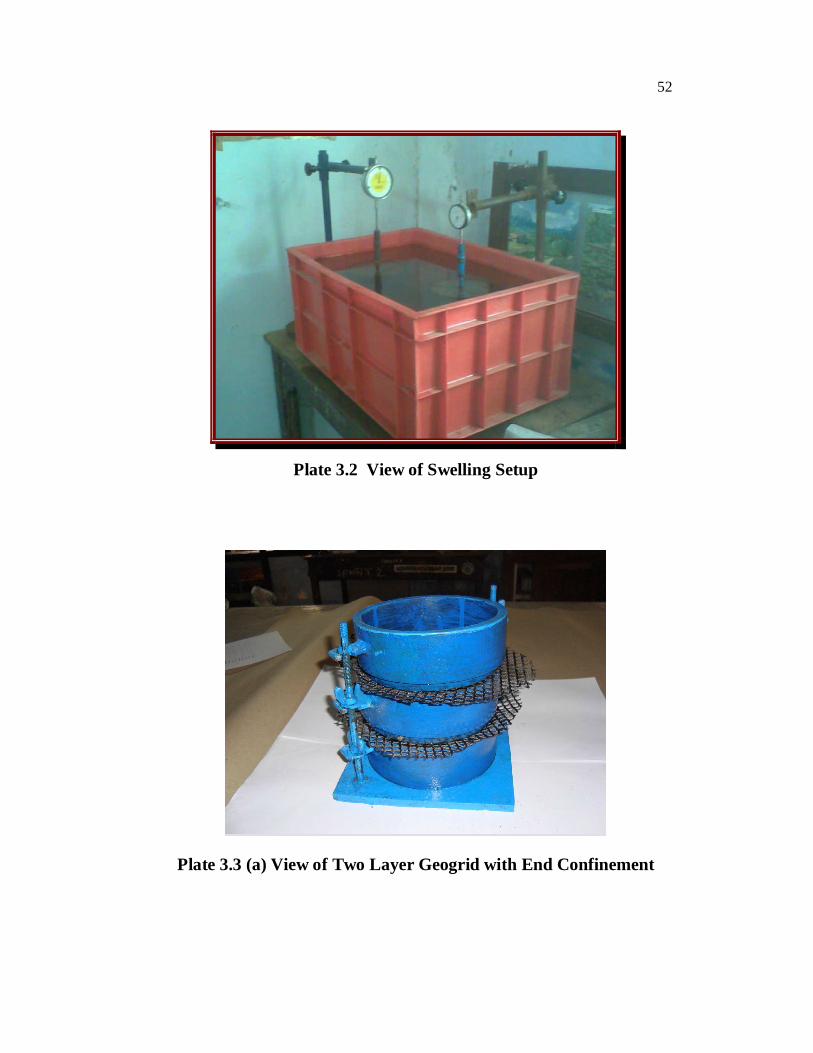
3.3.3.2 In Model Tank
In connection with the experiments in phase III, swelling test was
conducted in a mould of diameter 100 mm and height of 36 mm, the soil
sample was statically compacted in layers to a height of 12 mm at 8 %
moisture content. The geosynthetic materials were cut into a size equal

44
to the inner diameter of the swelling mould and placed at 1/2 and 2/3 of
the sample height respectively for one and two layer of geosynthetics.
The samples were then submerged in water with a surcharge pressure of
5 kN/m2. Dial gauges were fixed and the time-swelling observations
were taken until equilibrium values reached. The schematic view of
swelling test set up for soil alone, soil with one layer of horizontally
placed geosynthetics, soil with two layers horizontally placed
geosynthetic and soil with one layer vertically placed geosynthetics
respectively are shown in Figure 3.1 (a), to (d). Plate 3.2 shows the view
of fabricated mould used for swelling test without end confinement of
geosynthetics under submerged condition.
3.3.3.3 In Model Tank with a Provision of End Confinement In order to conduct the swelling test with end-confined
geosynthetic material (in horizontal direction), swelling mould has been
specially fabricated in such a way that the geosynthetic material can be
clamped at the edges of the mould (Figure 3.2). This could be possible
by making two half moulds (annular ring) of height each 50 mm and
inner diameter 100 mm and outer diameter of 170 mm. The parts of the
mould can be connected by grooving arrangement. The lower part of the
mould is filled with soil and it is statically compacted. After that,
geosynthetics were placed at the top of the soil and another mould is
placed above it such that geosynthetics could be clamped in between the
mould using the grooving arrangement. Then the upper part of the mould
is filled with the soil and it is statically compacted. Entire setup is
submerged in water and allowed to swell under the surcharge pressure of
5 kN/m2. Dial gauges were fixed and the time – swell observation were
45
taken until the equilibrium values were reached. Plate 3.3 (a) and (b)
shows the view of fabricated mould used for swelling test with end
confinement of geosynthetics
Figure 3.1(a) Swelling Test Setup for Soil Alone
Figure 3.1(b) Swelling Test Setup for Soil+ One Layer Geosynthetics
in Horizontal Orientation

46
Figure 3.1(c) Swelling Test Setup for Soil + Two Layer
Geosynthetics in Horizontal Orientation
Figure 3.1(d) Swelling Test Setup for Soil + One Layer
Geosynthetics in Vertical Orientation

47
Figure 3.2 View of Swelling Test Setup with a Provision for
Confining Geosynthetics
3.3.4 Shrinkage Test on Fabricated Mould In connection with the experiments in phase III , shrinkage
studies of soils were conducted on specially fabricated shrinkage cups
without base whose dimensions are 70 mm diameter and 30 mm
height(Figure 3.3 a and b). The shrinkage ring was placed on a perplex
sheet with filter paper at the bottom. Then the ring was filled with
remoulded soil at liquid limit consistency, with and without
geosynthetics, sand, flyash and quarry dust and was allowed to dry at
room temperature. The changes in vertical and horizontal shrinkage of
the soil samples were measured regularly at time intervals of 0, 2 hr,
4 hr, 8 hr, 11 hr, 24 hr, 48 hr, 72 hours etc. until shrinkage completes.
Plate 3.4 shows the photo of fabricated mould used for shrinkage test.
Figure 3.3 (a) and (b) show the experimental set up for shrinkage test for
soil alone and soil with one layer of geosynthetics respectively.
Surcharge of 5 kN/m2

48
Figure 3.3(a) Experimental Setup for Determining Shrinkage
Figure 3.3(b) Experimental Setup for Shrinkage Test with
Geosynthetics
3.3.5 Unconfined Compressive Strength Test After the soil sample has completely swollen in the swelling
apparatus (section 3.3.3), the final swollen water content and swollen dry
density were determined. At these swollen water content and

49
corresponding swollen density, UCC specimens were prepared by static
compaction and the same were used for conducting UCC test. From the
stress-strain graph, unconfined compressive strength values were
calculated and reported.
3.3.6 One Dimensional Consolidation Test
The statically compacted swollen and unswollen samples were
tested in standard fixed ring consolidometer using stainless steel rings of
60 mm diameter and 20 mm height (IS 2720 Part 15-1986). The inner
surfaces of the rings were lubricated with silicon grease to minimize the
side friction between the rings and soil specimen. The lubricated
consolidation ring with entire assembly was mounted in the
consolidation cell and positioned with the loading frame. After
equilibrium has attained for each pressure as indicated by nearly constant
readings in the vertical dial, a pressure increment ratio of unity will be
adopted. Each pressure was maintained normally about 24 hours for all
pressure increments after ensuring the equilibrium void ratio of each
pressure. The pressure Vs Void ratio curves were plotted for the
determination of compression index.
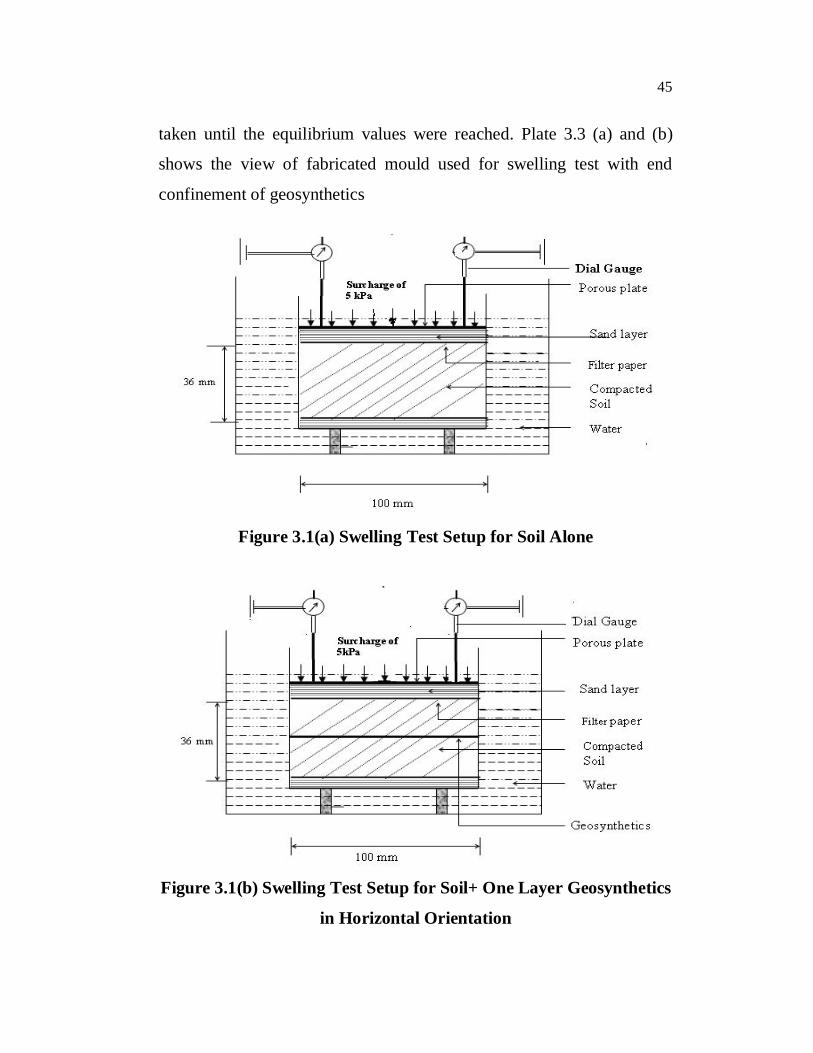
3.3.7 Load Test on Swollen Clay in Model Tank
Load test on swollen clays were conducted in phase III for
soil (2) with geosynthetics, sand, quarry dust and flyash. The soil sample
of height 120 mm was compacted in layers in a mould of diameter
150 mm and height of 180 mm at an initial moisture content of 8 %
50
(Figure 3.4). The required initial dry density of 16.5 kN/m2 was achieved
by static compaction. Geosynthetics were then placed in the sample at
the respective locations as required. The samples were then submerged
in water with a surcharge pressure of 5 kN/ m2 on a 150 mm diameter
circular bearing plate. After the soil sample was allowed to freely swell,
the load was applied over the circular steel plate of 50 mm diameter on
completely swollen sample. Settlement values were observed in dial
gauge for each increment of load after an interval of 1, 2, 5, 10, 20, 40,
60 minutes and thereafter at hourly intervals until the rate of settlement
becomes less than 0.02 mm/hour.
Figure 3.4 Load Test Setup on Swollen Clay Specimen with Two
Layers of Geosynthetics
Steel plate of dia 50 mm, thickness 5 mm
Swollen sample
Sand layer
Sand layer with Filter paper
150 mm
Pressure
Geosynthetics-2 layers120 mm

51
Plate 3.1(a) View of Geogrid Plate.3.1(b) View of Geotextile
Plate 3.1(c) View of Geomembrane Plate.3.1(d) View of Geocomposite
(Geotextile + Geogrid)
52
Plate 3.2 View of Swelling Setup
Plate 3.3 (a) View of Two Layer Geogrid with End Confinement

53
Plate 3.3 (b) View of Two Layer Geotextile with End Confinement
Plate 3.4 View of Shrinkage Setup