chapter 3 methodology 3.1. introduction - university of...
TRANSCRIPT
48
Chapter 3
Methodology
3.1. Introduction
The literature review in the preceding chapter established that people did not always
make rational choices when presented with finance-related decisions. The primary
motivation behind this study was to gain a better understanding of the cognitive and
emotional influences behind the seemingly reckless actions of investment professionals
who could have, and in some instances had, put the viability of their employers and
integrity of the marketplace at risk. The underlying assumption was that investment
professionals were better trained, had more investing experience, and had greater access
to financial information and investment technologies. Coupled with a fiduciary duty to
act in the interest of their employers and/or clients at all times, investment professionals
were expected to be more rational in their judgement and dealings.
The discussions in this chapter consist of four main sections. The first section was a
review of the conceptual framework on the role of learning in decision-making, to be
followed by a discussion on the research approach (a mixed methods approach) and the
issues behind this technique. The last two sections would be a review of the steps taken
in the collection of the quantitative and qualitative data for this study.
3.2. Conceptual Framework
Any research on the topic of decision-making under uncertainty would call for an
understanding of cognitive psychology, i.e. an examination of how people thought, how

49
they learnt, and how they acted when making a choice. Kahneman (2003) described a
two-system approach to the decision-making process. The mental process in system 1
was reflexive and was fast, effortless, associative and often governed by emotions.
System 2, on the other hand, was reflective and was slower, effortful and deliberately
controlled. The conceptual framework behind the current study would be based on this
two-system mental process.
The key assumption behind most economic models of choice was that people were
rational agents. In other words, people when required to make a decision would have all
information regarding the different choices they faced, could determine the outcomes
associated with each of these choices, could rank these outcomes and would chose the
outcome associated with the highest utility. System 2 corresponded roughly to this
mental process, where choice was optimised.
.
In reality, people are not entirely rational agents. Due to limited access to information,
limited processing capacity of the brain and limited time available, the mental process
when making choices would use short-cuts in the form of heuristics or ‘rules of thumb’.
Hence, people would not seek the best possible solution to problems but would rather
accept choices that were ‘good enough’ for their purposes; which at times could be sub-
optimal. Simon (1955) coined the term ‘satisficing’ to describe this decision-making
behaviour in his theory of bounded rationality. System 1 corresponded roughly to this
mental process.
However, Simon was of the view that this satisficing behaviour could be optimised.
According to Kahneman, improving one’s skills through prolonged practice would
increase the accessibility of useful responses and thus speed up the evaluation process.

50
Kahneman (2003) gave the example of a master chess player who through years of
practice developed the ability to play multiple games at the same time and win without
slowing down, as performing intuitively. Lo (2004) in his adaptive markets hypothesis
reinforced this notion that optimising behaviour could result from learning through trial
and error, from experiences, and by receiving positive or negative reinforcement from
outcomes. Over time people would develop best guesses as to what might be optimal.
The conceptual framework is summarised in Figure 3.1.
Behavioural Approach
(System 1)
Rational
Approach
(System 2)
Gen
erate
Alt
ern
ati
ves
Without learning
Fast
Emotional
Use rules of thumb
or shortcuts
(heuristics and
biases) because
information
processing by the
brain was limited
With learning
Fast
Through practice
Through trial and
error
From positive or
negative
reinforcement of
outcomes
Slow
Objective
Analyse expected
utility for all
possible outcomes
Ch
oic
e
‘Satisficing’
Optimising
Figure 3.1
Conceptual Framework

51
Studies by Nicolosi, Peng and Zhu (2009), Glaser and Weber (2007) and List (2003)
supported the notion that investors did learn from their investing experience. In support
of these findings, Loomes, Starmer and Sugden (2003) proposed three hypotheses on
how investors learnt from experience.
i. The refining hypothesis stated that individuals refined their decision-making
ability through repetition, feedback and incentives. Repetition enabled subjects
to become more familiar with decision tasks and the objects of choice; feedback
enabled subjects to experience the consequences of particular choices; and
incentives provided a general motivation to attend to tasks carefully.
ii. The market discipline hypothesis stated that individuals adjusted their behaviour
to correct errors if and only if those errors had proved costly.
iii. The shaping hypothesis stated that in repeated market environments, there was a
tendency for individuals to adjust their bids towards the price observed in the
previous market period.
In a similar vein, the strategy selection learning theory proposed by Rieskamp and Otto
(2006) assumed that individuals would have formed subjective expectations for the
choices available to them and would select the choice that best matched their
expectations. These expectations would be updated on the basis of subsequent
experiences. The learning assumption was supported in four experiments conducted by
the authors where the participants were found to have substantially improved their
inferences through feedback.

52
Further evidence of this two-system mental process could be found in the field of
neurosciences; where research findings revealed that the human brain possessed two
systems that processed information (Montier, 2007; Camerer, Loewenstein & Prelec,
2005; Weber, 2003). These two systems operated in parallel and were controlled by
different parts of the brain. The system located in the region of the neo-cortex enabled
information to be processed in a rule-based and analytical manner. The second system,
located in the region of the brain stem worked on similarity and associations, and was
strongly influenced by affective reactions like fear. While the two systems operated in
parallel, people with more formal education and expertise tended to favour outputs from
their rule-based analytic system, whereas the less experienced layperson tended to
depend more on outputs from their associative and affective system.
3.3. Research Approach
Much of the research on economic decision-making behaviour under uncertainty had
been conducted by way of experiments, usually within a classroom environment, using
decision games or questionnaires consisting of decision scenarios to collect data. The
subjects of such experiments were typically university students, although more recent
studies used subjects who were involved in the financial services industry (refer to
Table 3.3). The main criticism of this approach was that hypothetical settings might not
reflect real consequences, thereby raising questions regarding the validity and reliability
of the research findings and the corresponding conclusions.
Alternatively, some researchers adopted the approach of analysing actual trading data of
individuals to study the effect of behavioural biases on financial decision-making
(Frino, Grant & Johnstone, 2008; Kumar & Lim, 2008; Coval & Shumway, 2005;

53
Garvey & Murphy, 2004). While such analyses had shed some light on the loss aversion
tendencies of traders and investors, it would be challenging to use this data to examine
certain behaviours, for example the framing effect, anchoring effect, status quo effect,
etc. Moreover, in some jurisdictions like Malaysia, secrecy provisions in the securities
laws would make access to individual investment data a problem for researchers.
In this study, the researcher opted for a mixed methods research approach. According to
Creswell (2003), the earliest researchers to use multiple methods to study the validity of
psychological traits were Campbell and Fiske (1959). The focus of this study, which
was to examine the decision-making traits of investors, had some similarities with the
study conducted by Campbell and Fiske. A mixed methods approach would also
address some of the limitations associated with conclusions drawn from the analysis of
data collected purely from self-reports. The statistical analysis in the quantitative
approach would be augmented by case study analysis of observed behaviour in the
qualitative approach.
3.3.1. Mixed Methods Research
Mixed methods research is an alternative research approach that complements the
traditional qualitative and quantitative research techniques. According to Creswell
(2003) the collection of diverse types of data would be better applied in cases where
addressing the research problem would involve the need to explore context and
outcomes and to explain meanings and trends in both narrative and numerical formats.
In order to better understand this research approach, two definitions of mixed methods
research are provided below; one by Creswell and Plano Clark (2007) which is more

54
comprehensive, and the other by Johnson and Onwuegbuzie (2004) which is more
concise.
“Mixed methods research is a research design with philosophical
assumptions as well as methods of inquiry. As a methodology, it involves
philosophical assumptions that guide the direction of the collection and
analysis of data and the mixture of qualitative and quantitative approaches
in many phases in the research process. As a method, it focuses on
collecting, analyzing, and mixing both quantitative and qualitative data in a
single study or series of studies. Its central premise is that the use of
quantitative and qualitative approaches in combination provides a better
understanding of research problems than either approach alone.”
(Creswell & Plano Clark, 2007, p. 5)
“Mixed methods research is formally defined here as the class of research
where the researcher mixes or combines quantitative and qualitative
research techniques, methods, approaches, concepts or language into a
single study.”
(Johnson & Onwuegbuzie, 2004, p. 17)
3.3.1.1. Quantitative Approach
A cross-sectional study was selected for the quantitative approach. Cross-sectional
studies where subjects were measured once during a short data collection period were
best suited for studies aimed at examining relationships between variables (Kumar,
2005). Longitudinal studies, on the other hand, involved taking at least two measures

55
over an extended time period. Longitudinal studies allowed researchers to measure
change and to establish cause-effect relationships. This associative and not causal
element is an inherent problem and weakness of cross-sectional studies. However,
Babbie (2010) noted that some researchers would still attempt to draw conclusions of
causal processes that occur over time from the findings of cross-sectional studies.
The research objectives outlined in Chapter 1 drew attention to the role of experience in
financial decision-making behaviour, and where two of the key areas to be examined
were:
i. the similarities and differences in finance-related decision-making behaviour
between investment professionals and retail investors; and
ii. the relationship between demographic and socio-economic characteristics of the
subjects and behavioural biases that were predicted by prospect theory.
In other words, the statistical analysis would be aimed at examining the relationship
between the criterion variables (decision-making behaviour) and predictor variables
(demographic and socio-economic characteristics). Therefore, a cross-sectional
approach would be appropriate for this study.
Most cross-sectional studies were conducted through surveys, where the use of
questionnaires had become a widely accepted data collection tool in social science
research. Questionnaires had the ability to not only gather personal details and
chronological data but also to solicit an individual’s views on perception, preference
and choice, which could serve as inputs for studies on behaviour (LeBaron, Gail &
Susan, 1989). Compared to observing the actual behaviour of individuals over a period
of time, surveys had a wider reach, took less time to complete and under certain
circumstances, were more cost effective.
56
Primary data for this study was collected using both on-line and printed questionnaires.
The questionnaire consisted of a variety of finance-related decision scenarios aimed at
simulating actual decision-making behaviour under similar circumstances. One of the
techniques used by social and behavioural scientists to study human attitudes,
behaviour, feelings or thoughts was self-reporting. However, researchers had been
cautioned when analysing or interpreting self-report measures because the responses
from individuals could be inaccurate or unreliable (Schwarz & Oyserman, 2001;
Schwarz, 1999). Two reasons had been cited for this phenomenon. Individuals who
gave inaccurate responses either did so unintentionally due to lapses in memory, or
intentionally in order to present oneself in a socially acceptable manner.
The researcher was aware of the problems associated with the use of questionnaires in a
survey, for example reaching the target population, obtaining an acceptable sample size,
and gathering valid and reliable data. The discussion in Section 3.4 would focus on the
issues of questionnaire design, sampling technique and conduct of the survey to address
these issues.
It had been suggested in the literature on survey techniques that subjects who were
interested in the topic of the research and were willing to participate would very likely
be motivated to respond truthfully. Furthermore, if the questions were well-worded and
not too difficult to understand, and the questionnaire did not take too long to complete,
the response rate would be higher (Olsen & St. George, 2004).

57
3.3.1.2. Qualitative Approach
The case study methodology had been recognised as a strategic tool by researchers who
were looking for a more in-depth understanding of a phenomenon or behaviour. Robert
Yin defined the case study research method in two parts as follows:
“1. A case study is an empirical inquiry that
investigates a contemporary phenomenon within its real-life context,
especially when
the boundaries between phenomenon and context are not clearly
evident.
2. The case study inquiry
copes with the technically distinctive situation in which there will be
many more variables of interest than data points, and as one result
relies on multiples sources of evidence, with data needing to
converge in a triangulating fashion, and as another result
benefits from the prior development of theoretical propositions to
guide data collection and analysis.”
(Yin, 1994, p. 13)
Supporters of this research approach argued that the case study inquiry which produced
detailed accounts of the phenomenon or behaviour in a real-life setting and from
multiple viewpoints, would provide a better understanding of the complexities and
relationships of the issue under study. Such perspectives of the research problem might
not be captured through experimental or survey research (Zainal, 2007). Critics, on the
other hand, highlighted weaknesses in establishing reliability or generality of findings

58
due to a single or small number of cases. Another concern was the lack of rigour in the
methodology which might allow one-sided evidence or biased views to shape the
direction of the results or conclusions (Zainal, 2007; Tellis, 1997; Yin, 1994).
In response to the issues raised, Yin (1994) provided researchers with guidelines for the
design, conduct, analysis and write-up of case studies that would satisfy the
methodological rigour required for quantitative research; i.e. describing, understanding
and explaining. Yin opined that the logic for the selection of cases should be the ability
to replicate the findings rather than randomness of the sample. Furthermore, the
generalisation of results, whether from a single case or multiple cases, should be to
theory and not to the population. Hence replication of the findings from multiple case
studies would increase confidence in the strength of the theory.
The distinctive characteristics and descriptive analysis of case study research made it a
useful investigative tool when used in combination with the statistical analysis of the
survey data. For the qualitative approach in this study, the researcher chose a multiple-
case design, where five case studies would be selected for the purpose of comparison
and generalisation.
3.3.2. Hypothetical Bias
A common technique among researchers in the study of human behaviour, including
decision-making behaviour, was the use of hypothetical situations in games or written
formats. Subjects were presented with hypothetical scenarios and were then asked to
make a decision based on the given scenarios. The legitimacy of this research
methodology hinged on whether people ‘do what they say they would do’. This

59
discrepancy between intentions and actions was termed hypothetical bias. One
explanation for the hypothetical bias was that people would make different decisions
under hypothetical situations where no consequences were suffered as opposed to
decisions where the consequences would be real (Wiseman & Levin, 1996).
There were also counter arguments on the influence of the hypothetical bias in
behavioural research. Kuhberger, Schulte-Mecklenbeck and Perner (2002) posed the
question whether one could investigate people’s decisions in real life by asking them to
form an image of what they would do if they were in a particular real life situation.
They argued that the process of decision-making was in fact hypothetical; that the
process essentially involved anticipating potential outcomes and evaluating them, and
where at the time of the decision, none of these outcomes were real. This process would
be the same for both real and hypothetical decisions. Hence, the authors concluded that
real and hypothetical decisions would result in similar choices.
Most of the studies carried out to seek evidence of the hypothetical bias were based on
the willingness of subjects to pay for goods or services not transacted in the market
place15
. The findings from these studies were mixed; where the subjects either
overstated or understated the economic valuation of the good, or where there was little
or no difference between hypothetical and actual values. Some suggestions from these
studies to reduce the hypothetical bias were the use of a choice-based stated preference
valuation format (Murphy et al., 2005), realism in the survey design (Cummings &
Taylor, 1998), and ‘cheap talk’, which was a script to inform the subjects about the bias
in order for them to self-correct for it (Murphy, Stevens & Weatherhead, 2005; Brown,
Ajzen & Hrubes, 2003).
15 Examples of such goods or services were public services related to environmental preservation, health care, road safety etc. Some
of the studies also looked at the validity of opinion polls.

60
Outside of academia, financial advisors had been known to use questionnaires to
measure the risk tolerance16
of investors. Questionnaires which were designed to
comply with psychometric standards consisted of questions relating to attitudes, values,
preferences, emotions or behaviour in situations that involved risk. From the choices
that ranged from riskless to risky, investors would be assigned a final score that
corresponded to one of five investment risk tolerance categories, i.e. very conservative,
conservative, moderate, aggressive and very aggressive17
. Subedar (2007) in his thesis
confirmed that standardised psychometrically validated risk tolerance questionnaires
were effective in providing objective and unbiased assessments of investors’ risk
tolerance.
Overall, there seemed to be much support for the position that a decision made under
hypothetical circumstances would be a reasonable reflection of the decision that would
be made in the same context with real consequences. Nonetheless, efforts were still
taken in the questionnaire design to minimise the influence of the hypothetical bias, if
any.
16 Risk tolerance was defined as the amount and type of risk an investor would be willing to take to achieve his/her investment goal.
As an example, securities that had volatile returns like small-cap stocks or derivatives would typically not be suitable investments
for investors who were categorised as very conservative. The assessment of an investor’s tolerance level for risk is a regulatory requirement under the ‘know your client’ rule in almost all
capital markets around the world. This assessment should be carried out before any financial advice or sale of an investment product
could be made to an investor. This requirement ensured that the investor would not be sold investment products that were unsuitable based on the investor’s risk profile. 17 Refer to Appendix 3.1 for a description of the five commonly used risk tolerance categories.

61
3.4. Design of Questionnaire and Conduct of Survey
One of the most frequently used data collection tool, both for academic research and
commercial purposes, was the survey questionnaire. Some of the advantages of self-
administered questionnaires cited were:
cheaper to conduct compared to telephone or face-to-face interviews, especially
when the survey involved a large sample population and/or had a wide
geographical coverage; and
for questionnaires with closed-ended question formats:
o easy and quick to answer;
o less intrusive in that participants could respond in their own time;
o pre-determined choices could promote consistency in terms of understanding
the questions and responses; and
o data collected would be easier to code and analyse.
However, self-administered questionnaires often run the risk that the questions could be
misinterpreted, and as there was no avenue to provide any form of clarification, the
responses might be inaccurate and hence distort the findings of the study. This
highlighted the importance of good questionnaire design, particularly with respect to the
wording of questions for clarity and desired interpretation. The other disadvantage was
that recipients could ignore the questionnaire and if there was no follow-up in the form
of reminders, could result in a low response rate.
Validity and reliability are essential for a good questionnaire (Field, 2005). Validity
refers to how well the concept or construct of the study is being measured, and
reliability refers to the ability to produce the same results under the same conditions.

62
The questions for this study consisted of decision scenarios that were similar to those
used in prospect theory experiments. Most of the choices given were dichotomous in
nature, where one choice represented a rational decision and the other an irrational or
emotional decision. One test of the validity and reliability of the questionnaire would be
whether the results obtained were consistent with the findings from existing research in
prospect theory.
In the design of the questionnaire, the researcher paid particular attention to research
findings on increasing response rates and encouraging truthful answers. Roszkowski
and Bean (1990) conducted a postal survey of 8,534 subjects to study the effects of
questionnaire length on response rate and response bias. Their findings showed that
questionnaires with fewer questions had higher response and completion rates than
longer questionnaires. This finding was confirmed by Edwards et al. (2002) in a review
of 292 randomised controlled trials of any method to influence response to mail
surveys. The other relevant findings of the review were that response rates increased
when incentives were offered for completing and returning the questionnaire, when the
questions were of interest to the participants, and when the questionnaires were from
universities rather than commercial sources.
Anonymity or assurance of confidentiality and the effect on response characteristics like
response rate, item omission and quality of item responses, was another concern in
survey data collection. Anonymity requires that the identity of respondents not be
known to anyone; and confidentiality requires that the responses not be disclosed
without the respondents’ expressed permission. The results from studies on the effects
of anonymity or confidentiality on response rates were mixed, where most reported that
there was little evidence that anonymity or confidentiality had any effect on survey

63
response rates (Yeager, 1998). Nonetheless, good survey research practices
recommended that researchers should take measures that would assure respondents that
their identities and responses would be kept confidential.
It was suggested by Doyle (2001) that mail surveys should include a brief introduction
of the study in order to deliver three messages important for increasing the response
rate:
i. a promise of confidentiality of responses;
ii. an explanation of why the success of the study depended on the respondents’
full participation; and
iii. an estimation of the time to complete the questionnaire.
In the introduction before the questionnaire proper for this study (shown below), the
researcher had attempted to include the suggestions by Doyle, aimed at minimising
survey response biases.
Dear Sir/Madam
I am a student from Universiti Malaya and am writing my doctoral thesis in economics.
My research topic deals with factors affecting the financial decision-making behaviour
of private investors, as well as institutional or professional investors.
The questionnaire consists of 13 questions that ask you to assume or imagine that you
are in a certain situation. The objective of each question is to gain a picture of what you
would do in such circumstances regardless of whether you have ever been in them or
ever likely to be in them. For each question please answer or chose the best option
given based on the information given. There is no right or wrong answer. The success
of my doctoral research is highly dependent upon your honest response to each
question.
The data gathered would be used only for the purpose of my doctoral thesis, and would
be kept confidential. Your anonymity is assured.
The questionnaire should take about 10-15 minutes to complete. Please email the
completed questionnaire to [email protected], and I will send you a brief that
would explain some aspects of investor psychology behind each question.

64
While there was no offer of monetary incentives or gifts, respondents were promised an
explanation of the investor psychology behind each of the choices for each decision
scenario, upon receipt of a completed questionnaire. (Refer to Appendix 3.2 for a copy
of this explanation.) This allowed the respondents to do a self-assessment, i.e. to
determine whether they were rational or irrational investors. As the selection criteria for
the target population were people who had some knowledge and/or experience in
investments, it was assumed that providing respondents with insights to “why smart
people make big money mistakes” would be of interest to them. This was similar to the
motivation that attracted people to take personality or intelligence tests; i.e. an
opportunity to learn something about themselves.
3.4.1. Criterion Variables
Prospect theory had been widely accepted by researchers in behavioural studies as a
descriptive framework on how people made decisions in situations that involved
uncertainty, like financial decisions. Unfortunately, prospect theory could not provide
an explanation for all the behavioural biases that influenced financial decision-making.
The more commonly observed behaviours associated with prospect theory were conduct
that resulted from the anchoring, loss aversion, mental accounting and status quo biases.
Anchoring was the tendency to rely on certain pieces of information, regardless of their
relevance. Loss aversion was the tendency to avoid losses rather than to acquire gains
because the pain from a loss was greater than the pleasure from a gain of the same
quantum. Mental accounting was the tendency to group assets into different categories
where the gains and losses in each category were treated separately and at times
65
differently. Status quo was the tendency to choose inaction as the best course of action
going forward. These four biases formed the basis for the measurement of the criterion
variable.
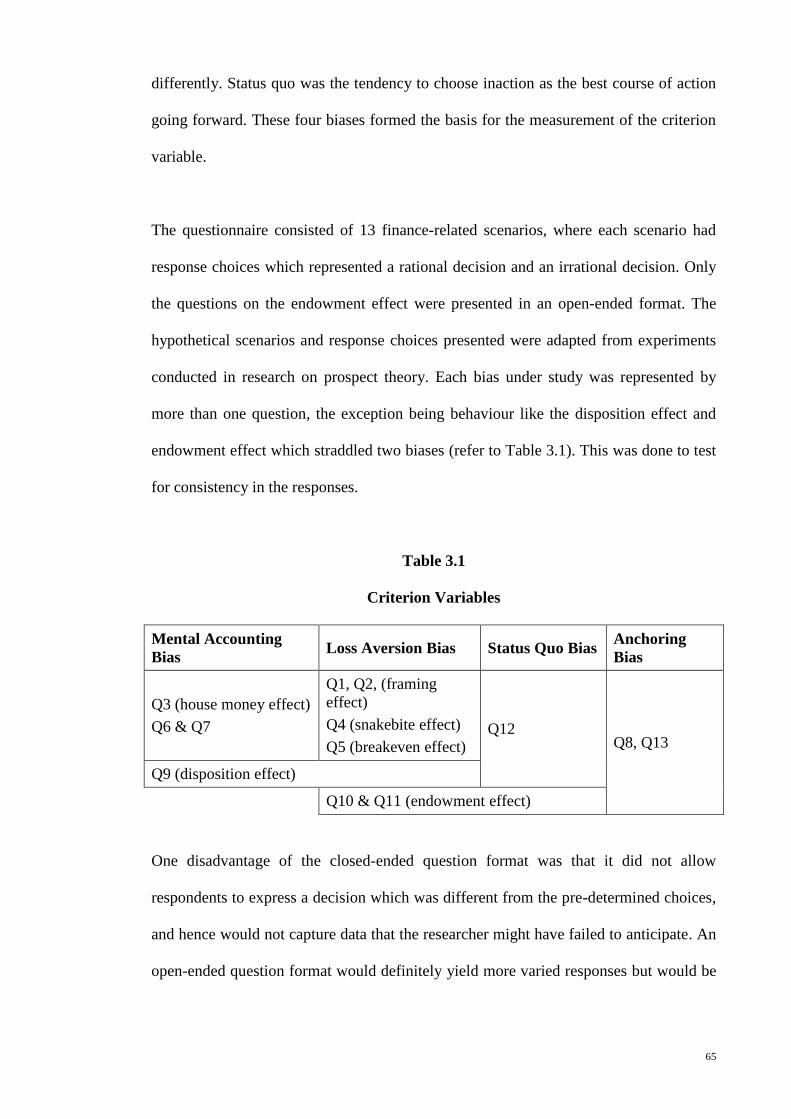
The questionnaire consisted of 13 finance-related scenarios, where each scenario had
response choices which represented a rational decision and an irrational decision. Only
the questions on the endowment effect were presented in an open-ended format. The
hypothetical scenarios and response choices presented were adapted from experiments
conducted in research on prospect theory. Each bias under study was represented by
more than one question, the exception being behaviour like the disposition effect and
endowment effect which straddled two biases (refer to Table 3.1). This was done to test
for consistency in the responses.
Table 3.1
Criterion Variables
Mental Accounting
Bias Loss Aversion Bias Status Quo Bias
Anchoring
Bias
Q3 (house money effect)
Q6 & Q7
Q1, Q2, (framing
effect)
Q4 (snakebite effect)
Q5 (breakeven effect) Q12
Q8, Q13
Q9 (disposition effect)
Q10 & Q11 (endowment effect)
One disadvantage of the closed-ended question format was that it did not allow
respondents to express a decision which was different from the pre-determined choices,
and hence would not capture data that the researcher might have failed to anticipate. An
open-ended question format would definitely yield more varied responses but would be

66
problematic to code for subsequent statistical analysis due to the difficulty in identifying
common responses from the data collected.
The researcher was of the view that allowing for free expression of responses with an
open-ended format for this study might not serve to improve the results. Respondents in
the survey were asked to choose the response choice that best represented the decision
they would make if they found themselves in the same situation as the presented
scenarios. Evidence from literature on the effect of the hypothetical bias in behavioural
studies showed that people ‘do what they say they would do’. The choice of either a
rational or irrational response would be a reasonable indication of the tendency of the
respondent to be influenced by the bias under study.
3.4.1.1. Coding the Decision Scenarios
The criterion variables were measures for decision-making behaviour, where rational
decisions were coded as zero (0) and irrational decisions were coded as one (1). The
rationale behind the coding for each decision scenario would be discussed in this
section, where the term ‘irrational individual’ was used to refer to a person whose
response choices were influenced by cognitive biases.

67
Question 1
Suppose you have RM20,000. When presented with the following options, which
would you choose?
(a) A 100% chance to win RM5,000
(b) A 50% chance to win RM10,000 and a 50% chance to win nothing
Question 2
Now, suppose you have RM30,000. When presented with the following options,
which would you choose?
(a) A 100% chance to lose RM5,000
(b) A 50% chance to lose RM10,000 and a 50% chance to lose nothing
Questions 1 and 2 were based on experiments in loss aversion cited in Kahneman and
Tversky’s (1979) paper on prospect theory. The results from the experiments conducted
showed that an irrational individual would choose (a) for question 1 and (b) for question
2.
Irrational individuals would view the two scenarios as separate and different, where the
decision taken would be based on the gains and losses of each scenario independently.
In question 1, an individual’s predisposition to avoid a loss implied a preference for a
sure gain to a gamble of the same expected value. However, in question 2, when faced
with a sure loss, the chance to lose nothing induced a preference for the gamble.
On the other hand, the rational individual would treat the two decision scenarios as
identical, i.e. when viewed in terms of state of wealth. The individual who would not
take a gamble and choose (a) for both questions would end up with RM25,000. The
individual who would take a gamble and choose (b) for both questions would end up
with RM20,000 or RM30,000 with equal probabilities. Hence, a rational individual who
was more concerned about the final state of wealth would either chose a sure thing or
gamble instead of flipping preferences.

68
Question 3
You have just won RM1,000. Now choose between:
(a) A 50% chance to gain RM200 and a 50% chance to lose RM200
(b) No further gain or loss
Question 4
You have just lost RM1,000. Now choose between:
(a) A 50% chance to gain RM200 and a 50% chance to lose RM200
(b) No further gain or loss
Question 5
You have just lost RM1,000. Now choose between:
(a) A 30% chance to gain RM1,000 and a 70% chance to gain nothing.
(b) A sure gain of RM300.
Questions 3 to 5 were based on experiments conducted by Thaler and Johnson (1990)
on how loss aversion in decision-making would be influenced by prior outcomes. The
findings from Thaler and Johnson’s research suggested that an irrational individual
would choose (a) for question 3, (b) for question 4 and (a) for question 5.
In question 3, a prior gain could stimulate risk-seeking in a person. The gain would be
put into a separate mental account and would not be viewed the same as one’s own
money. The individual would then have different risk preferences for the money in each
account, i.e. own money account and gains account. This was known as the house
money effect where individuals were prone to take on more risk after experiencing a
gain.
In questions 4 and 5, prior losses would not stimulate risk-seeking unless the gamble
offered a chance to breakeven. The pain experienced from an initial loss would
discourage an individual from accepting a gamble that might incur a further loss and
hence more pain. This was often known as the snakebite effect. However, an

69
opportunity to get back to the original reference or breakeven point could change an
individual’s risk-seeking behaviour. In other words, when prior losses were present,
gambles that offered the prospect of recouping losses would be treated differently from
gambles that did not. This was known as the breakeven effect.
A rational individual should not be affected by a prior outcome, where gains or losses
experienced the past would not form part of the decision-making process. Prior
outcomes of investments were sunk, were irrelevant, and should not overly influence an
individual in making the next investment decision.
Question 6
You have bought a ticket to a play that you have waited for a long time to see. At
the theatre you realise that you have lost your ticket, which cost RM150. Do you
spend another RM150 to see the play?
(a) Yes
(b) No
Question 7
You are going to a play that you have waited for a long time to see, but you have
not bought your ticket, which costs RM150. At the theatre you realise that you
have lost RM150 in cash. If you still have enough money, do you buy a ticket to
see the play?
(a) Yes
(b) No
Questions 6 and 7 had been cited as examples of mental accounting (Kahneman &
Tversky, 1984). Research findings suggested that an irrational individual would chose
(b) for question 6 and (a) for question 7.
It should be noted that both scenarios offered the same outcome, i.e. total out-of-pocket
cost of RM300 for a product valued at RM150. The difference in response was
attributed to the organisation of an individual’s mental accounts; where one account

70
would be the experience of seeing the play and the other account would be cash. The
cost of the ticket represented the experience of seeing the play and buying a second
ticket would increase the cost for that experience which an irrational individual might
find unacceptable. However, the loss of cash would not be posted to the account of
seeing the play. The irrational individual would view the scenario in question 7 as two
independent mental accounts, RM150 in lost cash and the RM150 for a ticket, which
would be more acceptable.
Question 8
Investor A owns 100 shares of a stock, which he paid RM10 per share. Investor B
also owns 100 shares of the same stock for which he paid RM20 per share. The
value of the stock was RM16 per share yesterday, and today it dropped to RM14
per share. Who in your view is more upset?
(a) Investor A
(b) Investor B
This example was used by Kahneman and Riepe (1998) to explain the behaviour of
investors who often used the purchase price as a reference point. An irrational
individual would choose (b) as he/she would rationalise that investor A would treat the
bad news as a reduction in a gain, while investor B would see the same news as an
increased loss. The value function in prospect theory was steeper in the area for losses
than for gains. Hence the RM2 drop in stock price and the feeling of pain would be
more significant for investor B (overall loss of RM6) than for investor A (loss of RM2).

71
Question 9
You invested RM200,000 in stocks A and B where you paid:
RM8 per share for stock A; and
RM15 per share for stock B.
After 1 year, your initial investment increased in value to RM230,000 where the
value of:
stock A increased to RM15 per share; and
stock B decreased to RM10 per share.
You have no information to evaluate the future performance of either stock and
both are equally susceptible to changes in the economic outlook. If you need to
pay for an expense of RM30,000 from your investment portfolio, how would you
choose to pay for that expense?
(a) Sell RM30,000 of stock A
(b) Sell RM21,000 of stock A and RM9,000 of stock B
(c) Sell RM9,000 of stock A and RM21,000 of stock B
(d) Sell RM30,000 of stock B
Question 9 was an illustration of the disposition effect, which was the tendency of
individuals to sell stocks whose value had increased, while keeping stocks that had
dropped in value (Shefrin & Statman, 1985). An irrational individual would choose (a).
According to prospect theory, an individual would feel the pain from a loss more
strongly than the pleasure from an equal gain. Selling a stock at a loss would make the
loss ‘final’ along with an admission that the decision to invest in that particular stock
was a mistake. Alternatively, realising a gain would give rise to feelings of pleasure and
pride.
In addition to loss aversion, the feeling of regret had been identified as relevant in the
decision to realise gains or losses (Muermann & Volkman Wise, 2006; O'Curry Fogel
& Berry, 2006). Studies had shown that the feeling of regret from an act of commission
was greater than from an act of omission. This meant that the feeling of regret would be
greater if the stock which was sold at a loss subsequently gained in value, than if the

72
stock was held on with further loss in value. Hence, loss aversion and regret explained
why individuals held on to their paper losses until their investment at least broke-even.
Question 10
Your family has a 5-acre parcel of land in a rural area. This parcel of land has
been in your family for four generations. You are contacted by a real estate agent
who wants to know if you are interested in selling the whole 5 acres for
RM200,000 or any significant portion of the parcel for RM40,000 per acre. The
agent tells you that this is the current market price.
What would be the lowest price you would accept to sell the land?
RM __________ per acre
Question 11
You have RM200,000 and is thinking about owning some rural property. A real
estate agent contacts you to say there is a 5-acre parcel of land in a rural area
available for sale, and that the current market price is around RM40,000 per acre.
What would be the highest price you would offer to buy the land?
RM __________ per acre
Questions 10 and 11 taken together, was an example of the endowment effect. Thaler
(1980) described this behaviour as the tendency of individuals to place a higher value
on objects they owned relative to objects they did not own.
An irrational response would be one where the value given for question 10 would be
higher the value given for question 11. Once an individual owned something, the idea of
giving up the object became a potential loss which would evoke the feeling of pain.
Therefore, when setting the sale price, the individual would likely overvalue the item in
order to compensate for this perceived loss. In addition to loss aversion, the endowment
effect was also linked to the status quo bias. In this case, the preference to do nothing or
to maintain one’s current position could be overcome by setting a higher selling price.
The rational individual would quote the same value for the land in both questions 10
and 11.

73
Question 12
You have an investment portfolio that consists of small-cap stocks of moderate
risk. You recently inherited an investment portfolio that consists of stocks that are
of low risk. What would you do with your newly inherited portfolio of stocks?
(a) Do nothing
(b) Sell the stocks in the portfolio to buy stocks of your choice
Question 12 was adapted from experiments to test for the status quo effect by
Samuelson and Zeckhauser (1988). An irrational individual who chose (a) would be
exhibiting behaviour consistent with the status quo bias. This was the tendency to do
nothing and to keep the investments received rather than to exchange it for other types
of investments. An individual when faced with many investment choices could find the
task of making a decision daunting. As a result, these individuals would choose to avoid
making a decision and do nothing.
Question 13
You have been trying to sell your semi-detached house. Your asking price is
RM500,000 and have rejected offers of RM450,000. After a 6-month period, you
receive a new offer of RM430,000 for your house. The real estate agent tells you
that this is now the market price.
(a) Accept the offer
(b) Reject the offer
Question 13 was adapted from an example in Pompian (2006) on the anchoring bias. An
irrational individual would choose (b). The reference points of value would be the
original asking price of RM500,000 and the last offer price of RM450,000. The
anchoring bias would hinder an individual from incorporating updated information
when making a decision, which in this case would be the market price. In this example,
the fact that the housing market could be softening was not be taken into consideration
when choosing the option to reject the offer.

74
3.4.2. Predictor Variables
The predictor variables were demographic and socio-economic characteristics of the
respondents that were relevant to concept of ‘experience’. The Webster’s Encyclopedic
Unabridged Dictionary of the English Language (1989) defined ‘experience’ as:
The process or fact of personally observing, encountering, or undergoing
something.
The observing, encountering, or undergoing of things generally as they occur in
the course of time.
Knowledge or practical wisdom gained from what one has observed,
encountered, or undergone.
The totality of the cognitions given by perceptions; all that is perceived,
understood, and remembered.
The choice of predictor variables would revolve around this definition.
Table 3.2 is a listing of the predictor variables in the questionnaire along with its
relevance to the concept of experience. Coincidentally, these same variables were used
by financial advisors as heuristic predictors of the financial risk tolerance of investors
(Subedar, 2007). While the use of demographic and socio-economic indicators to assess
financial risk tolerance might still be in practice, the use of psychometric questionnaires
where the outputs were more objective and consistent had become the gold standard.

75
Table 3.2
Predictor Variables
Predictor
Variable
Rationale for Choice of
Variable as a Proxy for
‘Experience’
Commonly Held Beliefs
Pertaining to Financial Risk
Tolerance
Age Older people, over their lifetime,
would have more opportunities to
learn about financial matters,
sometimes from trial and error
Younger investors were more risk
tolerant as they had a longer
investment horizon and the
capacity to recover from losses
Gender Men who were usually the head
of the household would normally
be responsible for and thereby
more experienced in investment
matters
Men were more risk tolerant
Education
Level
Higher levels of education would
enhance ability to understand
financial matters
Individuals with higher levels of
education were more risk tolerant
Ethnicity Not applicable Cultural differences might have
an effect on risk tolerance
Household
Income
Higher income levels would
translate to more disposable
income to engage in investing
activities
Individuals with higher income
levels were more risk tolerant
Type of
Investor
Investment professionals would
naturally have more investing
experience than non-investment
professionals
Individuals with more knowledge
of finance or investment were
more risk tolerant
Years of
Investing
Experience
Self-explanatory
Estimated Net
Worth or Size
of Portfolio
Greater wealth would mean the
individual would have a larger
portfolio of investment assets,
and hence more investing
experience
Individuals with greater wealth
were more risk tolerant as they
had the financial capacity to incur
uncertain returns over a sustained
period of time
Most of the predictor variables were presented with a closed-ended list of responses for
the respondents to choose from, except for ‘age’ and ‘years of investing experience’
which were open-ended. For the closed-ended questions, care was taken to ensure that
the list of responses would be comprehensive enough to capture the required personal
data from the respondents.

76
For the variable ‘investor type’, investment professionals were defined as people who
on a professional basis were engaged in investments in financial assets and/or
evaluation of financial assets for the purpose of investment. Respondents who were
dealers/traders, remisiers, fund managers, investment advisers and financial analysts
would fall under the definition of investment professionals. This list was provided to
ensure that respondents whose line of work involved dealing in financial matters, like
accountants, financial executives etc., would not classify themselves as investment
professionals by mistake. Non-investment professionals were individuals who invested
for their own account rather than on behalf of a third party.
For personal data which were sensitive in nature like ‘income’ and ‘net worth’, broad
categories of responses were offered. For example, the categories for total monthly
household income were <RM5,000, RM5,000 – RM9,999, RM10,000 – RM19,999,
RM20,000 – RM29,999, and ≥RM30,000. Respondents who were usually not
comfortable to disclose specific numbers for such personal data might be more willing
to choose a broad category.
3.4.3. Pre-testing
Another recommended practice in survey research was to run a pilot test of the
questionnaire before the main survey, a procedure known as pre-testing. The process
involved administering the questionnaire to a small group of people from the target
population in order to obtain feedback on the design of the questionnaire; for example
whether the respondents understood what was required from the wording of the
scenarios and response choices, whether there were any questions (including questions

77
on personal information) that the respondents might deem sensitive and were not
willing to provide a response, and what could be done to interest people to participate in
the survey. The pre-test also provided an estimation of the time needed to complete the
questionnaire.
The pre-test for this study was conducted on a group of 20 persons18
that had the
following characteristics:
professional and retail investors;
male and female respondents;
representation from the Bumiputra, Chinese and Indian communities; and
investing experience ranging from less than one year to more than 10 years.
The researcher was present at the pre-test session to respond to any queries on the
decision scenarios and to receive comments on how to improve the decision scenarios
to make them more realistic and relevant.
From the analysis of the results of the pre-test session, the researcher made the
following changes to the pre-test questionnaire:
developed new decision scenarios to replace those scenarios where the results
from the pre-test were not consistent with the behaviour described by prospect
theory; and
revised some of the monetary or reference values in the decision scenarios to
make them more realistic and applicable.
The questionnaire for the main survey is attached as Appendix 3.3. A second pre-test
was not carried out on the final draft of the questionnaire.
18 It was assumed that the pre-test sample size of 20 was appropriate as it was comparable with the sample sizes of some behavioural finance experiments, for example, Vicek and Wang (2007) used 59 undergraduate students and Brown (1995) used 43
undergraduate students.
78
3.4.4. Sampling Design
In social science research, collecting data from every individual in the population under
study would usually not be possible. Instead, data would be collected from a subset of
individuals who fulfilled the requirements of the study, a process known as sampling.
The critical elements in a good survey were (1) a well-worded questionnaire; and (2)
assurance that the right population was being sampled. The former was discussed
above, while the latter would be looked at in the discussions that follow.
There were two general approaches to sampling: random sampling and non-random
sampling. In random sampling, all subjects in the population had the same opportunity
of being included in the sample. The data collected could then be analysed and used to
make inferences about the entire population. Techniques used to select a random sample
were simple random sampling, stratified random sampling, cluster sampling, and
multistage sampling.
In contrast, with non-random sampling, subjects were usually selected based on
availability or the researcher’s judgement of the subject’s representativeness. Hence,
there could be a proportion of the population that might not be sampled, and as a result
the sample might or might not accurately represent the entire population. The more
commonly used techniques to select a non-random sample were convenience sampling,
quota sampling, judgemental sampling, and snowball sampling.
The researcher decided to adopt a non-random sampling approach, using snowball
sampling, as the means to collect primary quantitative data for this study. While most

79
survey research guidelines recommended the use of random sampling, the researcher
was of the view that was neither practical nor necessary to use probability sampling for
the following reasons:
i. There was no official statistics or information with regard to the sampling frame.
The target population was people with experience in investing activities or had
knowledge of finance and investment matters.
ii. The aim of the study was to examine a particular trait within the target
population, i.e. financial decision-making behaviour.
iii. It was not the primary concern of the study to generalise the findings to the
entire population.
iv. Binomial logistic regression would be the main method used for data analysis.
This statistical technique made no assumptions about the distribution of the
sample population.
Furthermore, one advantage of non-random sampling was that it was relatively easy to
conduct and was cost effective.
Snowball sampling was chosen over the other non-random sampling techniques for the
following reasons:
i. The purposive nature of the snowball sampling technique in identifying the
initial and subsequent sets of respondents would ensure that the right individuals
in the target population would be sampled. It had the ability to specifically reach
the target population compared to other sampling methods.
ii. The referral feature of the snowball sampling technique could act as a form of
‘peer pressure’ to get people to participate in the study.
This sampling technique was also compatible with the data collection strategy of
distributing the questionnaire via the internet.

80
3.4.5. Survey Strategy
Data collection was carried out via a dual mode strategy; where the questionnaires were
distributed through email and by hand. This two-pronged approach was adopted to
increase coverage of the target population as not everyone in the target population
would have access to the internet.
The first set of relevant respondents who received the questionnaire by email were
selected from individuals who worked in financial institutions like commercial and
investment banks, insurance companies, fund management companies, stock broking
companies, financial advisory companies, rating agencies and regulatory bodies. These
individuals were requested to respond to the questionnaire and/or forward it to their
colleagues, clientele and acquaintances who might be interested to participate in the
survey. In order to keep the transmission process going, the researcher would request
individuals who returned the completed questionnaire to recruit other individuals. This
non-random sampling approach was known as exponential non-discriminative snowball
sampling. It was assumed that the likelihood of duplicates in the responses would be
low because the specific nature of the survey questionnaire would trigger recognition in
individuals who had already responded.
It was assumed that investment professionals as defined would be a small subset of the
target population. The strategy to go for financial institutions first was to obtain enough
responses from this subgroup in order to run meaningful correlation and regression
analyses on the sample. The initial requests were also targeted at the more senior
members of the financial institutions as subsequent referrals from this group of

81
individuals would be more persuasive in soliciting participation from their staff and
colleagues.
Printed questionnaires were also given to individuals who were not in the researcher’s
email list. These individuals were also given extra copies of the questionnaire to be
passed on to other people in a bid to increase the sample size. Most of the responses
from the printed questionnaires came from groups of graduate management trainees in a
local banking group. These groups of individuals were targeted to provide some
variance in the sample with respect to age and years of investing experience. Not all the
management trainees were fresh graduates, and due to the fact that they had been
selected to work in a financial institution, they would have had some prior knowledge
and exposure to financial and investment matters regardless of their investment
experience.
The survey period which was approximately eight weeks ended when no responses
were received, either by email or by hand, within a two-week period. A total of 284
responses were received, out of which 56 came from the printed questionnaires.
Comments from some of the respondents via email revealed that they appreciated the
feedback on their responses to the scenarios in the questionnaire in the form of
Appendix 3.2. Unlike other surveys that these respondents had participated in where no
feedback was given, in this survey, they learnt something about the psychology behind
investing decisions.
This could have been a contributing factor in building participation during the sampling
period, and was consistent with the finding by Edwards et al. (2002) that response rates
increased when incentives were offered for completing and returning the questionnaire.

82
Surveys which did not incorporate some form of human interaction like face-to-face or
telephone interviews, would typically experience low response rates as the received
questionnaires could be ignored or thrown aside.
While assurance of confidentiality of responses was given in the introduction to the
questionnaire, the channel used for data collection also provided some form of
anonymity. Respondents who did not wish to reveal their identities could return the
questionnaire using unidentifiable email addresses. There was also nothing in the
printed questionnaires to identify it with the respondent. This could have played a part
in the relatively low rate of ‘missing’ data for each item in the questionnaire, i.e. around
1% of the sample. Only the variables ‘total monthly household income’, ‘years of
investing experience’ and ‘estimated net worth’ recorded missing data of 12 (4.2%), 15
(5.3%) and 22 (7.7%) respectively. The higher rate of missing data for the variable
‘estimated net worth’ could have been that the respondents were unsure of the meaning
of net worth. A brief definition should have been provided in the questionnaire.
3.4.6. Sample Size
Another important consideration in conducting a survey would be determination of the
sample size. According to Lenth (2001) a sample that was too small might not have
enough data points to produce useful findings, while a sample that was too large would
be a waste on the resources allocated in carrying out the survey. In general, an
appropriate size would be one that should be large enough to show some variability in
the attributes being measured.

83
Literature on sampling techniques proposed several methods to determine an
appropriate sample size. Some of these methods include sampling the entire population
if it was small enough, use the same sample size of similar studies, use published tables
and apply formulas to calculate the sample size. For this study, it would not be feasible
to conduct a census on the target population, and published tables and formulas were
not applicable for non-random samples. However the sample size for this study, which
was 284 respondents, was comparable with other studies in behavioural finance as
shown in Table 3.3.
Table 3.3
Experiments in Behavioural Finance
Year Author Study Sample Size
Responding to hypothetical scenarios
2007 Markus Glaser,
Martin Weber
Why inexperienced investors do
not learn: They do not know their
past portfolio performance
215 online broker
investors
2006 Lukas Menkhoff,
Ulrich Schmidt,
Torsten
Brozynski
The impact of experience on risk
taking, overconfidence, and
herding of fund managers:
Complementary survey evidence
117 German fund
managers
2005 Masashi
Toshino,
Megumi Suto
Cognitive biases of Japanese
Institutional Investors: Consistency
with Behavioral Finance
488 respondents
from 48 financial
institutions
2003 E. Asgeir
Juliusson
Effects of gain and loss frame on
escalation
80 undergraduates at
Goteborg University
1988 William
Samuelson,
Richard
Zeckhauser
Status quo bias in decision making 486 students at
Boston University
School of
Management &
Kennedy School of
Government at
Harvard University

84
Table 3.3, continued
Experiments in Behavioural Finance
Year Author Study Sample Size
Playing decision games
2007 Martin Vicek,
Mei Wang
The disposition effect in the lab 59 students from
University of Zurich
and Swiss Federal
Institute of
Technology Zurich
2005 Martin Weber,
Heiko Zuchel
How do prior outcomes affect risk
attitude? Comparing escalation of
commitment and the house-money
effect
133 undergraduate
students majoring in
economics or
business
administration
2003 Maria L.
Loureiro, Wendy
J. Umberger,
Susan Hine
Testing the initial endowment
effect in experimental auctions
85 undergraduate
students
1998 Martin Weber,
Colin F.
Camerer
The disposition effect in securities
trading: an experimental analysis
29 engineering
students from
Auchen University
35 business & 39
economic graduate
students from
University of Kiel
1995 Paul M. Brown Learning from experience,
reference points, and decision costs
43 undergraduates at
the University of
Massachusetts
3.5. Selection of Case Studies
The hypothesis behind this study was that experience could play a role in tempering the
influence of behavioural biases in decision-making, which in this case would be
finance-related decisions. Investment professionals by virtue of their employment,
knowledge, and accessibility to financial information and analytical tools should be
more objective and rational in their choice of a strategy for their financial transactions.
Yet, incidences where investment professionals intentionally hid unauthorised trading
positions from their respective institutions, which subsequently turned into huge losses

85
continued to surface. For example, in February 2008, the actions of Jérôme Kerviel, an
employee of Société Générale, managed to grip the attention of the global financial
community when he was alleged to have been responsible for a net loss of €4.9 billion,
which was by far the largest trading loss by an individual at that point in time.
One recognised weakness of the cross-sectional quantitative approach was that
conclusions of cause-effect relationships could be open to question. The correlation and
regression analysis conducted on the survey data would, at best, serve to provide a static
view of the interactions between the behavioural biases under study and the selected
demographic and socio-economic variables. On the other hand, the investigative
element in case study research, where the analysis would be based on the facts and
circumstances surrounding an actual event, would complement the statistical findings
and provide a better understanding of the behavioural and cognitive motivations behind
the irrational and destructive actions of a few individuals in the financial services
industry. The analysis of the selected case studies would be two-fold, i.e. to identify:
i. common trends or characteristics in the rogue trading19
cases; and
ii. behavioural biases and emotional influences behind the conduct of the rogue
traders.
The focus of the selected case studies, therefore, would be individuals who engaged in
unauthorised trading or investment activities on behalf of financial institutions, and
whose actions had resulted in massive losses to their respective institutions. It would,
however, not include incidences of managerial misjudgement like Enron and
19 The Oxford Pocket Dictionary of Current English (2006) defined a rogue trader as a securities trader who attempts to hide
tremendous losses suffered on speculative trading.

86
WorldCom or fraudulent activities like the Ponzi scheme20
operated by Bernard Madoff.
This would be consistent with the definition of investment professionals in Section 3.4.2
so that the findings from the case studies would be able to augment the findings from
the survey.
Five case studies were selected for this study and the criteria for selection were as
follows:
High-profile financial scandals which were widely reported in the media. Such
cases would be information rich, with observations reported from various
perspectives.
Where possible, from different locations in the global financial community.
Results that could be replicated under different regulatory regimes and state of
development of the capital markets would lend credibility to the accuracy,
validity and reliability of the conclusions of the study, even though Yin (1994)
emphasised that multiple-case studies should follow a replication and not a
sampling logic.
The data for the selected case studies would be solely from secondary sources like
media reports, research studies and authorised accounts initiated by the relevant
regulatory agency or board of directors of the affected financial institution. Where there
were authorised reports, these would form the basis for the analysis of the case with
contributions from other media reports as supplementary information. It was assumed
that the description of the case from authorised reports would be more objective and
where the official findings would not be biased in any manner. Collection from primary
20The US Securities and Exchange Commission described a Ponzi scheme as a fraudulent investment operation where investors
would be promised high returns for their capital. The payment of these purported returns would come from money contributed by new investors. Such schemes tend to collapse when it becomes difficult to recruit new investors or when a large number of investors
decide to exit from the scheme.

87
sources was not applicable as there was no financial scandal that fall within the scope of
this study in Malaysia.
3.6. Summary
The methodology adopted for this study was that of a mixed methods approach, where
quantitative data was collected from a survey questionnaire and qualitative data
collected from case studies of rogue trading incidences. In the design and conduct of the
data collection process, care was taken by the researcher to ensure that, wherever
possible, issues on the accuracy and reliability of the quantitative and qualitative
datasets would be addressed. Greater care was taken in the implementation of the
survey as the data was from primary sources and the researcher was aware of the
importance of getting it right the first time.
Creswell and Plano Clark (2007) proposed three ways of mixing the datasets in the
analysis:
i. merging or converging the quantitative and qualitative datasets;
ii. connecting the two datasets where the findings from one dataset would build on
the other; and
iii. embedding one dataset within the other.
The researcher chose approach (ii), where the discussion in the Chapter 4 would be on
the findings from the survey data based on statistical analysis using chi square tests and
binomial logistic regression. The findings from the statistical analysis would then be
‘mixed’ with the results from the examination of the case studies in Chapter 5 in order
to form a more complete understanding of the research problem, i.e. the decision-
making behaviour of investment professionals under risk and uncertainty.