chapter 3 present situation of major egyptian ports 3.1
TRANSCRIPT
3 - 1
Chapter 3 Present situation of major Egyptian ports 3.1 Outline of Egyptian ports There are five major commercial ports in Egypt, namely Greater Alexandria Port (Alexandria and Dekheila port), Damietta Port, Port Said Port, Suez Port (including Adabiya Port) and Safaga Port. More than 90% of maritime traffic handled at commercial ports under the control of Ministry of Transport involves the five major ports in 1999. Sidi Kerir Port and Ain Sukhna Port are connected with the Suez Mediterranean Pipeline (SUMED) which is in close relation with the Canal traffic. As for container cargo, Greater Alexandria Port, Damietta Port and Port Said Port are the main container handling ports. In addition, Ain Sukhna Port and Adabiya Port opened new container terminals recently.
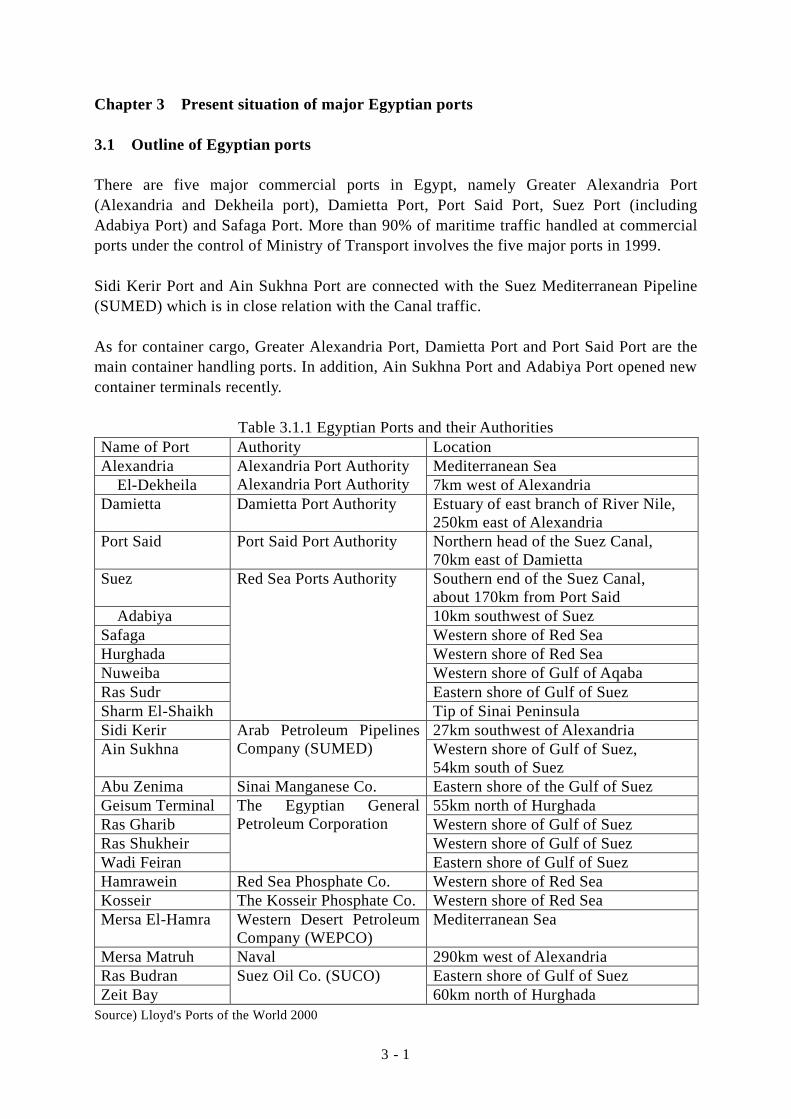
Table 3.1.1 Egyptian Ports and their Authorities Name of Port Authority Location Alexandria Mediterranean Sea El-Dekheila
Alexandria Port Authority Alexandria Port Authority 7km west of Alexandria
Damietta Damietta Port Authority Estuary of east branch of River Nile, 250km east of Alexandria
Port Said Port Said Port Authority
Northern head of the Suez Canal, 70km east of Damietta
Suez Southern end of the Suez Canal, about 170km from Port Said
Adabiya 10km southwest of Suez Safaga Western shore of Red Sea Hurghada Western shore of Red Sea Nuweiba Western shore of Gulf of Aqaba Ras Sudr Eastern shore of Gulf of Suez Sharm El-Shaikh
Red Sea Ports Authority
Tip of Sinai Peninsula Sidi Kerir 27km southwest of Alexandria Ain Sukhna
Arab Petroleum Pipelines Company (SUMED) Western shore of Gulf of Suez,
54km south of Suez Abu Zenima Sinai Manganese Co. Eastern shore of the Gulf of Suez Geisum Terminal 55km north of Hurghada Ras Gharib Western shore of Gulf of Suez Ras Shukheir Western shore of Gulf of Suez Wadi Feiran
The Egyptian General Petroleum Corporation
Eastern shore of Gulf of Suez Hamrawein Red Sea Phosphate Co. Western shore of Red Sea Kosseir The Kosseir Phosphate Co. Western shore of Red Sea Mersa El-Hamra Western Desert Petroleum
Company (WEPCO) Mediterranean Sea
Mersa Matruh Naval 290km west of Alexandria Ras Budran Eastern shore of Gulf of Suez Zeit Bay
Suez Oil Co. (SUCO) 60km north of Hurghada
Source) Lloyd's Ports of the World 2000

3 - 2
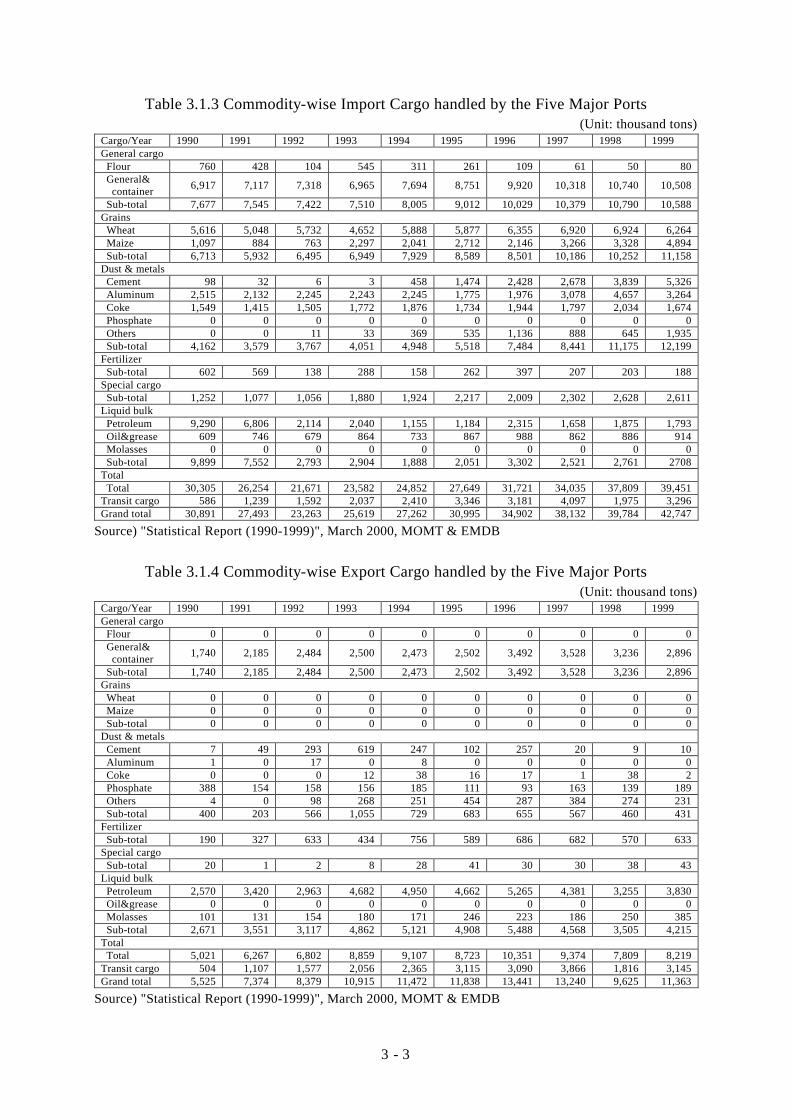
3.1.1 Cargo throughput Cargo handled in the five major ports increased steadily for the last 7 years reaching 54.1 million tons in 1999 as shown in Table 3.1.2. Among the five major ports, Greater Alexandria Port handled a cargo volume of 28.1 million tons accounting for 51.8% of the total cargo volume of the five major ports, followed by Damietta Port (22.4%), Suez Port (11.9%), Port Said Port (9.6%) and Safage Port (4.2%). The volume of import cargo has been greater than that of export cargo, while import cargo has rapidly increased for the last 7 years and export cargo has leveled off for the last 5 years. The major import commodities are general & container cargo, accounting for 10.5 million tons (24.6% of total import volume), wheat accounting for 6.2 million tons (14.7%), cement accounting for 5.3 million tons (12.5%) and maize accounting for 4.9 million tons (11.4%) in 1999 as shown in Table 3.1.3. On the other hand, the major commodity of export is petroleum accounting for 3.8 million tons (33.7% of total export volume), transit cargo accounting for 3.1 million tons (27.7%) and general & container accounting for 2.9 million tons (25.5%) in 1999 as shown in Table 3.1.4.
Table 3.1.2 Total Cargo handled by the Five Major Ports (Unit: thousand tons)
Port/Year 1990 1991 1992 1993 1994 1995 1996 1997 1998 1999 Greater Alexandria Total 21,719 21,401 16,700 20,575 20,313 21,604 22,461 24,815 27,883 28,056 Import 18,274 17,165 12,460 15,594 14,984 16,764 17,915 19,944 23,274 22,878 Export 3,445 4,236 4,240 4,981 5,329 4,840 4,546 4,871 4,609 5,178 Port Said Total 3,057 2,933 3,267 3,230 4,571 6,479 6,183 6,945 4,553 5,214 Import 2,303 2,193 2,344 1,987 3,164 4,407 3,873 4,332 3,195 3,098 Export 754 740 923 1,243 1,407 2,072 2,310 2,613 1,358 2,116 Damietta Total 2,917 3,276 5,190 5,110 7,366 8,923 11,696 14,052 10,704 12,122 Import 2,636 2,544 3,789 3,476 5,340 6,722 8,516 10,299 8,824 9,600 Export 281 732 1,401 1,634 2,026 2,201 3,180 3,753 1,880 2,521 Suez Total 6,709 5,623 4,887 5,514 4,541 4,330 6,045 4,098 4,040 6,454 Import 6,063 4,111 3,412 3,131 2,368 2,106 3,185 2,557 2,687 5,279 Export 646 1,512 1,475 2,383 2,173 2,224 2,860 1,541 1,353 1,175 Safaga Total 2,014 1,634 1,598 2,105 1,943 1,397 1,958 1,463 2,228 2,266 Import 1,615 1,480 1,258 1,431 1,406 896 1,413 1,001 1,803 1,893 Export 399 154 340 674 537 501 545 462 425 373 Grand Total Total 36,416 34,867 31,642 36,534 38,734 42,733 48,343 51,373 49,408 54,111 Import 30,891 27,493 23,263 25,619 27,262 30,895 34,902 38,133 39,783 42,748 Export 5,525 7,374 8,379 10,915 11,472 11,838 13,441 13,240 9,625 11,363
Source) "Statistical Report (1990-1999)", March 2000, MOMT & EMDB
Remarks) Transit cargo is included in this table.
3 - 3
Table 3.1.3 Commodity-wise Import Cargo handled by the Five Major Ports (Unit: thousand tons)
Cargo/Year 1990 1991 1992 1993 1994 1995 1996 1997 1998 1999 General cargo Flour 760 428 104 545 311 261 109 61 50 80 General&
container 6,917 7,117 7,318 6,965 7,694 8,751 9,920 10,318 10,740 10,508
Sub-total 7,677 7,545 7,422 7,510 8,005 9,012 10,029 10,379 10,790 10,588 Grains Wheat 5,616 5,048 5,732 4,652 5,888 5,877 6,355 6,920 6,924 6,264 Maize 1,097 884 763 2,297 2,041 2,712 2,146 3,266 3,328 4,894 Sub-total 6,713 5,932 6,495 6,949 7,929 8,589 8,501 10,186 10,252 11,158 Dust & metals Cement 98 32 6 3 458 1,474 2,428 2,678 3,839 5,326 Aluminum 2,515 2,132 2,245 2,243 2,245 1,775 1,976 3,078 4,657 3,264 Coke 1,549 1,415 1,505 1,772 1,876 1,734 1,944 1,797 2,034 1,674 Phosphate 0 0 0 0 0 0 0 0 0 0 Others 0 0 11 33 369 535 1,136 888 645 1,935 Sub-total 4,162 3,579 3,767 4,051 4,948 5,518 7,484 8,441 11,175 12,199 Fertilizer Sub-total 602 569 138 288 158 262 397 207 203 188 Special cargo Sub-total 1,252 1,077 1,056 1,880 1,924 2,217 2,009 2,302 2,628 2,611 Liquid bulk Petroleum 9,290 6,806 2,114 2,040 1,155 1,184 2,315 1,658 1,875 1,793 Oil&grease 609 746 679 864 733 867 988 862 886 914 Molasses 0 0 0 0 0 0 0 0 0 0 Sub-total 9,899 7,552 2,793 2,904 1,888 2,051 3,302 2,521 2,761 2708 Total Total 30,305 26,254 21,671 23,582 24,852 27,649 31,721 34,035 37,809 39,451 Transit cargo 586 1,239 1,592 2,037 2,410 3,346 3,181 4,097 1,975 3,296 Grand total 30,891 27,493 23,263 25,619 27,262 30,995 34,902 38,132 39,784 42,747
Source) "Statistical Report (1990-1999)", March 2000, MOMT & EMDB
Table 3.1.4 Commodity-wise Export Cargo handled by the Five Major Ports
(Unit: thousand tons) Cargo/Year 1990 1991 1992 1993 1994 1995 1996 1997 1998 1999 General cargo Flour 0 0 0 0 0 0 0 0 0 0 General&
container 1,740 2,185 2,484 2,500 2,473 2,502 3,492 3,528 3,236 2,896
Sub-total 1,740 2,185 2,484 2,500 2,473 2,502 3,492 3,528 3,236 2,896 Grains Wheat 0 0 0 0 0 0 0 0 0 0 Maize 0 0 0 0 0 0 0 0 0 0 Sub-total 0 0 0 0 0 0 0 0 0 0 Dust & metals Cement 7 49 293 619 247 102 257 20 9 10 Aluminum 1 0 17 0 8 0 0 0 0 0 Coke 0 0 0 12 38 16 17 1 38 2 Phosphate 388 154 158 156 185 111 93 163 139 189 Others 4 0 98 268 251 454 287 384 274 231 Sub-total 400 203 566 1,055 729 683 655 567 460 431 Fertilizer Sub-total 190 327 633 434 756 589 686 682 570 633 Special cargo Sub-total 20 1 2 8 28 41 30 30 38 43 Liquid bulk Petroleum 2,570 3,420 2,963 4,682 4,950 4,662 5,265 4,381 3,255 3,830 Oil&grease 0 0 0 0 0 0 0 0 0 0 Molasses 101 131 154 180 171 246 223 186 250 385 Sub-total 2,671 3,551 3,117 4,862 5,121 4,908 5,488 4,568 3,505 4,215 Total Total 5,021 6,267 6,802 8,859 9,107 8,723 10,351 9,374 7,809 8,219 Transit cargo 504 1,107 1,577 2,056 2,365 3,115 3,090 3,866 1,816 3,145 Grand total 5,525 7,374 8,379 10,915 11,472 11,838 13,441 13,240 9,625 11,363
Source) "Statistical Report (1990-1999)", March 2000, MOMT & EMDB

3 - 4
3.1.2 Container cargo throughput The container cargo volume in TEUs handled in the five major ports account for 837 thousand TEUs of local containers and 684 thousand TEUs of transshipment containers respectively in 1999. Transshipment container cargo volume has decreased to 684 thousand TEUs in 1999 after peaking at 861 thousand TEUs in 1997, while local container cargo volume has gradually increased to 837 thousand TEUs in 1999 from 237 thousand TEUs in 1990.
Table 3.1.5 Container Cargo handled by the Five Major Ports (Unit: thousand TEUs)
Cargo/Year 1990 1991 1992 1993 1994 1995 1996 1997 1998 1999 Greater Alexandria 228 296 237 258 289 304 327 397 516 629 Import+Export 191 213 229 247 284 302 325 389 493 586 Transshipment 37 83 7 11 5 2 2 8 23 43 Import 100 109 118 131 149 156 167 204 263 310 Transshipment 20 41 3 5 2 1 1 4 12 21 Export 91 104 112 116 135 146 158 185 230 276 Transshipment 18 42 4 5 2 1 1 4 11 22 Port Said 55 61 118 171 184 324 336 415 270 410 Import+Export 39 46 62 62 65 79 95 104 128 144 Transshipment 16 15 56 109 119 246 241 311 142 266 Import 19 23 31 30 33 39 47 52 62 66 Transshipment 8 8 28 55 60 126 121 157 73 136 Export 20 22 31 32 32 39 49 52 65 78 Transshipment 8 7 28 54 59 120 120 154 69 130 Damietta 61 208 324 422 518 597 585 607 310 432 Import+Export 0 0 3 12 29 46 49 65 62 58 Transshipment 61 208 321 410 489 551 536 542 248 374 Import 0 0 0 5 13 23 21 27 31 33 Transshipment 31 106 162 206 247 280 268 273 122 185 Export 0 0 2 7 16 23 28 38 30 25 Transshipment 30 102 159 204 242 270 268 269 125 189 Suez 8 3 5 4 8 9 17 13 37 49 Import+Export 8 3 5 4 8 9 17 13 37 49 Transshipment 0 0 0 0 0 0 0 0 0 0 Import 4 3 3 2 5 6 9 7 23 36 Transshipment 0 0 0 0 0 0 0 0 0 0 Export 4 1 2 2 3 4 8 5 14 13 Transshipment 0 0 0 0 0 0 0 0 0 0 Grand Total 352 568 683 854 998 1,235 1,266 1,432 1,132 1,521 Import+Export 237 262 299 324 386 436 487 571 720 837 Transshipment 114 306 384 530 612 799 779 861 412 684 Import 123 136 152 168 201 224 244 290 380 445 Transshipment 59 154 194 266 309 407 390 435 207 343 Export 115 127 147 156 186 212 243 280 340 392 Transshipment 56 152 190 264 303 391 389 427 206 341
Source) "Statistical Report (1990-1999)", March 2000, MOMT & EMDB
3.1.3 Port management and operation Ministry of Maritime Transport (MOMT) supervises overall administration of port management and controls port authorities. Port authorities are in charge of planning, construction of port facilities, securing navigation security and marine services in the port. Alexandria Port Authority (APA) controls Alexandria and El-Dekheila Port. Damietta Port Authority (DPA) controls Damietta Port. Port Said Port Authority (PSPA) controls Port Said Port. Port authorities own land and facilities in their port area and lease them to State-owned companies and private companies and collect fees from them.

3 - 5
State-owned companies perform cargo handling operation as shown in Table 4.1.6. State-owned companies of No.1-6 are under the control of the Holding Company for Maritime Transport. State-owned companies of No.7-9 are under the control of the Holding Company of Inland Transport. The Holding Company for Maritime Transport and the Holding Company of Inland Transport are under the control of Ministry of Public Enterprises of Egyptian Government.
Table 3.1.6 State-owned Companies No. Name of State-owned company Activity 1 United Arab Stevedoring Company loading/unloading break bulk cargo 2 Alexandria Container Handling
Company container handling operation at the container terminal in Alexandria Port and El-Dekheila Port
3 General Warehouse Company storing cargoes at warehouses in Alexandria Port
4 Thebe and Abu Simbel Shipping Agencies
shipping agent
5 Amon Shipping Agencies shipping agent 6 Memphis Shipping Agencies shipping agent 7 Damietta Container and Cargo
Handling Company container and break bulk cargo handling operation in Damietta Port
8 Port Said Container and Cargo Handling Company
container, dry bulk cargo and general cargo handling operation in Port Said Port
9 Canal Shipping Agency forwarding necessary procedure for joining the convoy passing through the Canal on behalf of shipping lines or ship owners
3.1.4 Private participation and privatization in maritime transport sector While state-owned companies have provided maritime transport services, Resolution 30/1998 allows the private sector to participate in the following maritime transport services.
- stevedoring work for grains and general cargo (permission period: 15 years) - shipping agent (permission period: 3 years) - ship chandler and marine supplies (permission period: 2 years) - ship repair, maintenance and marine works (permission period: 2 years) - warehouse (permission period: 10 years) - container handling (permission period: 10 years)
The National Assembly approved the privatization of maritime transport companies in December 1998. For example, after the sale of stock, the ownership structure of the United Arab Stevedoring Company changed as follows.
Government share 41% The company's employee shareholding association 8% Private owner 51%
3 - 6
3.2 Greater Alexandria Port (Alexandria and El-Dekheila) The port area is divided into six Customs Zones stipulated by the Resolution No.618/1997. The first Zone is a district between berths No.5 and No. 15, including general cargo berths, repairing floating units and marine service berths. The second Zone is a district between berth No.16 and No.31, including passenger terminal as well as general cargo and Ro-Ro berths. The third Zone is a district between berths No.33 and No.47, including general cargo and barge cargo berths. The fourth Zone is a district between berths No.49 and No.68, including container terminal as well as barge cargo, coal, fertilizer and cement berths. The fifth Zone is a district between berths No.71 and No.85, including grain terminal as well as timber, barge cargo and molasses berths. The sixth Zone is a district between berths No.87/1, 87/2, 87/3, 87/4, 87/5 and No.86, including petroleum products and vegetable oil berths. In order to cope with the needs for upgrading the port services of Alexandria Port, an economic study was carried out in 1980 for possible establishment of a new port at El-Dekheila. The study made it clear that the expansion of Alexandria port facilities at El-Dekheila was economically and financially feasible. The project of new port expansion at El-Dekheila was initiated in 1982 under a two - phase construction scheme. The first phase construction was scheduled to be implemented from 1994 to 1999 for constructing raw material berth, container berth and general cargo berth. The implementation of second phase construction has been suspended. 3.2.1 Port facilities (1) Container terminal of Alexandria Port The container terminal is operated by Alexandria Container Handling Company. There are three container berths (No.49, 51 and 53) of which total length is 560m and one Ro-Ro berth (No.54) of which length is 160m. Berth depth is practically maintained at 12.0m though design depth is 14.0m. Potential handling capacity of Alexandria Container Terminal is expected to be 400 thousand to 450 thousand TEUs by introducing additional container handling equipment. (2) Grain terminal of Alexandria Port The grain terminal is operated by Alexandria General Company for Silos and Storage. There are three grain berths (No.82, 84 and 85) of which length and depth are 535m and 10.0m respectively. A new grain berth (315m length and 14.0m depth) is planned adjacent to the timber breakwater. (3) Coal terminal of Alexandria Port The coal terminal is operated by El-Nasre Company for Coal and Cokes. There are four coal berths (No.61, 62, 63 and 64) of which total length and depth are 600m and 10.0m respectively.

3 - 7
(4) Petroleum terminal of Alexandria Port There are five petroleum berths (No.87/1, 87/2, 87/3, 87/4, 87/5) of which total length and depth are 762m and 10.0m - 12.0m respectively. The terminal handles butane, lubricant oil, petroleum gas, vegetable oil, LPG, fuel oil, jet oil and naphtha. (5) General cargo berth of Alexandria Port There are 31 general cargo berths of which total length and depth are 3,804m and 5.5m - 12.0m respectively. (6) Approach channel of Alexandria Port Alexandria Port is protected by marine rocks and two breakwaters. The entrance to the inner harbor is approximately 400m in weedth. Outer harbor channel from the harbor entrance to the inner harbor is maintained to be 220m in width and 14.0m in depth. (7) Container terminal of El-Dekheila Port El-Dekheila Container Terminal is also operated by Alexandria Container Handling Company. There are four container berths (No.96/1, 96/2, 96/3 and 96/4) of which total length and depth are 1,000m and 12.0m - 14.0m respectively. Potential handling capacity of El-Dekheila Container Terminal is expected to be 1.0 million TEUs. (8) General cargo berth of El-Dekheila Port Berth No.92 of which length and depth are 300m and 15.0m respectively is prepared as general cargo berth. However, bulk carrier carrying maize often uses these berths. (9) Grain terminal of El-Dekheila Port There are two grain berths (No.94/1 and 94/2) of which total length and depth are 490m and 14.0m respectively. (10) Iron ore and coal terminal of El-Dekheila Port There are two berths (No.90/1 and 90/2). Berth length and depth of berth No.90/1 is 375m and 20.0m respectively. Berth length and depth of berth No.90/2 is 255m and 14.0m respectively. (11) Approach channel of El-Dekheila Port The main channel in El-Dekheila Port is 2,800m in length, 250m in width and 24.0m in depth.
3 - 8
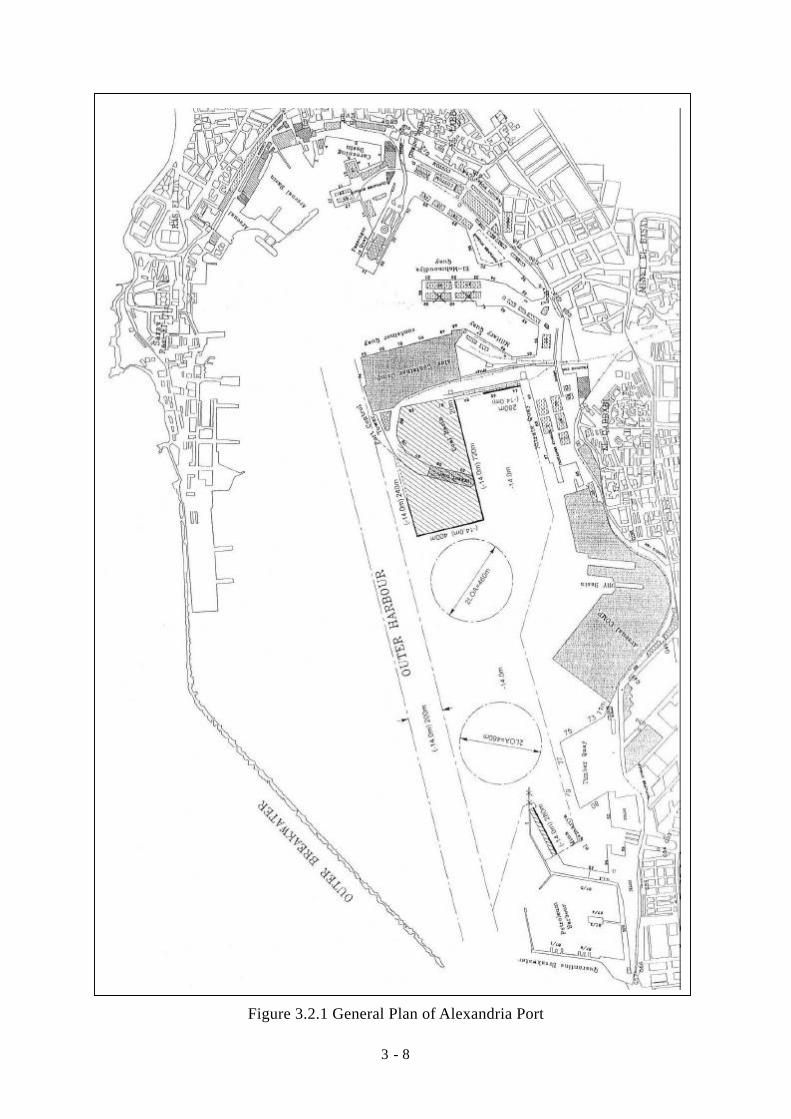
Figure 3.2.1 General Plan of Alexandria Port

3 - 9
Figure 3.2.2 General Plan of El-Dekheila Port

3 - 10
Table 3.2.1 Outline of Major Terminals of Alexandria Port 1. Container Terminal Quay Berth 3B(560m length and 14.0m (maintained 12.0m) depth)
1B(Ro-Ro, 160m length and 14.0m (md.12.0m) depth) Area 163,000 sq.m Ground Slot Approx. 3,000 TEUs Reefer Point - QGCs 3 (Outreach:35m, Underspreader:25m, Railspan:15m) RTGs 6 Toplifters 10 (Capacity:42-45 tons)
Terminal
Forklift 15 (Capacity:2@37 [email protected]+2@4tons) 2. Grain Terminal Quay Berth 3B(190m+165m+180m length and 10.0m depth)
3 for No.84 (Disch. rate: 150 tons/hour/unloader) 2 for No.85 (Disch. rate: 250 tons/hour/unloader)
Unloader
1 mobile (Disch. rate: 150 tons/hour/unloader)
Terminal
Silo 2 (Capacity: 100,000 tons + 50,000 tons)
3. Coal Terminal Quay Berth 4B(600m length and 10.0m depth)
Cranes 3 (Disch. rate: 150-200 tons/hour/crane for coal, 100 tons/hour/crane for cokes)
Terminal
Open yard 30,000 sq.m (Stacking capacity: 80,000 tons for coal + 30,000 tons for coaks)
4.Petroleum Terminal Quay Berth 2B@(236m +136m length and 10.0m depth)
3B@(148m + 148m + 94m length and 12.0m depth) 5. General Cargo Berth Quay Berth 3,804m length and 5.5-12.0m depth)
Source) "Egyptian Ports Information", March 2000, MOMT & EMDB, Alexandria Port Authority, Alexandria Container Handling Company, Alexandria General Company for Silo and Storage,
El-Nasre Company for Coal and Cokes and Alexandria Petroleum Company
3 - 11
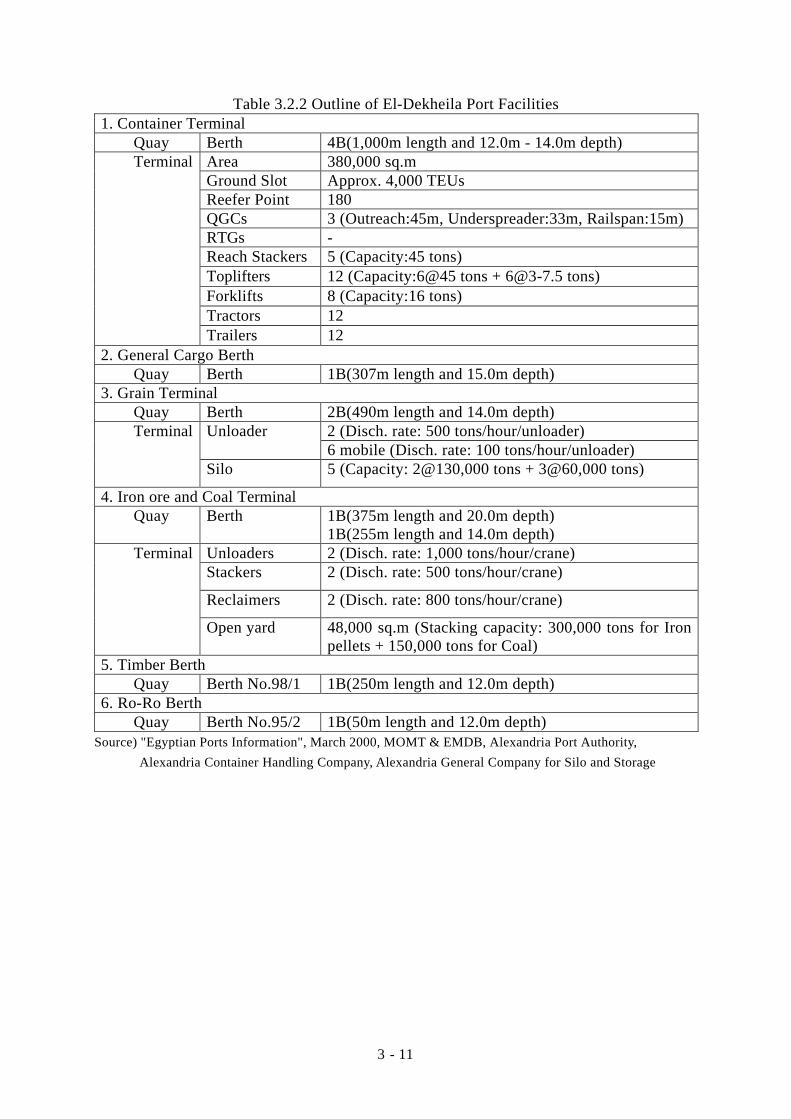
Table 3.2.2 Outline of El-Dekheila Port Facilities 1. Container Terminal Quay Berth 4B(1,000m length and 12.0m - 14.0m depth)
Area 380,000 sq.m Ground Slot Approx. 4,000 TEUs Reefer Point 180 QGCs 3 (Outreach:45m, Underspreader:33m, Railspan:15m) RTGs - Reach Stackers 5 (Capacity:45 tons) Toplifters 12 (Capacity:6@45 tons + [email protected] tons) Forklifts 8 (Capacity:16 tons) Tractors 12
Terminal
Trailers 12 2. General Cargo Berth Quay Berth 1B(307m length and 15.0m depth) 3. Grain Terminal Quay Berth 2B(490m length and 14.0m depth)
2 (Disch. rate: 500 tons/hour/unloader) Unloader 6 mobile (Disch. rate: 100 tons/hour/unloader)
Terminal
Silo 5 (Capacity: 2@130,000 tons + 3@60,000 tons)
4. Iron ore and Coal Terminal Quay Berth 1B(375m length and 20.0m depth)
1B(255m length and 14.0m depth) Unloaders 2 (Disch. rate: 1,000 tons/hour/crane) Stackers 2 (Disch. rate: 500 tons/hour/crane)
Reclaimers 2 (Disch. rate: 800 tons/hour/crane)
Terminal
Open yard 48,000 sq.m (Stacking capacity: 300,000 tons for Iron pellets + 150,000 tons for Coal)
5. Timber Berth Quay Berth No.98/1 1B(250m length and 12.0m depth) 6. Ro-Ro Berth Quay Berth No.95/2 1B(50m length and 12.0m depth)
Source) "Egyptian Ports Information", March 2000, MOMT & EMDB, Alexandria Port Authority, Alexandria Container Handling Company, Alexandria General Company for Silo and Storage

3 - 12
3.2.2 Cargo throughput Total volume of import and export cargoes handled through Alexandria Port in 1999 amount to 22,878 thousand tons and 5,178 tons respectively as shown in Table 3.2.3 and Table 3.2.4.
Table 3.2.3 Commodity-wise Import Cargo handled at Greater Alexandria Port (Unit: thousand tons)
Cargo/Year 1990 1991 1992 1993 1994 1995 1996 1997 1998 1999 General cargo Flour 640 428 104 502 285 257 84 37 44 46 General&
container 5,443 5,390 5,520 5,765 6,200 6,925 7,044 7,198 8,008 7,507
Sub-total 6,083 5,818 5,624 6,267 6,485 7,182 7,128 7,234 8,052 7,553 Grains Wheat 1,212 844 1,154 1,014 820 1,393 1,456 1,998 2,442 2,223 Maize 94 0 410 1,875 1,584 1,849 1,468 2,077 2,257 3,417 Sub-total 1,306 844 1,564 2,889 2,404 3,242 2,924 4,075 4,699 5,641 Dust & metals Cement 0 0 0 0 0 338 1,059 976 1,283 1,759 Aluminum 2,124 1,739 1,763 1,832 1,765 1,256 1,394 1,989 3,146 2,062 Coke 1,389 1,312 1,412 1,556 1,731 1,568 1,834 1,659 1,936 1,546 Others 0 0 0 8 308 350 347 817 449 678 Sub-total 3,513 3,051 3,175 3,396 3,804 3,512 4,634 5,441 6,814 6,044 Fertilizer Sub-total 602 569 123 283 144 254 375 184 151 177 Special cargo Sub-total 1,036 986 904 1,587 1,524 1,835 1,687 1,810 1,880 1,794 Liquid bulk Petroleum 4,998 4,838 506 436 133 170 622 614 975 945 Oils&grease 550 645 537 681 465 558 536 538 560 473 Sub-total 5,548 5,483 1,043 1,117 598 728 1,157 1,151 1,534 1,417 Total Total 18,088 16,751 12,433 15,539 14,959 16,753 17,905 19,895 23,130 22,626 Transit cargo 186 414 27 55 25 11 10 49 144 252 Grand total 18,274 17,165 12,460 15,594 14,984 16,764 17,915 19,944 23,274 22,878
Source) "Statistical Report (1990-1999)", March 2000, MOMT & EMDB
Table 3.2.4 Commodity-wise Export Cargo handled by Greater Alexandria Port
(Unit: thousand tons) Cargo/Year 1990 1991 1992 1993 1994 1995 1996 1997 1998 1999 General cargo Sub-total 1,282 1,347 1,803 1,633 1,715 1,699 1,327 1,402 1,630 1,489 Dust & metals Coke 0 0 0 0 0 0 0 0 12 2 Phosphate 1 0 0 0 0 0 0 0 0 0 Others 0 0 4 13 16 4 4 22 5 1 Sub-total 1 0 4 13 16 4 4 22 18 3 Fertilizer Sub-total 22 54 321 221 301 199 207 254 147 143 Special cargo Sub-total 0 0 0 1 18 31 13 7 5 1 Liquid bulk Petroleum 1,877 2,365 1,927 2,880 3,084 2,651 2,762 2,959 2,418 2,955 Molasses 101 131 154 180 171 246 223 186 250 328 Sub-total 1,978 2,496 2,081 3,060 3,255 2,897 2,985 3,145 2,668 3,283 Total Total 3,283 3,897 4,209 4,928 5,305 4,830 4,535 4,830 4,467 4,918 Transit cargo 162 339 31 53 24 10 10 41 142 261 Grand total 3,445 4,236 4,240 4,981 5,329 4,840 4,546 4,871 4,609 5,178
Source) "Statistical Report (1990-1999)", March 2000, MOMT & EMDB
3 - 13
3.2.3 Calling vessels A total of 4,581 vessels called at Greater Alexandria Port in 1999. General cargo and container vessels account for 37% and 28% of the total number of vessels calling at Alexandria Port in 1999, a significant change from 1996, when general cargo vessels accounted for 51% of the total and container vessels only 16%.
Table 3.2.5 Number of Vessels calling at Greater Alexandria Port in 1999 Vessel Type Number of Vessels
1. Container 1,294(28.2%) 2. General Cargo 1,684(36.8%) 3. Dry Bulk 418( 9.1%) 4. Special Cargo 475(10.4%) 5. Liquid Bulk 393( 8.6%) 6. Passenger 100( 2.2%) 7. Others 217 ( 4.7%)
Total 4,581 (100%) Source) "Statistical Report (1990-1999)", March 2000, MOMT & EMDB,
"Annual Statistical Report 1999", APA
Table 3.2.6 Vessel Size Distribution calling at Greater Alexandria Port in 1997
Number of Vessels Loading Capacity (TEUs) Alexandria Port El-Dekheila Port
up to 700 455(80.1%) 216(64.1%) 701-1,500 73(12.8%) 36(10.7%) 1,501-2,000 29( 5.1%) 76(22.6%) 2,001-3,000 9( 1.6%) 9( 2.7%) 3,001 plus 2( 0.4%) 0( 0.0%) N.A. 112 73 Total 680(568)(100%) 410(337)(100%) Source) Alexandria Port Authority, Alexandria Container Handling Company,
Lloyd's Electronic Maritime Directory
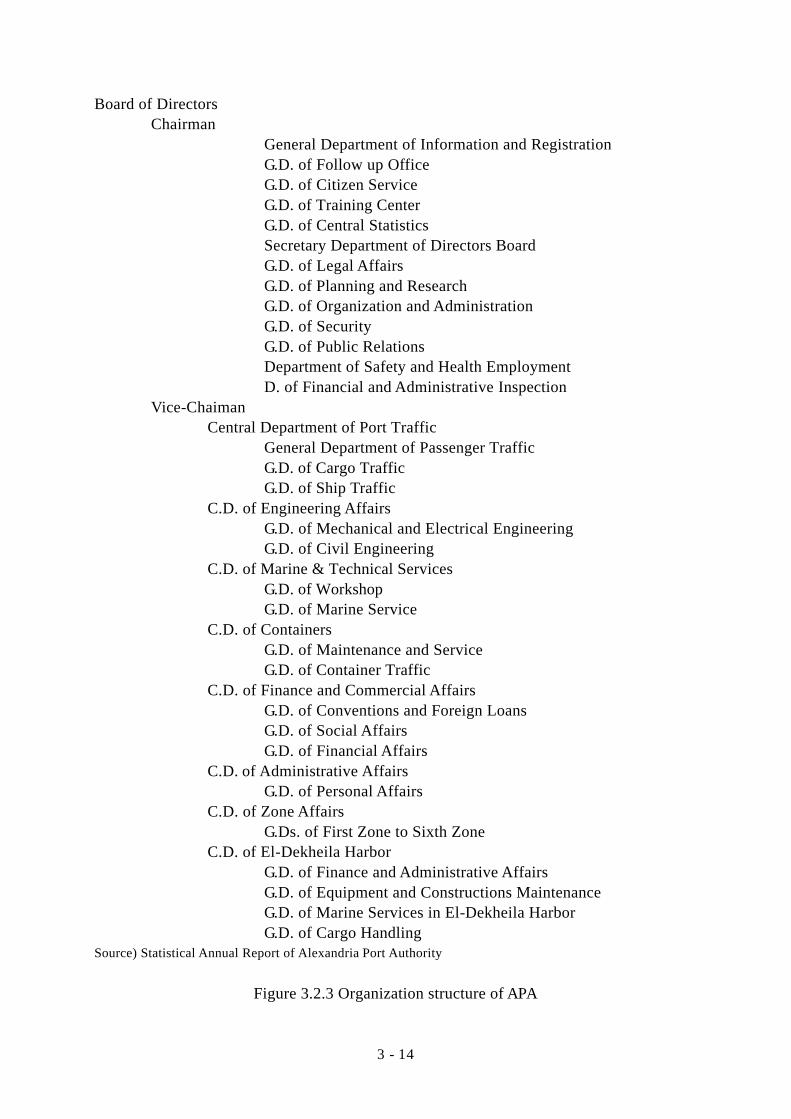
3.2.4 Alexandria Port Authority Board of directors was established according to the Law No.6/1967 and reorganized in 1997 in accordance with the Resolution 736/1997 and its revision under the Authorization of the President of Egypt. The main tasks of the Board are to prepare plans and policies for the port. Chairman of the Port Authority presides over the Board. Board of directors is comprised of first under secretary of MOMT and other related ministries, vice-chairman of the Port Authority and other members representing public institution concerning port activities, state-owned and private companies working in the port, university scholars and consultants of the Transport Minister. The organization structure of APA is shown in Figure 3.2.2 Financial situation of Alexandria Port Authority is shown in Table 3.2.7, Table 3.2.8 and Table 3.2.9.
3 - 14
Board of Directors Chairman General Department of Information and Registration G.D. of Follow up Office G.D. of Citizen Service G.D. of Training Center G.D. of Central Statistics Secretary Department of Directors Board G.D. of Legal Affairs G.D. of Planning and Research G.D. of Organization and Administration G.D. of Security G.D. of Public Relations Department of Safety and Health Employment D. of Financial and Administrative Inspection Vice-Chaiman Central Department of Port Traffic General Department of Passenger Traffic G.D. of Cargo Traffic G.D. of Ship Traffic C.D. of Engineering Affairs G.D. of Mechanical and Electrical Engineering G.D. of Civil Engineering C.D. of Marine & Technical Services G.D. of Workshop G.D. of Marine Service C.D. of Containers G.D. of Maintenance and Service G.D. of Container Traffic C.D. of Finance and Commercial Affairs G.D. of Conventions and Foreign Loans G.D. of Social Affairs G.D. of Financial Affairs C.D. of Administrative Affairs G.D. of Personal Affairs C.D. of Zone Affairs G.Ds. of First Zone to Sixth Zone C.D. of El-Dekheila Harbor G.D. of Finance and Administrative Affairs G.D. of Equipment and Constructions Maintenance G.D. of Marine Services in El-Dekheila Harbor G.D. of Cargo Handling Source) Statistical Annual Report of Alexandria Port Authority
Figure 3.2.3 Organization structure of APA

3 - 15
Table 3.2.7 Income Statement of APA (Unit: L.E. 1,000)
96/97 97/98 98/99 Operating Revenues 167,104 180,931 227,467 Operating Expenses 112,144 123,622 128,564 Wages 20,826 22,937 31,318 General Expenses 9,279 14,837 16,177 Transferable Expenses 22,395 25,561 23,910 Current Transfer 23,800 21,327 15,014 Depreciation 35,612 38,466 42,145 Other 232 494 0 Net Operating Surplus 54,960 57,309 98,903 Non Operating Revenues 97,524 117,122 136,012 Interest Expenses 71,607 70,496 77,700 Taxes 121 87 119 Net Surplus 80,756 103,848 157,096
Source) Derived from APA's data
Table 3.2.8 Cash Flow Statement of APA
(Unit: L.E. 1,000) 96/97 Cash Beginning 75,156 Cash Inflow 61,934 Cash Outflow 40,268 Cash Balance 96,822 Transfer for Investment 49,741 Cash Ending 47,081 Source) APA
Table 3.2.9 Balance Sheet of APA
(Unit: L.E. 1,000) 03-June-1997 03-June-1998 03-June-1999 Assets 761,362 865,281 951,744 Current Assets (Cash) 47,082 58,813 36,498 Current Assets (Deposit) 793 802 576 Fixed Assets 278,395 345,695 369,956 Work in Progress 95,563 88,077 121,464 Inventories 19,899 20,526 21,719 Receivables 270,415 302,155 352,335 Investment 49,213 49,213 49,213 Liabilities & Capital 761,362 865,281 951,744 Current Liabilities 50,258 100,693 153,488 Long-term Loans 241,911 266,828 258,372 Capital 76,683 69,318 69,682 Reserves 392,508 428,442 470,199
Source) Derived from APA's data

3 - 16
3.3 Damietta Port Damietta Port is located 8.5km west of Ras El Bar, Damietta branch of River Nile to the Mediterranean Sea and also 70km west of Port Said Port. Damietta Port started its operation June 26th 1986. Dimension of the entrance channel is 11.3km long, 300m - 250m wide and 15m deep. Two breakwaters protect the entrance channel. The western breakwater is 1,640m long and the eastern breakwater is 738m long. 3.3.1 Port facilities (1) General information a) Area: 6.2 sq.km (Land area) / 3.1 sq.km (Water area) b) Tide: Two feet above the constant level of the map c) Maximum permissible vessel draft: 12.8m (42feet)
Table 3.3.1 Berth Dimension of Damietta Port Berth No. Berth Type Berth Length Berth Depth 1-4 Container 4B@250m 14.5m 5-8 General Cargo 4B@200m 12.0m 9-12 General Cargo 4B@225m 12.0m 13-14 Grains 2B@300m 14.5m
Source) "Egyptian Ports Information", March 2000, MOMT & EMDB,
(2) Container terminal The container terminal is operated by Damietta Container and Cargo Handling Company. There are 4 berths of which total length is 1,050m. Berth depth is maintained at 14.5m while the entrance channel is facing siltation problems. Potential handling capacity of Damietta Container Terminal is expected to be 0.9 million TEUs, while the terminal throughput decreased to 0.43 million TEUs in 1999 after peaking at 0.61 million TEUs in 1997. Potential capacity is said to be 1.7 million TEUs when converting the existing 4 general cargo berths (No.5-8) into container berths with additional 7 QGCs and 21 RGTs in the future. (3) Grain terminal The grain terminal is operated by Damietta General Company for Silos and Strages. There are 2 berths of which length and depth are 300m and 14.5m respectively.
3 - 17
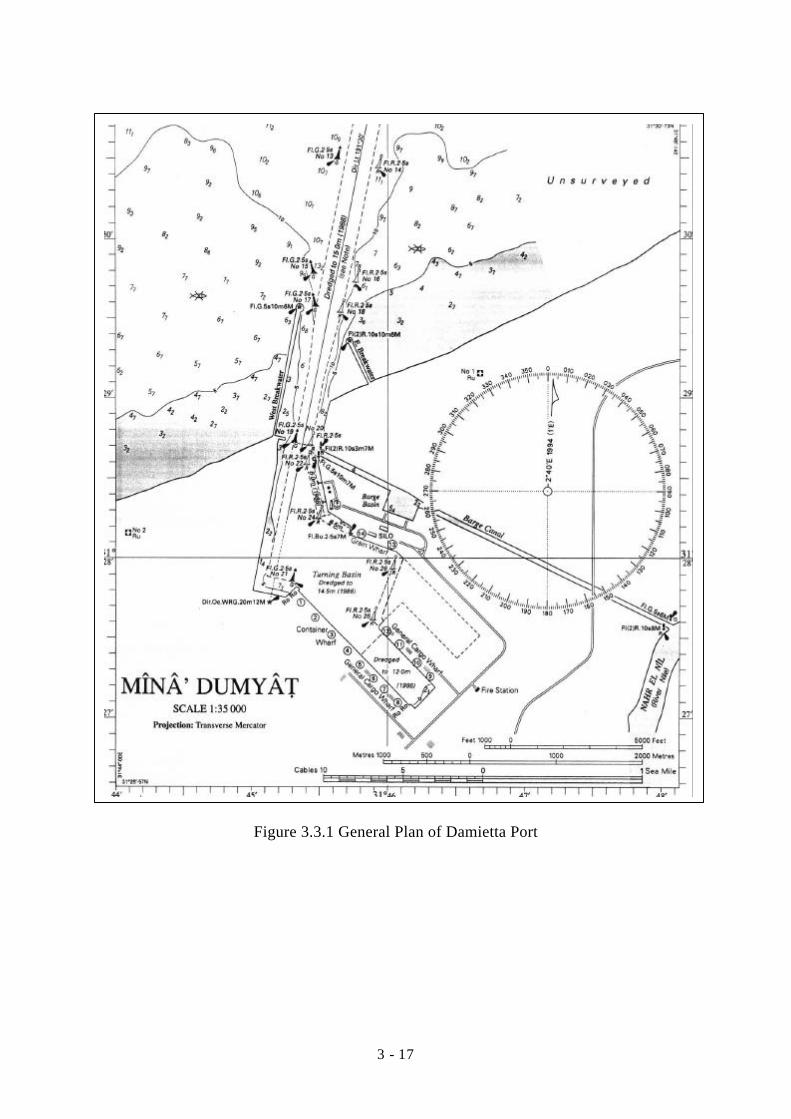
Figure 3.3.1 General Plan of Damietta Port

3 - 18
Table 3.3.2 Outline of Damietta Port Facilities 1. Container Terminal Quay Berth 4B@(250m length and 14.5m depth)
Area 256,000 sq.m (overall: 826,000 sq.m) Ground Slot Approx. 3,400 TEUs Reefer Point 96 QGCs 6 (Outreach:42m, Underspreader:32m, Railspan:15m) RTGs 0 Toplifters 21 (Capacity:40-45 tons for Laden Container)
3 (Capacity:16-25 tons for Empty Container) Forklift 4 (Capacity:15 tons for Empty Container) Tractors 52 (Capacity: 40-50 tons)
Terminal
Trailers 43 (Capacity: 40-55 tons) 2. General Cargo Berth Quay Berth 4B@(200m length and 12.0m depth)
4B@(225m length and 12.0m depth) Open Yard 300,000 sq.m Shed 5,000 sq.m (5 Sheds)
Storage
Cold Storage 3,000 sq.m (Capacity: 15,000 cb.m, 250,000 tons/year) 3. Grain Terminal Quay Berth 2B@(300m length and 14.5m depth)
2 Pneumatic (Disch. rate: 700 tons/hour/unloader) Unloader 1 Mechanical (Disch.rate: 1,000 tons/hour/unloader)
Terminal
Silo 2 (Capacity: 100,000 tons + 50,000 tons)
Source) Damietta Port Authority

3 - 19
3.3.2 Cargo throughput Total volume of import and export cargoes handled through Damietta Port in 1999 amount to 9,600 thousand tons and 2,521 tons respectively as shown in Table 3.3.3 and Table 3.3.4.
Table 3.3.3 Commodity-wise Import Cargo handled at Damietta Port (Unit: thousand tons)
Cargo/Year 1990 1991 1992 1993 1994 1995 1996 1997 1998 1999 General cargo Flour 54 0 0 43 11 0 0 0 6 27 General&
container 101 44 186 111 149 190 1,222 1,267 821 899
Sub-total 155 44 186 154 160 190 1,222 1,267 827 926 Grains Wheat 1,918 1,707 2,090 1,344 2,200 2,151 2,243 2,544 1,980 2,148 Maize 105 0 137 301 380 705 651 1,147 1,071 1,469 Sub-total 2,023 1,707 2,227 1,645 2,580 2,856 2,894 3,690 3,050 3,617 Dust & metals Cement 1 0 0 2 432 1,126 1,359 1,686 2,251 1,943 Aluminum 6 0 0 0 0 0 0 622 963 728 Coke 0 0 0 0 0 0 0 0 0 24 Others 0 0 7 2 23 147 658 3 0 1 Sub-total 7 0 7 4 455 1,273 2,017 2,311 3,214 2,694 Fertilizer Sub-total 0 0 0 0 13 8 18 7 26 8 Special cargo Sub-total 141 25 33 130 259 212 258 341 457 374 Liquid bulk Petroleum 0 0 0 0 0 0 0 0 14 70 Oils&grease 0 0 0 0 0 0 0 0 35 45 Sub-total 0 0 0 0 0 0 0 0 49 115 Total Total 2,326 1,776 2,453 1,933 3,467 4,539 6,409 7,617 7,624 7,733 Transit cargo 310 768 1,336 1,543 1,873 2,183 2,107 2,682 1,201 1,867 Grand total 2,636 2,544 3,789 3,476 5,340 6,722 8,516 10,299 8,824 9,600
Source) "Statistical Report (1990-1999)", March 2000, MOMT & EMDB
Table 3.3.4 Commodity-wise Export Cargo handled at Damietta Port
(Unit: thousand tons) Cargo/Year 1990 1991 1992 1993 1994 1995 1996 1997 1998 1999 General cargo Sub-total 13 6 3 21 33 57 1,069 1,053 535 438 Dust & metals Coke 0 0 0 0 0 0 0 0 0 0 Cement 0 0 0 0 0 0 0 0 0 8 Phosphate 0 0 0 0 0 0 0 0 0 0 Others 0 0 17 31 8 7 26 62 40 78 Sub-total 0 0 17 31 8 7 26 62 40 86 Fertilizer Sub-total 10 23 52 16 177 27 53 130 198 262 Special cargo Sub-total 0 0 0 0 0 0 8 9 8 4 Liquid bulk Petroleum 0 0 0 0 0 0 0 0 0 0 Molasses 0 0 0 0 0 0 0 0 0 25 Sub-total 0 0 0 0 0 0 0 0 0 25 Total Total 23 29 72 68 218 91 1,155 1,255 780 814 Transit cargo 258 703 1,329 1,566 1,808 2,110 2,025 2,498 1,100 1,707 Grand total 281 732 1,401 1,634 2,026 2,201 3,180 3,753 1,880 2,521
Source) "Statistical Report (1990-1999)", March 2000, MOMT & EMDB

3 - 20
3.3.3 Calling vessels A total of 1,585 vessels called at Damietta Port in 1999. Container vessel accounts for 53% of the total number of vessels which called at Damietta Port.
Table 3.3.5 Number of Vessels calling at Damietta Port in 1999 Vessel Type Number of Vessels
1. Container 834(52.6%) 2. General Cargo 149( 9.4%) 3. Dry Bulk 310(19.6%) 4. Special Cargo 254(16.0%) 5. Liquid Bulk 38( 2.4%) 6. Passenger 0 7. Others 0
Total 1,585 (100%) Source) "Statistical Report (1990-1999)", March 2000, MOMT & EMDB,
Damietta Port Authority
Table 3.3.6 Vessel Size Distribution calling at Damietta Port in 1997 Loading Capacity (TEUs) Number of Vessels up to 700 529 (59.8%) 701-1,500 96 (10.9%) 1,501-2,000 85 ( 9.6%) 2,001-3,000 136 (15.4%) 3,001 plus 38 ( 4.3%) N.A. 95 Total 979 (100%)
Source) Damietta Port Authority, Damietta Container Handling Company, Lloyd's Electronic Maritime Directory

3 - 21
3.3.4 Damietta Port Authority Ministry of Construction, New Civilized Communities and Land Reclamation planned and constructed Damietta Port. The port was taken over by the Ministry of Transport and Communication after the construction was completed. In 1986, under the control of Ministry of Transport and Communication, the Damietta Port Authority was established to administrate and operate the port. The organization structure of DPA is shown in Figure 3.3.2 Financial situation of Damietta Port Authority is shown in Table 3.3.7, Table 3.3.8 and Table 3.3.9. Board of Directors Chairman General Department of Legal Affairs Inspection and Internal Control Department of Security Vocational Health and Safety Information Center Planning and Research G.D. of Organization and Management D. of Citizens Service Public Relations Follow up Office Vice-Chaiman Central Department of Financial and Commercial and Administrative General Department of Administrative and Personnel G.D. of Financial and Commercial C.D. of Marine and Technical Affairs G.D. of Engineering Affairs G.D. of Maintenance Services G.D. of Traffic Affairs Source) Damietta Port Authority
Figure 3.3.2 Organization structure of DPA

3 - 22
Table 3.3.7 Income Statement of DPA (Unit: L.E. 1,000)
96/97 Operating Revenues 45,535 Operating Expenses 68,639 Wages 4,625 General Expenses 26,018 Taxes 71 Depreciation 37,926 Net Operating Income (Deficit) -23,015 Non Operating Revenues 19,918 Non Operating Expenses 16,648 Payment of Interest 16,204 Others 443 Net Surplus (Deficit) -19,834 Source) Damietta Port Authority
Table 3.3.8 Cash Flow Statement of DPA
(Unit: L.E. 1,000) 96/97 Cash Beginning 39,240 Cash Inflow 123,750 Operating Income 75,276 Sale of Fixed Assets 4,527 Long-term Loan 14,755 From Public Treasury to repay loan 29,192 Cash Outflow 154,336 Operating Expenses 93,690 Investment in Fixed Assets 13,513 Repayment of Long-term Loan 47,133 Cash Balance -30,585 Cash Ending 8,655 Source) Damietta Port Authority
Table 3.3.9 Balance Sheet of DPA
(Unit: L.E. 1,000) 03-June-1997 Assets 757,404 Current Assets (Cash) 8,655 Fixed Assets 680,752 Work in Progress 11,353 Inventories 10,081 Receivables 36,463 Investment 10,100 Liabilities & Capital 757,404 Current Liabilities 41,409 Long-term Loans 65,763 Provision 397,498 Government Share 707,751 Reserves 9,822 Deficits -464,840 Source) Damietta Port Authority

3 - 23
3.4 Port Said Port Port Said Port is located at the northern entrance of the Suez Canal. Two breakwaters protect the canal entrance leading to the port. The eastern breakwater is approximately 6.5 km long and the western breakwater is approximately 2.8 km long. 3.4.1 Port facilities (1) General information a) Approach channel: 140m wide, 12.5 to 13.0m deep b) Tide: 70cm c) Maximum permissible vessel draft: 12.8m (42feet)
Table 3.4.1 Berth Dimension of Port Said Port Berth No. Berth Type Berth Length Berth Depth 15 Petroleum 1B(350m) 3.66m 6, 9, 10 General Cargo 3B(365+295+40m) 8.24m 11 Containers 1B(350m) 12.81m 12-14 Multi-purpose 3B(350+350+250m) 12.81m 7, 8 Grains 2B(530m) 12.81m 1-5, 16, 17 Small Units 7B(1,249mm) 1.83-3.66m
Source) "Egyptian Ports Information", March 2000, MOMT & EMDB, PSPA
(2) Container terminal The container terminal is operated by Port Said Port Container Handling Company. There are one container berth (No.11) and two multi-purpose berths (No.12 and No.13) mainly used by large mother vessels of which total length and depth are 1,050m and 12.81m respectively. There is also general cargo berth (No.9) of which length and depth are 295m and 8.2m, mainly used by small feeder vessels. Two additional post-Panamax QGCs have been introduced at the terminal. Future potential handling capacity with additional new multi-purpose berth of Port Said Container Terminal is expected to be 0.8 million TEUs, while the terminal throughput in 1999 is 0.41 million TEUs. (3) Grain terminal The grain terminal is operated by marine shipping companies. There are two grain berths (No.7 and 8) of which total length and depth are 530m and 12.81m respectively.

3 - 24
Figure 3.4.1 General Plan of Port Said Port

3 - 25
Table 3.4.2 Outline of Port Said Port Facilities 1. Container Terminal
Container 1B(350m length and 12.81m depth) Multi-purpose 3B(350+350+250m length and 12.81m depth)
Quay
General 1B(295m length and 8.24m depth) Area 300,000 sq.m (planned to increase up to 450,000 sq.m) Ground Slot Approx.2,300 TEUs Reefer Point 100 QGCs 5 (Panamax:3, Post-Panamax:2) Mobile Cranes 2 (Capacity:80-100 tons) RTGs 4 (Capacity:32-35 tons) Reach Stackers 10 (Capacity:7@42-45 tons + [email protected] tons) Toplifters 16 (Capacity:12-42 tons)
Terminal
Tractors and Semi-Trailers
21
2. Grain Terminal Quay Berth 2B@(265m length and 11.59-12.81m depth)
Floating Unloaders
2 (Disch. rate: 16,000 tons/day) Terminal
Silo 2 (Capacity: 43,000 tons) Source) Port Said Port Authority

3 - 26
3.4.2 Cargo throughput Total volume of import and export cargoes handled through Port Said Port in 1999 amount to 3,098 thousand tons and 2,116 tons respectively as shown in Table 4.4.3 and Table 4.4.4.
Table 3.4.3 Commodity-wise Import Cargo handled at Port Said Port (Unit: thousand tons)
Cargo/Year 1990 1991 1992 1993 1994 1995 1996 1997 1998 1999 General cargo Flour 60 0 0 0 15 4 25 24 0 0 General&
container 408 640 647 494 685 917 821 1,082 1,079 1,050
Sub-total 468 640 647 494 700 921 845 1,106 1,079 1,050 Grains Wheat 678 496 1,064 770 1,605 1,937 1,621 1,678 1,264 727 Maize 898 884 216 121 77 158 27 0 0 0 Sub-total 1,576 1,380 1,280 891 1,682 2,095 1,648 1,678 1,264 727 Dust & metals Cement 71 26 1 1 26 10 10 6 0 0 Aluminum 30 21 56 44 108 167 273 118 154 95 Coke 0 0 0 0 0 0 0 0 0 0 Others 0 0 0 0 0 0 0 0 0 0 Sub-total 101 47 57 45 134 177 283 124 154 95 Fertilizer Sub-total 0 0 0 0 0 0 0 0 0 0 Special cargo Sub-total 68 62 118 118 136 162 32 57 68 49 Liquid bulk Petroleum 0 7 13 0 0 0 0 0 0 0 Oils&grease 0 0 0 0 0 0 0 0 0 0 Sub-total 0 7 13 0 0 0 0 0 0 0 Total Total 2,213 2,136 2,115 1,548 2,652 3,355 2,809 2,965 2,565 1,920 Transit cargo 90 57 229 439 512 1,052 1,064 1,366 631 1,177 Grand total 2,303 2,193 2,344 1,987 3,164 4,407 3,873 4,332 3,195 3,098
Source) "Statistical Report (1990-1999)", March 2000, MOMT & EMDB
Table 3.4.4 Commodity-wise Export Cargo handled at Port Said Port
(Unit: thousand tons) Cargo/Year 1990 1991 1992 1993 1994 1995 1996 1997 1998 1999 General cargo Sub-total 156 149 126 134 135 201 325 442 265 281 Dust & metals Coke 0 0 0 0 0 0 0 0 0 0 Cement 0 0 0 0 0 2 0 0 1 0 Phosphate 0 0 0 0 0 0 0 0 0 0 Others 0 0 1 0 0 55 0 0 0 1 Sub-total 0 0 1 0 0 57 0 0 1 1 Fertilizer Sub-total 147 141 140 150 107 93 149 139 74 104 Special cargo Sub-total 8 0 2 5 1 2 1 0 2 1 Liquid bulk Petroleum 359 385 437 517 631 724 780 704 442 551 Molasses 0 0 0 0 0 0 0 0 0 0 Sub-total 359 385 437 517 631 724 780 704 442 551 Total Total 670 675 706 806 874 1,077 1,255 1,285 783 939 Transit cargo 84 65 217 437 533 995 1,055 1,328 575 1,177 Grand total 754 740 923 1,243 1,407 2,072 2,310 2,613 1,358 2,116
Source) "Statistical Report (1990-1999)", March 2000, MOMT & EMDB

3 - 27
3.4.3 Calling vessels A total of 1,931 vessels called at Port Said Port in 1999. Container vessel accounts for 59% of the total number of vessels which called at Port Said Port.
Table 3.4.5 Number of Vessels calling at Port Said Port in 1999 Vessel Type Number of Vessels
1. Container 1,168(59.3%) 2. General Cargo 267(13.6%) 3. Dry Bulk 62( 3.2%) 4. Special Cargo 58( 2.9%) 5. Liquid Bulk 0 6. Passenger 413(20.8%) 7. Others 0
Total 1,968 (100%)
Source) PSPA
Table 3.4.6 Vessel Size Distribution calling at Port Said Port in 1999 Loading Capacity (TEUs) Number of Vessels up to 700 1,088 (93.2%) 701-1,500 75 ( 6.4%) 1,501-2,000 5 ( 0.4%) 2,001-3,000 3,001 plus N.A. Total 1,168 (100%)
Source) PSPA
3.4.4 Port Said Port Authority Port Said Port Authority Board was established according to the Law No. /1980. The main tasks of the Board are to prepare plans and policies for the port. Chairman of the Port Authority presides over the Board. Board of directors is comprised of vice-chairman of the Port Authority and other members representing public institution concerning port activities, state-owned and private companies working in the port. The organization structure of PSPA is shown in Figure 3.4.2 Financial situation of PSPA is shown in Table 3.4.7 and Table 3.4.8.

3 - 28
Board of Directors Chairman General Department of Planning and Follow up G.D. of Legal Affairs G.D. of Security G.D. of Organization and Administration G.D. of Information and Registration D. of Public Relations D. of Citizen Service D. of Inspection and Internal Control Secretary Department of Chairman of the Board Follow up Office Vice-Chaiman Central Department of Port Traffic Affaires G.D. of Ship Traffic G.D. of Cargo and Passenger Traffic C.D. of Engineering Affairs G.D. of Financial and Commercial Affaires G.D. of Administrative Affaires G.D. of Zone Affaires (4 Zones) Source) PSPA
Figure 3.4.2 Organization structure of PSPA
Table 3.4.7 Operating Revenue of PSPA (Unit: L.E. 1,000)
96/97 97/98 Cash Flow Revenue 2,7153 Ship fees 15,931 15,914 Warehouse fees 5,983 5,511 Rent of equipment 111 134 Unlawful occupancies 92 72 Rents 5,022 5,081 Gate use charges Petroleum handling Other revenue 14 16 Fiscal paper revenue 7,435 4,951 Source) PSPA
Table 3.4.8 Assets of PSPA
(Unit: L.E. 1,000) 96/97 97/98 Fixed Assets 178,968 230,532 Under execution project 55,583 79,990 Stored articles 497 561 Financial investment 21,081 21,081 Different debtor 21,956 26,007 Cash 8,286 11,911 Deffect 18,075 18,075 Source) PSPA

3 - 29
3.5 Suez Port (including Adabeya) Suez Port is located at the southern end of the Suez Canal. Adabeya is located at the west coast of Suez Gulf and 10 km southwest of Suez Port. 3.5.1 Port facilities (1) General information a) Water area: 258km2 (Suez + Adabeya) b) Land area: 327 thousand m2 (Suez), 837 thousand m2 (Adabeya)
Table 3.5.1 Berth Dimension of Suez Port (including Adabeya) Berth No. Berth Type Berth Length Berth Depth Suez No.1-4, 6 Passenger 6B(650m) 7.0-7.8m Suez No. 5, 7-14 General Cargo 9B(1,590m) 5.0-8.0m AdabeyaNo.1-4,6,8,9 General Cargo 7B(1,370m) 13.0-13.5m Adabeya No. 10 Cement 1B@100m 10.0m Adabeya No. 5, 7 Grains 2B(470m) 13.0-13.5m
Source) "Egyptian Ports Information", March 2000, MOMT & EMDB,
Figure 3.5.1 General Plan of Suez Port

3 - 30
3.5.2 Cargo throughput Total volume of import and export cargoes handled through Suez Port (including Adabeya) in 1999 amount to 5,279 thousand tons and 1,175 tons respectively as shown in Table 3.5.2 and Table 3.5.3.
Table 3.5.2 Commodity-wise Import Cargo handled at Suez Port (including Adabeya) (Unit: thousand tons)
Cargo/Year 1990 1991 1992 1993 1994 1995 1996 1997 1998 1999 General cargo Flour 6 0 0 0 0 0 0 0 0 6 General&
container 965 1,043 960 594 593 696 804 736 792 981
Sub-total 971 1,043 960 594 593 696 804 736 792 988 Grains Wheat 656 945 631 664 413 90 146 308 310 290 Maize 0 0 0 0 37 0 0 0 0 8 Sub-total 656 945 631 664 450 90 146 308 310 297 Dust & metals Cement 26 6 5 0 0 0 0 10 111 1,224 Aluminum 0 0 18 13 25 0 1 0 0 0 Coke 52 51 41 0 0 0 0 0 0 0 Others 0 0 4 23 36 36 102 60 95 1,255 Sub-total 78 57 68 36 61 36 103 71 206 2,479 Fertilizer Sub-total 0 0 15 5 1 0 0 16 26 4 Special cargo Sub-total 7 4 1 45 5 8 32 93 223 394 Liquid bulk Petroleum 4,292 1,961 1,595 1,604 990 967 1,647 1,010 839 719 Oils&grease 59 101 142 183 268 309 452 322 291 397 Sub-total 4,351 2,062 1,737 1,787 1,258 1,276 2,099 1,332 1,130 1,117 Total Total 6,063 4,111 3,412 3,131 2,368 2,106 3,185 2,557 2,687 5,279 Transit cargo 0 0 0 0 0 0 0 0 0 0 Grand total 6,063 4,111 3,412 3,131 2,368 2,106 3,185 2,557 2,687 5,279
Source) "Statistical Report (1990-1999)", March 2000, MOMT & EMDB
Table 3.5.3 Commodity-wise Export Cargo handled at Suez Port (including Adabeya)
(Unit: thousand tons) Cargo/Year 1990 1991 1992 1993 1994 1995 1996 1997 1998 1999 General cargo Sub-total 282 683 552 711 565 545 751 602 773 657 Dust & metals Coke 0 0 0 1 2 1 2 1 0 0 Cement 7 49 204 286 137 100 85 20 9 2 Phosphate 0 0 0 0 37 14 6 0 0 0 Others 0 0 0 51 24 10 9 28 2 0 Sub-total 7 49 204 338 200 125 101 48 11 2 Fertilizer Sub-total 11 109 120 47 164 263 277 159 151 124 Special cargo Sub-total 12 1 0 2 9 4 8 14 25 37 Liquid bulk Petroleum 334 670 599 1,285 1,235 1,287 1,723 718 393 323 Molasses 0 0 0 0 0 0 0 0 0 32 Sub-total 334 670 599 1,285 1,235 1,287 1,723 718 393 355 Total Total 646 1,512 1,475 2,383 2,173 2,224 2,861 1,541 1,353 1,175 Transit cargo 0 0 0 0 0 0 0 0 0 0 Grand total 646 1,512 1,475 2,383 2,173 2,224 2,861 1,541 1,353 1,175
Source) "Statistical Report (1990-1999)", March 2000, MOMT & EMDB

3 - 31
3.5.3 Calling vessels A total of 1,112 vessels called at Suez Port (including Adabeya) in 1999.
Table 3.5.4 Number of Vessels calling at Suez Port in 1999 Vessel Type Number of Vessels
1. Container + 2. General 306(27.5%) 3. Dry Bulk 94( 8.5%) 4. Special Cargo 96( 8.6%) 5. Liquid Bulk 212(19.1%) 6. Passenger 404(36.3%)
Total 1,112 (100%) Source) "Statistical Report (1990-1999)", March 2000, MOMT & EMDB

3 - 32
3.6 Safaga Port Safaga Port is located at the western coast of the Red Sea and 50 km south of Hurgada. The port is a large inlet (natural gulf) which is sheltered by natural protection from the east and north directions by Safaga Island. 3.6.1 Port facilities (1) General information a) Land area: 418 thousand m2
Table 3.6.1 Berth Dimension of Safaga Port Berth No. Berth Type Berth Length Berth Depth No.1 Grains 1B(289m) 14m No.2,3 Passengers 2B(415m) 10m No.4 Mining 1B(221m) 10m No. 5 Coal 1B(115m) 8m
Source) "Egyptian Ports Information", March 2000, MOMT & EMDB,
3.6.2 Cargo throughput Total volume of import and export cargoes handled through Safaga Port in 1999 amount to 1,893 thousand tons and 373 tons respectively as shown in Table 3.6.2 and Table 3.6.3.
Table 3.6.2 Commodity-wise Import Cargo handled at Safaga Port (Unit: thousand tons)
Cargo/Year 1990 1991 1992 1993 1994 1995 1996 1997 1998 1999 General cargo Flour 0 0 0 0 0 0 0 0 0 0 General&
container 0 0 5 1 30 23 29 35 40 71
Sub-total 0 0 5 1 30 23 29 35 40 71 Grains Wheat 1,152 1,056 793 860 850 306 889 392 929 876 Maize 0 0 0 0 0 0 0 42 0 0 Sub-total 1,152 1,056 793 860 850 306 889 434 929 876 Dust & metals Cement 0 0 0 0 0 0 0 0 195 400 Aluminum 355 372 408 354 347 352 308 349 394 380 Coke 108 52 52 216 145 166 110 139 98 104 Others 0 0 0 0 2 2 28 7 101 3 Sub-total 463 424 460 570 494 520 445 495 787 887 Fertilizer Sub-total 0 0 0 0 0 0 4 0 0 0 Special cargo Sub-total 0 0 0 0 0 0 0 0 0 0 Liquid bulk Petroleum 0 0 0 0 32 47 46 35 47 59 Oils&grease 0 0 0 0 0 0 0 3 0 0 Sub-total 0 0 0 0 32 47 46 37 47 59 Total Total 1,615 1,480 1,258 1,431 1,406 896 1,413 1,001 1,803 1,893 Transit cargo 0 0 0 0 0 0 0 0 0 0 Grand total 1,615 1,480 1,258 1,431 1,406 896 1,413 1,001 1,803 1,893
Source) "Statistical Report (1990-1999)", March 2000, MOMT & EMDB

3 - 33
Table 3.6.3 Commodity-wise Export Cargo handled at Safaga Port
(Unit: thousand tons) Cargo/Year 1990 1991 1992 1993 1994 1995 1996 1997 1998 1999 General cargo Sub-total 7 0 0 1 25 4 20 28 33 32 Dust & metals Coke 0 0 0 11 36 15 16 0 26 0 Cement 0 0 89 333 110 0 173 0 0 0 Phosphate 388 154 158 156 148 97 87 163 139 189 Others 4 0 93 173 211 378 249 272 226 152 Sub-total 392 154 340 673 505 490 524 435 390 340 Fertilizer Sub-total 0 0 0 0 7 7 0 0 0 1 Special cargo Sub-total 0 0 0 0 0 0 0 0 0 0 Liquid bulk Petroleum 0 0 0 0 0 0 0 0 1 0 Molasses 0 0 0 0 0 0 0 0 0 0 Sub-total 0 0 0 0 0 0 0 0 1 0 Total Total 399 154 340 674 537 501 545 462 425 373 Transit cargo 0 0 0 0 0 0 0 0 0 0 Grand total 399 154 340 674 537 501 545 462 425 373
Source) "Statistical Report (1990-1999)", March 2000, MOMT & EMDB
3.6.3 Calling vessels A total of 772 vessels called at Safaga Port in 1999. Passenger vessel accounts for 82% of the total number of vessels which called at Safaga Port.
Table 3.6.4 Number of Vessels calling at Safaga Port in 1999 Vessel Type Number of Vessels
1. General & Container 24( 3.1%) 2. Dry Bulk 83(10.8%) 3. Special Cargo 0 4. Liquid Bulk 32( 4.1%) 5. Passenger 633(82.0%)
Total 772 (100%) Source) "Statistical Report (1990-1999)", March 2000, MOMT & EMDB