chapter 3: validation of the superpave binder … · binders to the pavement rutting performances...
TRANSCRIPT
CHAPTER 3: VALIDATION OF THE SUPERPAVE BINDER PARAMETER FOR RUTTING BASED ON ALF PAVEMENT PERFORMANCE AT ALL TEST TEMPERATURES
1. Background
This validation effort consisted of comparing the G*/sins's of the five binders to the pavement rutting performances of the five surface mixtures. The G*/sitWs to be used in the comparisons were measured by the DSR using the pavement test temperatures at a ZO-mm depth and a frequency of 2.25 rad/s. The target pavement temperatures were 46, 52, 58, 64, 70, and 76 "C. These temperatures were chosen because they are used by the Superpave asphalt binder specification. The G*lsina's of the binders are presented in table 27 along with statistical rankings provided by Fisher's LSD. The binders had signifi- cantly different G*/sina's at each temperature. All DSR tests were performed in the linear viscoelastic range using a l-mm gap and 25-mm diameter plates. All surface mixtures were tested by the ALF at 58 "C and two of the other temperatures listed above. The two temperatures were chosen based on the pavement performances of the mixtures at 58 "C.
2. ALF Pavement Tests Results
The order in which the pavements were tested and the site tested are shown in table 28. The average data for each ALF pavement test are given in table 29.
a. Pavement Temperatures
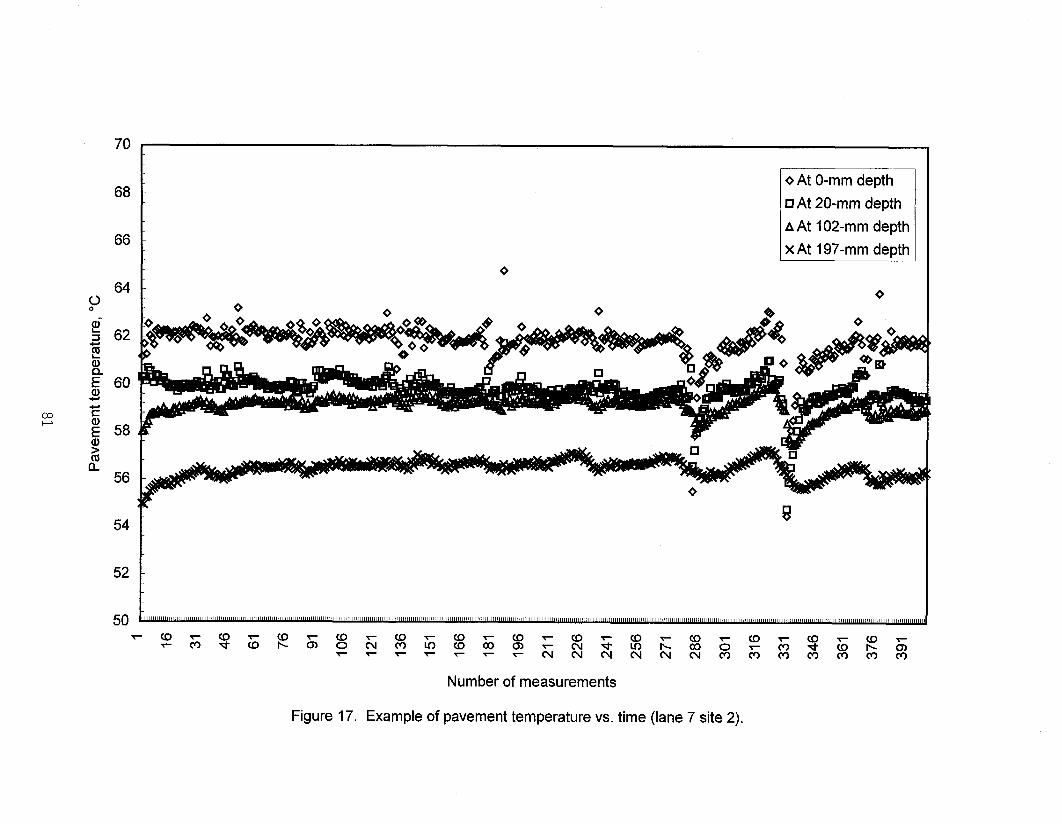
The average pavement temperature for each test site as a function of depth is given in table 29. The temperatures from multiple sites having the same target temperature were averaged. These temperatures are shown in table 30. Included in table 30 are 95-percent confidence limits based on two times the standard deviation (20). These limits were computed by pooling the standard deviations from multiple test sites having the same target temperature. The average temperature at a depth of 20 mm and confidence limits based on 20, were 46 +4, 51 26, 58 ?4, 64 &5, 70 +5, and 75 ?8 "C. Only the temperatures recorded during pavement testing were used in the calculations. The temper- atures recorded during downtime were not used. Note that the temperatures overlap. Even so, it was found that rutting performance varied significantly from one average temperature to another. A typical plot for the pavement temperatures at the four depths is shown in figure 17.
b. Pavement Air Voids and Densification
The average air voids are given in table 29. The as-constructed air voids of the pavements, based on cores taken from out of the wheelpath, differed by as much as 4 percent from lane to lane. The ramifications of this on the validation effort were not apparent. The pavements with Styrelf and Novophalt had the highest initial air-void levels.
73

Table 29 includes the percent decrease in air voids due to trafficking, which is also called densification. The average densification based on the data from all test sites at all temperatures was 3.7 percent with a 20(,-~, of 2.2 percent. By comparing the average densification in the top half of each asphalt pavement layer with that of the bottom half, it was found that the difference in air voids was less than or equal to 1.1 percent, or lag,+ in 9 out of 15 pavement tests. Unexpectedly, the average densification was greater in the bottom half in four out of the six remaining pavement tests. None of the air voids in the top and bottom halves of the cores were significantly different at a 95-percent confidence level, or ZCT(,-~). The data also show that densification was not higher in the pavements with Styrelf and Novophalt, which had the highest initial air-void levels.
Table 31 provides densifications in the top and bottom halves of the asphalt pavement layer that were calculated using the same initial air-void level. For a given test site, the average air-void level provided by the top halves of the cores taken from outside the wheelpath was used as the initial air-void level. By comparing the densifications shown in table 31, it was found that the difference in air voids between the top and the bottom halves was less than or equal to 1.1 percent in 11 out of 15 pavement tests. Densi- fication was greater in the bottom half in three out of the four remaining pavement tests. The data indicated that when the average densification was higher in the bottom half, it was not because the bottom half had an initial air-void level that was higher than for the top half. It was concluded that it may be possible for the average densification to be greater in the bottom half of a 200-mm-thick pavement when tested by the ALF. However, none of the air voids in the top and bottom halves of the cores were significantly different at a 95-percent confidence level.
The average densification for all sites ranged from 2.0 to 5.5 percent. Multiplying these values by the asphalt pavement layer thickness of 200 mm gives a range in rut depth from 4 to 11 mm. Dividing these two values by the failure level of 20 mm suggests that 20 to 55 percent of the 20-mm maximum allowable rut depth was densification. Test sites with lower percentages of densification would have higher percentages of rut depth due to viscous flow. However, as enumerated in chapter 2, these percentages can only be considered approximate.
c. Aggregate Gradation, Binder Contents, and Maximum Specific Gravity
The aggregate gradations, binder contents, and maximum specific gravities of samples acquired during construction and from pavement cores taken after pavement failure are given in appendix B. The data did not provide an explanation for any of the discrepancies found in this study.
74
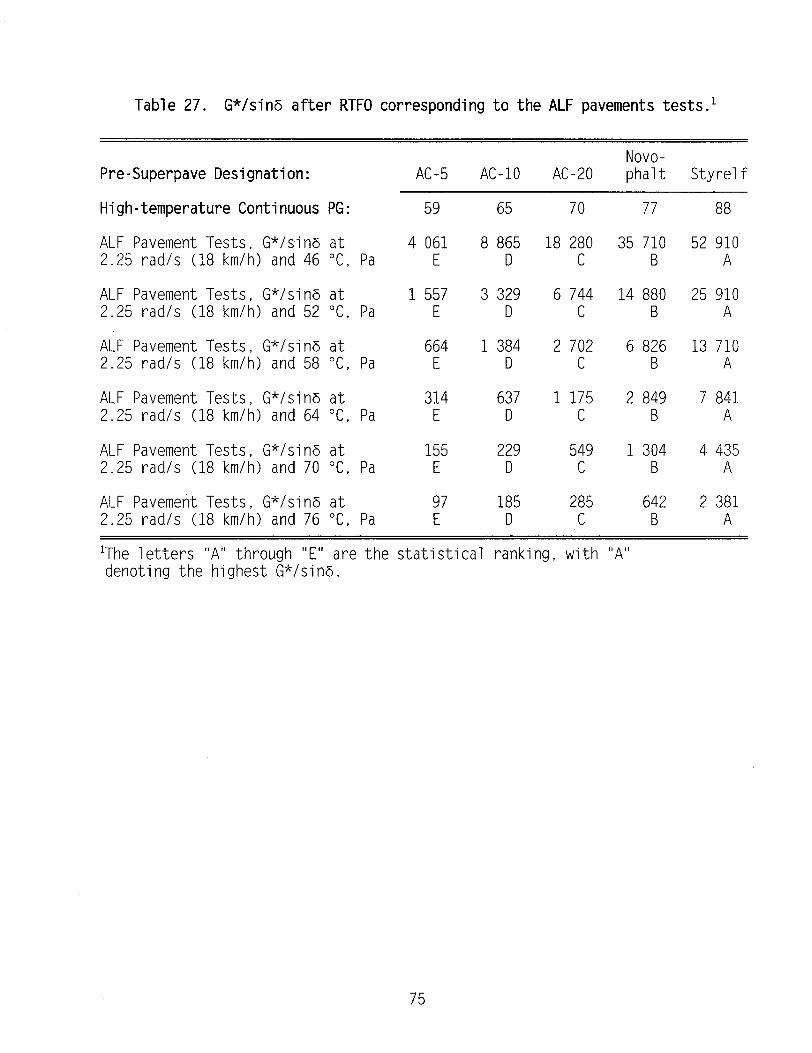
Table 27. G*/sin6 after RTFO corresponding to the ALF pavements tests.'
Pre-Superpave Designation: Novo-
AC-5 AC-10 AC-20 phalt Styrelf
High-temperature Continuous PG: 59 65 70 77 88
ALF Pavement Tests, G*/sins at 4 061 8 865 18 280 35 710 52 910 2.25 rad/s (18 km/h) and 46 "C, Pa E D C B A
ALF Pavement Tests, G*/sina at 1 557 3 329 6 744 14 880 25 910 2.25 rad/s (18 km/h) and 52 "C, Pa E D C B A
ALF Pavement Tests, G*/sin6 at 664 1 384 2 702 6 826 13 710 2.25 rad/s (18 km/h) and 58 "C, Pa E D C B A
ALF Pavement Tests, G*/sins at 314 637 1 175 2 849 7 841 2.25 rad/s (18 km/h) and 64 "C, Pa E D C B A
ALF Pavement Tests, G*/sins at 155 229 549 1 304 4 435 2.25 rad/s (18 km/h) and 70 "C, Pa E D C B A
ALF Pavement Tests, G*/sina at 97 185 285 642 2 381 2.25 rad/s (18 km/h) and 76 "C, Pa E D C B A
'The letters "A" through "E" are the statistical ranking, with "A" denoting the highest G*/sing.
75
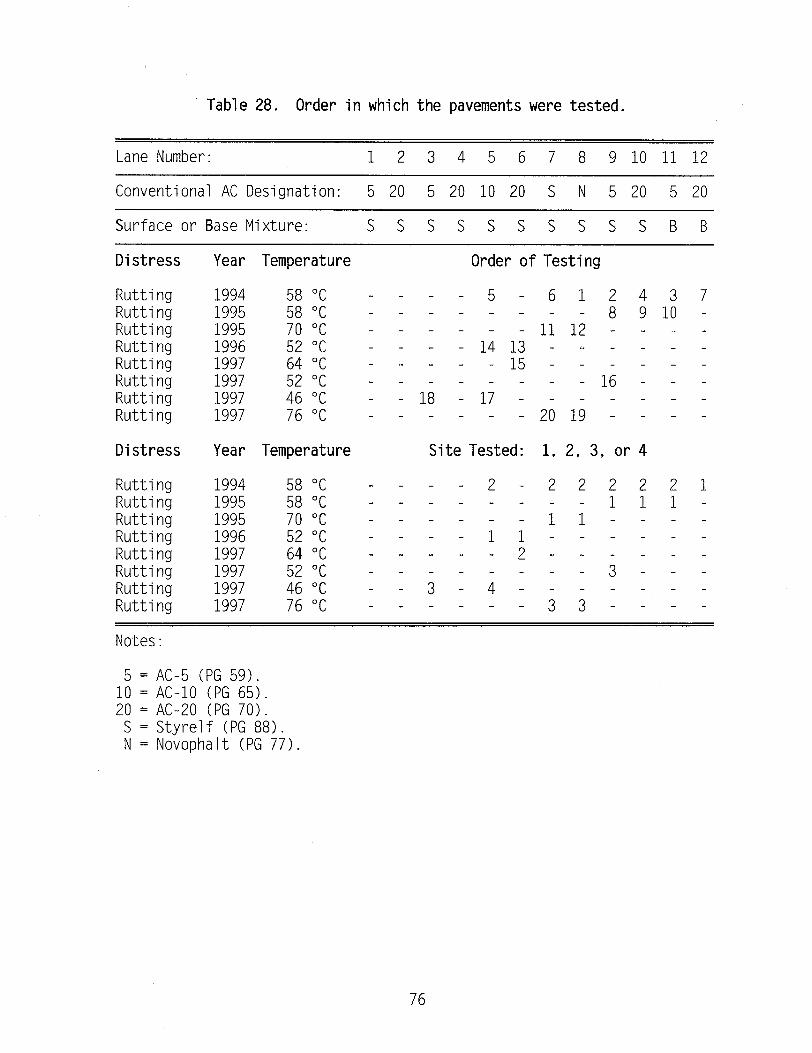
Table 28. Order in which the pavements were tested.
Lane Number: 1 2 3 4 5 6 7 8 910 Ill.12
Conventional AC Designation: 5 20 5 20 10 20 S N 5 20 5 20
Surface or Base Mixture: SSSSSSSSSSBB
Distress
Rutting 1994 Rutting 1995 Rutting 1995 Rutting 1996 Rutting 1997 Rutting 1997 Rutting 1997 Rutting 1997
Distress
Rutting Rutting Rutting Rutting Rutting Rutting Rutting Rutting
Year Temperature Order of Testing
58 "C 58 "C 70 "C 52 "C 64 "C 52 "C 46 "C 76 "C
- - - - 5 - 612437 - - - - - - - - 8 910 - - - - - - - 1112 - - - - - - - -1413 - - - - - - - - - - -15 - - - - - - - - _ - - - - _ 16 _ _ _
- 18 -17 ----- - - - - - - - - 2019 - - - -
Year Temperature Site Tested: 1, 2, 3, or 4
1994 58°C _ - - _ 2 _ 2 2 2 2 21 1995 58°C _ _ - - _ _ - - lll- 1995 70°C ------II---- 1996 52°C ----ii------ 1997 64°C -----2-m---- 1997 52°C --------3--- 1997 46°C --3-4-s----- 1997 76°C -T----33----
Notes:
5 = AC-5 (PG 59). 10 = AC-10 (PG 65). 20 = AC-20 (PG 70).
S = Styrelf (PG 88). N = Novophalt (PG 77).
76

Table 29. ALF pavement data for the surface mixtures.
Superpave PG: 5;,";
58-28 "g";
58-28 64-22 Conventional: AC-10 AC-10 AC-20 Lane Number: Target Temp, "C: ii E ;; % z
Pavement Depth
0 mm 20 mm
102 mm 197 mm Difference from 0 mm to 197 mm:
ND
:: 44
ND
Out of Wheelpath In Wheelpath Decrease
Out of Wheelpath In Wheelpath Decrease
Average Decrease for Entire Layer
Final Air Voids, Top 100 mm of Pavement, Percent
Final Air Voids, Bottom 100 mm of Pavement, Percent
5'; 2:6
E 2:2
E 3:5
3.1 2.0 2.0 3.2 3.3
Rut Depth in Asphalt Layer Number of ALF Wheel Passes From the Rut Depth Model
10 mm 2,820 2,980 190 2,140 4,200 15 mm 33,330 740 8,300 35,500 20 mm 192,000 f%ti 1,950 21,720 161,400
Total Rut Depth Number of ALF Wheel Passes From the Rut Depth Model
10 mm 480 1,250 180 910 1,010 15 mm 3,800 5,280 510 2,760 5,620 20 mm 16,520 14,650 1,050 6,070 19,020
Total Rut Depth
10 mm 15 mm 20 mm 30 mm
ND = No data.
Percentage of Rut Depth in the Asphalt Pavement Layer
84 :; ii :: :i
83 i?; 75 Ei L%
77
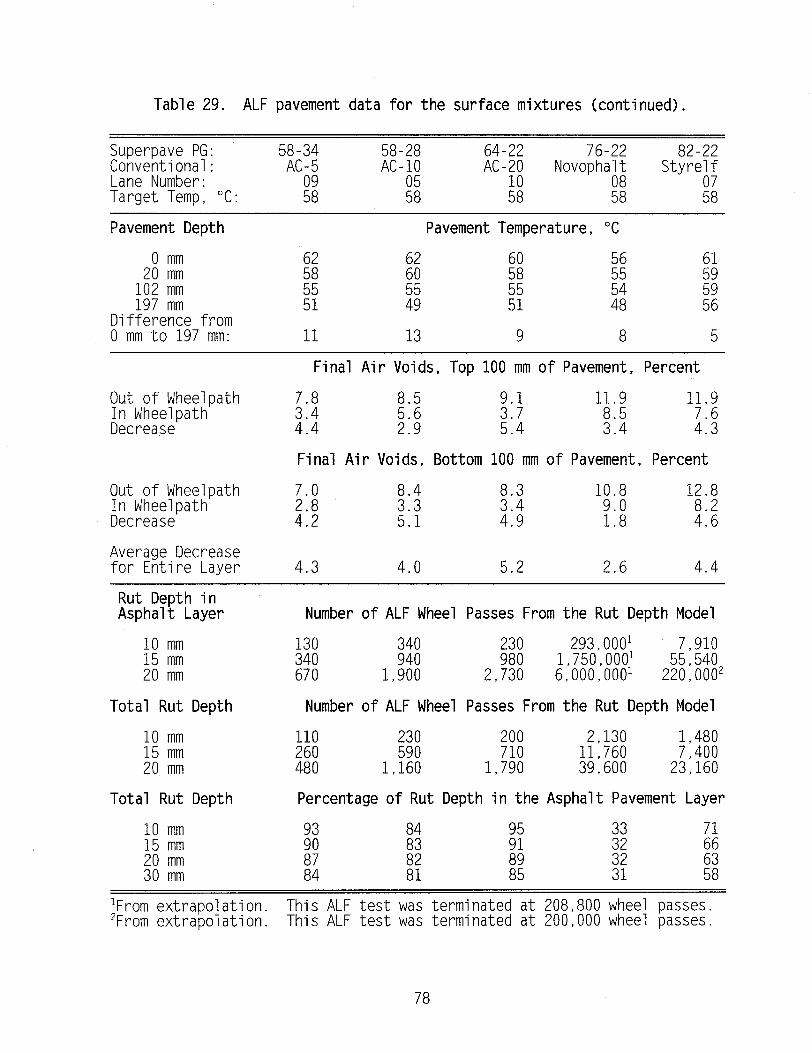
Table 29. ALF pavement data for the surface mixtures (continued).
Superpave PG: 58-34 58-28 64-22 76-22 82-22 Conventional: Lane Number: *?I:
AC-10 AC-20 NovophaAi StyreA:
Target Temp, "C: 58 E ii 58 58
Pavement Depth Pavement Temperature, "C
0 mm 20 mm ;; 8 56; z; :;
102 mm 197 mm
K E ZT 2 59 56
Difference from 0 mm to 197 mm: 11 13 9 8 5
Final Air Voids, Top 100 mm of Pavement, Percent
Out of Wheelpath In Wheelpath Decrease
i-t E 11.9 11.9
4:4 5:4 i:: 2
Final Air Voids, Bottom 100 mm of Pavement, Percent
Out of Wheelpath In Wheelpath Decrease
12.8 E! 4:2
2
5:1
i.i
4:9
%
1:8 E
Average Decrease for Entire Layer 4.3 4.0 5.2 2.6 4.4
Rut Depth in Asphalt Layer
10 mm 15 mm 20 mm
Total Rut Depth Number of ALF Wheel Passes From the Rut Depth Model
10 mm 15 mm 20 mm
110 230 2,130 1,480 Ei 1,160 590 1,790 % 39,600 11,760 23,160 7,400
Total Rut Depth
10 mm 15 mm 20 mm 30 mm
Number of ALF Wheel Passes From the Rut Depth Model
130 230 293, oool 7,910 340 i% 980 1,750,0001 55,540 670 1,900 2,730 6,000,0001 220,000*
Percentage of Rut Depth in the Asphalt Pavement Layer
FE ii ;a i; 2
Kl i: 85 ;: zi
'From extrapolation. 'From extrapolation.
This ALF test was terminated at 208,800 wheel passes. This ALF test was terminated at 200,000 wheel passes.
78
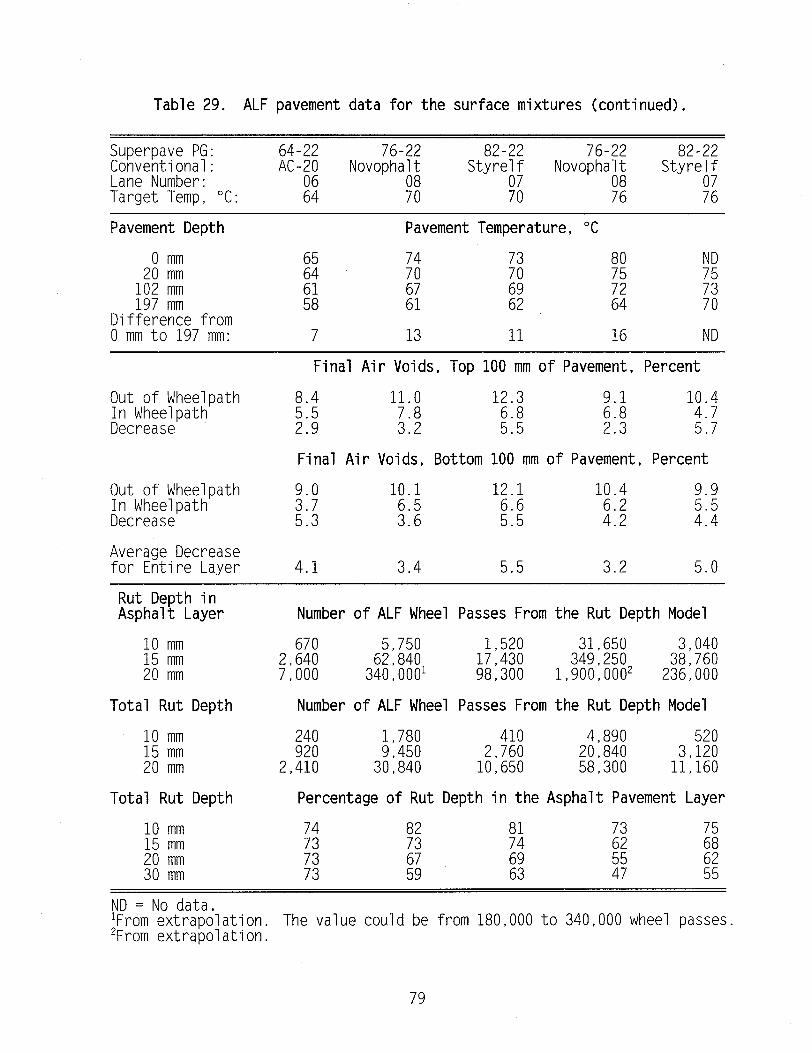
Table 29. ALF pavement data for the surface mixtures (continued).
Superpave PG: 64-22 76-22 82-22 76-22 82-22 Conventional: AC-20 Lane Number:
8 NovophaAk StyreAf
Novophalt Styreilf
Target Temp, "C: 70 70 ;i 76
Pavement Depth
0 mm 20 mm
102 mm 197 mm Difference from 0 mm to 197 mm:
Pavement Temperature, "C
:i :z 7: YSD
i: Fi; E :i
13 11 16 ND
Final Air Voids, Top 100 mm of Pavement, Percent
Out of Wheelpath In Wheelpath Decrease
t-2 11.0 12.3 10.4
4.7 2:9 i:; E 5.7
Final Air Voids, Bottom 100 mm of Pavement, Percent
Out of Wheelpath In Wheelpath Decrease
10.1 12.1 10.4 ;-7 53 E kg i:;
E 4:4
Average Decrease for Entire Layer 4.1 3.4 5.5 3.2 5.0
Rut Depth in Asphalt Layer
:: ZF 20 mm
Total Rut Depth Number of ALF Wheel Passes From the Rut Depth Model
10 mm 15 mm 20 mm
240 1,780 410 4,890 520 920 9,450 2,760 3,120
2,410 30,840 10,650 2: % 11,160
Percentage of Rut Depth in the Asphalt Pavement Layer Total Rut Depth
iii ZFI 20 mm 30 mm
Number of ALF Wheel Passes From the Rut Depth Model
670 5,750 1,520 31,650 3,040 2,640 62,840 17,430 349,250 38,760 7,000 340,0001 98,300 1,900,000* 236,000
ND = No data. 'From extrapolation. *From extrapolation.
The value could be from 180,000 to 340,000 wheel passes.
79

Table 30. Average pavement temperature (~1 and confidence limits (+20) vs. pavement depth.
Rutting Tests
Pavement 46 "C 52 "C 58 "C 64 "C 70 "C 76 "C Depth, mm p +20 /J rt20 ,L/ k20 p +20 /Y rt20 )ll +20
;o 46Nt4 54 51 +4 +6 60 58 +5 k4 65 64 rt4 k5 74 70 k7 +5 80 75 28 +8 102 45 +4 50 +4 56 +3 61 +3 68 +3 72 +8 197 42 +5 42 +5 52 +3 58 +5 61 k3 66 +8 ATemp >4 12 8 7 13 14
ND = No data.
A Temp = Average difference in temperature from the surface of the pavement to the bottom of the pavement, "C.
Table 31. Normalized percent pavement densification.
Superpave PG: 58-34 58-28 58-34 58-28 64-22 Conventional: AC-5 AC-10 AC-5 AC-10 AC-20 Lane Number: 03 05 09 05 06 Target Temp, "C: 46 46 52 52 52
Top Half, % 3.6 Bottom Half, % 2.2 $2 ::i k:? i:;
Superpave PG: 58-34 58-28 64-22 76-22 82-22 Conventional: AC-5 AC-10 AC-20 Novophalt Styrelf Lane Number:
:i :z 10 08
Target Temp, "C: 58 58 ki;
Top Half, percent 2.9 3.4 4.3 Bottom Half, percent Z:i 5.2 ;:; 2.9 3.7
Superpave PG: 64-22 76-22 82-22 76-22 82-22 Conventional: AC-20 Novophalt Styrelf Novophalt Styrelf Lane Number: 08 07 08 07 Target Temp, "C: ii 70 70 76 76
Top Half, percent i:;
3.2 ;:;
2.3 Bottom Half, percent 4.5 2.9 2:;
80
52
Figure 17. Example of pavement temperature vs. time (lane 7 site 2).
q At 20-mm depth A At 102-mm depth

d. Pavement Cracks
Surface cracks less than 4 mm in width were observed on some of the pave- ments tested for rutting susceptibility. The bowed sidewalls of the tire, being wider than the tire imprint, started to tear the mixture on each side of the tire when the rut depths were high. These tears were at an angle of about 0.45 rad (25 degrees) relative to the forward direction of the wheel. Tears up to 7 mm in width were observed on lane 9 at a test temperature of 52 "C. This lane contained the AC-5 (PG 58-34) binder.
Thin, longitudinal, tensile cracks due to pavement bending were visible on the pavement with Novophalt when tested at 58 and 70 "C, and on the pavement with Styrelf when tested at 70 "C. These cracks occurred on both sides of the wheelpath at the point where the pavement surface was bending the greatest. All cracks initiated at the surface of the pavement. They were first observed when the total rut depth in all layers was approximately 25 mm.
Neither type of crack would be expected to occur on pavements where the wheels can wander.
e. Pavement Rutting Data
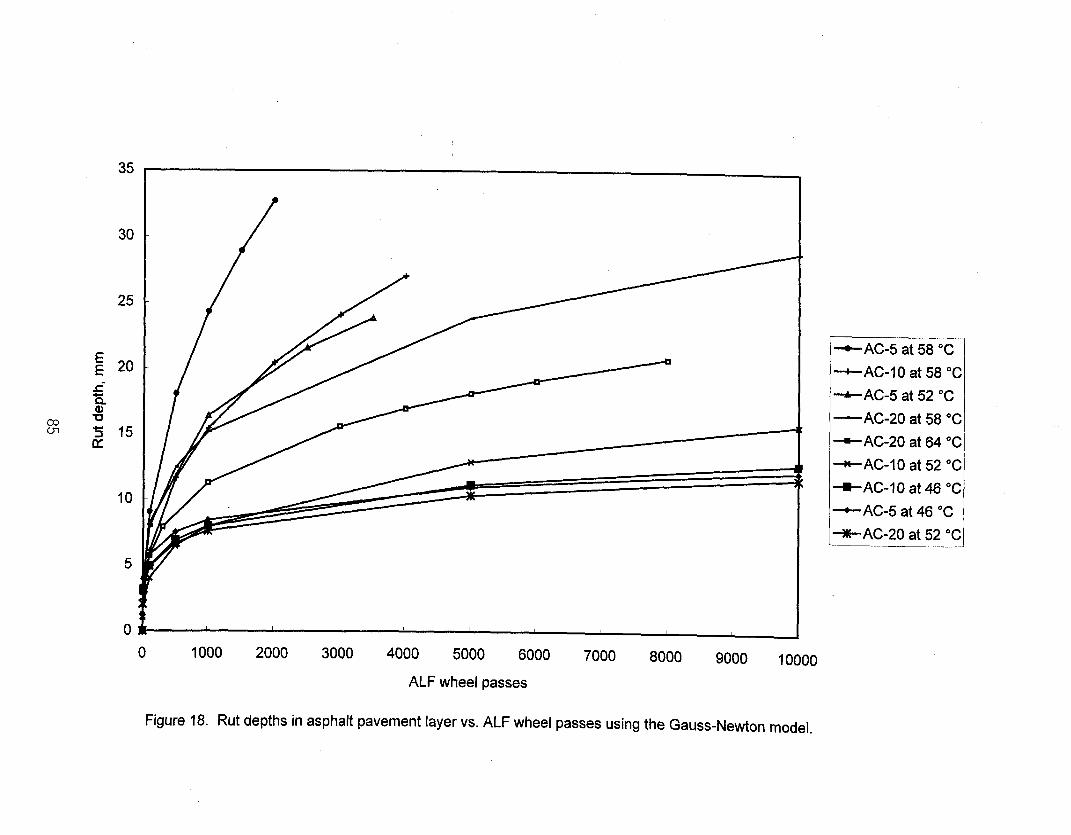
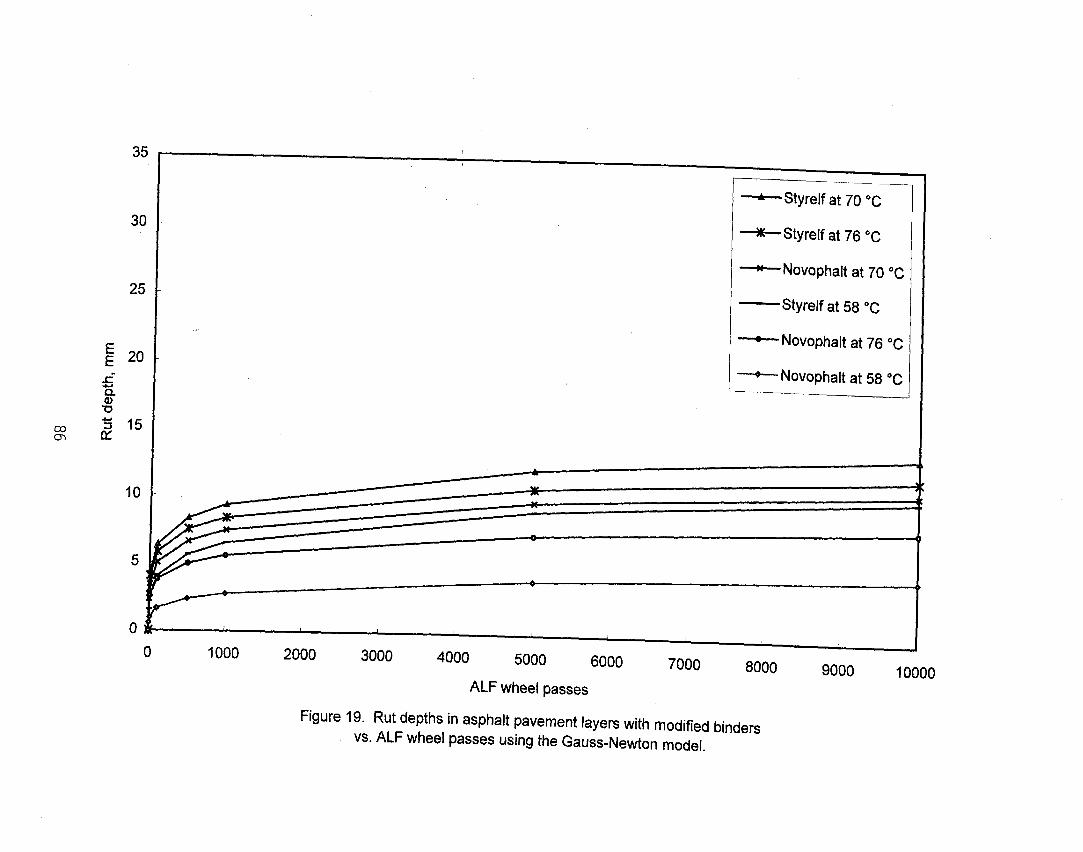
The ALF wheel passes that provided rut depths of 10, 15, and 20 mm in the asphalt pavement layer using the Gauss-Newton model are shown in tables 29 and 32. The rut depths for the pavement tests up to 10,000 wheel passes are shown in figures 18 and 19. The measured rut depths from the beginning to the end of each test, the corresponding rut depths based on the Gauss-Newton model, and additional supporting graphs are given in appendix C. (Also included in appendix C is a comparison of the downward only total rut depth and the peak-to-valley total rut depth. The latter rut depth includes any uplift of mixture outside the wheelpath.)
The tests on the Novophalt pavement at 58, 70, and 76 "C, and the test on the Styrelf pavement at 58 "C, were terminated before a 20-mm rut depth was obtained. The final rut depths in the asphalt pavement layer and in all layers are given in table 33. The Novophalt pavement tests at 58 and 76 "C were terminated because the mixture virtually stopped rutting at rut depths of 9 and 17 mm, respectively. The test at 70 "C was terminated prematurely at 125,000 wheel passes. The wheel passes for this test needed to provide a rut depth of 20 mm could be from 180,000 to 340,000, depending upon the method of extrapolation. The test on the Styrelf pavement at 58 "C was terminated because the rutting rate became very low. The wheel passes needed to provide a rut depth of 20 mm could be from 220,000 to 400,000, depending upon the method of extrapolation. The test on the Styrelf pavement at 70 "C was ter- minated after a 20-mm rut depth was obtained. Even so, the number of wheel passes at a rut depth of 20 mm could be from 98,300 to 145,000 because the Gauss-Newton model fit the data poorly at high numbers of wheel passes.
82

3. Validation of G*/Sins
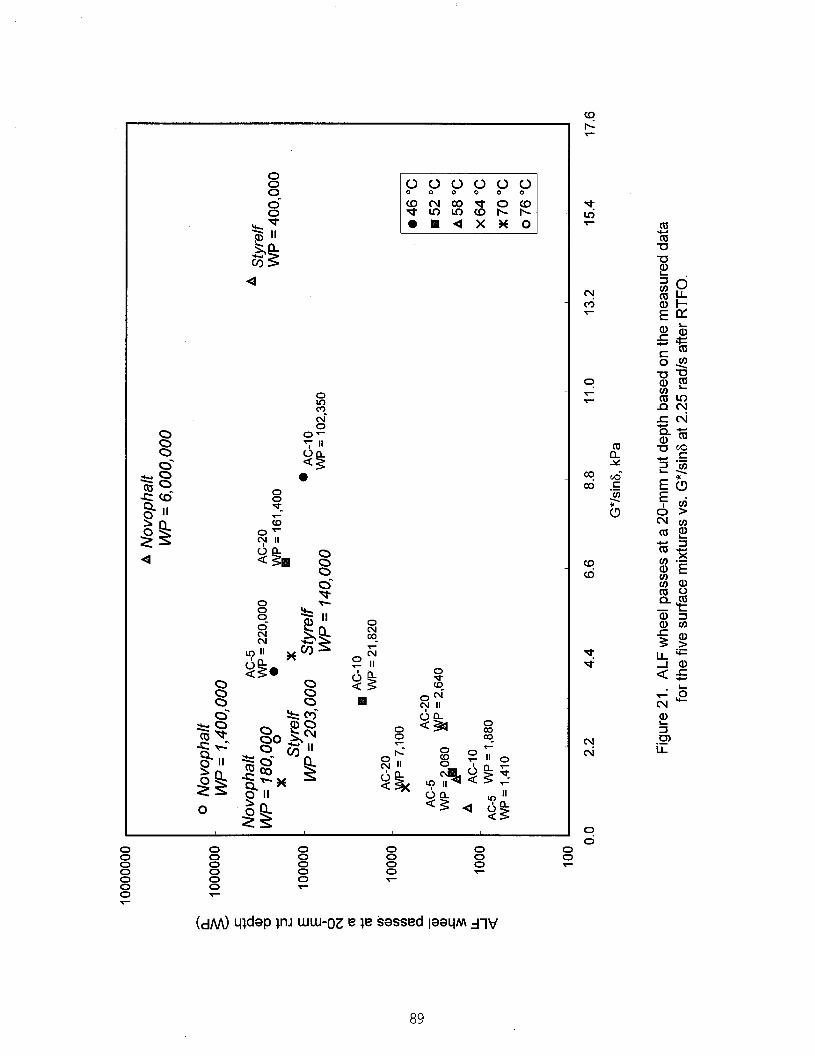
The rut depths in the asphalt pavement layer were used to validate G*/sina. The data in table 32 show that the G*/sins's of the Novophalt and Styrelf binders did not agree with the rut depths at all three pavement test temperatures. The Styrelf binder had the higher G*/sin6, but the pavement with Novophalt was more resistant to rutting. Other discrepancies between the data are discussed later in this chapter. Figures 20 and 21 show that the relationship between ALF wheel passes at a ZO-mm rut depth and G*/sin6 was poor, although the trend was correct for the unmodified binders. The wheel passes from the Gauss-Newton model are shown in figure 20, while the measured wheel passes are shown in figure 21. The scatter in the data was the same using a failure rut depth of 10, 15, or 20 mm. For the pavement tests where the wheel passes depended on the method of extrapolation, the same level of scatter was obtained regardless of the method of extrapolation that was used. If the data from the Novophalt and Styrelf pavement tests are excluded from the analysis, a minimum allowable G*/sin6 of 3.3 to 4.4 kPa would eliminate the poorest performing mixtures.
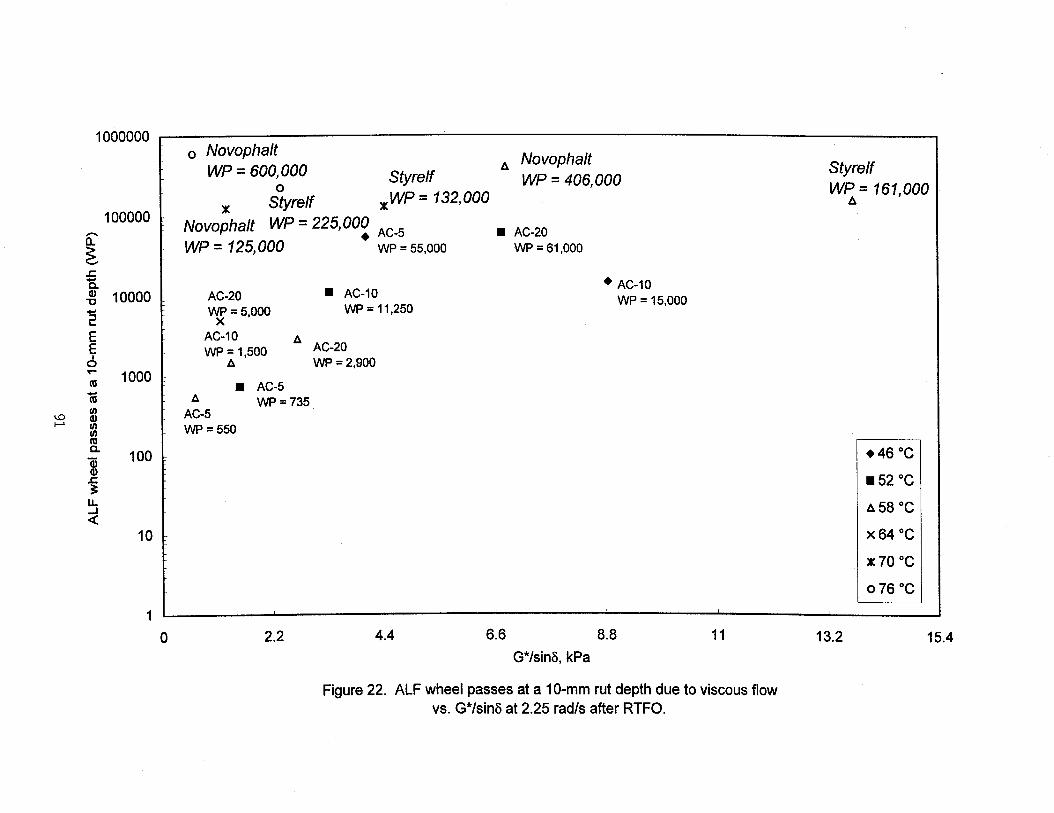
As stated previously, approximately 20 to 55 percent of the ZO-mm maximum allowable rut depth in the asphalt pavement layer was densification. Because the amount of densification was not constant from pavement to pavement, it was decided to subtract the rut depth due to densification from the total rut depth in the asphalt pavement layer to obtain and analyze the rut depth due to viscous flow. The rut depth due to densification was calculated from the reduction in air voids provided by cores taken from in and out of the wheel- path after failure. It was then assumed that the rut depth due to densifi- cation occurred prior to obtaining a lo-mm rut depth due to viscous flow and was thereafter a constant. Thus, for each pavement test, the rut depth due to densification was subtracted from the rut depths in the asphalt pavement layer to provide a relationship between the rut depth due to viscous flow and ALF wheel passes. Table 34 provides the number of ALF wheel passes at a lo-mm rut depth due to viscous flow. Figure 22 shows that the relationship using these rut depths was similar to those shown in figures 20 and 21.
As discussed in chapter 2, the problem encountered when performance was based on the rut depths at a constant number of ALF wheel passes was that either excessive extrapolations had to be performed to obtain the rut depths for pavements that failed quickly, or the pavements had to be compared at wheel passes that were low relative to the lives of longest lasting pavements. Even so, it was decided to compare the G*/sina's of the binders to the rut depths at 2,730 wheel passes from the Gauss-Newton model. The AC-20 (PG 70) surface mixture was considered the control mixture in this analysis. This mixture failed at 2,730 wheel passes based on a rut depth of 20 mm. The data are given in table 34. The rut depths for many of the pavements were rela- tively low; thus, the assumption that the rut depth due to densification could be subtracted from the total rut depth in the asphalt pavement layer was not valid and could not be used. Figure 23 shows that the relationship was poor, although all pavements with a G*/sin6 around 3.3 kPa and greater were perform- ing well at 2,730 wheel passes. No data point was found to be an outlier.
83
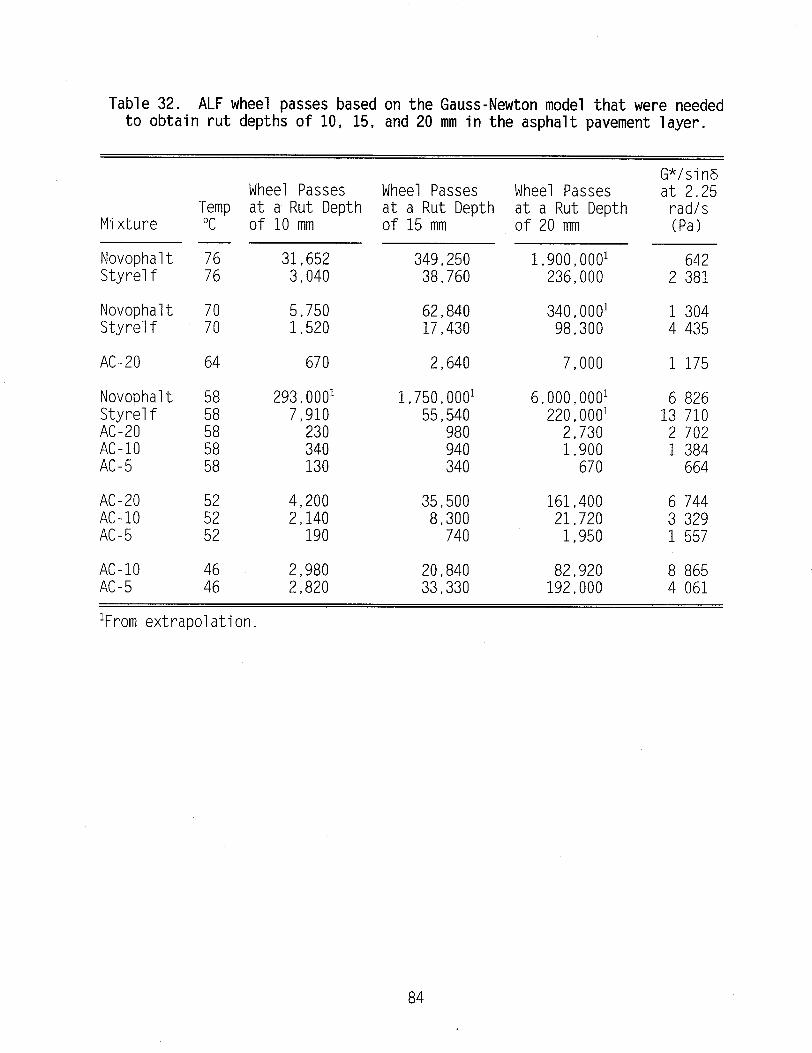
Table 32. ALF wheel passes based on the Gauss-Newton model that were needed to obtain rut depths of 10, 15, and 20 mm in the asphalt pavement layer.
Mixture Temp "C
Wheel Passes Wheel Passes Wheel Passes at a Rut Depth at a Rut Depth at a Rut Depth of 10 mm of 15 mm of 20 mm
G*/sins at 2.25
rad/s (Pa>
Novophalt 76 31,652 349,250 1,900,0001 642 Styrelf 76 3,040 38,760 236,000 2 381
Novophalt Styrelf
5.750 62,840 340,0001 1 304 1,520 17,430 98,300 4 435
AC-20 64 670 2,640 7,000 1 175
Novophalt Styrelf AC-20 AC-10 AC-5
293, oool 1,750,0001 6,000,0001 6 826 7,910 55,540 220,0001 13 710
230 980 2,730 2 702 340 940 1,900 1 384 130 340 670 664
AC-20 AC-10 AC-5
z; 52
4,200 35,500 161,400 6 744 2,140 8,300 21,720 3 329
190 740 1,950 1 557
AC-10 46 2,980 20,840 82,920 8 865 AC-5 46 2,820 33,330 192,000 4 061
'From extrapolation.
84
25
5
0 0 1000 2000 3000 4000 5000 6000
ALF wheel passes 7000 8000 9000 10000
Figure 18. Rut depths in asphalt pavement layer VS. ALF wheel passes using the Gauss-Newton model.
-cAC-5 at 58 “C +AC-10 at 58 “C +--AC-5 at 52 “C -AC-20 at 58 “C -AC-20 at 64 “C *AC-IO at 52 “C +AC-IO at 46 “C 4--AC-5 at 46 “C *AC-20 at 52 “C
35
30
25
E 20
IO
5
i
0 d / I I , , / 6 0 1000 2000 3000 4000 5000 6000 7000 8000 9000 10000
ALF wheel passes
-Styrelf at 70 “C
*Styrelf at 76 “C
-Novophalt at 70 ‘1 C
-Styrelf at 58 “C
i
-Novophalt at 76 ‘1 s
--+-- Novophalt at 58 “( 2
Figure 19. Rut depths in asphalt pavement layers with modified binders vs. ALF wheel passes using the Gauss-Newton model.
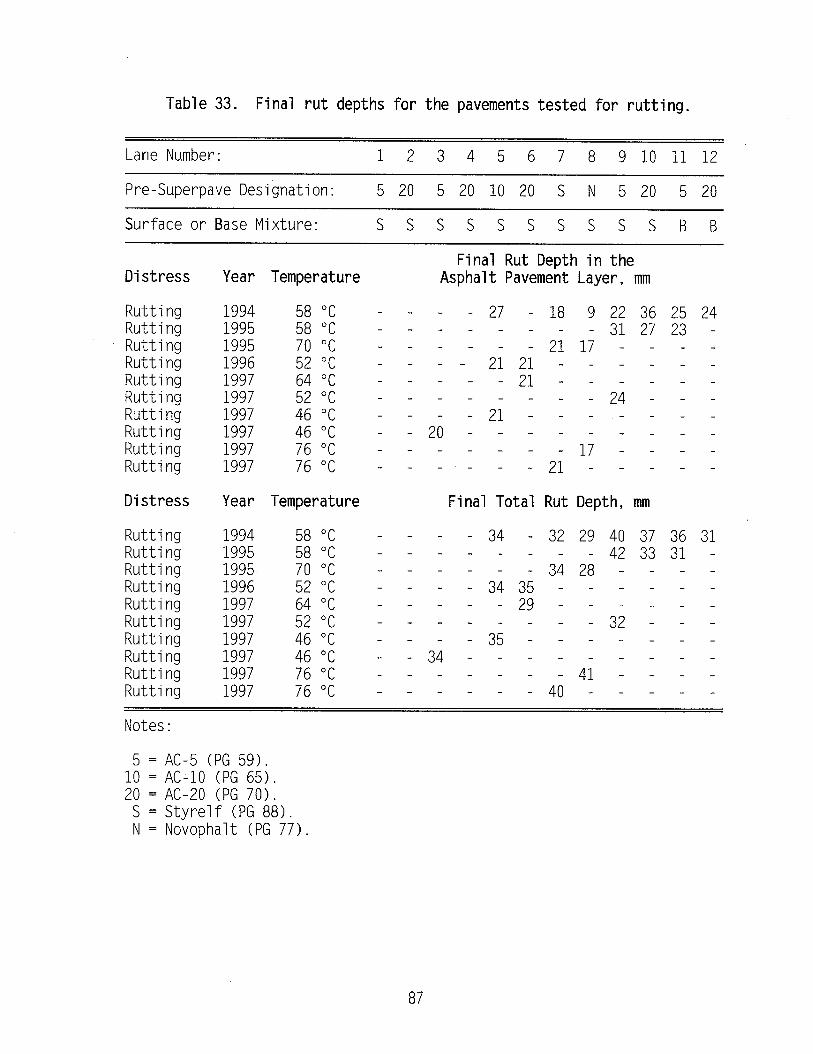
Table 33. Final rut depths for the pavements tested for rutting.
Lane Number: 1 2 3 4 5 6 7 8 910 1112
Pre-Superpave Designation: 5 20 5 20 10 20 S N 5 20 5 20
Surface or Base Mixture: SSSSSSSSSSBB
Distress Year
Rutting 1994 Rutting 1995 Rutting 1995 Rutting 1996 Rutting 1997 Rutting 1997 Rutting 1997 Rutting 1997 Rutting 1997 Rutting 1997
Distress Year
Rutting Rutting Rutting Rutting Rutting Rutting Rutting Rutting Rutting Rutting
1994 58 "C 1995 58 "C 1995 70 "C 1996 52 "C 1997 64 "C 1997 52 "C 1997 46 "C 1997 46 "C 1997 76 "C 1997 76 "C
Temperature
58 "C 58 "C 70 "C 52 "C 64 "C 52 "C 46 "C 46 "C 76 "C 76 "C
Temperature
Final Rut Depth in the Asphalt Pavement Layer, mm
- - - - 27 - 18 9 22 36 - - - - - - _ - 31 27 - - - - - - 21 17 - - - - -- 21 21 - - - - - - - - - 21 - - - - - - - - - _ _ - 24 - - - - - 21 - - - - -
-20 ---- -__ - - - - - - -17 - - - - - - _ - 21 - - -
Final Total Rut Depth, mm
- - - - 34 - 32 29 40 37 - - - - - - - - 42 33 - - - - - - 34 28 - - - - - - 3435 - - - - - - - - - 29 - - - - - - - - - - - - 32 - - - - -35 - - - - -
-34----- - - - - - - - - -41 - - - - - - - -40 - - -
25 24 23 -
- -
36 31 31 -
- -
Notes:
5 = AC-5 (PG 59). 10 = AC-10 (PG 65). 20 = AC-20 (PG 70).
S = Styrelf (PG 88). N = Novophalt (PG 77).
87

100000
10000
1000
100
A Novophalt WP = 6,000,OOO
0 Novophalt WP = 7,900,000
Novophalt VVP = 340,000
0 AC-5 + WP = 192,000
&@;36,000 m AC-20 WP = 161,400
Styrelf + tip = 98,300 AC-10
WP = 82,920 AC-10 WP = 21,720
x AC-20 WP = 7,000
AC-$ AC-20 WP = 2,730
AC- 10 wp = , ,goowp = 1,950
A AC-5
WP = 670
A Styrelf WP = 220,000
0.0 2.2 4.4 6.6 8.8
G*/sinG, kPa
11.0 13.2 15.4 17.6
Figure 20. ALF wheel passes at a 20-mm rut depth based on the Gauss-Newton model for the five surface mixtures vs. G*/sin6 at 2.25 rad/s after RTFO.
l
(dM) y$dap $rlJ UUI-OZ e Je sassed IWyM jlv
89
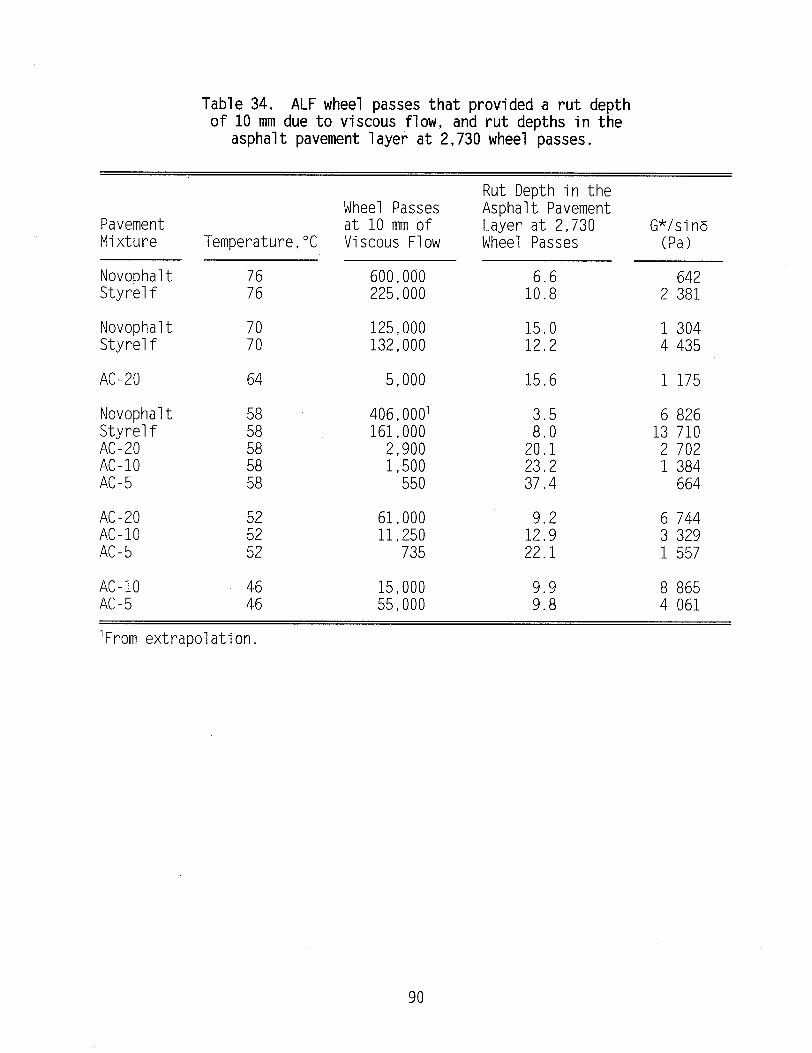
Table 34. ALF wheel passes that provided ,a rut depth of 10 mm due to viscous flow, and rut depths in the
asphalt pavement layer at 2,730 wheel passes.
Rut Depth in the Asphalt Pavement Layer at 2,730 Wheel Passes
Wheel Passes at 10 mm of Viscous Flow
Pavement Mixture
G*/sin6 (Pa> Temperature,"C
Novophalt Styrelf
600,000 6.6 642 225,000 10.8 2 381
Novophalt 70 125,000 15.0 1 304 Styrelf 70 132,000 12.2 4 435
AC-20 64 5.000 15.6 1 175
Novophalt Styrelf AC-20 AC-10 AC-5
406,000] 161,000
2,900 1,500
550
E 20:1 23.2 37.4
6 826 13 710 2 702 1 384
664
1E 22:1
AC-20 AC-10 AC-5
;: 52
61,000 11,250
735
6 744 3 329 1 557
AC-10 46 15,000 AC-5 46 55,000
8 865 4 061
'From extrapolation.
90
0 Novophalt WP = 600,000 Styrelf
A Novophalt
SYyrelf WP = 406,000
m WP = 732,000
Novo;halt WP = 225,OOt AC-5 n AC-20 WP = 125,000 WP = 55,000 WP = 61,000
Styrelf Wz= 167,000
AC-20 w AC-10 wx’ = 5,000 WP = 11,250
AC-IO
wp 2500 A AC-20
WP = 2,900
a AC-5 A WP = 735
AC-5 WP = 550
+ AC-10 WP = 15,000
+46 “C
n 52 “C
A58 “C
x64 “C
m70 “C
076°C
2.2 4.4 6.6 8.8 11 13.2 15.4 G*/sin& kPa
Figure 22. ALF wheel passes at a IO-mm rut depth due to viscous flow vs. G*/sinG at 2.25 rad/s after RTFO.

35
30
10
5
0 0
I
2.2
I
4.4
I
6.6
G*/sinG, kPa
\ i
8.8 11 13.2
Figure 23. Rut depth at 2,730 ALF wheel passes vs. G*/sinG at 2.25 rad/s after RTFO.

Table 35 provides the pavement data according to binder type. These data show that there were discrepancies between the ALF wheel passes and temperature for the pavements with Novophalt, Styrelf, and AC-20 (PG 70). It was hypothesized that the binders hardened over time, thus providing relatively high wheel passes for the tests performed in 1997. The mixture with the AC-5 (PG 59) binder also performed better than the mixture with the AC-10 (PG 65) binder at 46 "C, although both tests were performed in 1997. Table 36 shows how the high-temperature continuous PG's of binders recovered from the pavements varied from test to test. The binders were recovered from the top halves of the pavements, although rutting occurred throughout the asphalt pavement layer. Based on these PG's, most of the binders during pavement testing were stiffer than the laboratory binder samples tested after RTFO aging. Unfortunately, the PG's did not explain the discrepancy for the Styrelf pavement tests or the discrepancy for the AC-5 and AC-10 (PG 59 and 65) pavement tests performed in 1997 at 46 "C.
Table 37 provides the G*/sin6's of the recovered binders at the pavement test temperature and 10.0 rad/s. These data did not explain the discrepan- cies except, possibly, for the Novophalt binder, which had a higher G*/sins at 76 "C than at 70 "C. Figure 24 presents the relationship between these G*/sinKs and ALF wheel passes. The replicate ALF tests performed at 58 "C on the pavements with the AC-5 and AC-20 (PG 59 and 70) binders were treated as individual tests because table 37 showed that the G*/sit%'s were higher in 1995 compared with 1994. The relationship was poor, and all G*/sina's were above the Superpave specification level of 2.20 kPa. Figure 25 shows that the relationship using the ALF wheel passes at a lo-mm rut depth due to viscous flow was also poor. The use of recovered binder properties did not improve the correlation between G*/sins and ALF pavement rutting performance.
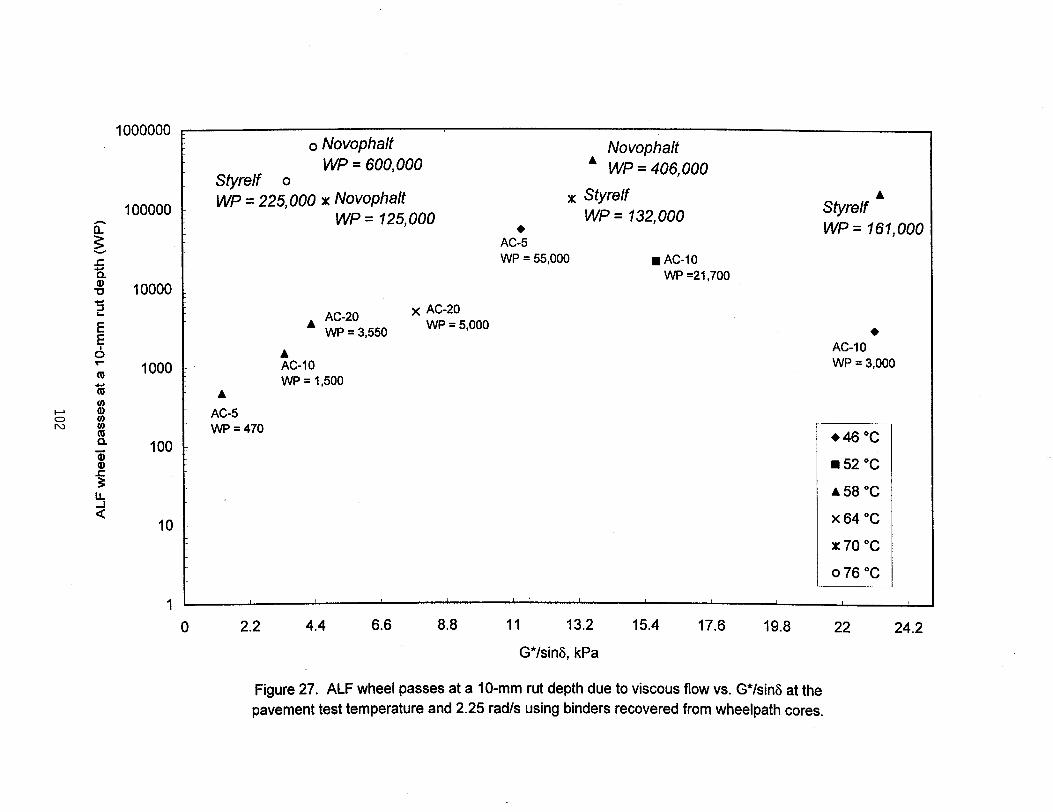
Table 38 provides the G*/sins's of the recovered binders at the pavement test temperature and 2.25 rad/s. Most G*/sins's were above the Superpave specification level of 2.20 kPa. Figures 26 and 27 show that the trend was correct for the pavements with unmodified binders, except for the low number of wheel passes for the AC-10 (PG 65) pavement test at 46 "C shown in figure 27. Figure 28 provides the relationship between the rut depths at 2,730 wheel passes and the G*/sin?Ys of the recovered binders at 2.25 rad/s. All pavements with a G*/sina around 10.0 kPa and greater were performing well at 2,730 wheel passes. No data point was found to be an outlier.
4. Supplemental Analyses Performed on the ALF Pavement Data
a. Rut Depth in the Asphalt Pavement Layer vs. Total Rut Depth
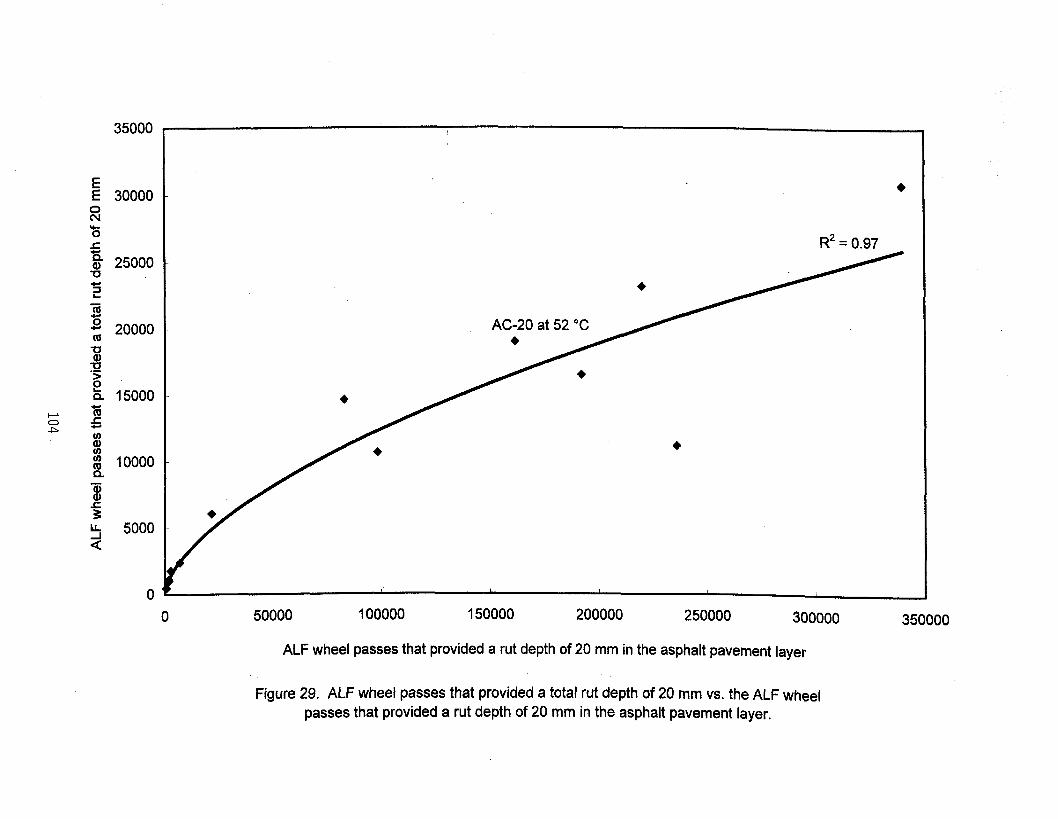
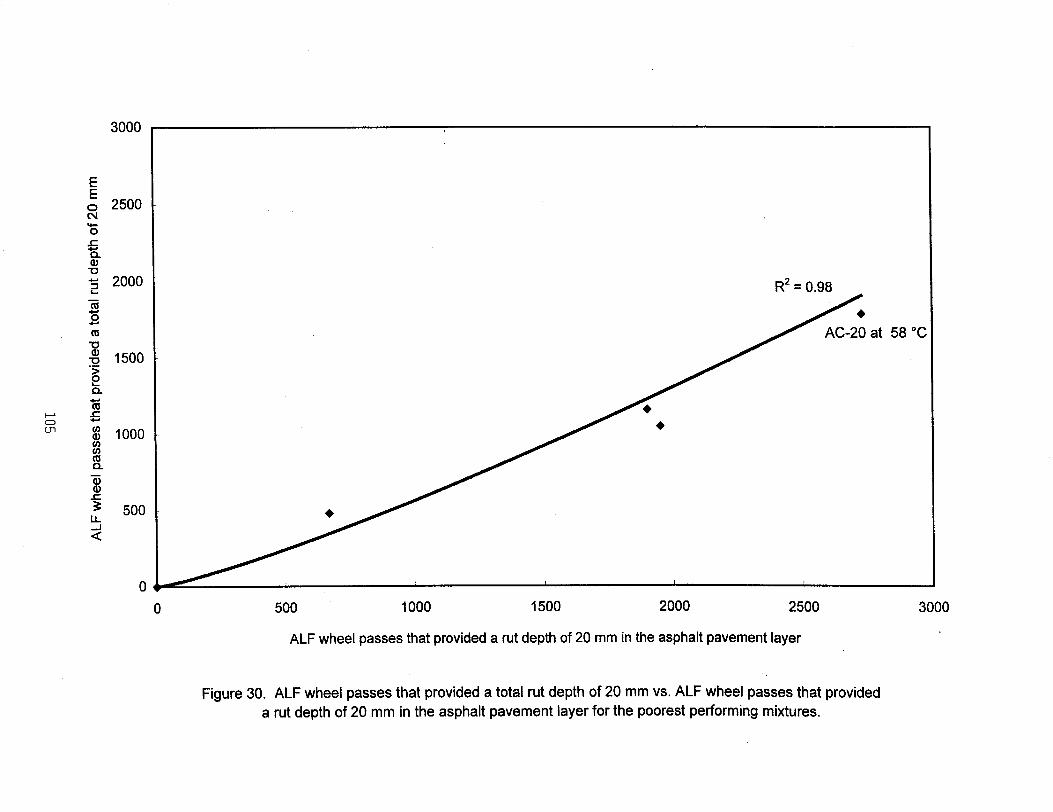
The relationship between the ALF wheel passes that provided a total rut depth of 20 mm and the ALF wheel passes that provided a rut depth of 20 mm in the asphalt pavement layer is shown in figure 29. The wheel passes for the Novophalt pavement tests at 58 and 76 "C, which were found to be greater than l,OOO,OOO through extrapolation, are not included. Figure 30 shows the data for the four pavements that had the lowest number of wheel passes at failure.
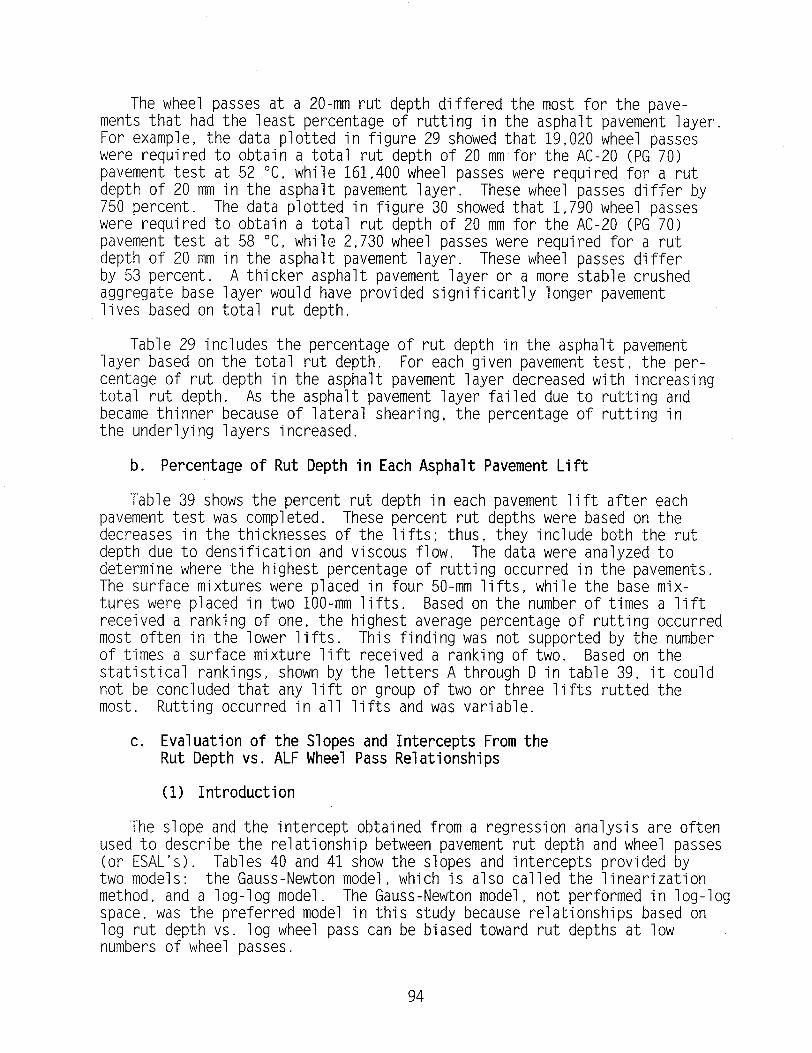
The wheel passes at a ZO-mm rut depth differed the most for the pave- ments that had the least percentage of rutting in the asphalt pavement layer. For example, the data plotted in figure 29 showed that 19,020 wheel passes were required to obtain a total rut depth of 20 mm for the AC-20 (PG 70) pavement test at 52 "C, while 161,400 wheel passes were required for a rut depth of 20 mm in the asphalt pavement layer. These wheel passes differ by 750 percent. The data plotted in figure 30 showed that 1,790 wheel passes were required to obtain a total rut depth of 20 mm for the AC-20 (PG 70) pavement test at 58 "C, while 2,730 wheel passes were required for a rut depth of 20 mm in the asphalt pavement layer. These wheel passes differ by 53 percent. A thicker asphalt pavement layer or a more stable crushed aggregate base layer would have provided significantly longer pavement lives based on total rut depth.
Table 29 includes the percentage of rut depth in the asphalt pavement layer based on the total rut depth. For each given pavement test, the per- centage of rut depth in the asphalt pavement layer decreased with increasing total rut depth. As the asphalt pavement layer failed due to rutting and became thinner because of lateral shearing, the percentage of rutting in the underlying layers increased.
b. Percentage of Rut Depth in Each Asphalt Pavement Lift
Table 39 shows the percent rut depth in each pavement lift after each pavement test was completed. These percent rut depths were based on the decreases in the thicknesses of the lifts: thus, they include both the rut depth due to densification and viscous flow. The data were analyzed to determine where the highest percentage of rutting occurred in the pavements. The surface mixtures were placed in four 50-mm lifts, while the base mix- tures were placed in two loo-mm lifts. Based on the number of times a lift received a ranking of one, the highest average percentage of rutting occurrec most often in the lower lifts. This finding was not supported by the number of times a surface mixture lift received a ranking of two. Based on the statistical rankings, shown by the letters A through D in table 39, it could not be concluded that any lift or group of two or three lifts rutted the most. Rutting occurred in all lifts and was variable.
C. Evaluation of the Slopes and Intercepts From the Rut Depth vs. ALF Wheel Pass Relationships
(1) Introduction
The slope and the intercept obtained from a regression analysis are often used to describe the relationship between pavement rut depth and wheel passes (or ESAL's). Tables 40 and 41 show the slopes and intercepts provided by two models: the Gauss-Newton model, which is also called the linearization method, and a log-log model. The Gauss-Newton model, not performed in log-log space, was the preferred model in this study because relationships based on log rut depth vs. log wheel pass can be biased toward rut depths at low numbers of wheel passes.
94

Table 35. ALF wheel passes that were needed to obtain rut depths of 10, 15, and 20 mm in the asphalt pavement layer.
Mixture
Pavement Temp, "C and Year of Test
Novophalt 76 1997 Novophalt 70 1995 Novophalt 58 1994
Styrelf 76 1997 3,040 38,760 236,000 2 381 Styrelf 70 1995 1,520 17,430 98,300 4 435 Styrelf 58 1994 7,910 55,540 220.0001 13 710
AC-20 64 1997 670 2,640 7,000 1 175 AC-20 58 1994 262 1,031 2,724 2 702 AC-20 58 1995 206 937 2,741 2 702 AC-20 52 1996 4,200 35,500 161,400 6 744
AC-10 58 1994 340 940 1,900 1 384 AC-10 52 1996 2,140 8,300 21,720 3 329 AC-10 46 1997 2,980 20,840 82,920 8 865
AC-5 58 1994 115 279 521 664 AC-5 58 1995 143 395 814 664 AC-5 52 1997 190 740 1,950 1 557 AC-5 46 1997 2,820 33,330 192,000 4 061
Rut Depth Rut Depth of 10 mm of 15 mm
Rut Depth of 20 mm
G*/sin6 after RTFO
Aging (Pa>
31,652 349,250 1,900,0001 642 5,750 62,840 340,0001 1 304
293, oool 1,750,0001 6,000,0001 6 826
'From extrapolation.
95
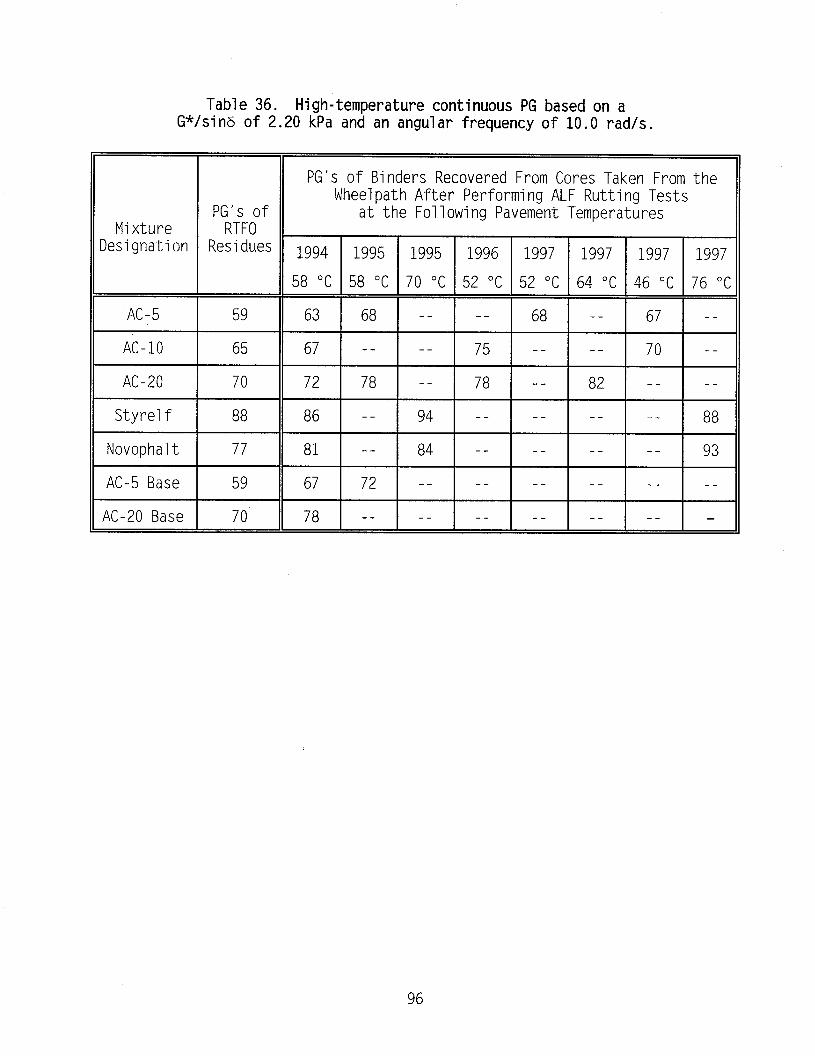
Table 36. High-temperature continuous PG based on a G*/sin6 of 2.20 kPa and an angular frequency of 10.0 rad/s.
PG's of Binders Recovered From Cores Taken From the Wheelpath After Performing ALF Rutting Tests
PG's of at the Following Pavement Temperatures Mixture RTFO
lesignation Residues 1994 1995 1995 1996 1997 1997 1997 1997
58 "C 58 "C 70 "C 52 "C 52 "C 64 "C 46 "C 76 "C
AC-5 59 63 68 -- -- 68 -- 67 --
AC-10 65 67 __ __ 75 __ __ 70 _-
96
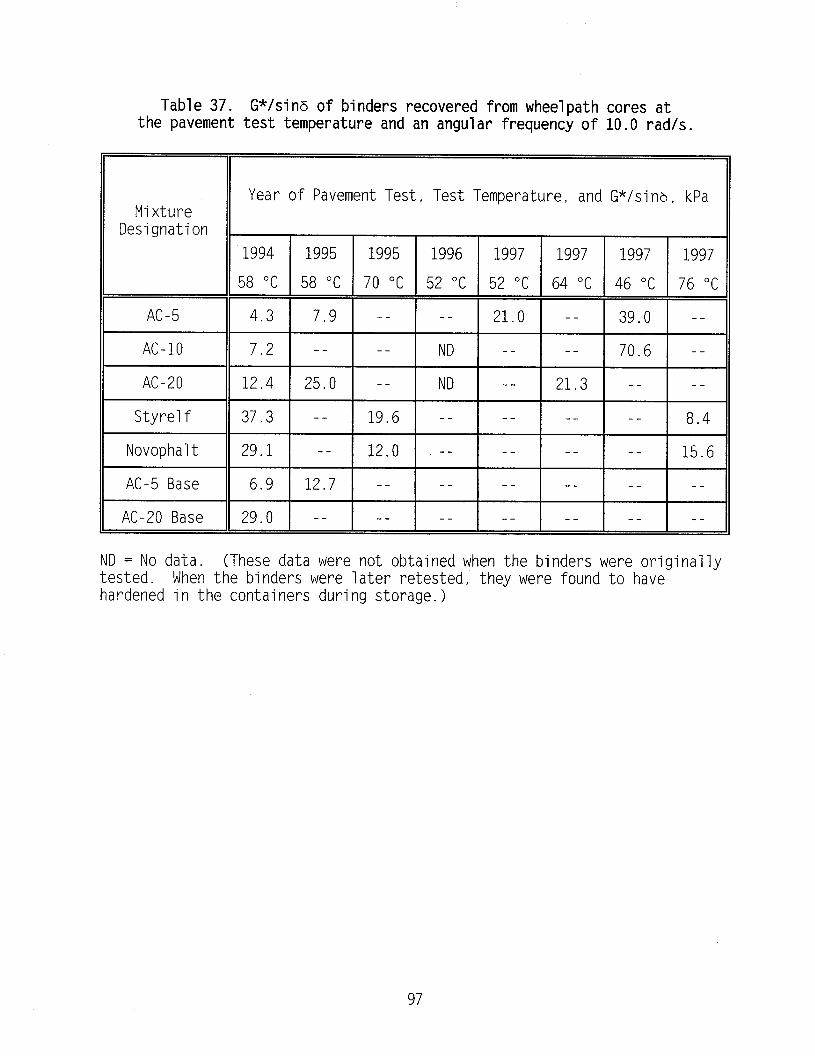
Table 37. G*/sins of binders recovered from wheelpath cores at the pavement test temperature and an angular frequency of 10.0 rad/s.
Year of Pavement Test, Test Temperature, and G*/sins, kPa
12.0 -- -- -- -- 15.6
12.7 __ __ __ __ __ --
29.0 -- -- -- -- -- -- _-
ND = No data. (These data were not obtained when the binders were originally tested. When the binders were later retested, they were found to have hardened in the containers during storage.)
97

100000
10000
1000
100
10
1
A Novophalt
o Novophalt WP = 6,000,OOO
WP = 7,900,000 Styrelf WP = 220,000
Styrelf 0 m Novophalt
WP = 340,000 A* WP = 240,000 m Styrelf AC-5
WP = 192,000 WP = 98,300 +
AC-10
AC-20 WP = 83,000
AC-20 AC-10 WP = 2,700
x WP = 7,000
WP = 1,900 AC-20 A
A w A WP = 2,740 AC-5
A AC-5 A WP = 1,950
AC-5 WP = 840
WP = 520 l 46"C n 52"C A58"C ~64°C
, , u
m70"C 076°C
0 5 10 15 20 25 30 35 40 45 50 55 60 65 70 75
G*/sinG, kPa
Figure 24, ALF wheel passes at a 20-mm rut depth from the Gauss-Newton model vs. G*/sins at the pavement test temperature and 10 radk using binders recovered from wheelpath cores.

1000000 o Novophalt : Novophalt
WP = 600,000 * WP = Styrelf
406,000 0
100000 WP 225,000x Gtyrelf A Styrelf
= : ,WP = Nowhalt WP = 132,000
761,000
WP = 125,000 *AC-5 WP = 55,000
10000 : AC-20 x WP = 5,000
: AC-IO A AC-20 .wP = 1,500 WP = 3,550
AAC-20 +
A WP = 2,708 AC-10
1000 1 WP = 3,000 A AC-5 WC-5
A WP = 665 WP = 735
AC-5 WP=470
100 :
10 :
1 9 I ,
0 5 10 15 20 25 30 35 40 45 50 55 60 65 70 75
G*/sinG, kPa
Figure 25. ALF wheel passes at a lo-mm rut depth due to viscous flow vs. G*/sinG at the pavement test temperature and 10 rad/s using binders recovered from wheelpath cores.
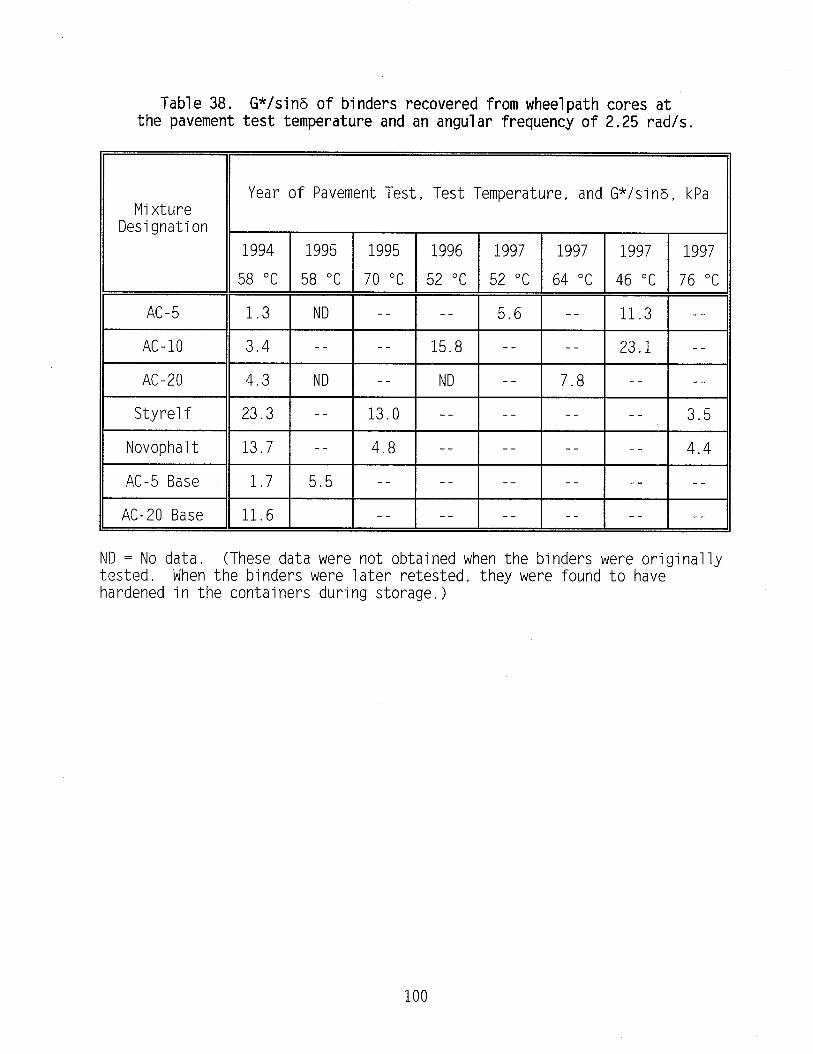
Table 38. G*/sins of binders recovered from wheelpath cores at the pavement test temperature and an angular frequency of 2.25 rad/s.
Year of Pavement Test, Test Temperature, and G*/sin6, kPa
Novophalt 13.7 -- 4.8 -- -- -- -- 4.4
AC-5 Base 1.7 5.5 -- -- -- -- -- --
AC-20 Base 11.6 -- -- -- -- -- --
ND = No data. (These data were not obtained when the binders were originally tested. When the binders were later retested, they were found to have hardened in the containers during storage.)
100

1000000
100000
10000
1000
100
IO
1
Novophalt O WP = 7,900,000
Styrelf 0 x Novophalt
WP = 240,000 WP = 340,000
AC-20 x AC-20 WP = 2,700 WP = 7,000
A A
AC-10 A WP=1,900
AC-5 WP = 520
A Novophalt WP = S,OOO,OOO
AC-5 WP = 192,000
+
m Styrelf WP = 98,300
n
AC-IO WP = 21,700
Styrelf WP = 220,000
A
l AC-10 WP = 83,000
0 2.2 4.4 6.6 8.8 11 13.2
G*/sinG, kPa
15.4 17.6 19.8 22 24.2
Figure 26. AU wheel passes at a Xl-mm rut depth from the Gauss-Newton model vs. G*/sinG at the pavement test temperature and 2.25 rad/s using binders recovered from wheelpath cores.
1000000 L 0 Novophalt 1 Novophalt
WP = 600,000 A = Styrelf WP 406,000 0
wP = 225,000 m Novophalt m sty/-e/r A 100000 z WP = 725,000 WP = 732,000 Styrelf
+ WP = 167.000
10000 y
1000 i
100 E
10 i
A
AC-5 WP = 470
AC-5 WP = 55,000 n AC-IO
WP =21,700
. AC-20 x AC-20
WP = 3,550 WP = 5,000
A AC-l 0 WP = 1,500
AC-l 0 WP = 3,000
l 46 “C
n 52”C
~58°C
x64 “C
m70 “C
076°C
1 ’ I I I t I I I
0 2.2 4.4 6.6 8.8 11 13.2 15.4 17.6 19.8 22 24.2
G*/sinG, kPa
Figure 27. ALF wheel passes at a lo-mm rut depth due to viscous flow vs. G*/sinG at the pavement test temperature and 2.25 rad/s using binders recovered from wheelpath cores.

40
35
30
25
2 i ‘Ti 20 s
2 15
10
5
0 I I /
0 2.2 4.4 6.6 8.8 11 13.2 15.4 17.6 19.8 22 24.2 26.4
G*/sin6, kPa
Figure 28. Rut depth at 2,730 ALF wheel passes vs. G*/sinG at the pavement test temperature and 2.25 rad/s using binders recovered from wheelpath cores.
35000
E 30000 a % .c $ 25000
s ii 5 m 20000
-iii n B h 15000
=J i+ .c
p z 3 8 10000 a
f
; 5000 a
0
0 50000 100000 250000
ALF wheel passes that provided a rut depth of 20 mm in the asphalt pavement layer
Figure 29. ALF wheel passes that provided a total rut depth of 20 mm vs. the ALF wheel passes that provided a rut depth of 20 mm in the asphalt pavement layer.
3000
R2 = 0.98
AC-20 at 58 “C
0 500 1000 1500 2000 2500
ALF wheel passes that provided a rut depth of 20 mm in the asphalt pavement layer
Figure 30. ALF wheel passes that provided a total rut depth of 20 mm vs. ALF wheel passes that provided a rut depth of 20 mm in the asphalt pavement layer for the poorest performing mixtures.
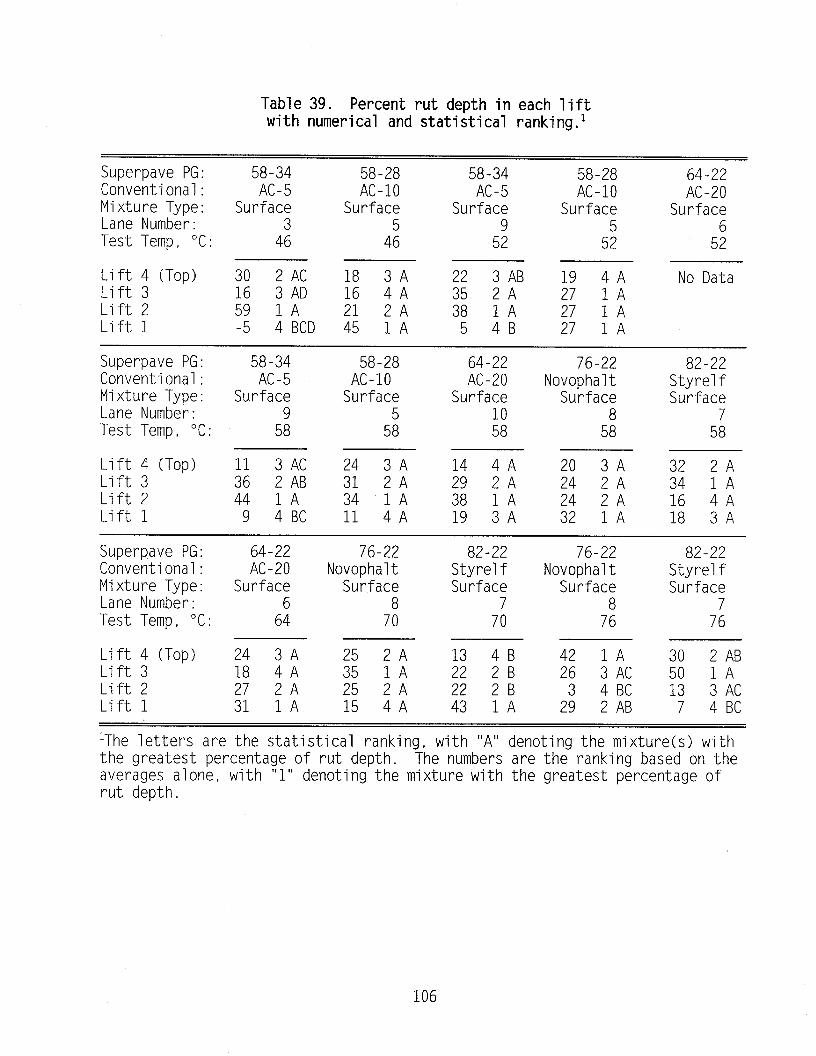
Table 39. Percent rut depth in each lift with numerical and statistical ranking.'
Superpave PG: 58-34 Conventional: AC-5 Mixture Type: Surface Lane Number: Test Temp, "C: 4:
58-28 AC-10
Surface
4:
58-34 AC-5
Surface
5;
Lift 4 (Top) 30 2AC Lift 3 16 3 AD Lift 2 59 1A Lift 1 -5 4 BCD
18 3A 16 4A 21 2A 45 IA
22 3 AB 35 2A 38 1A
5 4B
58-28 64-22 AC-10 AC-20
Surface Surface
5: 5;
19 4A No Data 27 1A 27 1A 27 1A
Superpave PG: Conventional: Mixture Type: Lane Number: Test Temp, "C:
58-34 AC-5
Surface
5;
58-28 AC-10
Surface
5:
64-22 AC-20
Surface
i:
76-22 Novophalt
Surface
5:
82-22 Styrelf Surface
5;
Lift 4 (Top) Lift 3 Lift 2 Lift 1
11 3AC 24 3A 14 4A 20 3A 32 2A 36 2 AB 31 2A 29 2A 24 2A 34 1A 44 1A 34 1A 38 1A 24 2A 16 4A
9 4BC 11 4A 19 3A 32 1A 18 3A
Superpave PG: Conventional: Mixture Type: Lane Number: Test Temp, "C:
64-22 AC-20
Surface
6:
76-22 Novophalt
Surface 8
70
82-22 Styrelf Surface
7 70
76-22 Novophalt
Surface 8
76
82-22 Styrelf Surface
7 76
Lift 4 (Top) 24 3A 25 2A 13 4B Lift 3 18 4A 35 1A 22 2B Lift 2 27 2A 25 2A 22 2B Lift 1 31 1A 15 4A 43 1A
42 1A 26 3AC
3 4BC 29 2 AB
30 2 AB 50 1A 13 3 AC
7 4BC
'The letters are the statistical ranking, with "A" denoting the mixture(s) with the greatest percentage of rut depth. The numbers are the ranking based on the averages alone, with "1" denoting the mixture with the greatest percentage of rut depth.
106
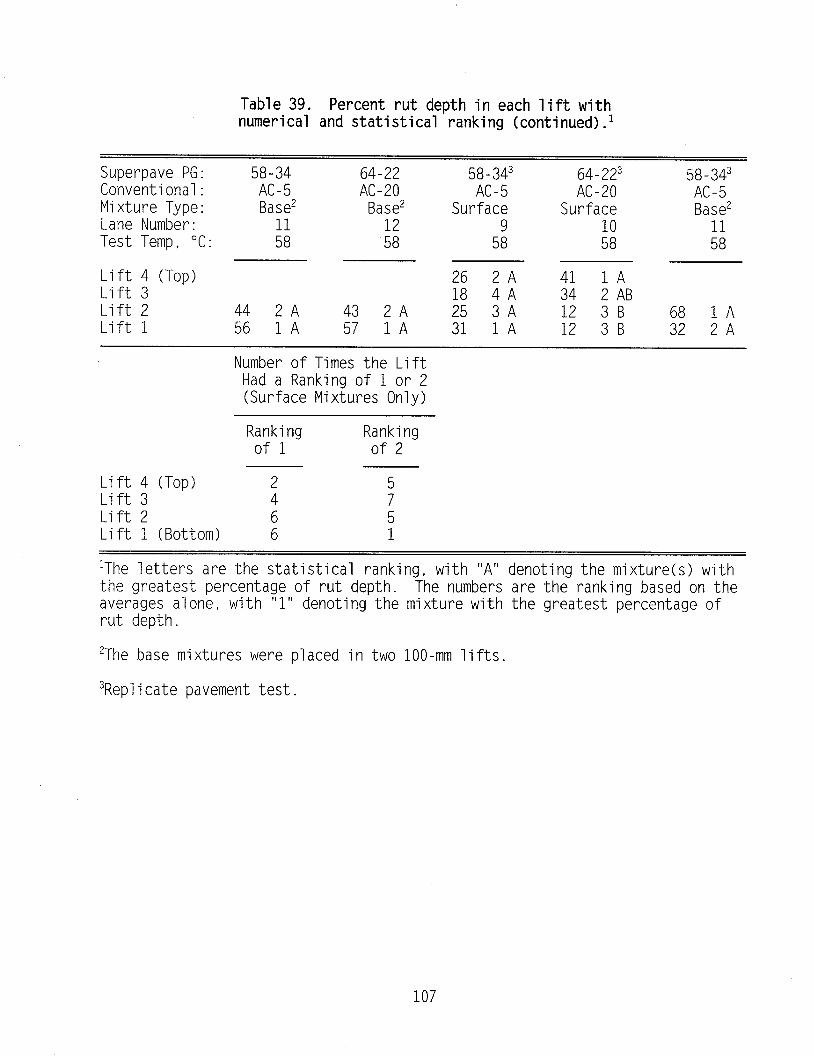
Table 39. Percent rut depth in each lift with numerical and statistical ranking (continued).1
Superpave PG: 58-34 Conventional: AC-5 Mixture Type: Base' Lane Number: Test Temp, "C: si
Lift 4 (Top) Lift 3 Lift 2 44 2A Lift 1 56 1A
64-22 58-343 AC-20 AC-5
Base' Surface 12 9 58 58
26 2A 18 4A
43 2A 25 3A 57 1A 31 1A
64-223 58-343 AC-20 AC-5
Surface Base'
ii :i
41 1A 34 2 AB 12 3B 68 1A 12 3B 32 2A
Number of Times the Lift Had a Ranking of 1 or 2 (Surface Mixtures Only)
Ranking Ranking of 1 of 2
Lift 4 (Top) Lift 3 P ; Lift 2 6 5 Lift 1 (Bottom) 6 1
'The letters are the statistical ranking, with "A" denoting the mixture(s) with the greatest percentage of rut depth. The numbers are the ranking based on the averages alone, with "1" denoting the mixture with the greatest percentage of rut depth.
'The base mixtures were placed in two loo-mm lifts.
3Replicate p avement test.
107
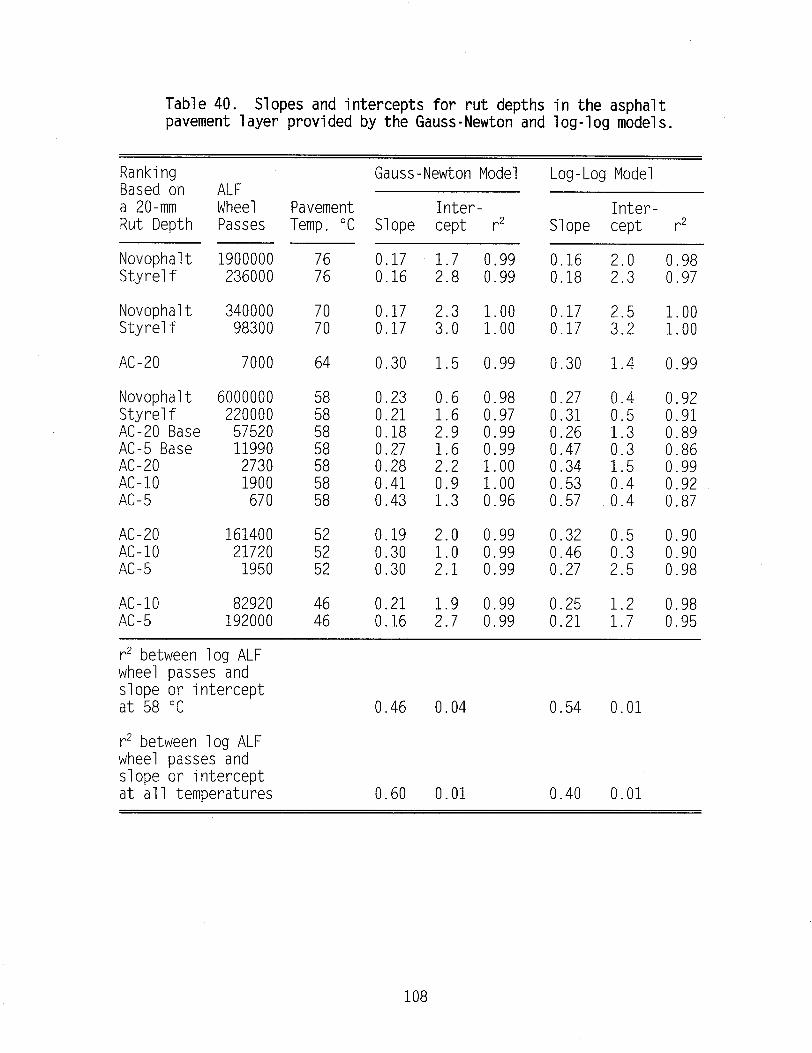
Table 40. Slopes and intercepts for rut depths in the asphalt pavement layer provided by the Gauss-Newton and log-log models.
Ranking Gauss-Newton Model Based on ALF a ZO-mm Wheel Pavement Inter- Rut Depth Passes Temp , "C Slope cept r2
Novophalt 1900000 76 0.17 1.7 0.99 0.16 Styrelf 236000 76 0.16 2.8 0.99 0.18
Novophalt 340000 70 0.17 2.3 1.00 0.17 Styrelf 98300 70 0.17 3.0 1.00 0.17
AC-20 7000 64 0.30 1.5 0.99 0.30
Novophalt 6000000 Styrelf 220000 AC-20 Base 57520 AC-5 Base 11990 AC-20 2730 AC-10 1900 AC-5 670
AC-20 161400 52 0.19 2.0 0.99 0.32 AC-10 21720 52 0.30 1.0 0.99 0.46 AC-5 1950 52 0.30 2.1 0.99 0.27
AC-10 82920 46 0.21 1.9 0.99 0.25 AC-5 192000 46 0.16 2.7 0.99 0.21
0.23 0.6 0.98 0.27 0.21 1.6 0.97 0.31 0.18 2.9 0.99 0.26 0.27 1.6 0.99 0.47 0.28 2.2 1.00 0.34 0.41 0.9 1.00 0.53 0.43 1.3 0.96 0.57
Log-Log Model
Inter- Slope cept r2
0.98 0.97
1.00 1.00
0.99
0.92 0.91 0.89 0.86 0.99 0.92 0.87
0.90 0.90 0.98
0.98 0.95
r2 between log ALF wheel passes and slope or intercept at 58 "C 0.46 0.04 0.54 0.01
r* between log ALF wheel passes and slope or intercept at all temperatures 0.60 0.01 0.40 0.01
108
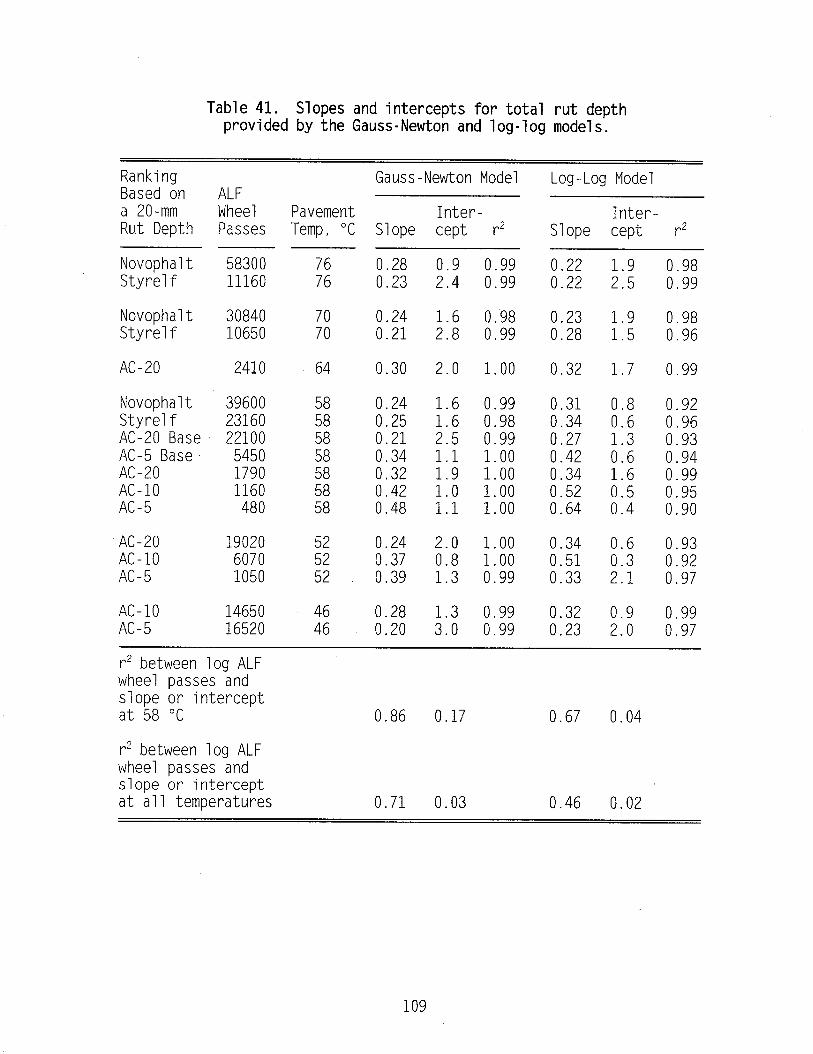
Table 41. Slopes and intercepts for total rut depth provided by the Gauss-Newton and log-log models.
Ranking Based on a 20-mm Rut Depth
Gauss-Newton Model Log-Log Model ALF Wheel Pavement Passes Temp, "C
58300 76 11160 76
Inter- Slope cept r*
Inter- Slope cept r2
Novophalt Styrelf
0.28 0.9 0.99 0.22 1.9 0.98 0.23 2.4 0.99 0.22 2.5 0.99
Novophalt 30840 ::
0.24 1.6 0.98 0.23 1.9 0.98 Styrelf 10650 0.21 2.8 0.99 0.28 1.5 0.96
AC-20 2410 64 0.30 2.0 1.00 0.32 1.7 0.99
Novophalt 39600 Styrelf 23160 ii AC-20 Base 22100 AC-5 Base 5450 2 AC-20 1790 58 AC-10 1160 AC-5 480 2;
24 1.6 0.99
;: 2.5 1.6 0.98 0.99 z; 1.1 1.9 1.00 1.00
ii 1.1 1.0 1.00 1.00
0.31 0 0.34 0 0.27 1 0.42 0 0.34 1 0.52 0 0.64 0
E 0.92 0.96 3 0.93 E 0.99 0.94
2 0.95 0.90
AC-20 19020 0.24 2.0 1.00 0.34 0.6 0.93 AC-10 6070 z: 0.37 0.8 1.00 0.51 0.3 0.92 AC-5 1050 52 0.39 1.3 0.99 0.33 2.1 0.97
AC-10 14650 ::
0.28 1.3 0.99 0.32 0.9 0.99 AC-5 16520 0.20 3.0 0.99 0.23 2.0 0.97
r2 between log ALF wheel passes and slope or intercept at 58 "C 0.86 0.17 0.67 0.04
r2 between log ALF wheel passes and slope or intercept at all temperatures 0.71 0.03 0.46 0.02
109
at a failure level of 20 mm decreased, which meant that the slope increased with an increase in rutting susceptibility. The slopes of 0.18 (see table 40) and 0.21 (see table 41) at 58 "C for the pavement with the AC-20 (PG 70) base mixture are relatively low compared with the other slopes at 58 "C, while the intercepts of 2.9 and 2.5 are relatively high. A reason for this finding was not apparent.
Table 42 provides rankings for the average slope at 58 "C, the average slope plus and minus the standard deviation (*lo,-,I, and the average slope plus and minus two times the standard deviation (+20,,-,). The latter two parameters provide 66- and 95-percent confidence levels. The slopes used in this evaluation were taken from the relationships between the rut depth in the asphalt pavement layer and ALF wheel pass. They are not based on total rut depth. The standard deviations were obtained using the data from the three ALF pavement tests that were replicated, as explained in chapter 2. Table 42 includes the average slopes and the upper and lower limits based on both lone1 and 20,~~. Pavements with overlapping confidence limits had slopes that were not significantly different: therefore, they received the same ranking. Pavements with the ranking "A" had the lowest slopes.
Although ALF rutting performance at 58 "C may be a function of the slope more than the intercept, the rankings in table 42 show that the slope alone is not sufficient for evaluating rutting performance. The intercept can significantly contribute to the rut depth. Note that in the rut depth model shown above, the intercept "a" is multiplied times Nb, thus it can have a significant effect on the rut depth.
(3) Slopes and Intercepts From the Gauss-Newton Model at Test Temperatures of 58, 70, and 76 "C
The Novophalt and Styrelf data in table 40 show that the increase in temperature from 58 to 70 "C decreased the slope and increased the intercept based on the rut depths in the asphalt pavement layer. This finding for the slope conflicts with the data at 58 "C where the mixtures that were more susceptible to rutting tended to have higher slopes. The slopes and intercepts in table 41, based on total rut depth, provided no firm conclusions.
As previously indicated, the pavements with Novophalt and Styrelf per- formed better at 76 "C than at 70 "C. This confounding effect could not be adequately considered in the analyses of the slopes and intercepts. The slopes for both binders at both 76 and 70 "C were either equal to or close to each other. The intercepts at 76 "C were lower than those at 70 "C.
The slopes at temperatures other than 58 "C were not statistically ranked because 58 "C was the only temperature at which all seven pavements were tested. Applying standard deviations to the data at temperatures other than 58 "C, based on the data from only three replicate tests at 58 "C, did not seem justifiable.
111
(4) Slopes and Intercepts From the Gauss-Newton Model at Test Temperatures of 46, 52, and 58 "C
The data show that an increase in temperature from 46 "C to 52 "C to 58 "C increased the slope based on both the rut depth in the asphalt pavement layer and total rut depth. The intercept increased or decreased with an increase in temperature, but in the majority of cases, the intercept decreased. The increase in slope with increasing temperature matches expectations, unlike the decreases in slope provided by the two modified binders when the temperature was increased from 58 "C to 70 "C.
(5) Log-Log Rut Depth Model
The log-log model provided the same conclusions as the Gauss-Newton model, and table 43 provided the same result as table 42; i.e., the slope alone is insufficient for evaluating performance.
The r2 for each individual relationship between rut depth and ALF wheel passes are included in tables 40 and 41. The Gauss-Newton model provided higher r2's for most pavement tests, although the r*'s from both models were high.
(6) Interdependence of Slope and Intercept
The slopes from all mixtures at all temperatures were linearly regressed against the intercepts to determine if they were related. For the slopes and intercepts provided by the Gauss-Newton method, the r* was 0.37 for the data based on the rut depths in the asphalt pavement layer, and 0.50 for the data based on total rut depth. For the slopes and intercepts from the log-log transformations, the r* was 0.55 for data based on either the rut depths in the asphalt pavement layer or total rut depth. All three r2 indicate that the four relationships were poor.
Although none of the four regressions between the slope and intercept provided a high correlation, all four relationships were inversed. As the slope increased, the intercept decreased. This type of inverse relationship would only be expected if densification occurs early in the lives of a set of pavements and the pavements with higher susceptibilities to rutting densify the least during trafficking. This is possible because asphalt paving mix- tures that are susceptible to rutting often compact to lower air-void levels during construction. this premise.
However, the ALF pavement air-void data did not support The air-void data in table 29 for tests at 58 "C show that
densification was not necessarily lower for the pavements that were most susceptible to rutting. Furthermore, none of the four sets of intercepts correlated with the decreases in air voids. The r*'s were zero. It was con- cluded that a decrease in the intercept does not mean that densification or densification and initial rutting due to viscous flow are lower, as might intuitively be expected.
112

Table 42. Pavement rankings at 58 "C based on the average slope from the Gauss-Newton model and on +lo,,.,, and *20(,.,, confidence bands for the s1ope.l
Ranking Based on a 20-mm Rut Depth
Novophalt Styrelf AC-20 Base AC-5 Base AC-20 AC-10 AC-5
Based on the Average Slope
Based on the Avg Slope &J+~,
Based on the Avg Slope *~cI~~-~,
All Surface Mixtures Mixtures
All Surface Mixtures Mixtures
C B
F A
D E C
i D E
All Surface Mixtures Mixtures
B
i i
C C D F D C
Mixture Average Slope - %n-11 Novophalt 0.227 0.212 0.242 0.197 0.257 Styrelf 0.208 0.195 0.221 0.182 0.234 AC-20 Base 0.176 0.166 0.186 0.157 0.195 AC-5 Base 0.274 0.254 0.294 0.233 0.315 AC-20 0.282 0.261 0.303 0.239 0.325 AC-10 0.406 0.367 0.445 0.327 0.485 AC-5 0.429 0.386 0.472 0.343 0.515
'The letter "A" denotes the mixture(s) with the lowest slope.
113

Table 43. Pavement rankings at 58 "C based on the average slope from the log-log model and on +l~~~-~, and +20~~.~, confidence bands for the slope?
Ranking Based on a 20-mm Rut Depth
Novophalt Styrelf AC-20 Base AC-5 Base AC-20 AC-10 AC-5
Based on the Average Slope
Based on the. Avg Slope filo(,,-,,
Based on the Avg Slope f2o(,-,,
All Surface Mixtures Mixtures
f A B
A E D C
i D E
All Surface Mixtures Mixtures
A A AB AB A C
FD c" D C
All Surface Mixtures Mixtures
:: A" A
: A B B B B
Mixture Average Slope +%l-l) -2%-l, +&l-1,
Novophalt 0.270 0.247 0.293 0.223 0.317 Styrelf 0.310 0.285 0.335 0.260 0.360 AC-20 Base 0.260 0.237 0.283 0.214 0.306 AC-5 Base 0.470 0.441 0.499 0.412 0.528 AC-20 0.340 0.314 0.366 0.289 0.391 AC-10 0.530 0.499 0.561 0.469 0.591 AC-5 0.570 0.539 0.601 0.507 0.633
'The letter "A" denotes the mixture(s) with the lowest slope.
114

Another reason why an inverse relationship may be obtained is that when the slope is high, there tends to be less curvature in the relationship between rut depth and wheel passes near the start of the test. This can decrease the intercept and provide an inverse relationship. A mixture that fails very rapidly could provide an equation with an intercept close to zero. It was concluded that the slope and intercept are not fundamental material properties: they are only regression coefficients.'17'
5. Conclusions
a. Validation of G*/sin6
The following conclusions are based on comparisons between G*/sin6 and the ALF pavement rutting performances of five mixtures consisting of a single gradation and five binders: AC-5, AC-lo, AC-20, Novophalt, and Styrelf 1-D. These binders had high-temperature continuous grades of 59, 65, 70, 77, and 88 after RTFO, respectively, based on a G*/sin6 of 2.20 kPa. Each mixture was tested by the ALF at three pavement temperatures.
l The overall relationship between G*/sins after RTFO aging and ALF pavement rutting performance was poor, although the trend was correct for the unmodified binders. The G*/sins of the Styrelf binder after RTFO aging was higher than the G*/sin6 of the Novophalt binder after RTFO aging at each pavement test temperature, but the pavement with Novophalt was always more resistant to rutting. This was the major discrepancy between G*/sins after RTFO aging and ALF pavement rutting performance that was found.
. When the data from the Novophalt and Styrelf pavement tests were excluded from the analysis, a minimum allowable G*/sin6 of 4.40 kPa eliminated the poorest performing mixtures. Even so, pavement life still varied significantly when the G*/sin&s of the binders were above 4.40 kPa.
l There were discrepancies between ALF pavement rutting performance and pavement test temperature for the pavements with the AC-20, Novophalt, and Styrelf binders. It was hypothesized that the binders hardened over the 3.5-year period needed to perform the pavement tests. However, the G*/sina's of the binders recovered from the pavements after failure did not explain the discrepancies, and the use of these G*/sin6's did not improve the relationship with ALF pavement rutting performance. Some of the mixtures failed rapidly even though the G*/sins's of the recovered binders were above the Superpave minimum criterion of 2.20 kPa.
b. Other Conclusions Provided by the ALF
l The reductions in air voids due to trafficking (densification) in the top and bottom halves of the 200-mm-thick asphalt pavement layer were not significantly different at a 95percent confidence level for any
115
pavement test. Based on the average densification in the top and bottom halves, it was found that the average densification in the bottom half could be greater than, equal to, or less than the average densification in the top half.
l The decreases in air voids due to trafficking indicated that when the rut depth'in the asphalt pavement layer was 20 mm, the range in percent densification was approximately 20 to 55 percent, which is 4 to 11 mm.
l Based on the rutting data from all pavements, rutting occurred in all asphalt pavement lifts. ently rutted the most.
No particular lift or group of lifts consist- The rut depths used in this analysis consisted
of both the rut depth due to densification and viscous flow.
. By splitting the total rut depth into the percent rut depth in the asphalt pavement layer and the percent rut depth in the underlying layers, it was found that the percentage of rutting in the asphalt pavement layer decreased with increasing total rut depth. The per- centage of rutting in the underlying layer increased as the asphalt pavement layer became thinner due to lateral shearing and flow.
l Pavement surface cracks due to both pavement bending and the sides of the super single tire tearing the pavement were observed during a few pavement tests when the total rut depth was greater than 20 mm. All cracks initiated at the surface of the pavement. Neither type of crack would be expected to occur on pavements where the wheels can wander.
. The ALF wheel passes at a 20-mm rut depth were generally used to rep- resent long-term pavement performance in this study. However, the pavement rut depths at 2,730 wheel passes, and the rates of rutting at 2,000 wheel passes, were also used to represent performance. The rate of rutting is the change in rut depth with a change in wheel passes.(17) When using the latter two methods, the pavements were compared at wheel passes that were low relative to the lives of longest lasting pavements. When using these types of analyses, temperature may have no apparent effect on the performances of the longest lasting pavements.
c. Evaluation of the Slopes and Intercepts From the Rut Depth vs. ALF Wheel Pass Relationships
The slope and intercept obtained from a regression analysis are often used to describe the relationship between pavement rut depth and wheel passes, or ESAL's. In this study, the Gauss-Newton statistical method, not performed in log-log space, and a log-log transformation were used to calculate slopes and intercepts for the various ALF pavement tests. Slopes and intercepts were determined for both the rut depth in the asphalt pavement layer and total rut depth. The sets of slopes and intercepts were each regressed against the number of ALF wheel passes that provided a 20-mm rut depth to determine whether the wheel passes were primarily a function of the slope or the intercept. The analyses provided the following conclusions:
116
l The slopes provided r*'s ranging from 0.40 to 0.86. The intercepts provided r2's close to zero. more than the intercepts.
The slopes correlated to ALF wheel passes
l The Gauss-Newton and log-log methods can provide a different slope and intercept for the data from a given pavement, but the sets of slopes and intercepts provided by these two methods for the ALF pavement tests led to the same conclusions, described in the next two bullet points.
l Even though the slopes correlated to ALF wheel passes more than the intercepts, the data showed that the slope alone cannot be used as a rutting performance indicator. Long-term rutting performance must be based on accumulated rut depth. The rate of rutting can also be used because it accounts for both the slope and the intercept.(17) However, the rates of rutting for a set of pavements must be determined at a constant number of wheel passes and prior to the point where the rut depths from most of the pavements become linear with wheel passes.
l The slope and intercept are not fundamental material properties; they are regression coefficients. An increase in test temperature provided both increases and decreases in the slope depending upon the mixture and temperature range. If the slope increased with increasing temper- ature, the intercept tended to decrease, and vice versa. However, the trend was not consistent. For the pavement tests at 58 "C, the slope increased as the ALF wheel passes at a failure level of 20 mm decreased, which meant that the slope increased with an increase in rutting susceptibility. The intercepts provided no trend at 58 "C.
6. Final Discussion and Recommendations
. Reasons for the discrepancies between the G*lsir@'s of the modified binders and ALF pavement performance need to be determined.
l The relationship between G*/sins after RTFO aging and ALF pavement rutting performance for the unmodified binders suggested that the Superpave G*/sing criterion of 2.20 kPa is low. The data indicated that a criterion around 4.40 kPa may be needed. However, the 1997 Superpave binder specification recommended an increase of one high- temperature PG for the ALF traffic level, which was above 10 million ESAL's based on a 20-year design life.(3) An increase of one high- temperature PG is equivalent to doubling the criterion from 2.20 to 4.40 kPa. Thus, the data supported the current criterion of 2.20 kPa if the PG can be adjusted based on both traffic loading (speed) and ESAL's. A potential flaw in this analysis is that it is unknown how the number of ALF wheel passes applied to a pavement at a constant, high temperature relates to Superpave ESAL's. Furthermore, if the five asphalt binders were to be used in other mixtures, different pavement performances would be obtained for the same PG.
117