chapter 3 vertical handover decision schemes for...
TRANSCRIPT
CHAPTER 3
VERTICAL HANDOVER DECISION S CHEMES FOR NETWORK
SELECTION USING MADM
3.1 OVERVIEW
Methods and material required for this research work are described in this
chapter. VHD schemes for network selection using MADM algorithms are used in a
distributed manner. Based on the survey, VHD is discussed in chapter 2, the
handover decision schemes are mainly focused, assuming the calculation of the
handover decision criteria is performed on the MT and the candidate network. This
calculation requires a non- negligible amount of resource that can affect the MT
performance in terms to reduce handover processing delay. To evaluate the VHD
schemes some evaluation parameter are calculated to reduce the processing delay.
The decision schemes performance with the handover matrix of MTs running
application, MT offered QoS parameters to calculate the neighbour networks
availability and the available network calculate the required QoS for MT using
MADM algorithms and send to the MT and then MT choose the network by the MT
to handover.
The section of this chapter are organised as the vertical handover
management in NGWNs are conjunction with IEEE 802.21 framework explained in
section 3.2, VHD process and the decision algorithm MADM for network selection
are discussed in section 3.3, section 3.4 discussed about the QoS parameter, which is
used for selecting the network for MT VoIP application. Section 3.5 explains the
VHD schemes. Section 3.6 explains the performance evaluation parameters for
reducing handover processing delay in HWNs environment and finally in section 3.7
summary of this chapter is discussed.
3.2 VERTICAL HANDOVER MANAGEMENT IN NEXT GENERATION
WIRELESS NETWORKS
In NGWNs, IEEE 802.11 a/b/g WiF i, IEEE 802.11 p Wireless Access in
Vehicular Environment (WAVE), IEEE 802.16 WiMax, UMTS, High Speed
Downlink\Uplink Packet Access (HS DPA/HS UPA), Long Term Evolution (LTE)
and so on are the critical challenges to achieve ABC in vertical handover. As
discussed in [34, 126, 127], the key requirement in HWNs is seamless vertical
handover, where different networks are integrated. In this research work, IEEE
802.21 Media Independent Handover (MIH) networks are used to accelerate vertical
handover. Handover management issues include mobility scenarios, matrix, decision
algorithms and procedures. Mobility scenarios can be classified into horizontal and
vertical handover. In this work, vertical handover is used as a mobility scenario.
The vertical handover is used in the heterogeneous network can be initiated for
convenience rather than the connectivity reasons. According to user choice, vertical
handover is used for choosing a service from available service. The main challenges
in vertical handover management are seamlessness and automation aspects in
network switching.
3.2.1 IEEE 802.21 Media Independent Handove r
Framework fo r vertical handover signalling is called IEEE 802.21 MIH. The
purpose of IEEE 802.21 is to improve user experience by providing an MIH
functionality that facilitates both mobile - initiated and network initiated handovers.
The specification consists of the following elements as in [126]
i. MIH functions (MIHF)
ii. Service Access Points (SAPs)
iii. MIH users.
MIH Functions
IEEE 802.21 MIH function defines three services to facilitate vertical
handover in heterogeneous networks.
i. Media Independent Event Service (MIES).
ii. Media Independent Command Service (MICS).
iii. Media Independent Information Service (MIIS).
MIES provide events reporting, events filtering and events classification services
depending on the link dynamics. MICS supports methods to send commands from
higher layer to lower layer. F inally, MIIS defines a mechanism for an MIH entity to
discover available neighbouring network information within a geographical area.
The current 802.21 MIIS specifies, a MT gets the neighbourhood information server
(IS). The static and dynamic information are providing in IS.
Static Information
In static information, the name of service providers, Medium Access Control
(MAC) addresses and channel information of the MT‟s current network
neighbourhood are present.
Dynamic Information
It includes link layer parameters such as data rate, throughput and other
higher layer service information to make an intelligent handover decision.
Therefore, IEEE 802.21 MIH is an evaluation to support vertical handover by
providing capabilities to detect and initiate handover from one network to another
network. Also, MIH provides service to assist handover between the HWNs which
is used in this research work.
SAP: It defines both media independent and media-specific interfaces. Here,
MIH_S AP, MIH_LINK_SAP, MIH_N ET_S AP are included.
i. MIH_S AP
The MIH_S AP provides a uniform interface for higher layer to
control and monitor different links regardless of access technology.
ii. MIH_LINK_SAP
The media-specific S AP provides an interface for the MIHF to contro l
and monitor media-specific links.
iii. MIH_NET_S AP
The media-dependent S AP provides transport services over the data
plane on the local node, supporting the exchange of MIH information and
message with the remote MIHF.
MIH Users
The MIH is the functional entities employed for MIH services. MIH users
are abstraction of the functional entities that employ MIH services. A typical user of
Comma nd
Li nk Comma nds
Li nk Events
Even ts
MIH service could use those services to optimize handover, where MIH users can
subscribe the MIES to be notified when events necessary to the handover decision
and process occur.
IEEE 802.21 defines, MIH framework that can significantly improve
handover between heterogeneous network technologies. The standard defines the
tools required to exchange information, events and commands to facilitate handover
initiation and handover decision phases. Therefore, the MIH framework is equally
applicable to systems that employ Mobile IP at the IP layer as the systems that
employ Session Initiation Protocol (SIP) at the application layer. It does not attempt
to standardize the actual handover execution.
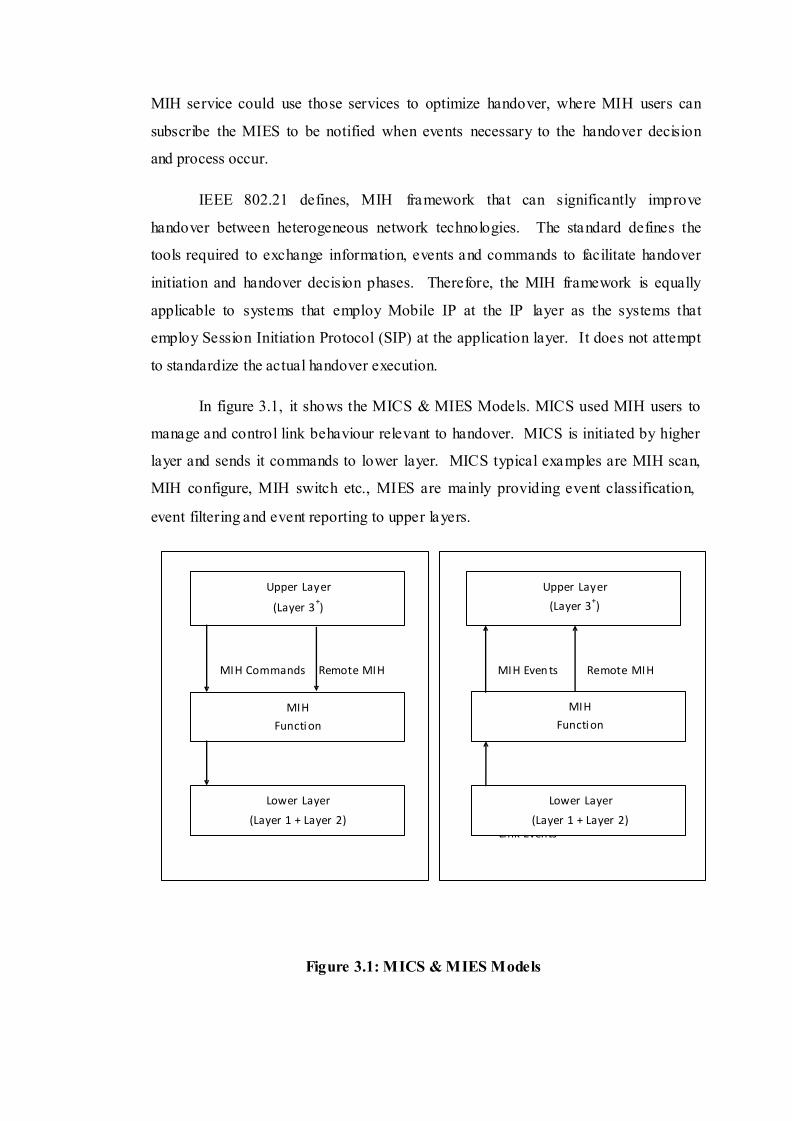
In figure 3.1, it shows the MICS & MIES Models. MICS used MIH users to
manage and control link behaviour relevant to handover. MICS is initiated by higher
layer and sends it commands to lower layer. MICS typical examples are MIH scan,
MIH configure, MIH switch etc., MIES are mainly providing event classification,
event filtering and event reporting to upper layers.
Upper La y er
(La yer 3+)
Upper La y er
(La yer 3+)
MIH Comma nds Remote MIH MIH Even ts Remote MIH
MIH
Functi on
MIH
Functi on
Lower La yer
(La yer 1 + La yer 2)
Lower La yer
(La yer 1 + La yer 2)
Figure 3.1: MICS & MIES Models
MIES have some defined events, M IH link up, MIH link down, Link up and
Link down. Lower layer generates link up and Link down events. These events are
notified to the MIHF and then MIHF reports this situation to the upper layer by
triggering MIH link up and MIH link down events. MIH provides information about
neighbouring network for MIH users. This information, such as neighbour map, link
layer information and availability of services, can be used to select the target
network, when vertical handover is needed. IEEE 802.21 MIH has de fined as
Information Server (IS) to maintain the visitor network information and offer it to
the MT.
The figure 3.2 explains the procedure of vertical handover in IEEE 802.21
[128]. The following steps illustrate the vertical handover procedure
Step 1: When a handover is triggered, an MT sends a neighbour list query message,
which requests the neighbouring network list from the IS. Then the IS sends a
neighbour list response message containing the available networks information such
as QoS requirement, network type, PoA address and so on.
Step 2: After receiving the response message, the MT scans for nearby PoA to
measure up-to-date channel states.
Step 3: Once the MT completes the scanning procedure, it sends target list query
messages containing the measured channel state values to the IS. Then, the IS to be
evaluated each suitable networks, as the handover target network by means of
vertical handover decision function. After completing the evaluation, the IS sends a
target list response message to the MT.
Step 4: F inally, the MT executes a handover to the target network with the highest
priority in the target list.
As illustrated in figure 3.2, the MT should perform multiple scanning
procedures to measure the channel state from neighbour networks where N is the
networks. The delay significant is shown. Especially, when the number of available
network is large, significantly handover delay increased can be observed.
In this research work, the MT managed by the same operator and has
different wireless technologies are used as heterogeneous networks. As discussed

above, delay is increased significantly. To reduce the processing delay, MADM
algorithms are used in distributed manner. This section presents a scenario, where
IEEE 802.21 can improve the user experience by facilitating seamless handover
across HWNs access technologies.
MT N1 PoA N2 PoA2 IS
Ha ndover Tri gger
Nei ghbour Li s t Query
Scanning
Nei ghbour Li s t Res pons e ( N1 PoA, N2 PoA )
Scanning
Network S el ecti on
Vertical Handover to N2 PoA
Figure 3.2: Vertical Handover procedures in IEEE 802.21
Figure 3.3 represents a handover scenario between two-access network
administered and managed by the same operator. The networks worked as groups,
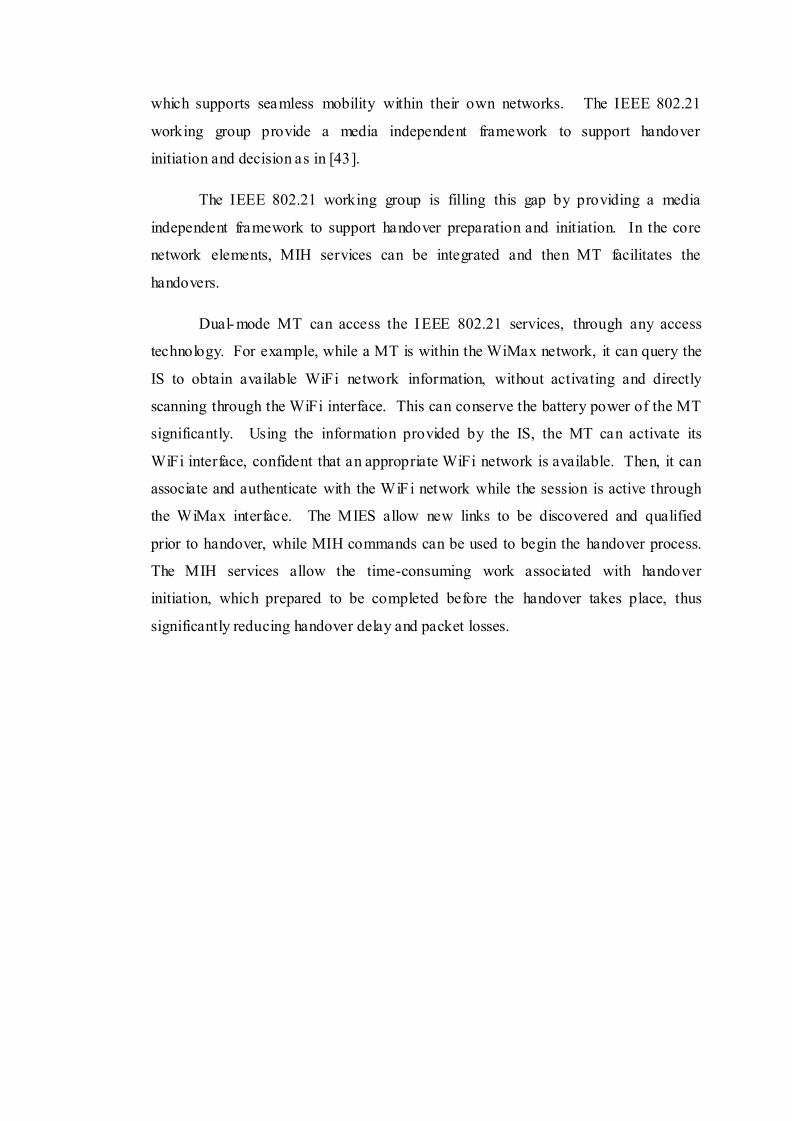
which supports seamless mobility within their own networks. The IEEE 802.21
working group provide a media independent framework to support handover
initiation and decision as in [43].
The IEEE 802.21 working group is filling this gap by providing a media
independent framework to support handover preparation and initiation. In the core
network elements, MIH services can be integrated and then MT facilitates the
handovers.
Dual- mode MT can access the I EEE 802.21 services, through any access
technology. For example, while a MT is within the WiMax network, it can query the
IS to obtain available WiF i network information, without activating and directly
scanning through the WiF i interface. This can conserve the battery power of the MT
significantly. Using the information provided by the IS, the MT can activate its
WiF i interface, confident that an appropriate WiF i network is available. Then, it can
associate and authenticate with the WiF i network while the session is active through
the WiMax interface. The MIES allow new links to be discovered and qualified
prior to handover, while MIH commands can be used to begin the handover process.
The MIH services allow the time-consuming work associated with handover
initiation, which prepared to be completed before the handover takes place, thus
significantly reducing handover delay and packet losses.
MIHF (IS) Server)
Mobility
Management
Entity
HSS/AAA
Network 1 Network 2
Figure 3.3: Handover between two networks
Both network working groups are creating media-specific extensions in
respective task groups to enable interaction with the IEEE 802.21 framework. After
these extensions are completed, the MIH framework can enable seamless handover
scenarios.
3.3 NETWORK S ELECTION IN HETEROGENEOUS WIRELESS
NETWORK
Service delivery in a HWN environment requires the selection of an optimal
access network. The selection of an access network in a HWN environment depends
on several parameters with different relative importance. The HWN gives the option
to mobile users to benefit the advantages of diverse network characterization.
The following crucial factors should be considered for a sufficient vertical handover
decision is as follows

i. User Mobility: User Mobility includes, dynamic factors like speed and
location information
ii. Network Condition: Network Condition includes, a factor like the number
of active users and available bandwidth in the network.
iii. Service Type: Different service types may affect the handover decision as
the requirements of each service differ in terms of data rate, latency, etc,.
iv. User Preference: A user may prefer one of the networks to another in
terms of cost and QoS.
v. Pricing Issues: Pricing issues includes financial costs, which affects the
use r‟s choice in the handover decision.
Selection of a non-optimal network can result in undesirable effects such as
higher costs or poor service experience network selection in such environment are
influenced by several factors and currently a complete solution is not available to
solve this problem. This research work describes a comprehensive decision making
process to rank candidate networks for service delivered by the MT. In [129], the
system architecture for MT based approach uses network assistance for network
selection. This research describes an extensive decision- making process for network
selection that can be used in the network to provide candidate network for service
delivery to the MT.
The proposed mechanism is based on the decision process that uses MADM
algorithms jointly on the network side to assist the terminal to select the top
candidate networks. The research work describes the use of the compensatory
MADM algorithms. It identifies various factors, which influence the selection of an
optimal network and then inputs to the multi decision making based decision process
should be used. It explores different aspects of the problem and proposes a solution
on the MADM algorithms. This process is completed before compensatory MADM
algorithms, which can be used to rank the networks.
3.3.1 Decision Process in Network Selection
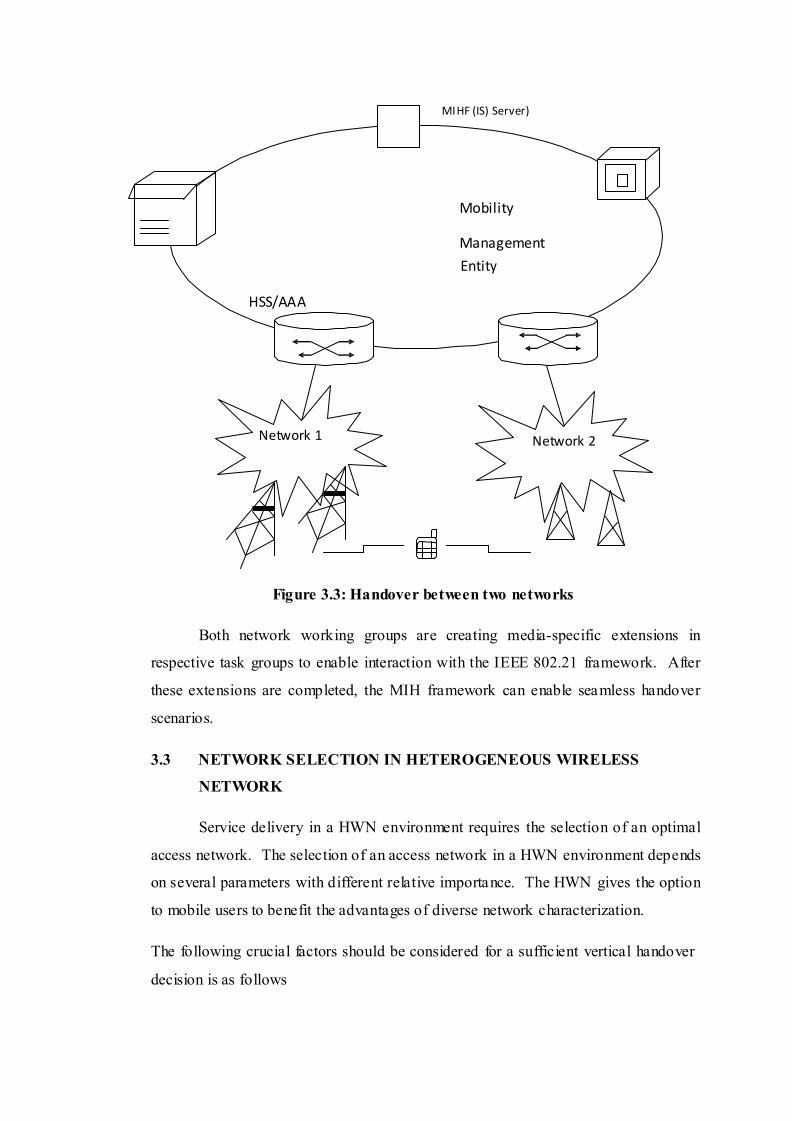
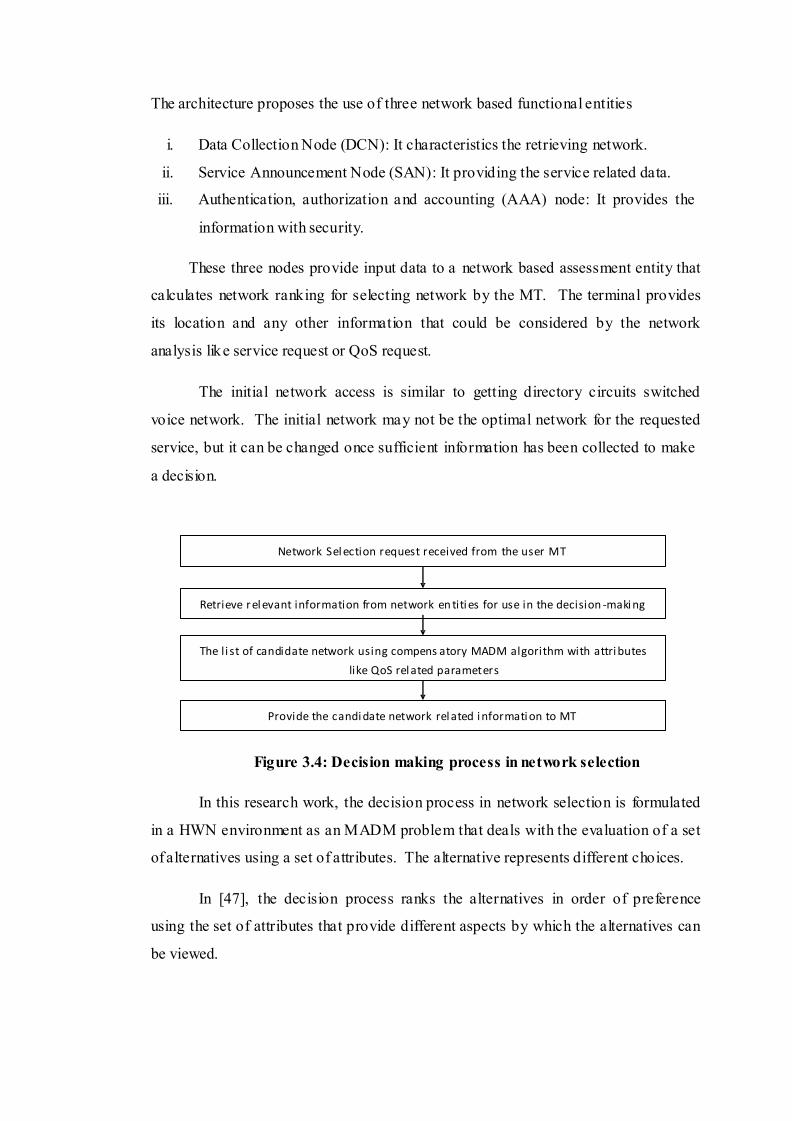
Figure 3.4 shows the decision making process in network selection. In the
network assisted mechanism, which is proposed in [129], the network assisted the
terminal in the selection process by performing data collection and analysis to
provide the ranking of the network.
The architecture proposes the use of three network based functional entities
i. Data Collection Node (DCN): It characteristics the retrieving network.
ii. Service Announcement Node (SAN): It provid ing the service related data.
iii. Authentication, authorization and accounting (AAA) node: It provides the
information with security.
These three nodes provide input data to a network based assessment entity that
calculates network ranking for selecting network by the MT. The terminal provides
its location and any other information that could be considered by the network
analysis like service request or QoS request.
The initial network access is similar to getting directory circuits switched
voice network. The initial network may not be the optimal network for the requested
service, but it can be changed once sufficient information has been collected to make
a decision.
Network S el ecti on reques t recei ved from the us er M T
Retri eve r el eva nt i nforma ti on from network en ti ti es for us e i n the deci si on -ma ki ng
The l i s t of ca ndi da te network us i ng compens a tory MADM a l gori thm wi th a ttri butes
li ke QoS rel a ted pa ra met ers
Provi de the ca ndi da te network rel a ted i nforma ti on to MT
Figure 3.4: Decision making process in network selection
In this research work, the decision process in network selection is formulated
in a HWN environment as an MADM problem that deals with the evaluation of a set
of alternatives using a set of attributes. The alternative represents different choices.
In [47], the decision process ranks the alternatives in order of preference
using the set of attributes that provide different aspects by which the alternatives can
be viewed.

Table 3.1 Category 1 attributes for network selection
The factors attribute impacting network selection can be divided into the
following categories
i. Category 1: The attributes include parameters that are not QoS-related.
These parameters do not change way often, but it can usually be
provisioned in the network.
ii. Category 2: It includes mostly QoS related attributes, both dynamic ones as
well as largely statics ones that can be provisioned.
Tables 3.1 lists the attributes that are taken into consideration for network
selection using the algorithm proposed in this work and classifies them into two
categories.
Table 3.1 Category 1 & 2 attributes in network selection
Category1 Attributes Brief Exp lan ation
Opera tor Na me
Auth enti ca ti on
Mecha nis m
Acces s technol ogy
Servi ces a vaila bl e
Geogra phi c l oca ti on
Thi s a ttri bute i ndi ca tes the i denti ty of th e opera tor for whi ch
the res t of the i nforma ti on is bei ng provi ded
Thi s a ttri bute i ndi ca tes the a uthen ti ca ti on
mecha ni s m us ed by the roa mi ng pa rtner. Exa mpl e: SI M or Us er
ID / Pass word
Thi s a ttri bute i ndica tes the wi rel ess a ccess technol ogy the
a ccess network
Thi s a ttri bute provi des a lis t of s upported s ervice [VoIP]
Thi s a ttri bute i nforma ti on on the g eogra phi c l oca ti on li ke ba s e
s ta ti on.
Covera ge a rea Thi s a ttri bute provi des a mea s ure of the covera ge a rea .
Category 2
Cos t per byte
Ba ndwi dth
Al l owed Ba ndwi dth
Uti li za ti on
Pa cket Ji tter
Pa cket Los s
Thi s a ttri bute i ndica tes rel a ti ve tra ns port cos t of the opera tor
for a particul a r a ccess
Thi s a ttri bute i ndi ca tes how much ba ndwi dth is a vail a bl e overall
on the wi rel ess access li nk
Thi s a ttri bute i ndica tes the ba ndwi dth a ll owed by th e AN on a
per us er bas is
Thi s a ttri bute gi ves the a vera ge pa cket del a y wi thi n the a ccess
s ys tem. Thi s i s not the End-to-End d el a y
Thi s a ttri bute mea s ure the a vera ge del a y va ria ti ons wi th the
a ccess s ys tem. A l a rge ji tter coul d res ul t i n pa cket reorderi ng or
droppi ng of real -ti me pa ckets a t recei ver.
Thi s a ttri bute mea s ures the a vera ge pa cket l oss ra te wi th the
3.3.2 Multi-Attribute Decision Making
In MADM problems, the alternative has performed for attributes as in table
3.1, which represents the characteristics of the alternatives [130], it is common to
transform performance ratings into a compatible measurement unit, and a
normalization procedure is used.
An MADM problem usually involves a set of m alternatives (i = 1,
2,
…, m), which are to be evaluated based on a set of n attributes (j = 1, 2, …, n). It
is assets to determine
i.
The weighting vector
ii. The decision matrix
The W represents the relative importance of n attributes
.
MADM algorithms involved into two processes for obtaining the overall
preference value for each alternative.
i. Normalization procedure
ii. Aggregation method
Normalization is first applied to transform performance rating to a
compatible unit scale, then aggregation algorithms is used to combine normaliz ed
decision matrix and attributes, weights W to achieve an overall preference value for
each alternative and is based on the overall ranking of the network alternatives. As
discussed in [130], the four well-known normalization procedures used in MADM
are briefly described below
i. Vector normalization
ii. Linear scale transformation (max- min)
iii. Linear scale transformation (max)
iv. Linear scale transformation (sum)
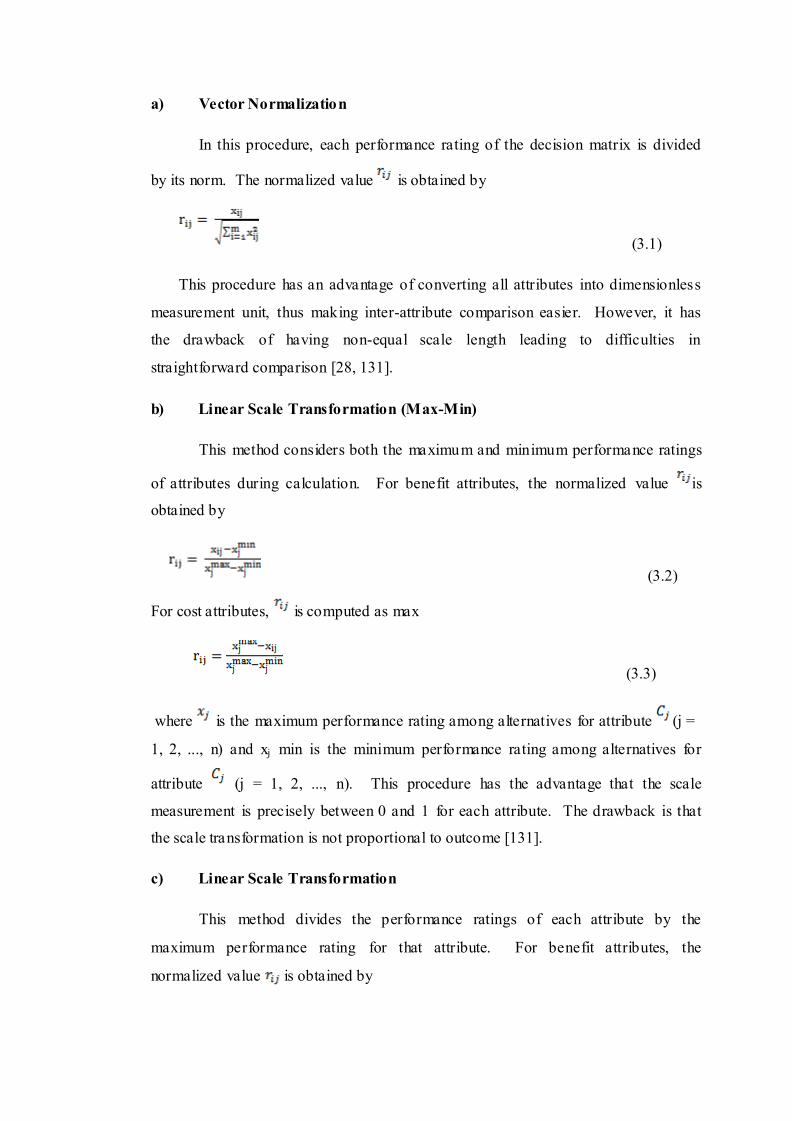
a) Vector Normalization
In this procedure, each performance rating of the decision matrix is divided
by its norm. The normalized value is obtained by
(3.1)
This procedure has an advantage of converting all attributes into dimensionless
measurement unit, thus making inter-attribute comparison easier. However, it has
the drawback of having non-equal scale length leading to difficulties in
straightforward comparison [28, 131].
b) Linear Scale Transformation (Max-Min)
This method considers both the maximum and minimum performance ratings
of attributes during calculation. For benefit attributes, the normalized value is
obtained by
(3.2)
For cost attributes, is computed as max
(3.3)
where is the maximum performance rating among alternatives for attribute (j =
1, 2, ..., n) and xj min is the minimum performance rating among alternatives for
attribute (j = 1, 2, ..., n). This procedure has the advantage that the scale
measurement is precisely between 0 and 1 for each attribute. The drawback is that
the scale transformation is not proportional to outcome [131].
c) Linear Scale Transformation
This method divides the performance ratings of each attribute by the
maximum performance rating for that attribute. For benefit attributes, the
normalized value is obtained by
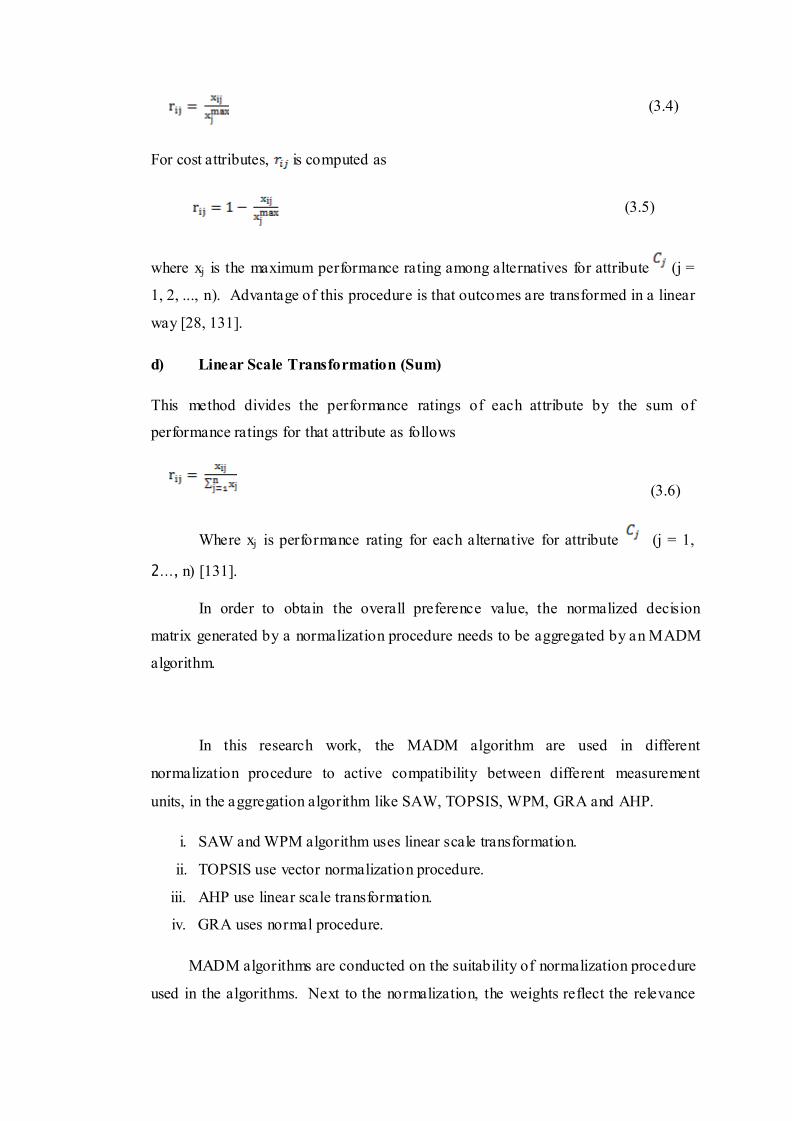
For cost attributes, is computed as
(3.4) (3.5)
where xj is the maximum performance rating among alternatives for attribute (j =
1, 2, ..., n). Advantage of this procedure is that outcomes are transformed in a linear
way [28, 131].
d) Linear Scale Transformation (Sum)
This method divides the performance ratings of each attribute by the sum of
performance ratings for that attribute as follows
(3.6)
Where xj is performance rating for each alternative for attribute (j = 1,
2…, n) [131].
In order to obtain the overall preference value, the normalized decision
matrix generated by a normalization procedure needs to be aggregated by an MADM
algorithm.
In this research work, the MADM algorithm are used in different
normalization procedure to active compatibility between different measurement
units, in the aggregation algorithm like SAW, TOPSIS, WPM, GRA and AHP.
i. SAW and WPM algorithm uses linear scale transformation.
ii. TOPSIS use vector normalization procedure.
iii. AHP use linear scale transformation.
iv. GRA uses normal procedure.
MADM algorithms are conducted on the suitability of normalization procedure
used in the algorithms. Next to the normalization, the weights reflect the relevance
in the sense of being a measure of the gain associated with replacing the worst
outcome by best outcome for this criterion [132].
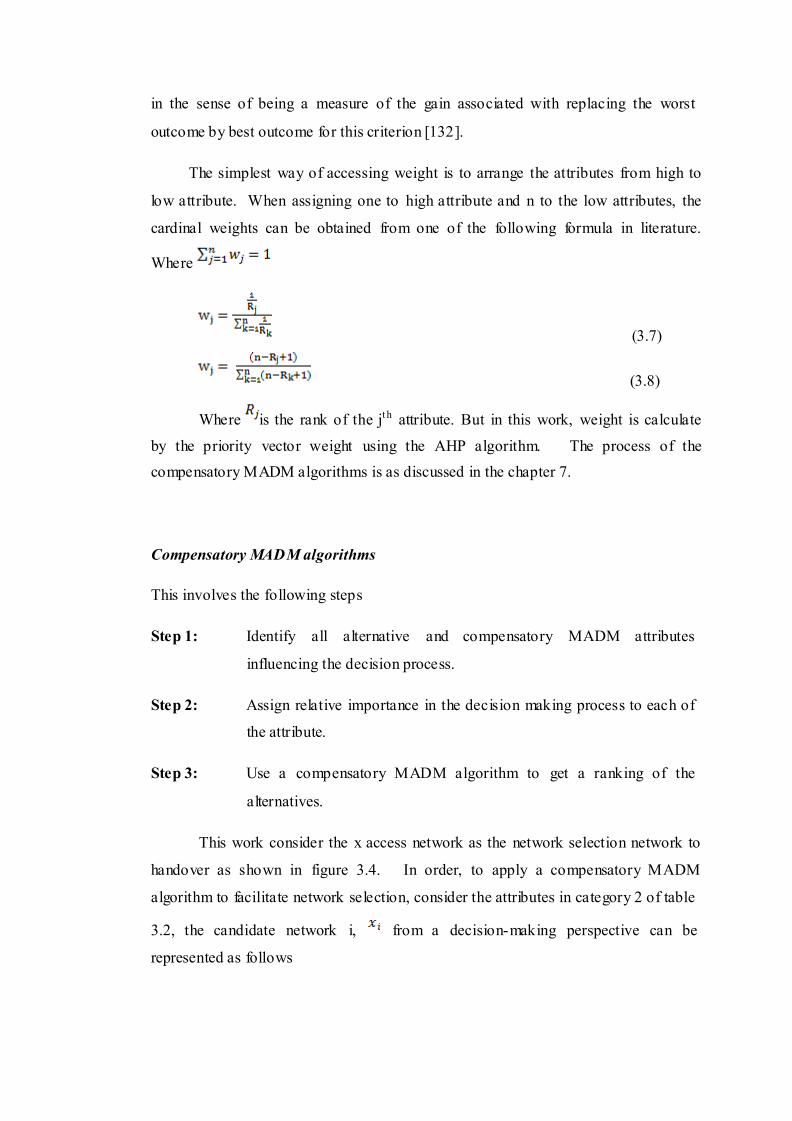
The simplest way of accessing weight is to arrange the attributes from high to
low attribute. When assigning one to high attribute and n to the low attributes, the
cardinal weights can be obtained from one of the following formula in literature.
Where
(3.7)
(3.8)
Where is the rank of the jt h attribute. But in this work, weight is calculate
by the priority vector weight using the AHP algorithm. The process of the
compensatory MADM algorithms is as discussed in the chapter 7.
Compensatory MAD M algorithms
This involves the following steps
Step 1: Identify all alternative and compensatory MADM attributes
influencing the decision process.
Step 2: Assign relative importance in the decision making process to each of
the attribute.
Step 3: Use a compensatory MADM algorithm to get a ranking of the
alternatives.
This work consider the x access network as the network selection network to
handover as shown in figure 3.4. In order, to apply a compensatory MADM
algorithm to facilitate network selection, consider the attributes in category 2 of table
3.2, the candidate network i, from a decision- making perspective can be
represented as follows

(3.9)
Equation 3.10, represent the n networks to be cons idered in the selection
process in the form of matrix as follows,
(3.10)
3.4 QOS PARAMETERS FOR NETWORK S ELECTION
QoS refers to the capability of a network to provide better service to select
network over the VoIP application and tec hnology like WiF i and WiMax, WLAN,
etc. QoS is the quality of a call over a network. It gives the priority types of traffic
on IP network. In VoIP, QoS prioritized the voice traffic at a higher level than the
other forms of traffic like data, thus the voice traffic will not be delayed or dropped.
As discussed in [23] the advancement in technology, voice communication over the
PSTN is characterized by high quality, offer referred to as toll quality. In VoIP, QoS
constraints must be met in order to provide the same level of quality. There is the
main performance indicator that characterizes the quality of voice communications
over the internet. They are delay, jitter, packet loss, also bandwidth and cost. This
bandwidth and cost are also taken in to t he account for choosing the best network.
Delay or Latency
The first delay can be defined as the total time it takes a person
communicating another person, mouth to ear delay. The VoIP application is
sensitive to delay although they can tolerate the packet loss to some extent.
There are five components that contribute to the mouth to ear delay [23]
i. Encoding Delay: The time interval needed to encode the voice signal,
which depends on the voice codec employed.
ii. Packet Delay: The interval that is required to packetsize the encoded voice
stream.
iii. Network Delay: It is the sum of transmission, propagation and queuing
delay.
iv. Playback Delay: The delay induced by the playback buffer that resides
at the receiver‟s side, which is needed to smooth delay jitter betwee n
consecutive packets.
v. Decoding Delay: The time interval needed to reconstruct the voice
signal.
Delay has two acute effects on voice performance. F irst, it increases the
subjective effects of any echo impairment. Second, when echo is controlled one-way
delay affects the character of the conversation. This research use packet delay for
the decision.
Jitter
Jitter is a variation in packet transmits delay caused by queuing, contention
and serialization effects on the path through the network. The usual causes include
connection timeout, connection time lags, data traffic congestion and interference
that is jitter an undesirable output of system flows and interruptions in [149].
(3.11)
Where,
IP network does not guarantee for packet delivery time, which introduced the
variation in transmission delay, it has more negative effects on voice quality [113].
Thus, the jitter is the result of network congestion and improper queuing. When a
packet is transfer at the sending side, vo ice packets are transmitted at a constant rate,
while, at the other end the packets be received at an uneven rate. S till the voice
packets of the same flow are not received at the same time. So jitter buffer is
introduced.
In VoIP implementation, the mechanism that is used to compensate for delay
jitter and smooth out the distribution of packet delay is the play-out buffer, also
referred to as jitter buffer. Jitter buffer is a shared data area, where voice packets can
be collected, stored and sent to the voice processor in evenly spaced intervals. It is
located at the receiving end of the voice connection, intentionally delays the arriving
packets so that the end user experiences a clear connection with little distortion of
sound. There are two types o f jitter buffer, static and dynamic jitter buffer. S tatic
jitter buffer is hardware based. Dynamic jitter buffer is software based and can be
configured by the network administrator, to adapt configured by the network ‟s delay.
So, in this work jitter is taken as a decision parameter, which is used to reduce the
handover processing delay from the result of improper queuing.
Packet loss
Packet loss will deteriorate voice quality because voice packets are highly
time sensitive. Lost packet recovery can be done by interpolating voice from the last
received packet to fill the place with the cost packet. It has consider that delivery
ratio of more than 99% is required for VoIP [131, 132, 111]. Packet losses can occur
due to many reasons. An IP packet may be lost due to congestion in the IP network.
An IP packet may also be discarded at the destination. For example, when a packet
arrives too late it will be played out. In addition to these reasons, the wireless
systems intense variations in the received s ignal power brought about by intense
fading conditions result in the loss of a significant number of packets too. Therefore,
packet loss is the total loss occurs to network congestion and late arrival [112]. In
case of packet loss, the sender is informed to retransmit the lost packets, which cause
more delay and affect the transmission of QoS.
Bandwidth
Bandwidth (B) is used an interchangeable with connection speed, although
technically they are not exactly the same. Bandwidth presents the capacity of the
connection. In wireless technology, B will have speed up to several Mbps. B, in
this research, it considered as the networks in overlay. So it is provided by the
network for both wireless networks in the range of 1 to 50 B. Here, the user is
running in a VoIP application, which needs the amount of B from 1 to 10.
Therefore, a MT may handover to target network, if the network offer at least 10 B.

Cost
Cost is used as one of the handover matrix value. Cost of service wants to be
low in the HWN. In this research work, Cost is C, which is assigned to calculate the
cost of possible target networks. The cost of each possible target network for the
service with the highest priority is calculated by as in the eq. 3.12.
(3.12)
where is the per-service cost for network n, is the normalized QoS
provided by network n for parameter p and service s. is the weight which
indicates the impact of the QoS parameter on the user or the network and is the
network elimination factor, indicating whether the minimum requirement of
parameter p for service s can be met by network n. The total cost is the sum of the
cost of each QoS parameter, including the bandwidth, jitter and delay. The service is
handed over to the network with the minimum cost.
Thus to achieve fast and seamless handover, the handover scheme are
introduced in this research work.
In this work, consider the MT is moving in an overlapping area covered by a
set of wireless networks and managed by the same network operators as in figure
3.5. Network can be divided into two categories viz (i) Home Network (HN) and (ii)
Target Visitor Network (TVN). HN represents the networks where MTs generate
their connection and TVN represents the target networks to which MT intend to
handover, the VoIP application is used as service application in MT, the user profile
is used as distributed among those TVNs. In this work, Delay (D), Jitter (J),
Bandwidth (B) and Cost (C) are the handover matrix o ffered for handover by a MT
and BS. The decision algorithm is used in the works are MADM cardinal a lgorithms
like S AW, TOPSIS, WP M, GRA and AHP. The following section discussed the
VHD schemes.
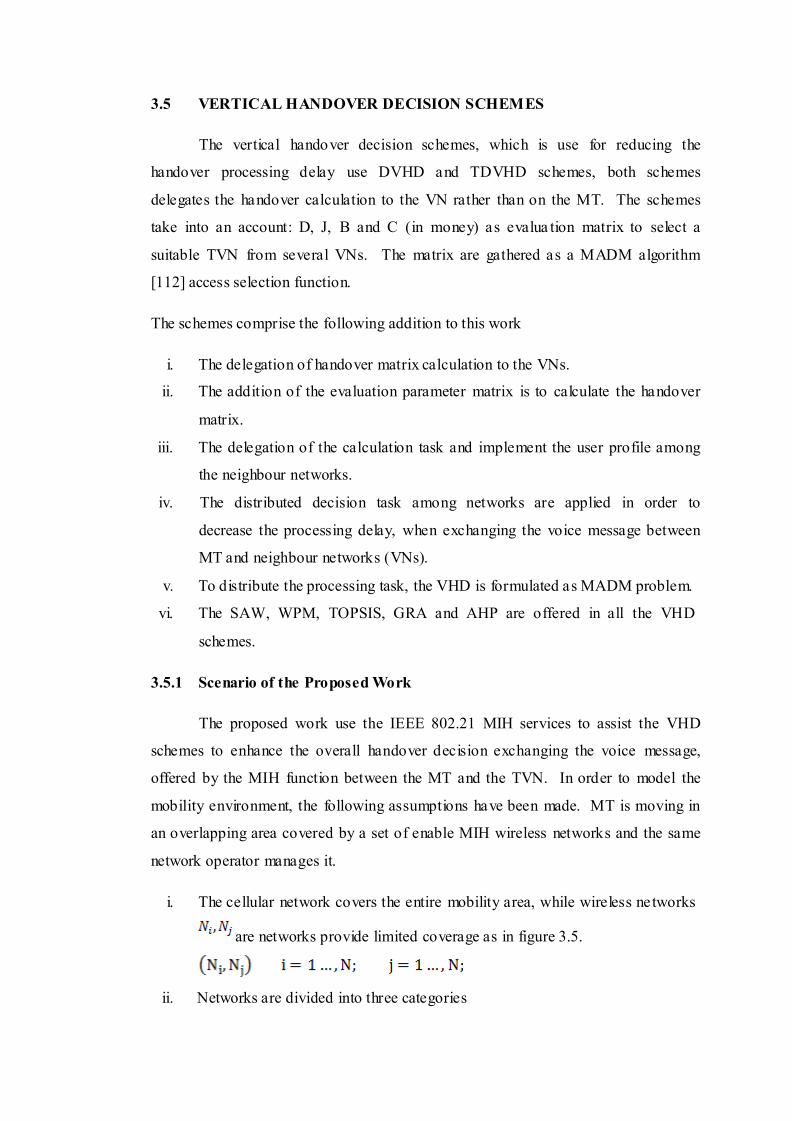
3.5 VERTICAL HANDOVER DECISION S CHEMES
The vertical hando ver decision schemes, which is use for reducing the
handover processing delay use DVHD and TDVHD schemes, both schemes
delegates the handover calculation to the VN rather than on the MT. The schemes
take into an account: D, J, B and C (in money) as evalua tion matrix to select a
suitable TVN from several VNs. The matrix are gathered as a MADM algorithm
[112] access selection function.
The schemes comprise the following addition to this work
i. The delegation of handover matrix calculation to the VNs.
ii. The addition of the evaluation parameter matrix is to calculate the handover
matrix.
iii. The delegation of the calculation task and implement the user profile among
the neighbour networks.
iv. The distributed decision task among networks are applied in order to
decrease the processing delay, when exchanging the voice message between
MT and neighbour networks (VNs).
v. To distribute the processing task, the VHD is formulated as MADM problem.
vi. The SAW, WPM, TOPSIS, GRA and AHP are offered in all the VHD
schemes.
3.5.1 Scenario of the Proposed Work
The proposed work use the IEEE 802.21 MIH services to assist the VHD
schemes to enhance the overall handover decision exchanging the voice message,
offered by the MIH function between the MT and the TVN. In order to model the
mobility environment, the following assumptions have been made. MT is moving in
an overlapping area covered by a set of enable MIH wireless networks and the same
network operator manages it.
i. The cellular network covers the entire mobility area, while wireless ne tworks
are networks provide limited coverage as in figure 3.5.
ii. Networks are divided into three categories

a. HN is the network in which the mobile node has initiates its connection.
b. VNs are the networks to which MTs intend to handover.
c. TVNs is the best network chosen by the MT using the VHD schemes.
In this work, technologies are the VNs and the user profiles are distributed
among the VNs.
iii. The HN provides relatively low data rates, where as WLAN and WMAN
supports higher data rates.
iv. MT runs with a VoIP application that requires an appropriate QoS level.
v. MT and network are MIH enabled.
The following section describes the VHD schemes in detail.
Figure 3.5: Scenario of network selection in vertical handover
3.5.2 Centralized Vertical Handove r De cision (CVHD) Sche mes
In this C VHD scheme, a MT exchanges the message between the MT and the
neighbour networks. When exchange is done with major effects has processed at
MT and it increases the processing delay. When processing delay had increased
overall handover delay will increase. To avoid this causes by the CVHD, DVHD
schemes were proposed in (48, 115).
3.5.3 Distributed Vertical Handover Decision (DVHD) Sche mes
Centralizing the VHD process at the MT has a major effect. It increase the
processing delay caused by exchanging information message between the MT and
the neighbour networks. Increasing the processing delay will increase the overall
handover delay. The goal is to decrease the processing delay by decreasing the time
to exchange the mes sage in packets between the MT and the neighbour networks.
Thus, DVHD delegates the handover calculation to the TVN rather than on the MT.
Use IEEE 802.21 MIH services to assist MTs to communicate their requirements to
all VNs and implement a table representing the user profile table 3.2 among these
TVNs.
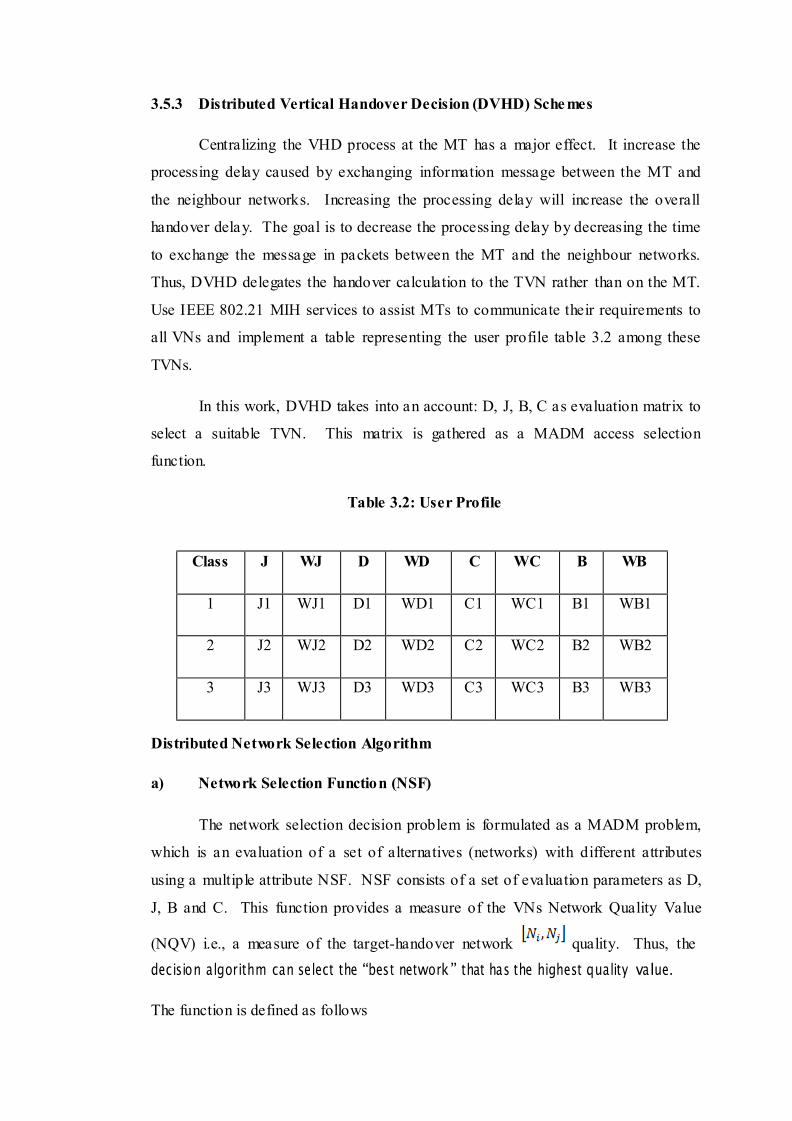
In this work, DVHD takes into an account: D, J, B, C as evaluation matrix to
select a suitable TVN. This matrix is gathered as a MADM access selection
function.
Table 3.2: User Profile
Class J WJ D WD C WC B WB
1 J1 WJ1 D1 WD1 C1 WC1 B1 WB1
2 J2 WJ2 D2 WD2 C2 WC2 B2 WB2
3 J3 WJ3 D3 WD3 C3 WC3 B3 WB3
Distributed Network Selection Algorithm
a) Network Selection Function (NSF)
The network selection decision problem is formulated as a MADM problem,
which is an evaluation of a set of alternatives (networks) with different attributes
using a multiple attribute NSF. NSF consists of a set of evaluation parameters as D,
J, B and C. This function provides a measure of the VNs Network Quality Value
(NQV) i.e., a measure of the target-handover network quality. Thus, the
decision algorithm can select the “best network” that has the highest quality value.
The function is defined as follows

(3.13)
Where D is the Delay, J is the Jitter, B is the Bandwidth and C is the cost of
the service. Evaluation parameters are the user required parameters and the
parameters offered by the network. Therefore, the function used in this work as
depicted by eq. 3.14 as the generic weighted NSF
(3.14)
Where represents the quality of the it h TVN, represents the benefit
parameters i.e., D, J, B. While represents the negative benefit parameters i.e., C.
and are the weights indicating the importance of the parameters and
.N is the number of TVNs, while and are the number of the benefit and
negative benefit parameters. Based on the user‟s service profile the HN assigns
different “weights” to the handover decision parameters in order to determine the
parameter‟s levels of importance ie., user preference. The sum of these weights must
be equal to one as shown in eq. 3.15.
(3.15)
As stated before, evaluation parameters for the decision process used to
evaluate NSF as shown in eq. 3.16.
(3.16)
b) Distributed Decision Scheme
The DVHD scheme is based on the MADM algorithm, which is applied in a
distributed manner. Thus, it places the computing processing among TVN than on
the MT. DVHD allows the MT to choose the “best” TVN towards which it will
connect.
In this research work, MADM algorithms apply the NSF on the quality
parameters of each TVN by using the matrix 3.16, which cont ain the quality
parameters of each TVN. In order to distribute the computing task, the matrix
consists offered and required (Joff, Doff, Coff, Breq) and (Jreq, Dreq, Creq, Breq) i.e., user
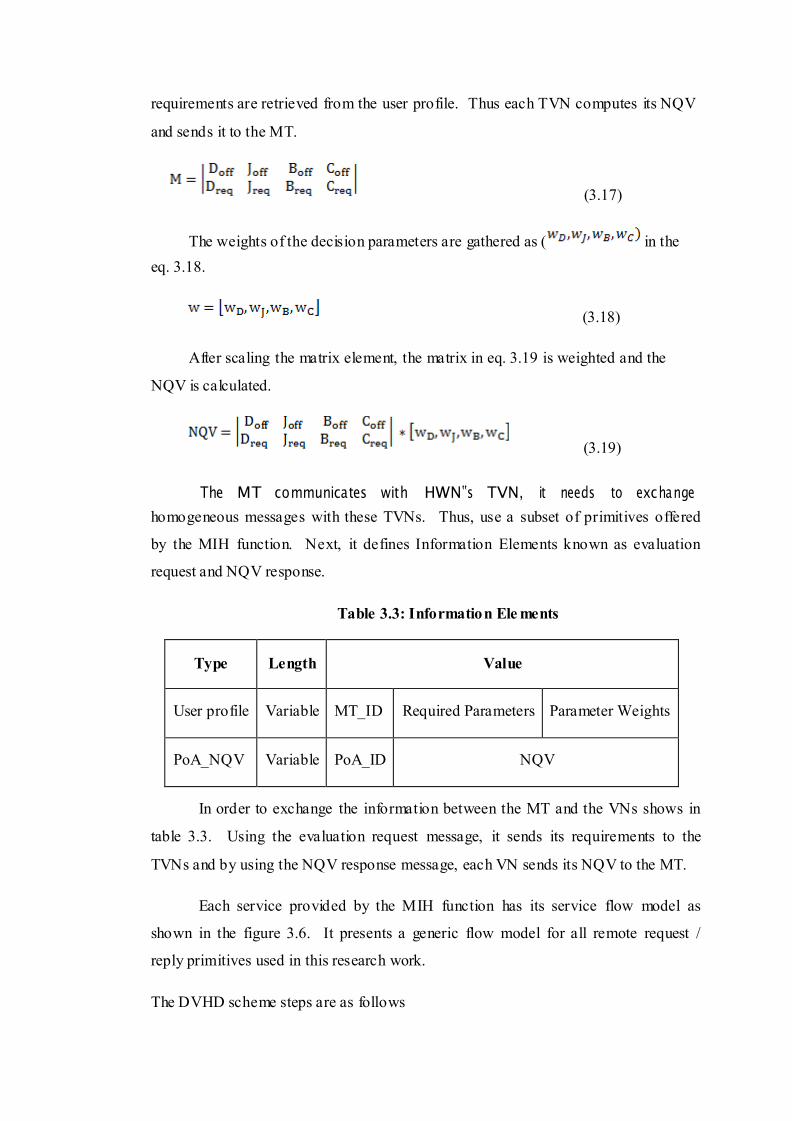
requirements are retrieved from the user profile. Thus each TVN computes its NQV
and sends it to the MT.
(3.17)
The weights of the decision parameters are gathered as ( in the
eq. 3.18.
(3.18)
After scaling the matrix element, the matrix in eq. 3.19 is weighted and the
NQV is calculated.
(3.19)
The MT communicates with HWN‟s TVN, it needs to exchange
homogeneous messages with these TVNs. Thus, use a subset of primitives offered
by the MIH function. Next, it defines Information Elements known as evaluation
request and NQV response.
Table 3.3: Information Ele ments
Type
Length
Value
User profile
Variable
MT_ID
Required Parameters
Parameter Weights
PoA_NQV
Variable
PoA_ID
NQV
In order to exchange the information between the MT and the VNs shows in
table 3.3. Using the evaluation request message, it sends its requirements to the
TVNs and by using the NQV response message, each VN sends its NQV to the MT.
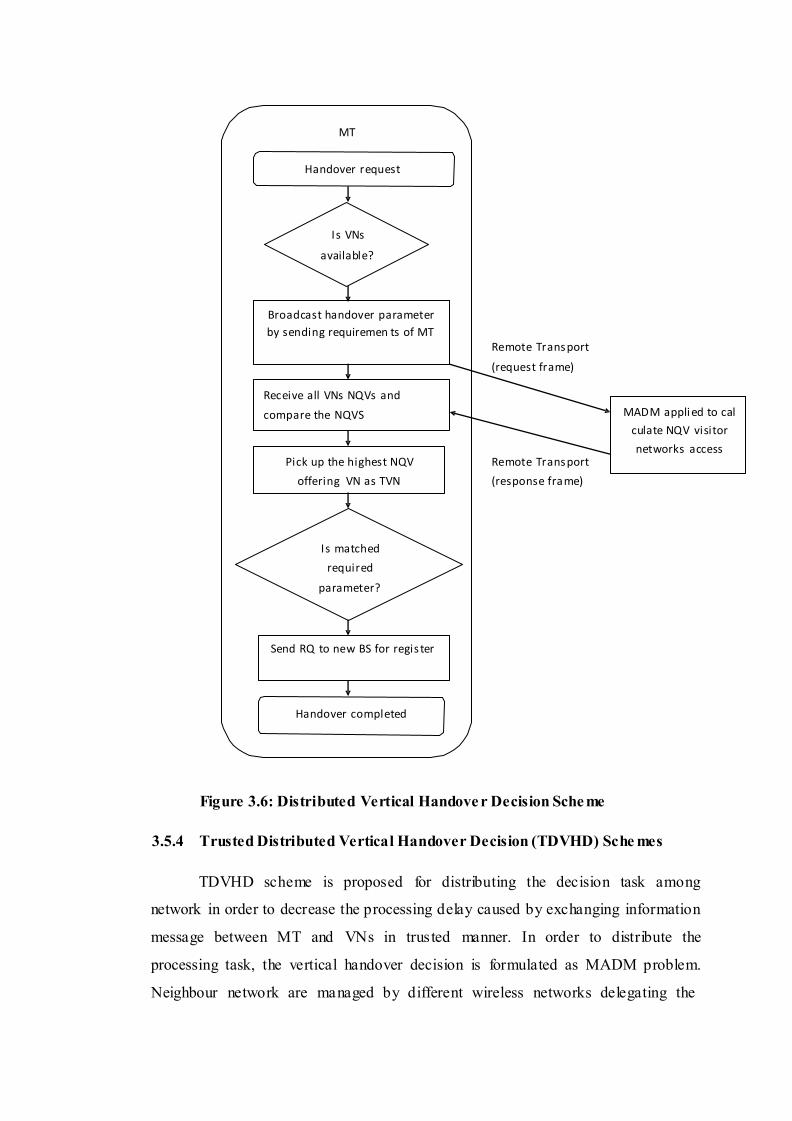
Each service provided by the MIH function has its service flow model as
shown in the figure 3.6. It presents a generic flow model for all remote request /
reply primitives used in this research work.
The DVHD scheme steps are as follows

Step 1: Once the MT identifies the handover process that is potential VNs for
handover, by the degradation of the offered quality or the availability
of TVNs offering better quality than the quality offered by the
network to which the MT is connected.
Step 2: It broadcasts a handover request message to all the available TVN this
message includes the MT required handover matrix with their
respective weights.
Step 3: The handover decision metric calculation is performed on the VNs,
each VN applied the MADM algorithm using on the required (Dreq,
Jreq, Breq, Creq,) and offered (Doff, Joff, Boff., Coff) parameters as in
eq.3.20.
(3.20)
Step 4: The MT chooses the higher quality value and then recommended the
wireless network with highest metric as a potential by the MT,
triggers the handover.
MT
Ha ndover reques t
Is VNs
a vaila bl e?
Broa dca s t ha ndover pa ra meter
by s endi ng requiremen ts of MT
Remote Tra ns port
(reques t fra me)
Recei ve a ll VNs NQVs a nd
compa re the NQVS
Pi ck up the hi ghes t NQV
offeri ng VN a s TVN
Remote Tra ns port
(res pons e fra me)
MAD M a ppli ed to cal
cula te NQV vi si tor
networks a ccess
Is ma tched
requi red
pa ra meter?
Send RQ to new BS for regi s ter
Ha ndover compl eted
Figure 3.6: Distributed Vertical Handove r Decision Sche me
3.5.4 Trusted Distributed Vertical Handover Decision (TDVHD) Sche mes
TDVHD scheme is proposed for distributing the decision task among
network in order to decrease the processing delay caused by exchanging information
message between MT and VNs in trus ted manner. In order to distribute the
processing task, the vertical handover decision is formulated as MADM problem.
Neighbour network are managed by different wireless networks delegating the
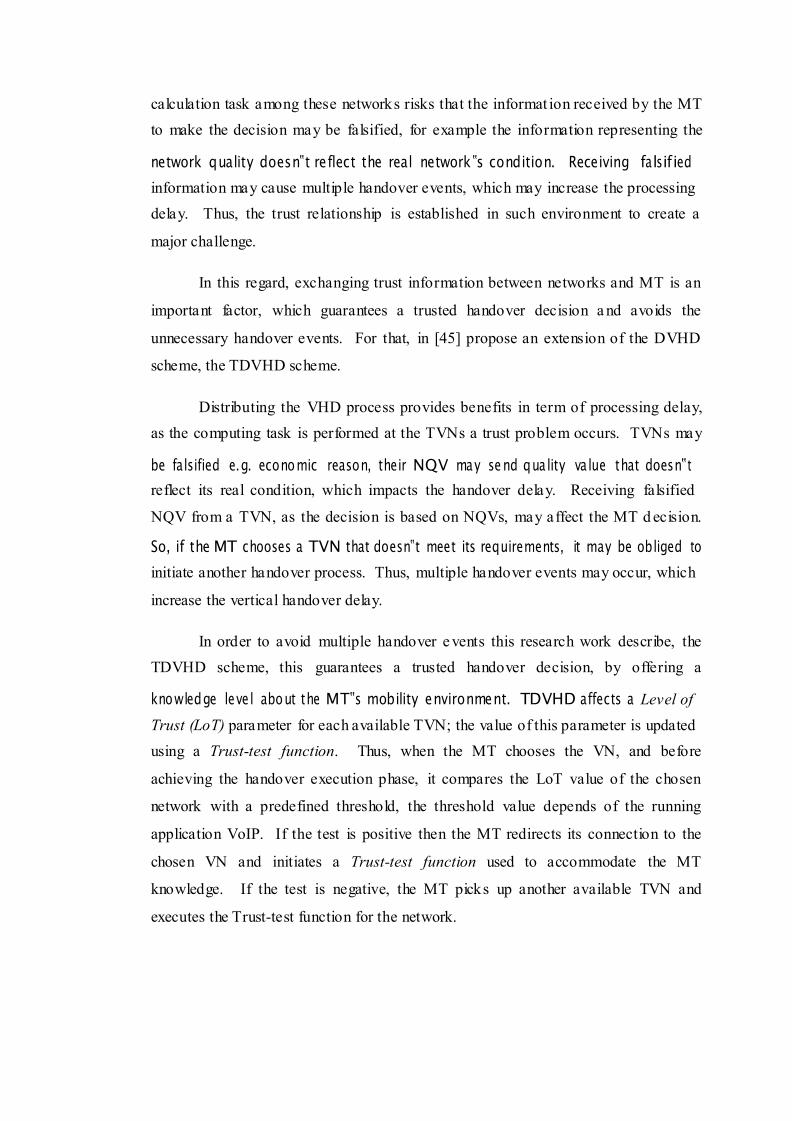
calculation task among these networks risks that the informat ion received by the MT
to make the decision may be falsified, for example the information representing the
network quality doesn‟t reflect the real network ‟s condition. Receiving falsified
information may cause multiple handover events, which may increase the processing
delay. Thus, the trust relationship is established in such environment to create a
major challenge.
In this regard, exchanging trust information between networks and MT is an
important factor, which guarantees a trusted handover decision a nd avoids the
unnecessary handover events. For that, in [45] propose an extension of the DVHD
scheme, the TDVHD scheme.
Distributing the VHD process provides benefits in term of processing delay,
as the computing task is performed at the TVNs a trust problem occurs. TVNs may
be falsified e.g. economic reason, their NQV may se nd qua lity va lue that doesn‟t
reflect its real condition, which impacts the handover delay. Receiving falsified
NQV from a TVN, as the decision is based on NQVs, may affect the MT d ecision.
So, if the MT chooses a TVN that doesn‟t meet its requirements, it may be obliged to
initiate another handover process. Thus, multiple handover events may occur, which
increase the vertical handover delay.
In order to avoid multiple handover e vents this research work describe, the
TDVHD scheme, this guarantees a trusted handover decision, by offering a
knowledge leve l about the MT‟s mobility environment. TDVHD affects a Level of
Trust (LoT) parameter for each available TVN; the value of this parameter is updated
using a Trust-test function. Thus, when the MT chooses the VN, and before
achieving the handover execution phase, it compares the LoT value of the chosen
network with a predefined threshold, the threshold value depends of the running
application VoIP. If the test is positive then the MT redirects its connection to the
chosen VN and initiates a Trust-test function used to accommodate the MT
knowledge. If the test is negative, the MT picks up another available TVN and
executes the Trust-test function for the network.

T-DVHD Scheme
As illustrated in figure 3.8 the MT sends its User-Profile reference to each
TVN, which in turn retrieves the MT requirements from the User Profile table 3.2
and applies the MADM decision algorithm to compute the NQV. Each TVN sends
its NQV to the MT, which groups them in a list. Then, it picks up the highest NQV
from the list and before connecting to the appropriate TVN it initiates the Trust
process.
LoT-test function
The LoT-test function is initiated after that the MT receives all NQVs from
the different TVNs and build its NQVs list. Its goal is to test whether the chosen
TVN is a trusted network or not. A LoT table 3.4 is placed at the MT side, in table
3.5, it contains the TVNs identities associated with LoT values, which are updated
by the Trust-test function in figure 3.8.
Table 3.4: Level of Trust Table
Network Reference
LoT
Network-1
L1
Network-2
L2
…
…
Network-n
Ln
Therefore, before the MT switches to the chosen TVN, the LoT-test function
is initiated and the algorithm in figure 3.7 is applied on the LoT of the appropriate
TVN (corresponding to the highest NQV). The LoT value corresponding to the
chosen TVN is retrieved from the LoT-table and is compared to a predefined
threshold, the threshold value depends on the running application e.g. if the
application is delay sensitive, the threshold value must be high, in order to avoid
multiple handover events.

If the LoT-value is greater or equal to the threshold, then the MT switches to
the VN and initiates the Trust-test function. If not, if another TVN is available, its
LoT value is retrieved from the LoT-table and the LoT-test is applied on this value.
Finally, if no more NQV in the list or the maximum handover delay is exceeded, the
hando ver is blocked.
Algorithm : LoT - Test fun ction
Step 1: If Lo Ti >= thres hol d
Step 2: Connect to th e TVNi
Step 3: Ini tia te Trus t-tes t functi on
Step 4: else if Lo Ti < thres hol d {
Step 5: if (s ui ta bl e-TVN a va il a bl e)
Figure 3.7: LoT-test Function
Trust-test function
The Trust-test function is initiated once the MT connects to the VN. The MT
executes this function in order to accommodate knowledge about the neighbour
TVNs. This is done by upda ting the LoT table using the algorithm illustrated in
figure 3.7.
Algorithm : Trust – Test Fun ction
Step 1: If Qoff < Qreq
Step 2: LoTi = LoTi – (de lta)-;
Step 3: els e
Step 4: LoTi = Lo Ti + (del ta )+;
Figure 3.8: Trust-test Function
As presented in figure 3.8, the test compares the Quality offered (Qoff) by the
VN with the Quality required (Qreq) by the MT. In case Qoff < Qreq for e.g. if a
remarkable quality degradation appears after connecting to the VN, the LoT value is
decreased by delta value . However, in this work, delta value is taken
as difference of network requirement value and NQV. Else Qoff >= Qreq the LoT
value of the considered VN is increased by . Where nr is the network
requirement QoS parameters and the nq represents the NQV, which is used to
calculate the running application by the MT. The delta is calculating the time
between the arriva ls of voice packets. Therefore, in TDVHD scheme network
requirement are (Jreq, Dreq, Creq, Breq), these parameters are the QoS for VoIP, which
calculates the best network by calculating these parameter sends different voice
packet from source to destination. Likewise, network quality vector calculate the
matrix of offered and required decision parameters and the weight of the required
decision parameters to calculate the delta value. By calculating this delta value for
VoIP, it can find the trusted network to handover, which reduces the handover
processing delay.
3.6 PER FORMANCE EVALUATION PARAMETERS FOR VHD
SCHEMES
VHD algorithms can be quantitatively compared under various usage
scenarios by measuring the mean and maximum handover delays, handover even ts,
end-to-end delay, P DR, packet loss incorrect decisions, and the overall throughput of
a session maintained over a typical mobility pattern. These metrics are further
explained below
3.6.1 Handover Events
In wireless networks, a call during its lifetime can be represented by a
sequence of events, where N denotes the events that a new call is admitted, Hn
denotes the event of a mobile user nt h handover, S denotes the event of the call
sojourning in the same call and E denotes the call termination events. Note that in
some cases, there are no handover events during the life time of a cell and thus no Hn
in the sequence of events like (N, H, H1, Hn ,..., Hn, S,…, E).
In this work, multiple handover events occur when the MT chooses un-
trusted TVN that provides falsified quality value (i.e. NQV). In this case, another
handover event may be performed as the switched VN doe sn‟t provide the
appropriate quality, which adds additional delay to the handover process. Handover

Events parameter reflects the number of handover achieved by the MT. Multiple
handover events may occur, which increase the vertical handover delay.
3.6.2 Decision Delay
Decision delay is a process, which takes time by the MT for making the decisio n
towards the network to handover i.e. when a MT starts the searching of the network
to handover by sending the request to the available networks and finding the a TVN
to handover the MT. The time calculation of MT handover to the particular TVN
was Decision Delay.
3.6.3 End-to-End Delay
End-to-End delay refers the time taken for a packet to be transmitted across a
network from source to destination. It represents the average data delay for an
application or a user experiences when transmitting data. The delay is usually
measured in seconds.
Average end-to-end delay = (3.21)
Where, Packet_Delay=
The delay for a packet is the time taken for it to reach the destination and the
average delay is calculated by taking the average of delays for every data packet
transmitted. The parameter comes into play only when the data transmission has
been successful.
3.6.4 PDR
Packet Delivery Ratio (PDR) defined as the number of received data packets
divided by the number of generated data packets i.e. it indicates the percentage of the
transmitted data packets that are successfully received. It is an important matrix
which can be used as an indicator to a packed network. The P DR is only considered
for data packets. The total number of transmitted packets is counted, followed by t he
total number of received packets and the total number of dropped packets. The PDR
is calculated as the packets received to the packets transmitted. The number of
packets dropped does not take into account retransmissions. As an example, if a data
packet with an ID: 4 is transmitted and has been dropped for the first time. The

packet is retransmitted, as long as we have a successful transmission or the
maximum number of retransmissions has been reached. But the drops due to
retransmission is not take n into account and are only counted when the packet is
ultimately dropped, and even in those cases its counted as a single drop.
PDR =
(3.22) However, if the packet is successfully received by the destination
after
several retransmissio ns, the drops are not considered. This would effectively make
the number of transmitted packets equal to the sum of the number of received
packets and number of dropped packets.
3.6.5 Throughput
Throughput is the average rate of successful message deliver over a
communication channel. These data may be delivered over a physical or logical link
or pass through a certain network in MT. Throughput is usually measured in bits per
second (bit/s or bps) and sometimes in data packets per second or data packets per
time slot as shown in eq. 3.23.
Throughput = (3.23) where,
time is in seconds. It is a measure of the amount of data transmitted from the source
to the destination in a unit period (in second). For example, considering the
low data rates and throughputs supported by the technology, the throughput is
measured in total bits received per second. In addition, to be noted is that this metric
only measures the total data throughput ignoring all other overhead over the
network. The throughp ut of a MT is measured by first counting the total number of
data packets successfully received at the MT and computing the number of bits
received, which is finally divided by the total simulation runtime. The throughput of
the network is finally defined as the average of the throughput of all MTs involved in
data transmission.

3.6.6 Packet Loss
Merely comparing the time consumed by the vertical handover is not enough.
During the vertical handover process an important to compare the amount of packets
that are dropped. This packet loss is described by eq. (3.24)
(3.24)
Notice that packet loss should be calculated solely for the vertical handover period.
3.7 SIMULATION MODEL
The simulation in this work was done in NS2. It is modified from REAL
network simulator and developed through VINT project at UC -Berkeley. NS2 is a
discrete-event driven and object-oriented network simulator. Types of simulation
are continuous, discrete events and combined.
In this research work, the simulation co nsiders MT, which is moving in an
area covered by the heterogeneous wireless networks managed by BS and APs. The
access point covered mobility area and it is supporting the technologies like WiMax,
WiF i etc. These AP and BS are offered different characte ristic in terms of coverage
and QoS [D, J, B, C]. VoIP is used as application in this simulation.
Table 3.5: Simulation matrix
Topography 200 * 200
Mobile Node
Base Station
Access points
Routing Protocol
Packet S ize
Simulation time
Wireless Standards
20 nodes 2 4 DODV 500 kb 500 (s) 802.16,802.11
3.8 SUMMARY
In this chapter, the method and materials for this research work are discussed.
This chapter discussed about the vertical handover decision schemes, parameters
used to select the VN as TVN for handover by the MT and evaluation parameters
used to minimize the processing delay when handover done by the MT. The
following chapters show the MADM algorithm for selecting the network, which are
applied to the VHD schemes and conclude the best VHD schemes.
CHAPTER 4
APPLICATION OF S AW AND WPM FOR NETWORK SELECTION IN
VERTICAL HANDOVER
4.1 OVERVIEW
SAW and WPM algorithm are the most popular algorithms of classical
MADM. The S AW and WPM algorithms are the additive and multiplicative
weighting approaches in MADM [28]. These algorithms allow compensations
between partial values, whereas the normalization of values facilitates balancing and
different original scales inhibit trade-offs. Determining weights and identifying
traditional values is difficult when combining the value functions in additive or
multiplicative. The advantages of both approaches are the simplicity of their scoring
algorithms. According to these additive and multiplicative approaches network
ranking are evaluated in this chapter.
The rest of this chapter is designed as follows. An overview of simple
additive weighting and weighted product method in 4.2 and 4.3, section 4.2.1 and
4.3.1 discussed how these algorithms are applied to VHD schemes for selecting the
best network to handover. Section 4.2.4 and 4.3.3 evaluated the result of this usage
of algorithm in VHD schemes using the evaluation parameters to reduce the
handover processing delay between the MT and TVN to handover.
4.2 SIMPLE ADDITIVE WEIGHTING (SAW) ALGORITHM
SAW, which is also referred as a weighted linear combination or scoring
method or weighted sum method, it is a simple and most commonly used MADM
algorithm [132], [28]. It is based on the weighted average. The basic logic of this
algorithm can obtain a weighted sum of the performance rating of each alternative
over all attributes. An evaluation score is calculated for each alternative by
multiplying the scaled value, which is given to the alternative, the attribute with the
weights of relative importance directly assigned by the decision maker followed by
the sum of products for all criteria.
The application of SAW requires the identification of objectives and
alternatives, evaluation of alternatives, determination of sub-objective weights,
additive aggregation of weighted partial preference value and sensitive analysis. It