chapter 34: oceanography and marine water quality (cook - arlis
TRANSCRIPT

PEBBLE PROJECT ENVIRONMENTAL BASELINE DOCUMENT
2004 through 2008
CHAPTER 34. OCEANOGRAPHY AND
MARINE WATER QUALITY Cook Inlet Drainages
PPRREEPPAARREEDD BBYY:: PPEENNTTEECC EENNVVIIRROONNMMEENNTTAALL//HHAARRTT CCRROOWWSSEERR,, IINNCC..
SSLLRR IINNTTEERRNNAATTIIOONNAALL CCOORRPPOORRAATTIIOONN

OCEANOGRAPHY AND MARINE WATER QUALITY—COOK INLET DRAINAGES
34-i 08/03/2011
TABLE OF CONTENTS
TABLE OF CONTENTS .......................................................................................................................... 34-i
LIST OF TABLES ................................................................................................................................... 34-ii
LIST OF FIGURES ................................................................................................................................. 34-ii
LIST OF APPENDICES ......................................................................................................................... 34-iii
ACRONYMS AND ABBREVIATIONS ............................................................................................... 34-iv
34. OCEANOGRAPHY AND MARINE WATER QUALITY .............................................................. 34-1
34.1 Physical Oceanography ........................................................................................................... 34-1
34.1.1 Introduction ................................................................................................................ 34-1
34.1.1 Study Objective .......................................................................................................... 34-1
34.1.2 Study Area .................................................................................................................. 34-1
34.1.3 Previous Studies ......................................................................................................... 34-1
34.1.4 Scope of Work ............................................................................................................ 34-2
34.1.5 Methods ...................................................................................................................... 34-2
34.1.6 Results and Discussion ............................................................................................... 34-2
34.1.6.1 Physical Description ................................................................................. 34-2 34.1.6.2 Tidal Range, Currents, and Mixing .......................................................... 34-4 34.1.6.3 Ice Conditions ........................................................................................... 34-6 34.1.6.4 Physical Oceanography Summary ............................................................ 34-7
34.2 Marine Water Quality .............................................................................................................. 34-7
34.2.1 Introduction ................................................................................................................ 34-7
34.2.2 Study Objectives ......................................................................................................... 34-7
34.2.3 Study Area .................................................................................................................. 34-7
34.2.4 Previous Studies ......................................................................................................... 34-7
34.2.5 Scope of Work ............................................................................................................ 34-8
34.2.6 Methods ...................................................................................................................... 34-8
34.2.6.1 Field Parameters ....................................................................................... 34-8 34.2.6.2 Chemical Parameters ................................................................................ 34-8 34.2.6.3 Data Reduction and Interpretation ............................................................ 34-9
34.2.7 Results and Discussion ............................................................................................. 34-11
34.2.7.1 Field Parameters ..................................................................................... 34-11 34.2.7.2 Chemical Analysis .................................................................................. 34-13 34.2.7.3 Water Quality Summary ......................................................................... 34-16
34.3 References ............................................................................................................................. 34-16
34.4 Glossary ................................................................................................................................. 34-18
PEBBLE PROJECT, ENVIRONMENTAL BASELINE DOCUMENT, 2004 THROUGH 2008
34-ii 08/03/2011
LIST OF TABLES
Table 34-1, Tidal Data for Iniskin Bay (59° 40.8′, 153° 23.8′)
Table 34-2, Analytical Constituents for Marine Water Quality Samples
Table 34-3, Summary Marine Water Quality Statistics by Month and Year, 2004-2008, at all IIE Stations Sampled
Table 34-4, Summary Water Quality Statistics for Iliamna Bay by Sampling Station, 2004-2008
Table 34-5, Summary Water Quality Statistics for Iniskin Bay by Sampling Station, 2004-2008
Table 34-6, Results of Analyses of Marine Water, 2008
Table 34-7, Analyses of Organic Compounds in Marine Bottom Water Samples, 2004
LIST OF FIGURES
Figure 34-1, Cook Inlet and Vicinity
Figure 34-2, Physical Oceanography and Marine Water Quality Study Area, Iniskin/Iliamna Bay Estuary, Cook Inlet, 2004-2008
Figure 34-3a, Drogue Track near Iniskin/Iliamna Estuary
Figure 34-3b, Observed Current Circulation Patterns near the iliamna/Iniskin Estuary
Figure 34-4, Water Quality Station Locations, Marine Waters, Cook Inlet, 2004-2008
Figure 34-5a, Maximum Extent of Ice Pack in Cook Inlet, 2001-2008
Figure 34-5b, Extent of Ice Pack in Cook Inlet, 1st Week of January 2001-2008
Figure 34-5c, Extent of Ice Pack in Cook Inlet, 1st Week of February 2001-2008
Figure 34-5d, Extent of Ice Pack in Cook Inlet, 1st Week of March 2001-2008
Figure 34-5e, Extent of Ice Pack in Cook Inlet, 1st Week of April 2001-2008
Figure 34-6, Monthly Mean Marine Water Quality Temperatures in Iliamna and Iniskin Bays Combined, 2004-2008
Figure 34-7, Mean Marine Water Temperatures in Iliamna Bay For Stations with Six or More Temperature Readings, 2004-2008
Figure 34-8, Monthly Mean Marine Water Salinity in Iliamna and Iniskin Bays Combined, 2004-2008
Figure 34-9, Mean Marine Water Salinity in Iliamna Bay for Stations with Six or More Measurements, 2004-2008
Figure 34-10a, Monthly Mean Marine Water Turbidity for Iliamna Bay, 2005-2008
Figure 34-10b, Monthly Mean Marine Water Turbidity for Iniskin Bay, 2005-2008

OCEANOGRAPHY AND MARINE WATER QUALITY—COOK INLET DRAINAGES
34-iii 08/03/2011
Figure 34-11, Mean Marine Water Turbidity in Iliamna Bay for Stations with Six or More Measurements, 2004-2008
Figure 34-12, Seasonal Variation in Inorganic Constituents in Marine Water, Iliamna and Iniskin Bays Combined, 2008
Figure 34-13, Depth Variation in Inorganic Constituents in Marine Water, Iliamna and Iniskin Bays Combined, May, July, and September 2008
Figure 34-14, Geographical Variation of Inorganic Constituents in Marine Water, Combined over Depth and Time, 2008
Figure 34-15, Tidal Variation of Inorganic Constituents in Marine Water, Iliamna and Iniskin Bays Combined, May, July and September 2008
LIST OF APPENDICES
Appendix A, Laboratory Statement on Marine Surface Water Analyses
Appendix B, Laboratory Data Summary for Trace Elements in Marine Water (2004, 2008)

PEBBLE PROJECT, ENVIRONMENTAL BASELINE DOCUMENT, 2004 THROUGH 2008
34-iv 08/03/2011
ACRONYMS AND ABBREVIATIONS
ºC degrees Celsius
EPA United States Environmental Protection Agency
IIE Iniskin/Iliamna Estuary
µg/L micrograms per liter
mph miles per hour
ng/L nanograms per liter
NIC National Ice Center
NTU nephelometric turbidity unit(s)
OCSEAP Outer Continental Shelf Environmental Assessment Program
ppt parts per thousand
PVC polyvinyl chloride
RRO residual range organics
SQuiRT Screening Quick Reference Tables
TSS total suspended solids
UAF University of Alaska, Fairbanks

OCEANOGRAPHY AND MARINE WATER QUALITY—COOK INLET DRAINAGES
34-1 08/03/2011
34. OCEANOGRAPHY AND MARINE WATER QUALITY
34.1 Physical Oceanography
34.1.1 Introduction
Iniskin Bay and Iliamna Bay are shallow estuaries on the west side of lower Cook Inlet, north of Kamishak Bay (Figure 34-1). Collectively, the area of these two bays is termed the Iniskin/Iliamna Estuary (IIE; Figure 34-2).
This section presents general findings from both a literature search and observations from the 2004 through 2008 field studies of the physical oceanography in the marine study area for the Pebble Project. The literature search and field studies consisted of investigations and observations of the shape and depth of the IIE, the tidal range and currents, the wave and ice-scour action in the vicinity, and a brief analysis of some of the inputs to, and outputs from the bays. Additional information regarding Cook Inlet is included to provide a regional context and a setting for local observations.
34.1.1 Study Objective
The study objective was to document, based on available information and on-site observations, the physical oceanography of the IIE study area. This information provides a physical context for observed biological conditions (as described in Chapters 42 through 44) in the marine study area.
34.1.2 Study Area
The study area included all marine waters and shorelines of Iniskin and Iliamna bays (Figure 34-2), except for the inner portions of Iniskin Bay and Cottonwood Bay. These portions were not included because they are outside of the project area. A general description of Cook Inlet, focusing primarily on the lower west side, is included to provide a regional context.
34.1.3 Previous Studies
Little scientific investigation of the west side of lower Cook Inlet or the IIE area had occurred prior to the the National Oceanic and Atmospheric Administration’s Outer Continental Shelf Environmental Assessment Program (OCSEAP) in the mid-1970s. Under OCSEAP, a substantial body of data was collected during the 1970s and early 1980s. Additional primary information on the inlet’s physical and biological conditions has been gathered by the Cook Inlet Regional Citizens Advisory Council and the National Park Service. Oil company-funded studies on the deeper portions of the lower inlet (e.g., Lees, 1976; Houghton et al., 1980) were also reviewed.
PEBBLE PROJECT, ENVIRONMENTAL BASELINE DOCUMENT, 2004 THROUGH 2008
34-2 08/03/2011
34.1.4 Scope of Work
Characterization of physical oceanography in the study area drew primarily on existing information about IIE and western Cook Inlet. That information was supplemented by the personal experience of the investigators and observations made during marine biological field work conducted from 2004 through 2008.
34.1.5 Methods
A thorough literature search related to the natural environment of Cook Inlet was performed. The search emphasized the lower and the west side of the Inlet because they would be indicative of the proposed project area. Additional telephone interviews were conducted with experts in regional physical oceanography. Observations of oceanographic features and events were recorded in field notebooks and documented with photographs. In August 2004, Dr. Jon Houghton of Pentec Environmental and Dr. Stephen Jewett of University of Alaska, Fairbanks (UAF) performed a reconnaissance flight up Iniskin Bay and down Iliamna Bay. From August 2004 through November 2008, a field crew led by Dr. Houghton and/or Mr. Jim Starkes sampled nearshore fish and invertebrates at irregular monthly intervals during the ice-free months. In 2004, 2005, and 2008, the crew also characterized benthic assemblages in the intertidal and subtidal zones. They observed local physical conditions with a particular emphasis on the interactions of the physical environment with observed marine species distributions.
34.1.6 Results and Discussion
34.1.6.1 Physical Description
Cook Inlet
Cook Inlet is a long (370 kilometers), broad (70 to 90 kilometers), and shallow (mean depth approximately 60 meters) embayment extending north-northeast from the Gulf of Alaska (Muench et al., 1978). It has a maximum depth of 200 meters, and it is 139 kilometers wide at its mouth. Lower Cook Inlet is defined as the area north of Kennedy and Stevenson entrances and Shelikof Strait and south of the “Forelands,” a constriction north of Kalgin Island (Figure 34-1). For purposes of this report, Kamishak Bay is defined as the portion of southwest Cook Inlet south and west of a line from Cape Douglas, around Augustine Island to Ursus Cove (Figure 34-1).
Britch (pers. comm., 2004 through 2006) classified Cook Inlet as a tide-dominated estuary that has high tidal ranges, low to moderate wave action, and moderate to high fresh water input from multiple rivers. Muench et al. (1978) described the physical behavior of Cook Inlet, especially the lower inlet, as similar to that of a large bay because of vigorous non-estuarine flow across its mouth and limited fresh water input in winter.
IIE
Iliamna and Iniskin bays are shallow inlets on the west side of lower Cook Inlet (Figures 34-1 and 34-2). Both bays were likely formed as glacial troughs that have become filled with sediment over recent geologic time (Detterman and Harstock, 1966). The outer portion of Iniskin Bay from the deepest part of the bay near the head through the Right Arm (a small arm of the bay along the east side) are part of the

OCEANOGRAPHY AND MARINE WATER QUALITY—COOK INLET DRAINAGES
34-3 08/03/2011
Bruin Bay fault system. The current landforms are influenced by this regional-scale complex (Wilson et al., 2009). Both bays generally average less than 5 meters in depth, with deeper troughs leading into the bays and extensive mudflats in the upper bays. Detailed descriptions of intertidal and subtidal habitats in the IIE are provided in Chapter 36.
Iniskin Bay. Iniskin Bay has a relatively deep trough along its western shoreline (maximum depth 24 meters). This trough quickly rises up to mudflats on its western and northern perimeters (Figure 34-2). The eastern side of the trough steps up to a broad shelf that extends to the eastern shore of the bay.
A number of small islands and reefs guard the eastern portion of the entrance to Iniskin Bay. This group includes Scott Island—the largest of the group—Vert Island, Iniskin Island, the Mushroom Islets, and Iniskin Shoal (Figure 34-2). This pattern of islands and reefs extends up the eastern shore of the bay to include the Toadstools and Fossil Reef, which rise out of the eastern shelf. The inner portion of Iniskin Bay is dominated by extensive mudflats. The Iniskin River enters the northernmost point of the bay. The river creates a small shallow channel that extends from the mouth of the river to the deeper trough along the western shore. Approximately one-third of the way up the eastern shore of Iniskin Bay from the mouth of the river, a small bay called Right Arm extends to the east. Several small creeks, including Portage Creek, flow into the Right Arm.
Iliamna Bay. Iliamna Bay is smaller and generally shallower than Iniskin Bay (Figure 34-2). The uppermost portion of Iliamna Bay splits into two smaller arms. Williamsport is at the head of the smaller, western arm. Williams Creek enters Iliamna Bay at Williamsport. Approximately half way down the western shore of Iliamna Bay from Williams Creek, another bay called Cottonwood Bay extends to the west. Diamond Point is the central point of land that separates the upper portions of Iliamna Bay from Cottonwood Bay (Figure 34-2).
The upper portions of Iliamna and Cottonwood bays are occupied by extensive mudflats. The mudflats in both bays are exposed at lower tides with the exception that a marked, dredged channel leads up Iliamna Bay into Williamsport. Cottonwood Bay has a large number of boulders scattered across its mudflats, while central Iliamna Bay is generally a mud bottom with a limited number of intertidal reefs and subtidal hard bottom areas.
Turtle Reef partially blocks the entrance to Iliamna Bay off South Head, and White Gull Island is located just south of the center of the entrance to the bay. The only deeper water in Iliamna Bay is on either side of White Gull Island, with average depths of approximately 10 meters and a maximum depth of 12 meters.
Knoll Head to North Head. Relatively deeper water (approximately twice as deep) and extensive rocky reefs characterize the body of water that separates Iniskin and Iliamna bays. The two portions of Black Reef partially shelter the entrance to the Y Valley. Much of the adjacent waters contain additional offshore rocks and shoals. A small lagoon occurs at the mouth of the Y Valley where a stream comes down from the Back Range (Figure 34-2).

PEBBLE PROJECT, ENVIRONMENTAL BASELINE DOCUMENT, 2004 THROUGH 2008
34-4 08/03/2011
34.1.6.2 Tidal Range, Currents, and Mixing
Cook Inlet
The tidal range is 3.6 meters near the entrance to Cook Inlet at Port Chatham and increases northward. It reaches approximately 4.6 meters in the IIE area, and exceeds 12.2 meters near Anchorage (Brower et al., 1988). On a lateral transect of Cook Inlet, the tidal range on the eastern side of the inlet is 0.6 to 1.2 meters greater than on the western side of the inlet (Sobey, 1979).
The Alaska Coastal Current is deflected westward after passing through the Kennedy Entrance, which causes localized upwelling. A small amount of the Alaska Coastal Current water is enriched by the upwelling. It moves up the east side of the inlet and eventually crosses west near Kalgin Island and replaces water entrained in the southward outflow along the west side of the inlet (Poole and Hufford, 1982). Currents along the west side of lower Cook Inlet are mostly of moderate velocity (100 to 150 centimeters per second) although velocities can exceed this, especially in mid-inlet, in deeper channels, and during extreme tides (Brower et al., 1988).
Tidal rips are present across the lower inlet with differing oceanographic conditions apparent on opposite sides of the rips. Typically, these rips result from shear between water flows in deeper channels and adjacent shallow areas. Oceanic waters are typically found in the deep channels whereas the water in shallower areas tends to be more estuarine (less saline and more turbid). Three defined rip zones exist in the lower inlet below the Forelands. Debris accumulates in the mid-channel and western rips (Burbank, 1977).
Tidal currents within lower Cook Inlet are classically estuarine. The currents flow counterclockwise; that is, north along the eastern shore and south along the western shore. Currents in northern Kamishak Bay near the entrance to the IIE are southeasterly with the ebb tide and northwesterly to westerly with flood tides at speeds of 50 centimeters per second or less. A drogue track produced by a satellite-tracked drifting buoy in the western portion of lower Cook Inlet shows that the general flow off the mouth of the IIE is southwesterly; small tidal loops result from daily ebb and flood flows (Figure 34-3a; Johnson, pers. comm., 2006). The current intensifies off Cape Douglas, where Muench et al. (1978) reported a strong (approximately 50 centimeters per second) southerly flow at 7 meters depth over a 10-day period. Muench et al. (1978) previously noted a northerly flow at this position. Near-surface velocities of 250 centimeters per second were noted in the general Cape Douglas area during one unusual and extreme winter event (Britch, pers. comm., 2004). Currents are sufficiently strong to thoroughly mix the water column and move coarse sediment along the bottom in some areas (Hampton, 1980). Burbank (1977) described the surface circulation in the area, including a small anticyclonic eddy off the mouths of Iniskin and Iliamna bays (Figure 34-3b). Because of technical challenges with much of the early work in this area, including problems with local magnetic anomalies, generalizations regarding currents in lower Cook Inlet must be interpreted cautiously (Britch, pers. comm., 2004 through 2006).
IIE
Tides and Currents. The IIE has an extreme tidal range of approximately 7.6 meters, with a mean tide range of about 3.75 meters (Brower et al., 1988). Basic tidal data for Iniskin Bay are presented in Table 34-1. No tidal data were available for Iliamna Bay. Researchers have not observed any indications that tidal ranges within Iliamna Bay and along the shoreline adjacent to the Y Valley are different in

OCEANOGRAPHY AND MARINE WATER QUALITY—COOK INLET DRAINAGES
34-5 08/03/2011
magnitude or timing. The magnitude and timing of the tides throughout the study area tend toward similarity, which would be expected given their proximity and somewhat similar configuration of the mouths and shapes (but not the sizes) of the bays.
No direct current measurements were taken during the marine field work. Maximum surface currents are estimated at approximately 300 centimeters per second (5.8 knots) based on observed wind-driven ice movement during the previously described April 2006 marine sampling event and data from Kamishak Bay. Average maximum ebb current in Iniskin Bay is approximately 62 centimeters per second (1.2 knots), and average maximum flood current is 46 centimeters per second (0.9 knots; Nobeltec, 2004).
Small eddies have been observed in the lee of several points of land and behind islands, shoals, and other obstructions. These eddies provide refuge for smaller fish and areas of calmer water during the height of the tidal currents. A few tidal rips have been observed within the bays during marine field sampling events that result from strong wave and tidal action. The largest tidal rip in the bays observed in these studies was located off stations MPS1 and MPS2 (Figure 34-4) during the ebb of one of the larger tidal cycles in April 2008.
Inputs, Mixing, and Waves. The small watersheds that drain into the IIE deliver a relatively minor amount of fresh water into the bays on an annual basis; therefore, nutrient inputs directly from adjacent terrestrial sources are relatively minimal. Seasonal snowmelt or heavy rainfall increase local freshwater runoff. When this runoff is at a maximum, a fresh surface layer of water develops. Even then, nutrient inputs from these events still may not be substantial in relation to other areas of Cook Inlet that are dominated by large river or glacial inputs, such as Knik River and Susitna River.
Tidal fluctuations and wind forcing are the primary drivers of mixing in both bays of the IIE. Minimal lateral mixing in the estuaries has been observed, particularly in Iniskin Bay. The majority of the flow patterns follow tidal currents up and down the length of the bays. Salinity was measured in the water column at a few widely dispersed sites in the IIE (Tables 34-4 and 34-5). These results indicate that the water in the bays is relatively well-mixed with minimal stratification. Occasional temporal and local stratification does occur, for example, during high runoff events.
Sea swell, wind waves, and tidally-generated waves affect exposed shorelines from Knoll Head to North Head and beaches within the bays that face the bay entrances. Wind data for the IIE are reported in EBD Chapter 26. Swell has been observed in both bays, depending on the regional weather patterns and wind direction. Pentec staff biologists observed that strong local wind patterns create waves that either complement or counteract the swells.
Because the orientations of the entrances to Iniskin and Iliamna bays are roughly perpendicular to one another, swell does not generally affect the interior of both bays at the same time. Depending on prevailing weather patterns, larger swells affecting the bays may originate in the Gulf of Alaska, enter Cook Inlet through the Kennedy Entrance, and travel northwest past Augustine Island. The interior of the bays also have some protection from swell for two reasons: the characteristic shallow nature of the bays and because of the extensive reefs and islands that partially block portions of the entrances.

PEBBLE PROJECT, ENVIRONMENTAL BASELINE DOCUMENT, 2004 THROUGH 2008
34-6 08/03/2011
34.1.6.3 Ice Conditions
Cook Inlet
In a typical year, Cook Inlet has varying quantities of ice cover from early November through early April. The extent of ice cover depends on many factors such as earliest inception of sub-freezing temperatures, cloud cover, wind forcing, and freezing precipitation (LaBelle et al., 1983). The maximum extent of ice cover typically occurs between late January and late February (National Ice Center [NIC], 2009). Figure 34-5a displays the maximum extent of the ice pack in Cook Inlet observed by the NIC for 2001 through 2008. Dates for the maximum ice extent ranged from January 19 through February 22. In years with minimal ice, the ice may not extend south of the Forelands (e.g., 2001; Figure 34-5a), but in years with a substantial ice pack, it can extend north from Ninilchik on the east side and cover the entire west side of the inlet, including all of Kamishak Bay (e.g. 2007 and 2008, Figure 34-5a). The overall percentage of ice cover varies considerably. Only portions of Knik Arm, Turnagain Arm, and several side bays regularly (annually) have shore-fast ice, i.e., stationary ice that does not move with currents and wind. Maximum ice extent in 2001 through 2003 was noticeably less than that in 2004 through 2008 (NIC, 2009).
Figures 34-5b through 34-5e show the extent of ice in Cook Inlet for the first week of each month from January through April, respectively, for 2001 through 2008. In each of these years, ice was established in Cook Inlet by January and, in all but 2005, remained into April. The ice edge remained roughly constant for long periods starting as early as January, with only varying percentages of ice cover after that point, until the final spring breakup. This approximately similar ice edge extends south of the Forelands and is presented on Figures 34-5b, 34-5c, and 34-5d for January, February, and March, respectively.
Ice often accumulates in Kamishak Bay during spring breakup. Ice floes have been observed at up to 320 meters across. Thicker floes that form in the intertidal areas of upper Cook Inlet are traps for suspended sediment and display dark horizontal banding (Britch, pers. comm., 2004 through 2006).
IIE
Within the confines of the bays of the IIE, and with a few exceptions, ice was typically present from January through March (Figures 34-5b through 34-5d), often lingering into April (Figure 34-5e). At the time of maximum ice extent (Figure 34-5a), the inner bay ice coverage ranged from 40 to 100 percent (NIC, 2009). Often, the local ice pack extends around North Head, becomes continuous between the two bays, occasionally connects with the larger ice pack in southwestern Cook Inlet, and becomes even with the continuous ice pack in upper Cook Inlet during more severe ice years.
First-hand accounts of mid-winter conditions from the survivors of the Farallon wreck in 1910 indicate a relatively rapid and regular freezing and melting of the bays, with slush-ice quickly forming and disappearing. True ice in 1910 appeared to be limited mostly to the upper and side bays or had a limited lifespan, with icebergs drifting through the outer bays and adjoining water adjacent to the Y Valley (Lloyd, 2000). These observations are partially supported by recent data from the NIC (2009), which show ice present and absent in the bays during successive weeks.
During the marine sampling events in mid-March 2008, Pentec staff biologists observed relatively continuous floating masses of ice in the outer portions of the bay. At times, these masses cut off access to certain portions of the bays, but they were constantly moving with tidal and wind fluctuations. During

OCEANOGRAPHY AND MARINE WATER QUALITY—COOK INLET DRAINAGES
34-7 08/03/2011
subsequent field visits in April 2009 and April 2010, biologists observed small amounts of the remaining ice passing back and forth through the bays with the tide cycle. More extensive amounts of ice were present, but not continuous, in the inner portions of both bays. Biologists believe that the local ice pack is routinely extensive enough to provide annual scouring of the intertidal zone (Chapters 36 and 42).
34.1.6.4 Physical Oceanography Summary
Iliamna and Iniskin bays are shallow embayments that are generally well mixed by tidal currents as a result of their shallow nature and the minimal fresh water input during most of the year. An exception may occur during periods of high seasonal snowmelt runoff when a fresh water surface layer temporarily develops. The bays are characterized by extensive mudflats in their upper reaches with deeper channels extending out into the outer bay entrances, adjacent to Black Reef, and into Cook Inlet. Extensive reefs, shoals, offshore rocks, and islands dot the entrances to both bays and the waters in between. The bays have an observed mean tidal range of approximately 3.75 meters with moderate currents. Seasonal ice is present from January through March in most years and tends to scour the intertidal zone (Chapter 42).
34.2 Marine Water Quality
34.2.1 Introduction
This section presents data on ambient marine water quality, including both field-measured parameters (salinity, temperature, and turbidity) and laboratory analyses of sampled marine water. These data provide a representative overview of the ambient water-quality characteristics and the levels of trace metals and organic compounds in waters of the IIE. These data were intended to provide a baseline documentation of general water quality. Data on levels of trace metals and organic compounds in sediment and tissues are provided in Section 35.4.
34.2.2 Study Objectives
The objectives of this study were to gather, analyze, and present marine water quality data and to discuss trends in those data. This analysis was done to characterize the existing baseline water quality of the IIE marine environment.
34.2.3 Study Area
The IIE study area includes all marine waters and shorelines of Iniskin and Iliamna bays, except for the inner portions of Iniskin Bay and Cottonwood Bay. These areas were not included because they are outside of the project area (Figure 34-2). An analysis of available water quality data in Cook Inlet, focusing primarily on the west side, is presented in this report to provide a regional context.
34.2.4 Previous Studies
Despite an extensive literature search, Pentec biologists were not able to locate any previous studies reporting either physical or chemical marine water quality data specifically in the IIE. However, some data exist from greater Kamishak Bay and Cook Inlet in general. Muench et al. (1978) measured oceanographic conditions in lower Cook Inlet in the spring and summer of 1973. Surface salinity was

PEBBLE PROJECT, ENVIRONMENTAL BASELINE DOCUMENT, 2004 THROUGH 2008
34-8 08/03/2011
lowest on the west side of Cook Inlet, and isohalines generally paralleled the coastline there. Salinities in lower Cook Inlet decreased from a range of 30.4 to 31.4 parts per thousand (ppt) in late May 1973 to a range of 26.0 to 30.5 ppt by early September 1973. The highest salinity on the west side of the inlet (greater than 30.2 ppt) was measured in September 1973 in southwestern Kamishak Bay. Decreasing salinity through the summer is attributed to river runoff. Between 70 to 80 percent of runoff came from the Susitna, Knik, and Matanuska rivers into the upper inlet (Hein et al., 1979).
Water temperatures tended to be highest in southwestern Kamishak Bay from spring through summer, relative to other lower inlet sites, reaching greater than 11°C in late summer (Muench et al., 1978). Seawater temperature, salinity, and density distributions varied seasonally and were strongly influenced by variations in fresh water inflow to the inlet and by wind direction and intensity (Sobey, 1979).
Earlier work on trace metals and hydrocarbons in media other than marine waters in lower Cook Inlet and in Kamishak Bay is described in Chapter 35. Saupe et al. (2005) reported mean total ammonia concentrations of 12 µg-N/liter in surface water and 24 µg-N/liter in bottom water. These values were derived from more than 50 observations in each stratum collected throughout coastal waters of southcentral Alaska in 2002.
34.2.5 Scope of Work
Marine water quality parameters included in this study are various chemical constituents and field parameters (salinity, temperature, and turbidity). Field parameters were measured in conjunction with the marine habitat assessments of the IIE from August 2004 through November 2008. Water samples were collected in August and September 2004 and May, July, and September 2008. The samples were analyzed for trace metals, inorganic, and organic constituents.
34.2.6 Methods
34.2.6.1 Field Parameters
Water temperature and salinity were measured to define field water conditions at the time of most beach seine sets and at approximately half of the trawl sampling events from August 2004 through November 2008 as well as during the majority of the gill/trammel sampling events in 2008. Analysis for turbidity was added to the sampling program in 2005 and was typically measured during the sampling events from then through 2008. These field measurements were also recorded during the three water chemistry sampling events in 2008. Water quality sampling locations are shown on Figure 34-4.
A YSI Model 85 multiparameter probe was used to measure temperature and salinity. A LaMotte portable Model 2020 turbidity meter was used to measure turbidity. Parameters were measured at approximately 0.3 meters below the surface of the water and recorded on field data sheets associated with the specific sampling event.
34.2.6.2 Chemical Parameters
Data were collected in accordance with the consolidated study program for Pebble Project (Appendix E of the EBD), the Field Sampling Plan (FSP; Appendix F of the EBD), and the Quality Assurance Project

OCEANOGRAPHY AND MARINE WATER QUALITY—COOK INLET DRAINAGES
34-9 08/03/2011
Plan (QAPP; Appendix G of the EBD). Analytes measured in the 2004 and 2008 marine water quality sampling events are presented in Table 34-2.
In 2004, samples were collected to analyze for both organic compounds and inorganic constituents. The organic compounds were successfully measured. However, analytical data for the inorganic constituents were unavailable because of laboratory problems Appendix A), Therefore, samples collected in 2008 water sampling were only analyzed for inorganic constituents.
In 2004, the University of Alaska, Fairbanks (UAF) staff members collected water samples off each of four stations (MPS1 through MPS4, Figure 34-4). Tidal stage was not recorded during the 2004 sampling events. In 2008, Pentec staff collected water samples at stations MPS1 and MPS4 and the deeper water site MOPP1, an opportunistic sampling location between Iliamna Bay and Iniskin Bay (Figure 34-4). Samples were collected during high tide at all three stations during all of the sampling events in 2008. An additional sampling event was conducted at low slack water in September at stations MPS1 and MPS4.
In 2004, water samples were collected at an estimated 2 meters above the seafloor with a decontaminated Van Dorn sampler. In 2008, marine water was collected with a 30-liter polyvinyl chloride (PVC) Niskin sampler at two depths: 2 meters below the water surface and 2 meters above the seafloor. The researchers collecting samples were careful during all sampling events to make sure that the sampling device did not disturb the sediment. Sample containers were filled directly from the water sampler.
All samples remained in the custody of the field crew until turned over to a courier in Homer, Alaska, or to Shaw personnel in Anchorage, Alaska. Chain-of-custody was documented at each exchange. Upon receiving the samples, Shaw personnel prepared the samples for transport and shipping to the analytical laboratories.
34.2.6.3 Data Reduction and Interpretation
Only primary sample data were included in data interpretation described in the following section. Results of analyses of field-split samples collected for quality assurance and quality control functions were not used for data interpretation.
Analytical results below the limit of detection were treated as follows. Where laboratory results were reported with a value of zero, these analyses were included for the data set at one-half the method detection limits. Other laboratory results that were report below the limits of detection were also included in the data base at one-half the method reporting limits. These concentration values were then used in general statistical analysis for calculation of mean values. As a result, some calculated values may comprise all detected concentrations, a mix of detected concentrations and concentrations below the limit of detection, or all concentrations below the limit of detection.
In 2004, inorganic analytical results were rejected and dropped from the data set because inappropriate analytical procedure was used (see Appendix A for detailed explanation). The following constituents had rejected data (number of values in parentheses): beryllium (1), cadmium (1), chromium (2), copper (1), selenium (1), and zinc (4). The rejected data included samples that were spread over time and location, but they were all for filtered (dissolved) samples.

PEBBLE PROJECT, ENVIRONMENTAL BASELINE DOCUMENT, 2004 THROUGH 2008
34-10 08/03/2011
Because of confusion in sample labeling, some results from July 2008 also were dropped from the data base. These omissions include aluminum, antimony, barium, boron, cadmium, iron, lead, manganese, tin, vanadium, and zinc from the filtered samples at station MPS1. Also, no selenium analyses for the July 2008 sampling were successfully performed by the laboratory.
Data from the sampling events were pooled and mean values were used to express the central tendency representative of each station. If only individual samples were available, the data were reported separately.
Concentrations of constituents were evaluated in two ways. The primary approach was to compare the results from the Pebble Project sampling program to thresholds of biological response, as reflected in water quality criteria. In a few instances constituent concentrations have been measured in previous studies from southcentral Alaska. These constituent results have been used for purposes of discussion where available as a second set of concentrations for comparison. The biological response criteria were compiled in Screening Quick Reference Tables (SQuiRT) by a branch of the National Oceanic and Atmospheric Administration from a variety of sources in ecological literature for performing preliminary evaluations of marine and other kinds of habitat (Buchman, 2008). In most cases, these values are Criterion Continuous Concentrations from the National Recommended Water Quality Criteria promulgated by the U.S. Environmental Protection Agency (U.S. EPA, 2009). In other cases, they are criteria proposed by U.S. EPA. Lastly, they may be criteria used by other governments for various purposes. For use in the present report, the most stringent SQuiRT value was selected for each constituent available. These criteria have no present regulatory application in IIE.
Statistics summarizing the marine field parameter data are presented by sampling event in Table 34-3 and by sampling station in Tables 34-4 (Iliamna Bay) and 34-5 (Iniskin Bay). Chemical analyses performed on samples of marine water are provided in Tables 34-2, and results are presented in Tables 34-6 and 34-7. Station locations are shown on Figure 34-4. Where data from the three stations are presented, the order of presentation is west to east, either top to bottom or left to right.
The secondary approach to data interpretation investigated potential trends in the chemical concentrations of constituents. Data were pooled into aggregations and the results plotted on one graph for seasonal, geographical, depth, and tidal variations. Matching data subsets were extracted from the overall database (nonfiltered water samples only). One of the data sets was used to evaluate seasonal, geographical, and depth variations. For these analyses, to keep water depths consistent, the data set was refined to include only the high-tide data. Another data set was used to examine tidal variations. For these analyses, the data set was refined to include only the data from the September collection event (high-tide and low-tide collections). Then, the data were averaged for each constituent in the particular factor of interest (each collection period for seasonal variation, each station for geographical variations, each depth interval for depth variations, and each tide for tidal variations). Lastly, a mean concentration for each constituent in the data subset was computed and concentrations of the respective constituents in each of the relevant portions of the data subset (collection periods, stations, depth intervals, or tides) were divided by this data-subset mean concentration, termed “mean-adjusted concentration.” This technique enabled all results to be plotted on one graph while preserving quantitative relationships among the data subset portions of interest.

OCEANOGRAPHY AND MARINE WATER QUALITY—COOK INLET DRAINAGES
34-11 08/03/2011
34.2.7 Results and Discussion
34.2.7.1 Field Parameters
Water Temperature
During the period from 2004 to 2008, 327 individual measurements of temperature were recorded. Monthly mean water temperatures in the IIE were observed to increase from lows in late winter/early spring (March) to late summer (July or August) and then begin to decline (Figure 34-6). Monthly mean temperatures ranged from 0.2 ºC in March 2008 to 18.0 ºC in August 2004 (Table 34-3). The lowest single event water temperature of -1.8 ºC was recorded during the March 2008 biological sampling event when floating ice was present in the bays. The study-wide maximum single event temperature was 27.4 ºC in August 2004 at Station MPSE in inner Iliamna Bay. After August 2004, the next highest monthly mean temperature occurred in July 2005 (Figure 34-6).
When stations that were measured less than six times during the 5-year study period are removed from the data set (Figure 34-7), there is an indication of higher temperatures in inner Iliamna Bay than in the outer bay. For example, high sun exposure in summer and low insolation in winter have a greater influence on the temperature of shallow inner bay waters than on deeper outer bay waters. Exceptions can likely be attributed to local physical characteristics, such as colder localized freshwater inputs reducing local temperatures. Overall, water temperatures are affected by complex variables that include freshwater input, rate of water exchange, and cardinal orientation of the bays.
The three tidal lagoon stations in Iliamna Bay (MACL, MCWL, and MCWSL) had mean spring/summer temperatures that were relatively warm, compared with the observations recorded in the rest of the bay (Table 34-4). These three stations also had three of the four highest summer maximum temperatures as would be expected, given their shallow nature and limited circulation. Stations MCWL and MCWSL were sampled primarily in late spring and in summer months when temperatures were likely to be at maxima. These trends suggest that the three lagoons are significantly influenced by solar radiation in late spring and summer due to their small sizes and shallow depths relative to the remainder of the bay. Lack of winter data precludes direct observation of temperature trends during colder conditions yet the AC Point Lagoon, at least, was observed to freeze before the adjacent bay (November 2008).
Because all of the sampling stations in Iniskin Bay were in the outer portion of the bay and relatively close together (Figure 34-4), no reliable temperature trend can be inferred using the collected data relative to the inner and outer portions of Iniskin Bay.
The data in Table 34-5 imply that the water on the beaches of Iniskin Bay, as recorded at the frequently sampled beach seine stations (MBB, MPS1, MPS1A, MPS1B, MPS1C), is generally warmer (higher mean temperatures) relative to offshore waters, as recorded at the frequently sampled trawl stations (MPS1T, MPS2T, MPS2TA, MPS2TB). Four of the five lowest mean temperatures were recorded at the trawl stations. These data suggest that water temperature in outer Iniskin Bay, especially during the late spring through early fall period, may be driven by a balance between tidal exchange with cooler Cook Inlet waters and nearshore waters exposed to solar heating over mudflats. A similar pattern is evident in Iliamna Bay where two of the consistently sampled trawl stations (MTR1 and MTR2) (Figure 34-4) had lower mean annual temperatures than did the consistently sampled beach seine stations. Trawl station

PEBBLE PROJECT, ENVIRONMENTAL BASELINE DOCUMENT, 2004 THROUGH 2008
34-12 08/03/2011
MTR3 is in very shallow (intertidal) water in inner Iliamna Bay and had a mean temperature comparable to that of nearby beach seine stations (MBSA1, MPS3, MPSE1; Table 34-4).
Winter low temperatures reported in these tables are biased by the fact that during the March 2008 and April (2006 and 2008), as well as during some late fall work, ice excluded us from approaching or sampling many shoreline areas so proportionally more of those data points are from offshore trawl stations.
Salinity
In general, during the period from 2004 to 2008, monthly mean salinity tended to decrease from spring through late summer and started to increase again in the fall months (Figure 34-8). This pattern is not typical for regions that experience significant snowpack and have minimal glacially-fed freshwater inputs. It is not typical because a relative minimum of salinity would be expected during May and June, which are the months of greatest local snowmelt. The minimum average salinity occurred in September 2008 at 23.2 ppt, with August 2004, September 2007, and June and July 2008 having the next lowest values.
These data suggest that salinities may not be greatly influenced by the relative amount of local freshwater inputs such as snow melt or rainfall events. Instead, salinities in the IIE may be determined by broader regional influences combined with tidal and estuarine mixing. Salinities in other portions of Cook Inlet, particularly Knik Arm, have shown similar seasonal variation, with lowest average salinities recorded in mid- to late summer and highest average salinities recorded in spring (Pentec, 2005; Muench et al., 1978). Conditions in the upper portions of Cook Inlet likely influence conditions in the IIE. For example, the lower salinity water from upper Cook Inlet travels in the observed counterclockwise circulation pattern down the west side of the inlet and enters the IIE. Freshwater inputs to the bays should not be completely discounted and are likely important on a localized scale within the bays. One interesting exception to this overall trend came in August 2008 when the average salinity was much higher than either July or September 2008. The reason for this anomaly is unknown.
When stations that were measured less than six times during the study period are removed from the data set, mean salinity was observed to decrease from the outer stations of Iliamna Bay to the inner stations (Figure 34-9). This decrease was likely a result of freshwater inputs at the head of Iliamna Bay. Local stratification was observed during both the spring snowmelt season and in warmer summer months. Stratification was particularly evident during calmer weather and in more sheltered portions of the bays. Snowmelt or significant rain events occasionally created a freshwater surface lens in areas adjacent to freshwater inputs. These lenses were never observed to be greater than 1 or 2 inches deep and can be expected to rapidly diminish as a result of tidal and wind-driven mixing.
Salinities in two of the three tidal lagoon stations were generally lower than at the stations in Iliamna Bay. Both stations MACL and MCWSL have direct freshwater inputs. In contrast, station MCWL which has no apparent fresh surface water inflow, has a relatively unrestricted tidal opening within Cottonwood Bay, and therefore has comparable salinity with other observed stations in Iliamna Bay (Table 34-4).
The proximity of sampling stations in Iniskin Bay does not lend itself to drawing conclusions regarding the spatial distribution of salinity in that area. All stations exhibited comparable salinity values during sampling events (Table 34-5).

OCEANOGRAPHY AND MARINE WATER QUALITY—COOK INLET DRAINAGES
34-13 08/03/2011
Turbidity
Overall turbidity was relatively moderate in both Iliamna Bay and Iniskin Bay. The measured mean was 15.3 nephelometric turbidity units (NTU), and the maximum measurement was 216 NTU (Table 34-3). Comparison of monthly mean turbidities (Figures 34-10a and 34-10b) showed that in most months, Iliamna Bay was generally more turbid than Iniskin Bay.
Available data reflect the dependency of turbidity on wind (and ice) conditions in the IIE. Accordingly, turbidity tended to be highest in the late summer and early fall in Iliamna Bay and slightly elevated in early spring and in late fall for Iniskin Bay. Open water months showing particularly high turbidity, correspond to months in which generally windy conditions prevailed during the field survey period (see Chapter 26 for site wind data). Overall, though, monthly mean, turbidity among all sites in both bays remained relatively constant over the study period. The exceptions were August 2005 and November 2008, when the monthly mean turbidity for both bays combined was approximately twice as high as most other months (31.6 NTU and 47.1 NTU respectively)(Table 34-3). , Wind speeds during these sampling events (August 16 – 18, 2005 and November 11-13, 2008) reached up to 24 miles per hour (mph) and 35 mph respectively which may have contributed to the higher turbidity values (Chapter 2, Appendices 2C, 2F, 2G, and 2H). Another exception was September 2007, when the monthly mean was 26.1 NTU and the largest single turbidity reading of 216 NTU was measured. When this outlier was removed, the average turbidity for that month dropped to 12.5 NTU, which was more in line with the remaining months. In all years of this study, the highest annual monthly means occurred between August and November.
When stations that were measured less than six times during the study period were removed from the data set, average turbidity increased from outer Iliamna Bay to inner Iliamna Bay (Figure 34-11). Increased turbidity is likely due to tide and wave resuspension of the sediments increasing fine-grain sediment levels in the inner bay. The somewhat reduced turbidity levels of station MBS4 (cf. MPSE) in Iliamna Bay may have reflected cleaner water entering the bay from the freshwater stream at Williamsport supplying clearer water to mix with the more turbid inner bay water.
Turbidity in tidal lagoons tended to be relatively low and followed the similar trend as illuminated by the salinity data. More specifically, the two stations in relatively enclosed systems with fresh water inputs (MACL and MCWSL) both had lower than average turbidities while station MCWL was more on par with the other Iliamna stations (Table 34-4). Again, this trend was likely due to the physical configuration of these lagoons and the amount of mixing occurring between the lagoons and the adjacent water in Iliamna Bay or Cottonwood Bay.
In summary, local turbidity appears to reflect the combined influences of the turbulent suspension of fine-grained sediments driven by wind and tidal disturbances, inputs of clearer fresh water, and suspended particulates or clearer water (depending on season) transported in on flood-tide water from Cook Inlet. The lack of appreciable input from glacial melting, with the exception of small glaciers in the Iniskin River watershed, was a contributing reason for low to moderate turbidity in IIE waters.
34.2.7.2 Chemical Analysis
Chemical analysis of marine waters in the IIE showed it to be a high-quality habitat with only minor indications of anthropogenic pollution sources. None of the measured inorganic constituents were above the corresponding National Recommended Water Quality Criteria (U.S. EPA, 2009). More specifically,

PEBBLE PROJECT, ENVIRONMENTAL BASELINE DOCUMENT, 2004 THROUGH 2008
34-14 08/03/2011
concentrations of the inorganic constituents were not above the maximum Criteria Continuous Concentration, which is the most restrictive concentration for water quality criteria for marine habitats and also known as SQuiRT values (Table 34-6). Most concentrations were below both criteria values by one or more orders of magnitude. The full results of chemical analyses are available in Appendix B.
Boron, iron, and tin were the only the measured concentrations that were above the SQuiRT values. These constituents require some clarification in interpretation and the application of their SQuiRT values in this baseline document. Tin was measured below the limit of detection in all samples. Therefore, the values in the table represent averages based on the reporting limits and the method detection limits. These values were not a direct measure of concentration. In addition, the SQuiRT value for tin was based on tributyltin (TBT). TBT has been used in antifouling paints and is a potent biocide. The chance that the tin in IIE was all or even mostly in the form of TBT is extremely low. However, because TBT was not measured directly, it cannot be ruled out.
The SQuiRT value for iron could not be verified. The Ministry of the Environment for British Columbia, Canada, concluded their technical report on iron in water quality guidelines as follows:
“Due to the relatively high mean pH of marine waters (approximately pH 8.2), very little iron would remain in solution, and it is not anticipated that iron toxicity would therefore be a concern. If, in the future, studies are conducted which suggest that iron toxicity in the marine environment may be a concern, a guideline for marine iron levels may be considered at that time” (Phippen et al., 2008).
The most recent edition of the technical report for iron from the Province of British Columbia (Phippen et al., 2008) does not contain a recommended value for iron in marine waters as the SQuiRT compendium attributes.
The value of 1,200 µg/L for boron arose from a water quality document produced by the Ministry of Environment for the Province of British Columbia, Canada. It is based on the application of a 0.1 safety factor to an LC50 of 12,200 µg/liter for a species of salmon (Moss and Nagpal, 2011). This report gives concentrations of boron in coastal Canadian waters as ranging between 3,700 and 4,300 µg/L. Typical oceanic concentrations for boron are in the range of 4,000 to 5,000 µg/L (Culkin, 1965; Williams and Strack, 1966; Marscigrp.org, 2010). The screening value has clear limitations for establishing a threshold of biological response given that natural marine waters exceed its magnitude by factors of three to four.
SQuiRT values help to quickly compare chemical analyses of water and other environmental media and give conservative levels for biological response. However, some SQuiRT values require discussion of their background and applicability before they can be used to interpret ecological conditions. Based on the concentrations in Table 34-6 and the foregoing discussion, all constituents in marine water were considered to be less than their respective SQuiRT values.
Organic constituents in marine water were only analyzed in 2004 (Table 34-7). The majority of organic constituents were not detected. For example, benzene, toluene, ethylbenzene, xylenes, gasoline-range organics, and diesel-range organics were not detected. Residual range organics (RRO) were detected at concentrations ranging between 83 and 258 µg/L. The test for RRO is relatively broad and includes naturally occurring organic compounds with a range of carbon atoms between C25 and C36.
OCEANOGRAPHY AND MARINE WATER QUALITY—COOK INLET DRAINAGES
34-15 08/03/2011
The available data on distribution of all constituents in marine waters of IIE are generally too sparse to substantiate trends. However, a brief analysis of the data set was conducted to look at variations in time, geography, depth, and tidal elevation (Figures 34-12 through 34-15). Some limited observations may be made on the temporal variation of constituents; the other factors did not provide any conclusive patterns.
Analysis of the available water chemistry data from seasonal (May, July, September) sampling in 2008 suggests some relationships with seasonal events in the IIE. The concentrations of total suspended solids (TSS) were substantially higher in the spring than during the summer, a likely result of increased snowmelt during the spring months (orange triangles in Figure 34-12; Table 34-6) although the higher TSS did not parallel a particularly high turbidity during the May 2008 sample period (Table 34.3). Some evidence suggests that concentrations of many inorganic constituents followed a similar although less extreme seasonal pattern as TSS (Figure 34-12). Concentrations of many constituents generally decrease from the May water collection to the July collection. In comparing the July and September concentrations, the results were less consistent.
One additional observed seasonal correlation was the variation in measured concentrations of total ammonia (nitrogen, Ammonia as N in Table 34-6) in non-filtered samples. Total ammonia was measured below detection limits at all stations during the spring, detected at one station in early summer, and measured at all three stations in late summer. A likely explanation for this observation is that planktonic algae used up the ammonia during the spring bloom. As another nutrient or light became the limiting factor to algal production, the ammonia concentrations returned to measurable levels. Saupe et al. (2005) reported mean ammonia concentrations of 12 µg-N/liter in surface water and 24 µg-N/liter in bottom water. These values were derived from more than 50 observations in each stratum collected throughout coastal waters of southcentral Alaska in 2002. The values agree with the IIE data, allowing for the substantial biological influences on the distribution of this nutrient.
Potential depth variation in the concentration of inorganic constituents was examined. Most constituents show only a modest variation over depth, a circumstance consistent with well-mixed water and the absence of a strong thermocline (Figure 34-13). Although the extreme concentration shifts in lead and selenium on this figure stood out, neither of these features is particularly meaningful. The high value for the mean-adjusted concentration of lead in the surface portion of the data—and correspondingly the low value for the bottom portion—derived from one particularly high concentration measured in a surface sample. One data point does not support a trend. Selenium was measured below detection in all samples, so no trend with ecological meaning can be interpreted from those data.
Results of the analysis of potential geographic variation are presented in Figure 34-14. Factoring out the information for lead and selenium for reasons previously stated, the geographical distribution is quite uniform.
Results of the analysis of potential tidal variation are presented in Figure 34-15. In this case, the extreme variation in selenium is based on the single detected concentration measured at the low tidal elevation, which raised the mean-adjusted concentration in the low tidal elevation and depressed it at high tide. Total ammonia was also higher during low tide sampling. Otherwise, no variation in concentration based on tidal stage is apparent.

PEBBLE PROJECT, ENVIRONMENTAL BASELINE DOCUMENT, 2004 THROUGH 2008
34-16 08/03/2011
34.2.7.3 Water Quality Summary
Water quality in the IIE during the period from 2004 to 2008 was influenced by tidal exchange with Cook Inlet and Kamishak Bay. Local fresh water inputs created minor, localized effects at the heads of the bays. Observed gradients in salinity occurred between the inner and outer portions of Iliamna Bay. Temperatures were driven by insolation and seasonal variations. Ice was generally present through the winter months, a warming trend occurred during the spring and summer, and temperatures declined again in the fall. Temperatures were also driven by water depth, reinforcing the role of insolation as a factor in temperature trends. Salinity decreased from spring to late summer, increased again in the fall, and appeared to be an additional indicator of the influence of regional water on the bays. Turbidity was generally moderate, except near the shoreline during windy periods, and did not exhibit any obvious trends that indicate point-source inputs.
Analyses of hydrocarbon concentration in marine water from IIE in 2004 and of metal and trace element concentrations in 2008 showed little to no effect from anthropogenic sources. Concentrations of all inorganic constituents were less than the Criteria Continuous Concentration water quality criteria for marine habitats, also known as SQuiRT values; many concentrations were lower by orders of magnitude. Data analyses showed the marine waters of IIE to be high-quality habitat for marine biota. These data suggest a relationship between increased concentrations of many inorganic constituents with TSS, but demonstrate no strong patterns with respect to depth in the water column to geography, or to tide stage.
34.3 References
Britch, R. Northern Consulting Group, Owner/Oceanographer. Personal Communications with L. Gardner of RWJ Consulting for the Purposes of this Report. 2004 through 2006.
Brower, W.A., Jr., R.G. Baldwin, C.N. Williams, J.L. Wise, and L.D. Leslie. 1988. Climatic Atlas of the Outer Continental Shelf Waters and Coastal Regions of Alaska. Vol. I, Gulf of Alaska. National Climatic Data Center, and Arctic Environmental Information and Data Center. Pp. vi, 31, and 519.
Buchman, M.F. 2008. NOAA Screening Quick Reference Tables, NOAA OR&R Report 08-1. Seattle, Washington. Office of Response and Restoration Division; National Oceanic and Atmospheric Administration.
Burbank, D.C. 1977. “Circulation Studies in Kachemak Bay and Lower Cook Inlet.” Environmental Studies of Kachemak Bay and Lower Cook Inlet, Vol. III. L.L. Trasky, L.B. Flagg, and D.E. Burbank, eds. Anchorage, Alaska: Alaska Department of Fish and Game..
Culkin, F. 1965. “The Major Constituents of Seawater.” Chemical Oceanography. J.P. Riley and G. Skirrow, eds. London: Academic Press.
Detterman, R.L. and Hartsock, J.K. 1966. Geology of the Iniskin-Tuxedni Region, Alaska. Professional Paper 512. Washington D.C.: U.S. Geological Survey

OCEANOGRAPHY AND MARINE WATER QUALITY—COOK INLET DRAINAGES
34-17 08/03/2011
Hampton, M.A. 1980. “Shallow Faulting, Bottom Instability, and Movement of Sediment in Lower Cook Inlet and Western Gulf of Alaska.” U.S. Department of Commerce, U.S. Department of the Interior. Environmental Assessment of the Alaskan Continental Shelf, Annual Reports of Principal Investigators, Annual Report V (1981): Pp. 45-180.
Hein, J.R., A.H. Bouma, M.A. Hampton, and C.R. Ross. 1979. “Clay Mineralogy, Fine-grained Sediment Dispersal, and Inferred Current Patterns, Lower Cook Inlet and Kodiak Shelf, Alaska.” Sedimentary Geology. Vol. 24, No. 3-4, Pp. 291-306.
Houghton, J.P., R.P. Britch, R.C. Miller, A.K. Runchal, and C.P. Falls. 1980. “Drilling Fluid Dispersion Studies at the Lower Cook Inlet COST Well.” Proceedings of Symposium/Research on Environmental Fate and Effect of Drilling Fluids and Cuttings. Washington, D.C.: American Petroleum Institute.
Johnson, Mark. 2006. Coastal Marine Institute, University of Alaska Fairbanks. Personal Communication. November.
LaBelle, J.C., J.L. Wise, R.P. Voelker, R.H. Schulze, and G.M. Wohl. 1983. Alaska Marine Ice Atlas. University of Alaska, Arctic Environment Information and Data Center.
Lees, D.C. 1976. The Epifaunal Assemblage in the Phillips Petroleum Lease Site off Spring Point, Chinitna Bay, Alaska. Final report, Phillips Petroleum Company, Kenai, Alaska. Prepared by Dames & Moore, Inc., Anchorage, Alaska.
Lees, D.C., J.P. Houghton, D.E. Erikson, W.D. Driskell, and D.E. Boettcher. 1980. Ecological Studies of Intertidal and Shallow Subtidal Habitats in Lower Cook Inlet, Alaska. U.S. Department of Commerce, National Oceanic and Atmospheric Administration, Outer Continental Shelf Environmental Assessment Program. Final Report 44, Pp. 1-436.
Lloyd, Steve K. 2000. Farallon: Shipwreck and Survival on the Alaska Shore. Pullman, Washington: Washington State University Press.
Marscigrp.org 2010. http://www.marscigrp.org/ocpertbl.html#5 (accessed 14 Sep 10).
Moss, S.A. and N.K. Nagpal. 2011. Ambient Water Quality Guidelines for Boron (electronic resource). http://www.env.gov.bc.ca/wat/wq/BCguidelines/boron/boron.pdf (accessed 31 January 2011).
Muench, R.D., H.O. Mofjeld, and R.L. Charnell. 1978. “Oceanographic Conditions in Lower Cook Inlet: Spring and Summer 1973.” Journal of Geophysical Research. Vol. 83, No. C10, Pp. 5090-5098.
National Ice Center (NIC). 2009. Northern Hemisphere Ice Charts Archive (1997-2008). http://www.natice.noaa.gov/pub/west_arctic/bering_sea/cook_inlet/ (accessed September 2, 2009).
Northern Dynasty Mines Inc.. 2005. Pebble Project; Environmental Baseline Studies, 2005 Final Quality Assurance Project Plan.
Nobeltec. 2004. Tides & Currents Pro, Version 3.1i.

PEBBLE PROJECT, ENVIRONMENTAL BASELINE DOCUMENT, 2004 THROUGH 2008
34-18 08/03/2011
Pebble Partnership. 2008. Pebble Project; Environmental Baseline Studies 2008; Quality Assurance Project Plan. Prepared for State of Alaska Large Mine Permitting Team; Department of Natural Resources. April 2008 Draft.
Pentec Environmental. 2004. Pebble Marine Work Plan.
———. 2005. Draft 2004-2005 Report of Marine Fish and Benthos Studies in Knik Arm, Anchorage, Alaska. Prepared for Knik Arm Bridge and Toll Authority, and HDR Alaska, Inc.
———. 2008. Pebble Project Environmental Baseline Studies, Field Sampling Plan Marine Studies Cook Inlet.
Phippen, B., C. Horvath, R. Nordin, and N. Nagpal. 2008. Ambient Water Quality Guidelines for Iron (electronic resource). http://www.env.gov.bc.ca/wat/wq/BCguidelines/iron/iron_tech.pdf (accesssed February 10, 2011).
Poole, P.W., and G.L. Hufford. 1982. “Meteorological and Oceanographic Factors Affecting Sea Ice in Cook Inlet.” Journal of Geophysical Research. Vol. 87, No. C3, Pp. 2067-2070.
Province of British Columbia, Canada, 2010, http://www.env.gov.bc.ca/wat/wq/BCguidelines/iron/iron_tech.pdf
Saupe, S., J. Gendron, and D. Dasher. 2005. The Condition of Southcentral Alaska Coastal Bays and Estuaries. A Statistical Summary for the National Coastal Assessment Program. Alaska Department of Environmental Conservation. March 15, 2006.
Sobey, E.J.C. 1979. “Task D, Transport and Alteration of Contaminant Discharges.” Science Applications Inc., Lower Cook Inlet Synthesis Report, U. S. Department of Commerce. Pp. 71-101.
U.S. Environmental Protection Agency. 2009. National Recommended Water Quality Criteria. http://www.epa.gov/waterscience/criteria/wqctable/ Accessed 29 October 2009.
Williams, P.M. and Strack, P.M. 1966. “Complexes of boric acid with organic cis-diols in seawater.” Limnology and Oceanography. Vol. 11, No. 3.Pp 401-404.
Wilson, Frederic H., Hults, Chad P., Schmoll, Henry R., Haeussler, Peter J., Schmidt, Jeanine M., Yehle, Lynn A., and Labay, Keith A. 2009. Preliminary Geologic Map of the Cook Inlet Region, Alaska - Including Parts of the Talkeetna Mountains, Tyonek, Anchorage, Lake Clark, Kenai, Seward, Iliamna, Seldovia, Mount Katmai, and Afognak 1:250,000-scale quadrangles: U.S. Geological Survey Open-File Report OFR 2009-1108.
34.4 Glossary
Anticyclonic—a system of movements or a local circulation pattern that is opposed to the earth’s rotation and is clockwise in the Northern Hemisphere.
Cardinal Orientation—orientation with respect to one of the four principal compass points north, south, east, and west.

OCEANOGRAPHY AND MARINE WATER QUALITY—COOK INLET DRAINAGES
34-19 08/03/2011
Drogue track—a track depicting the movements of an unmanned drogue, a buoy, or other device moved primarily by tidal circulation.
Embayment—a bay-like feature often not associated with fresh water inputs where flushing and other oceanographic features are tidally or weather dominated.
Estuary—a semi-enclosed, tidal, coastal body with open connection to the sea; characterized as a mixing environment between saline seawater and fresh water inputs.
Insolation—a measure of solar radiation energy received on a given surface area in a given time.
Isohalines—lines of equal or constant salinity. A line on a chart connecting all points of equal salinity.
Katabatic forces—density-driven forces resulting in wind local wind patterns. In relation to williwaws, these result from denser cold air forming adjacent to snow or ice fields and descending down mountain slopes.
Niskin sampler—a device to sample surface water from depth. It consists of a wide tube made of PVC with stoppers at both ends. The stoppers are tied together with a strong band (generally latex) and closed by receiving the pulse of a messenger attached to and dropped down the sampling line. This type of sampler has a narrower aspect than a Van Dorn sampler and is generally deployed only vertically.
Shore-Fast Ice—sea ice that has frozen along coasts (“fastened” to them), along the shoals, or to the sea floor over shallow parts of the continental shelf, and extends out from land into sea. Fast ice does not move with currents and wind.
Tidal rip—zone of agitated water caused by shear processes resulting from the close proximity of two opposing currents or a strong current in close proximity to a stationary object.
Van Dorn sampler—a device to sample surface water from depth. It consists of a wide tube made of acrylic or PVC with stoppers at both ends. The stoppers are tied together with a strong band (generally latex) and closed by receiving the pulse of a messenger attached to and dropped down the sampling line. This type of sampler has a wider aspect than a Niskin sampler and is frequently deployed horizontally.
Williwaws— a sudden violent gust of cold land air common along mountainous coasts of high latitudes.

OCEANOGRAPHY AND MARINE WATER QUALITY—COOK INLET DRAINAGES
TABLES

OCEANOGRAPHY AND MARINE WATER QUALITY—COOK INLET DRAINAGES
TABLE 34-1 Tidal Data for Iniskin Bay (59° 40.8′, 153° 23.8′)
Elevation a
(meters)
Highest estimated tide 6.1
Mean higher high water 4.4
Mean high water 4.2
Mean sea level 2.3
Mean low water 0.4
Mean lower low water 0.0
Lowest estimated tide -1.5
Note:
a. All elevations are relative to mean lower low water.
Source: Brower et al., 1988.

OCEANOGRAPHY AND MARINE WATER QUALITY—COOK INLET DRAINAGES
Table 34-2 Page 1 of 2
TABLE 34-2 Analytical Constituents for Marine Water Quality Samples
Year Detection Limits Reporting
Limits Analyte 2004 2008 Analytical Methods Min Max Min Max Units
Aluminum • E200.7, E200.8, SW6010B 20 624 50 2000 µg/liter
Antimony • E200.8 0.1 6.16 1 16 µg/liter
Arsenic • E200.8 0.01 20 0.5 40 µg/liter
Barium • E200.7, E200.8, SW6010B 0.7 7.52 5 24 µg/liter
Benzene • SW8260B 0.11 0.12 0.4 0.5 µg/liter
Beryllium • E200.8 0.0004 1.2 0.02 2.4 µg/liter
Bismuth E200.8 120 120 400 400 µg/liter
Boron • E200.7, E200.8, SW6010B 2.1 31 6 100 µg/liter
Cadmium • E200.8 0.001 2.48 0.02 8 µg/liter
Chromium • E200.8 0.01 8 0.2 16 µg/liter
Cobalt • E200.8 0.001 2.48 0.02 8 µg/liter
Copper • E200.8 0.003 4.96 0.1 16 µg/liter
Diesel Range Organics • AK102 0.031 0.0698 0.313 0.8 mg/liter
Ethylbenzene • SW8260B 0.13 0.31 0.5 1 µg/liter
Gasoline Range Organics • AK101 0.01 0.01 0.09 0.09 mg/liter
Iron • E200.7, E200.8 2 496 20 1600 µg/liter
Lead • E200.8 0.001 8 0.02 16 µg/liter
Manganese • E200.7, E200.8, SW6010B 0.3 40 2 80 µg/liter
Mercury • • E1631 0.00005 157 0.001 500 µg/liter
Molybdenum E200.8, SW6010B 5 24.8 10 80 µg/liter
Nickel • E200.8 0.01 4.96 0.2 16 µg/liter Nitrogen, Total Ammonia (as N) • •
A4500AD, A4500NG, A4500NH, E350.1 6 40 40 100 µg/liter
o-Xylene • SW8260B 0.079 0.31 0.5 1 µg/liter
Residual Range Organics • AK103 0.054 0.0698 0.5 0.581 mg/liter
Selenium • E200.8, SW7742 0.2 24.8 1 80 µg/liter
Silver • E200.8 0.0003 0.496 0.02 2 µg/liter
Thallium • E200.8 0.0004 2 0.02 4 µg/liter
Tin • E200.8 0.14 24.8 2 80 µg/liter
Toluene • SW8260B 0.098 0.31 0.5 1 µg/liter

PEBBLE PROJECT, ENVIRONMENTAL BASELINE DOCUMENT, 2004 THROUGH 2008
Table 34-2 Page 2 of 2
Total Suspended Solids • • A2540D, E160.2 0.3 5 1 5 mg/liter
Vanadium • E200.7, E200.8, SW6010B 0.44 20 2 32 µg/liter
Xylene, Isomers m & p • SW8260B 0.22 0.62 0.5 2 µg/liter
Zinc • E200.8 0.03 37.6 0.5 120 µg/liter
Note:
Some analyses were performed on only a small number of samples.

OCEANOGRAPHY AND MARINE WATER QUALITY—COOK INLET DRAINAGES
TABLE 34-3 Summary Marine Water Quality Statistics by Month and Year, 2004-2008, at all IIE Stations Sampled (see Figure 34-4)
2004 2005 2006 2007 2008
All Months
Au
g
May
Jun
Jul
Au
g
Ap
r
May
Sep
Sep
Oct
Mar
Ap
r
May
Jun
Jul
Au
g
Sep
Oct
No
v
Temp Mean 8.9 18.0 9.1 11.9 15.2 14.7 3.4 7.3 10.2 11.8 6.0 0.2 1.6 7.4 10.5 12.3 13.6 10.1 5.3 2.0
(°C) Max 27.4 27.4 13.4 18.3 17.6 15.7 4.2 11.4 10.6 12.3 7.4 1.7 2.7 8.9 18.3 22.1 14.5 10.9 7.5 3.4
Min -1.8 13.2 6.4 9.3 13.1 13.8 2.8 5.2 10.0 10.4 4.4 -1.8 0.2 4.9 6.2 10.3 12.5 6.8 0.8 -0.7
n 327 3 14 23 11 10 14 18 12 15 20 8 13 27 31 27 27 20 16 19
Salinity Mean 26.3 23.6 26.4 26.0 25.4 25.1 29.3 28.7 25.4 23.4 27.2 29.9 30.4 26.8 25.2 23.8 27.4 23.2 26.1 28.3
(ppt) Max 31.1 28.3 29.1 29.4 28.2 28.2 30.0 30.0 27.4 28.4 28.7 30.5 31.1 30.0 30.0 30.0 29.3 27.1 28.6 29.1
Min 1.3 15.3 9.4 8.0 18.6 13.3 27.9 24.8 22.3 8.3 23.8 28.6 29.0 4.1 9.4 1.3 16.5 1.4 15.3 26.1
n 327 3 15 23 11 10 14 18 12 15 20 8 13 27 31 27 27 20 16 19
Turbidity Mean 15.3 N/A 15.0 13.6 12.9 31.6 10.0 10.5 18.2 26.1 5.7 16.8 5.0 11.0 10.2 11.2 4.8 16.2 17.2 47.1
(NTU) Max 216.0 N/A 36.0 44.0 37.5 105.0 24.0 70.0 55.9 216.0 13.0 34.0 13.0 11.0 60.0 35.4 40.0 70.0 37.0 170.0
Min 0.3 N/A 3.8 2.6 3.0 2.4 5.1 4.0 6.4 1.5 1.2 10.0 2.7 11.0 0.3 2.8 1.2 2.8 6.2 11.0
n 273 N/A 13 23 8 8 13 18 10 15 20 8 10 1 27 20 26 20 16 19
Notes: n = number of measurements
Max = maximum; Min = minimum; ppt = parts per thousand; NTU = nephelometric turbidity units.
Data shown represent statistics from all sets, all stations in a given month.

OCEANOGRAPHY AND MARINE WATER QUALITY—COOK INLET DRAINAGES
TABLE 34-4 Summary Marine Water Quality Statistics for Iliamna Bay by Sampling Station, 2004-2008
Station
MT
R2
MP
S4-
Offsh
ore
MP
S4
MT
R1
MB
S1
MP
S3
MB
SA
1
MT
R3
MB
S3
MP
SE
1
MP
SE
2
MP
SE
MB
S4
MU
I1
MU
I2
MA
CL
a
MC
WL
a
MC
WS
La
Temperature Mean 6.9 9.9 8.5 6.4 8.9 7.5 9.3 9.3 10.0 9.5 8.7 12.1 9.7 7.8 6.6 10.1 12.6 11.9
(°C) Max 13.0 11.9 13.2 12.3 15.1 13.7 14.8 13.4 17.1 16.1 13.6 27.4 16.9 7.8 6.6 18.3 22.1 18.0
Min -0.1 7.3 0.8 -1.0 2.7 0.2 3.7 5.3 0.1 -0.1 0.7 -0.7 -0.5 7.8 6.6 0.8 3.2 6.2
n 11 4 22 11 18 11 19 5 23 11 7 17 15 1 1 7 5 3
Salinity Mean 28.6 27.2 28.1 28.2 26.6 27.0 27.3 25.4 25.7 25.4 24.1 23.7 17.1 24.4 15.6 14.3 23.4 19.9
(ppt) Max 30.8 29.3 30.3 30.5 29.8 31.1 29.6 28.0 29.4 28.7 28.0 27.9 30.6 24.4 15.6 24.7 27.2 24.8
Min 24.8 25.3 22.6 26.0 8.3 23.2 23.3 16.5 11.9 20.1 16.8 15.0 1.3 24.4 15.6 4.1 12.2 11.2
n 11 4 22 11 18 11 19 5 23 11 7 17 15 1 1 7 5 3
Turbidity Mean 6.9 6.6 11.7 6.9 11.0 10.0 15.4 6.4 19.7 22.5 28.2 52.0 38.6 5.3 25.4 7.9
(NTU) Max 16.0 8.9 38.0 16.0 31.0 26.0 105.0 8.5 150.0 47.2 82.0 170.0 216.0 10.4 60.0 9.4
Min 1.5 2.8 0.3 1.5 1.5 3.4 1.6 5.2 3.5 6.8 6.4 6.8 1.9 1.2 9.8 6.5
n 10 3 18 9 17 10 17 4 22 10 6 13 15 0 0 6 4 2
Notes: Offshore’ stations are water and sediment quality stations; Station names including a “T” are trawl stations; all others are beach seine stations (see Figure 34-4)
a. These tidal lagoon stations are discussed separately from the other stations in Iliamna Bay.
Trawl stations are color coded green for easier identification.
n = number of measurements
Max = maximum
Min = minimum
ppt = parts per thousand
NTU = nephelometric turbidity units

OCEANOGRAPHY AND MARINE WATER QUALITY—COOK INLET DRAINAGES
TABLE 34-5 Summary Marine Water Quality Statistics for Iniskin Bay by Sampling Station, 2004-2008
Station
MO
PP
1 - O
ffsho
re
MY
VC
M
MY
VL
MP
S1A
MP
S1
MP
S1T
MP
S1-
Offsh
ore
MP
S1B
MP
S1C
MB
B
MP
S2T
MP
S2T
A
MP
S2T
B
MT
R4
MS
LF
Temperature Mean 9.5 10.5 6.5 10.2 7.8 7.2 10.0 8.5 8.5 10.1 6.3 7.1 7.5 11.6 11.6
(°C) Max 10.3 12.9 6.5 15.7 13.5 13.6 11.2 13.9 14.0 14.1 14.1 14.1 14.4 11.6 11.6
Min 8.2 8.6 6.5 2.6 0.5 -1.8 7.8 0.1 0.4 3.3 1.6 0.6 0.9 11.6 11.6
n 3 4 1 14 12 12 4 21 19 14 9 13 8 1 1
Salinity Mean 28.5 26.8 30.0 28.4 28.6 27.9 27.2 28.4 27.7 28.4 29.0 27.9 27.5 25.1 24.3
(ppt) Max 30.0 28.6 30.0 30.0 30.5 30.5 29.5 30.4 30.4 30.0 30.6 30.4 30.6 25.1 24.3
Min 25.6 22.1 30.0 25.9 26.5 25.0 24.7 25.3 22.8 26.5 27.0 25.7 25.8 25.1 24.3
n 3 4 1 14 12 12 4 21 19 14 9 13 8 1 1
Turbidity Mean 3.1 4.0 6.2 13.0 9.1 8.6 9.5 12.7 12.1 9.2 6.4 7.3 8.8 17.6
(NTU) Max 3.1 5.4 17.1 30.0 28.0 14.0 28.0 35.6 38.0 34.0 17.0 18.0 8.8 17.6
Min 3.1 1.3 1.2 2.1 1.9 4.1 1.4 3.1 1.7 1.9 1.8 2.6 8.8 17.6
n 1 3 0 11 9 11 3 15 14 12 8 11 7 1 1
Note: ‘Offshore’ stations are water and sediment quality stations; station names including a “T” are trawl stations; all others are beach seine stations (see Figure 34-4).
Trawl stations are color coded green for easier identification.
n = number of measurements.
Max = maximum;
Min = minimum;
ppt = parts per thousand;
NTU = nephelometric turbidity units.

OCEANOGRAPHY AND MARINE WATER QUALITY—COOK INLET DRAINAGES
TABLE 34-6A Results of Analyses of Marine Water Quality Samples, 2008
Constituent
Nonfiltered Samples
Sample Station
Filtered Samples
Sample Station
(µg/L; except TSS, mg/L) MPS4 MOPP1 MPS1 MPS4 MOPP1 MPS1 SQuiRT value
Aluminum 252 159 350 25 23 23 NC
Antimony 0.25 0.35 0.24 0.23 0.25 0.24 500 a
Arsenic 1.4 1.4 1.4 1.4 1.4 1.4 36
Barium 6.9 5.9 7.4 5.7 5.1 5.6 200 a
Beryllium 0.0056 0.0075 0.0067 0.0029 0.0084 0.0052 100 a
Boron 3,001 3,038 3,045 3,023 3,043 2,994 1,200 a
Cadmium 0.054 0.056 0.059 0.055 0.053 0.053 8.8
Chromium 0.62 0.34 0.59 0.26 0.17 0.17 50
Cobalt 0.204 0.121 0.249 0.074 0.043 0.062 1.0 a
Copper 1.25 1.05 1.31 0.70 0.63 0.61 3.1
Iron 402 243 539 47 35 37 50 a
Lead 0.420 0.238 0.301 0.110 0.066 0.075 8.1
Manganese 14.6 8.3 16.8 5.6 2.7 4.5 100 a
Mercury 0.00085 0.00059 0.00139 N N N 0.94
Nickel 0.82 0.68 0.95 0.62 0.52 0.55 8.2
Nitrogen, Total Ammonia (as N)
23 26 27 N N N 795
Selenium 0.17 0.20 1.10 0.10 0.10 0.10 71
Silver 0.0059 0.0066 0.0071 0.0076 0.0065 0.0066 0.95 a
Thallium 0.015 0.013 0.015 0.012 0.012 0.010 17
Tin 0.19 0.22 0.19 0.19 0.22 0.17 0.0074 a
Total Suspended Solids 37 29 31 N N N NC
Vanadium 4.0 4.3 3.0 3.6 3.8 4.1 50 a
Zinc 3.0 2.5 2.8 2.2 1.4 1.8 81
Notes: tabular values are mean concentrations representing varying numbers of detected concentrations and results below the limit of detection entered at one-half the detection limit.
a. SQuiRT value from other than National Recommended Water Quality Criteria (U.S. EPA, 2009). TSS = total suspended solids SQuiRT value = Screening Quick Reference Table value (Buchman, 2008).
N = only nonfiltered samples analyzed NC = no SQuiRT value available µg/liter = microgram per liter
mg/liter = milligram per liter

OCEANOGRAPHY AND MARINE WATER QUALITY—COOK INLET DRAINAGES
TABLE 34-6B Results of Analyses of Marine Water Quality Samples, 2008
Constituent Sample Station
(µg/L; except TSS, mg/L) Sampling
Event MPS4 MOPP1 MPS1 SQuiRT Value
Nitrogen, Total Ammonia (as N)
May-08 25 25 25 795
Jul-08 4 23 4 795
Sep-08 33 30 33 795
Total Suspended Solids May-08 59 58 62 NC
Jul-08 19 14 16 NC
Sep-08 16 16 25 NC
Notes: tabular values are mean concentrations of results for surface and bottom water samples.
Bold Results = Parameter undetected by test; value shown is 1/2 method detection limit or 1/2 method reporting limit.
(For the ammonia results, all of the samples collected in May 2008 were measured below the method reporting limit (the value of 25 µg/liter represents one-half the method reporting limit). For ammonia analyses of water samples collected in July the results at stations MPS4 and MPS1 were below the limit of detection (the value of 4 µg/liter represents one-half the method detection limit).
For the ammonia results, either both the surface and bottom water samples measured detected concentrations or they both measured below the limit of detection (and at the same value for each sample pair).
SQuiRT value = Screening Quick Reference Table value (Buchman, 2008).
Only nonfiltered samples were used in preparation of this table.
NC = no SQuiRT value available
µg/liter = microgram per liter
mg/liter = milligram per liter

OCEANOGRAPHY AND MARINE WATER QUALITY—COOK INLET DRAINAGES
TABLE 34-7 Analyses of Organic Compounds in Marine Bottom Water Quality Samples, 2004
Station
Constituent (µg/L) MPS3 MPS4 MPS1 MPS2
Benzene 0.06 0.06 0.06 0.06
Toluene 0.16 0.16 0.16 0.16
Ethylbenzene 0.16 0.16 0.16 0.16
Xylene, Isomers m & p 0.31 0.31 0.31 0.31
o-Xylene 0.16 0.16 0.16 0.16
Gasoline Range Organics 45 45 45 45
Diesel Range Organics 167 175 157 157
Residual Range Organics 141 83 258 103
Notes: Bold Results = Parameter undetected by test; value shown is 1/2 method detection limit or 1/2 method reporting limit.
µg/liter = microgram per liter;

OCEANOGRAPHY AND MARINE WATER QUALITY—COOK INLET DRAINAGES
FIGURES

Canada
ARCTIC OCEAN
Map LocationGUL F OF ALASKA
Russia
BERING SEA _̂Pebble
!!
!!
!!
!!
!!
!!
!!
!!
!!
!!
!!
!!!!
!!
!!
!!
!! !!
!!
!!
!!
!!
!!
!!
!!
!!
!!
S h e l i k o f S t r a i t
Kenai Fjords National Park
Chini tna Bay
C o o k I n l e t
K a c h e m a k B a y
S t e v e n s o n E n t r a n c e
Barren IslandsK e n n e d y E n t r a n c e
KalginIsland
Redoubt Bay
Mt. Redoubt
Gompertz Channel
Trading Bay
G u l f o f A l a s k a
CapeDouglas
I l i a m n aL a k e
Lake Clark
Kamishak Bay
Tustumena L.
Susit
na R
iver
River
Nonvianuk L .
Kukak lek L.
P i l e B
a y
Bruin Bay
Ursus Cove
McNeil Cove
Matanuska River
Port Chatham
Forelands
AugustineIsland K
EN
AI P
EN
.
KodiakIsland
AfongakIsland
Iliamna
Kenai
Homer
Tyonek
Palmer
Kokhanok
Wasilla
Newhalen
Port Alsworth
Williamsport
AnchorPoint
Ninilchik
ClamGulch
Lime Village
Soldotna
Beluga
Seldovia
Nondalton
Kodiak
Seward
Pile Bay
Chekok Pedro Bay
Kustatan
Ini skin BayIl iamna BayCottonwood Bay
Nikiski
Anchorage
Turnagin Arm
Knik Arm
Knik River
PortLions
Mt. Iliamna
Katmai National Parkand Preserve
Lake Clark National Parkand Preserve
Tuxedni Bay
Mt. Douglas
148°20'0"W149°10'0"W150°0'0"W150°50'0"W151°40'0"W152°30'0"W153°20'0"W154°10'0"W155°0'0"W61
°30
'0"N
61°3
0'0
"N
61°0
'0"N
61°0
'0"N
60°3
0'0
"N
60°3
0'0
"N
60°0
'0"N
60°0
'0"N
59°3
0'0
"N
59°3
0'0
"N
59°0
'0"N
59°0
'0"N
58°3
0'0
"N 58°3
0'0
"N
58°0
'0"N
58°0
'0"N
0 10 20 30 40Miles
1:1,400,000Scale
0 10 20 30 40 50Kilometers
³
Figure 34-1Cook Inlet and Vicinity
Alaska State Plane Zone 5 (units feet)1983 North American Datum
Date: July 5, 2011
Author: RDI-LS
File: RDI_Pen_Cook_Fig34-1_11x17P_1of1_D04.mxd
LegendBristol Bay/Cook Inlet Drainages Boundary
National Park or Preserve
!! Communities
Version: 4

Canada
ARCTIC OCEAN
Map Location
Russia
BERING SEAGUL F OF ALA SKA
Alaska State Plane Zone 5 (units feet)1983 North American Datum
Date: July 26, 2011
Author: RDI-LS
!
NorthHead
Y Valley
Mt. Pomeroy
BlackieBeach
C O O K I N L E T
AC Point
DiamondPoint
White GullIsland
SouthHead
KnollHead VertIslandScott Island
IniskinIsland
FossilBeach
Black Reef
I ni s
k in
Bay
I l i am
na
B a y
Turtle Reef
Mushroom Islets
The Toadstools
IniskinShoal
FossilReef
Y ValleyLagoon
Por ta
geCr
eek
Iniskin River
C o t t o n w o o d B a y
R i g h t A r m
Back
Rang
eWilliamsport
153°16'0"W
153°16'0"W
153°20'0"W
153°20'0"W
153°24'0"W
153°24'0"W
153°28'0"W
153°28'0"W
153°32'0"W
153°32'0"W
153°36'0"W
153°36'0"W
153°40'0"W
153°40'0"W
153°44'0"W
153°44'0"W59
°45'
0"N
59°4
2'0"
N59
°39'
0"N
59°3
6'0"
N
LegendIIE Study Area
! Existing Community
³File: RDI_SA_Fig34-2_11X17L_1of1_D08.mxd
Version: 8
0 0.5 1 1.5 2 2.5Miles
0 1 2 3Kilometers
Scale 1:90,000
Figure 34-2Physical Oceanography
and Marine Water Quality Study Area,Iniskin/Iliamna Bay Estuary,
Cook Inlet, 2004-2008

Figure 34-3a Drogue Track near Iniskin/Iliamna Estuary Source: Mark Johnson (pers. comm., 2006), supported by Minerals Management Service through Coastal Marine Institute at University of Alaska Fairbanks.
Figure 34-3b Observed Current Circulation Patterns near the Iliamna/Iniskin Estuary Source: Burbank, 1977.
IIE
Drogue Track

Canada
ARCTIC OCEAN
Map Location
Russia
BERING SEA GUL F O F ALASKA
!
#*
#*
#*
#*
#*
Cottonwood Bay
NorthHead
C o o k I n l e t
SouthHead
KnollHead
White Gull Island
Diamond Point
Black Reef
I ni s
k in
B
a y
BlackieBeach
Fossil BeachKeystone Cr.
AC PointIlia
mn
a B
a y
C o t t o n w o o d B a y
C o o k I n l e t
ScottIsland
Williamsport
MBB
MBS1
MBS3
MBS4
MBSA1
MPS1MPS1A
MPS1BMPS1C
MPS3
MPS4
MPSE
MPSE1
MPSE2
MYVCM
MACL
MCWL
MCWSL
MSLF
MUI1
MUI2
MPS1A
MPS1B
MBSA1
MPS4 MYVL
MPS1T
MPS2T
MPS2TA
MPS2TB
MTR1
MTR2
MTR4
MTR3
MOPP1
MPS2
MPS1
MPS4
MPS3
153°27'0"W153°30'0"W153°33'0"W153°36'0"W153°39'0"W59
°45
'0"N
59°4
5'0
"N
59°4
2'0
"N
59°4
2'0
"N
59°3
9'0
"N
59°3
9'0
"N
59°3
6'0
"N
59°3
6'0
"N
0 0.5 1 1.5 2Miles
1:55,000Scale
0 0.5 1 1.5 2 2.5Kilometers
³
Figure 34-4Water Quality Station Locations,
Marine Waters,Cook Inlet,2004-2008
Alaska State Plane Zone 5 (units feet)1983 North American Datum
Date: July 8, 2011File: RDI_Pen_Seine_Trawl_Fig34-4_11X17P_1of1_D06.mxd
LegendSampling Locations
120-ft Beach Seine
30-ft Beach Seine
Gill/Trammel Net
Trawl
#* Water Chemistry
Author: RDI - LSVersion: 6
MTS4 Station IdentificationLabel Example
! Existing Community
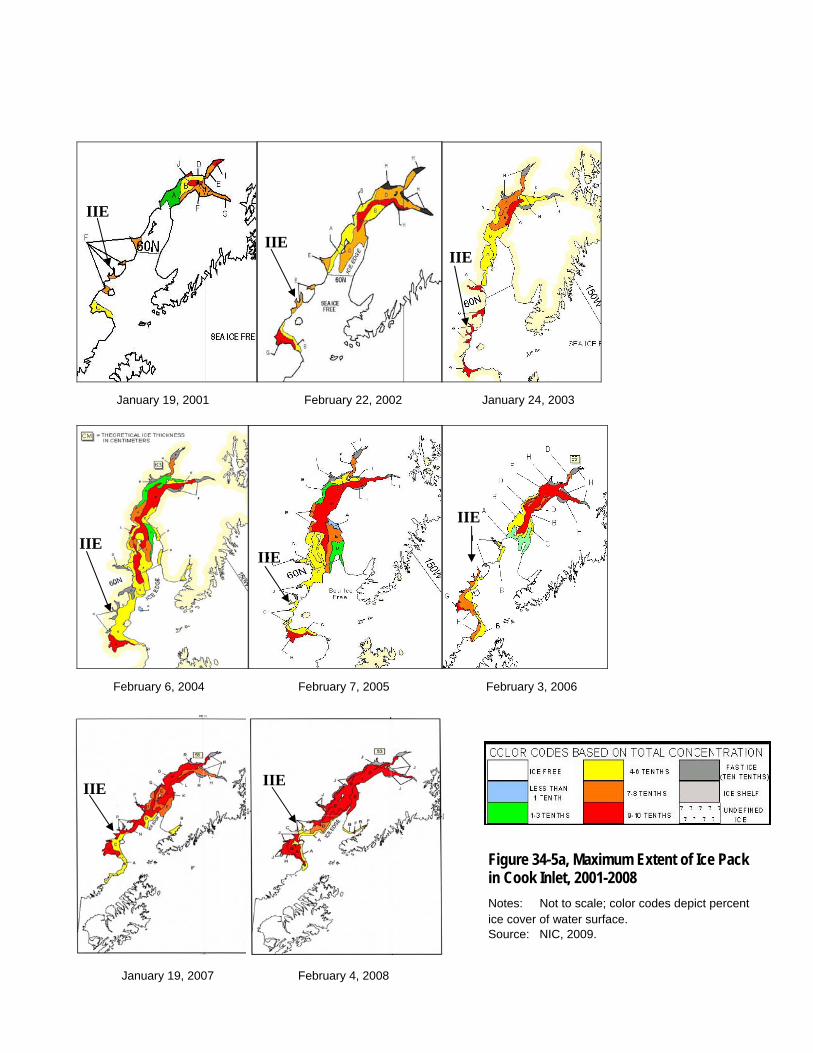
January 19, 2001 February 22, 2002 January 24, 2003
February 6, 2004 February 7, 2005 February 3, 2006
January 19, 2007 February 4, 2008
IIE
IIE IIE
IIE
IIE
Figure 34-5a, Maximum Extent of Ice Pack in Cook Inlet, 2001-2008
Notes: Not to scale; color codes depict percent ice cover of water surface. Source: NIC, 2009.
IIE
IIE IIE

January 2001 January 2002 January 2003
January 2004 January 2005 January 2006
January 2007 January 2008
IIE IIE
IIE
IIE IIE IIE
Figure 34-5b, Extent of Ice Pack in Cook Inlet, 1st Week of January 2001-2008
Notes: Not to scale; color codes depict percent ice cover of water surface. Source: NIC, 2009.
IIE: Iniskin/Iliamna Estuary
IIE IIE

February 2001 February 2002 February 2003
February 2004 February 2005 February 2006
February 2007 February 2008
IIE IIE
IIE
IIE IIE
IIE
Figure 34-5c, Extent of Ice Pack in Cook Inlet, 1st Week of February 2001-2008
Notes: Not to scale; color codes depict percent ice cover of water surface. Source: NIC, 2009.
IIE: Iniskin/Iliamna Estuary
IIE IIE
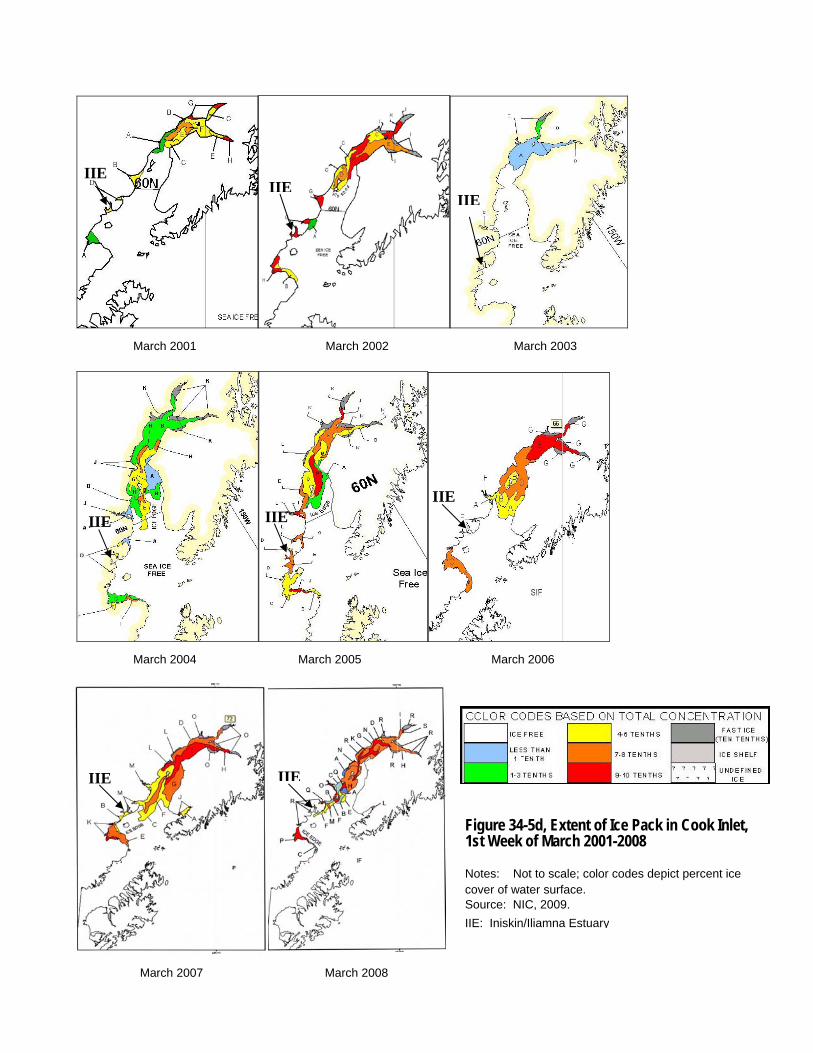
March 2001 March 2002 March 2003
March 2004 March 2005 March 2006
March 2007 March 2008
IIE IIE
IIE
IIE IIE IIE
Figure 34-5d, Extent of Ice Pack in Cook Inlet, 1st Week of March 2001-2008
Notes: Not to scale; color codes depict percent ice cover of water surface. Source: NIC, 2009.
IIE: Iniskin/Iliamna Estuary
IIE IIE

April 2001 April 2002 April 2003
April 2004 April 2005 April 2006
April 2007 April 2008
IIE IIE IIE
IIE IIE IIE
Figure 34-5e, Extent of Ice Pack in Cook Inlet, 1st Week of April 2001-2008
Notes: Not to scale; color codes depict percent ice cover of water surface. Source: NIC, 2009.
IIE: Iniskin/Iliamna Estuary
IIE IIE

OCEANOGRAPHY AND MARINE WATER QUALITY—COOK INLET DRAINAG
2
4
6
8
10
12
14
16
18
20
Tem
per
atu
re (
ºC)
2004
2005
2006
2007
2008
LegendYear
FIGURE 34-6Monthly Mean Marine Water Quality Temperatures in Iliamna and Iniskin Bays Combined, 2004-2008
0
Mar Apr May Jun Jul Aug Sep Oct Nov
Month

OCEANOGRAPHY AND MARINE WATER QUALITY—COOK INLET DRAINA
5
6
7
8
9
10
11
12
13
MTR2 n=11
MPS4 n=22
MTR1 n=11
MBS1 n=18
MPS3 n=11
MBSA1 n=19
MBS3 n=23
MPSE1 n=11
MPSE2 n=7
MPSE n=17
MBS4 n=15
Tem
per
atu
re (
ºC)
Temperature
Legend
FIGURE 34-7Mean Marine Water Temperatures in Iliamna Bay For Stations with Six or More Temperature Readings, 2004-2008
Notes: n = number of observations; ºC = degrees Celsius; example of station identification label: MTR2.
Station
Outer Iliamna Bay Inner Iliamna Bay

OCEANOGRAPHY AND MARINE WATER QUALITY—COOK INLET DRAINAGES
20
21
22
23
24
25
26
27
28
29
30S
alin
ity
(pp
t)
2004
2005
2006
2007
2008
Legend
Year
FIGURE 34-8Monthly Mean Marine Water Salinity in Iliamna and Iniskin Bays Combined, 2004-2008Note: ppt = parts per thousand.
Mar Apr May Jun Jul Aug Sep Oct Nov
Month
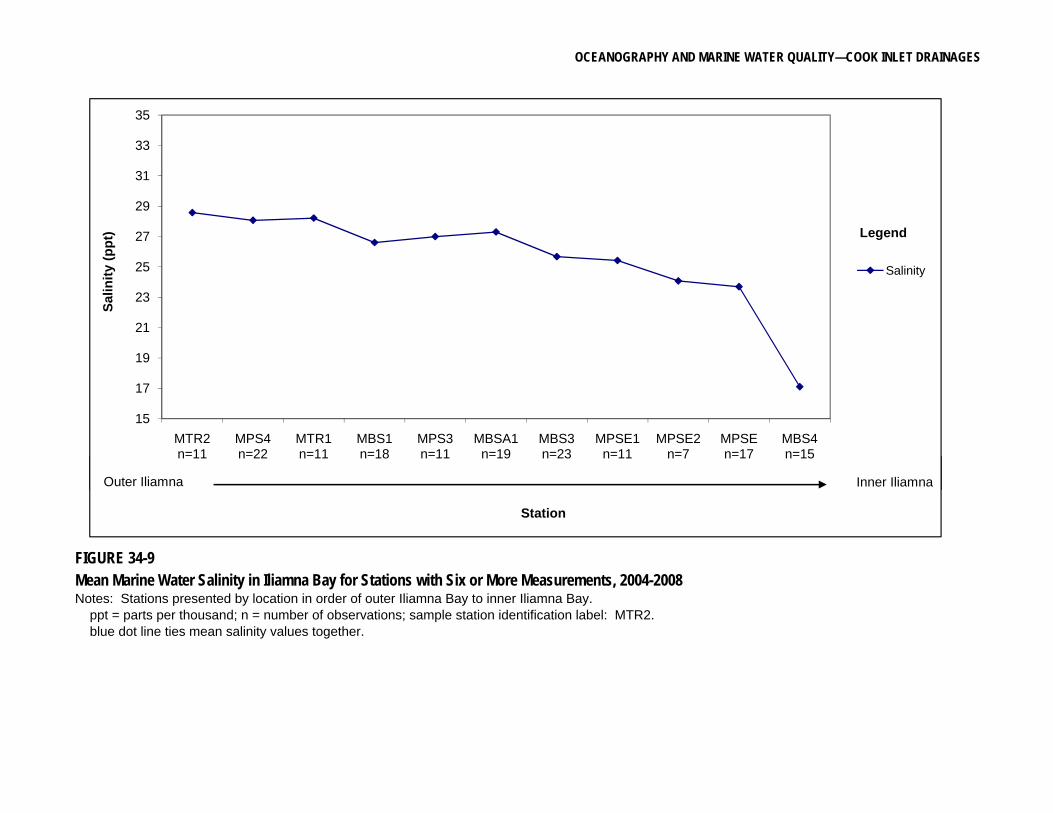
OCEANOGRAPHY AND MARINE WATER QUALITY—COOK INLET DRAINAGES
15
17
19
21
23
25
27
29
31
33
35
MTR2 n=11
MPS4 n=22
MTR1 n=11
MBS1 n=18
MPS3 n=11
MBSA1 n=19
MBS3 n=23
MPSE1 n=11
MPSE2 n=7
MPSE n=17
MBS4 n=15
Sal
init
y (p
pt)
Salinity
Outer Iliamna
Legend
Inner Iliamna
FIGURE 34-9Mean Marine Water Salinity in Iliamna Bay for Stations with Six or More Measurements, 2004-2008Notes: Stations presented by location in order of outer Iliamna Bay to inner Iliamna Bay. ppt = parts per thousand; n = number of observations; sample station identification label: MTR2. blue dot line ties mean salinity values together.
n 11 n 22 n 11 n 18 n 11 n 19 n 23 n 11 n 7 n 17 n 15
Outer Iliamna
Station
Inner Iliamna

OCEANOGRAPHY AND MARINE WATER QUALITY—COOK INLET DRAINAGES
0
10
20
30
40
50
60
70
80
M A M J J l A S O t N
Tu
rbid
ity
(NT
U)
2005
2006
2007
2008
Legend
Year
FIGURE 34-10a
Monthly Mean Marine Water Turbidity for Iliamna Bay, 2005-2008Note: NTU = nephelometric turbidity units.
Mar Apr May Jun Jul Aug Sep Oct Nov
Month

OCEANOGRAPHY AND MARINE WATER QUALITY—COOK INLET DRAINAGES
0
10
20
30
40
50
60
70
80T
urb
idit
y (N
TU
)
2005
2006
2007
2008
Legend
Year
FIGURE 34-10bMonthly Mean Marine Water Turbidity for Iniskin Bay, 2005-2008Note: NTU = nephelometric turbidity units.
0
Mar Apr May Jun Jul Aug Sep Oct Nov
Month

OCEANOGRAPHY AND MARINE WATER QUALITY—COOK INLET DRAINAGES
0
10
20
30
40
50
60
MTR2 n=10
MPS4 n=18
MTR1 n=9
MBS1 n=17
MPS3 n=10
MBSA1 n=17
MBS3 n=22
MPSE1 n=10
MPSE2 n=6
MPSE n=13
MBS4 n=15
Tu
rbid
ity
(NT
U)
Turbidity
Legend
FIGURE 34-11
Mean Marine WaterTurbidity in Iliamna Bay for Stations with Six or More Measurements, 2004-2008Notes: Stations presented by location in order of outer Iliamna Bay to inner Iliamna Bay. NTU = nephelometric turbidity units; n = number of observations; sample station identification label: MTR2.
Station
Outer Iliamna Bay Inner Iliamna Bay

OCEANOGRAPHY AND MARINE WATER QUALITY—COOK INLET DRAINAGES
0 5
1.0
1.5
2.0
2.5M
ean
-ad
just
ed c
on
cen
trat
ion
(u
nit
less
)
Aluminum
Antimony
Arsenic
Barium
Beryllium
Boron
Cadmium
Chromium
Cobalt
Copper
Iron
Lead
Manganese
Mercury
Nickel
Nitrogen, Ammonia (as N)
S l i
Legend
FIGURE 34-12Seasonal Variation in Inorganic Constituents in Marine Water, Iliamna and Iniskin Bays Combined, 2008
0.0
0.5
May-08 Jun-08 Jul-08 Sep-08
M
Month
Selenium
Silver
Thallium
Tin
Total Suspended Solids
Vanadium
Zinc

OCEANOGRAPHY AND MARINE WATER QUALITY—COOK INLET DRAINAGES
0.4
0.6
0.8
1.0
1.2
1.4
1.6M
ean
-ad
just
ed c
on
cen
trat
ion
Aluminum
Antimony
Arsenic
Barium
Beryllium
Boron
Cadmium
Chromium
Cobalt
Copper
Iron
Lead
Manganese
Mercury
Nickel
Nitrogen, Ammonia (as N)
Selenium
Legend
FIGURE 34-13Depth Variation in Inorganic Constituents in Marine Water, Iliamna and Iniskin Bays Combined, May, July, and September 2008Note: Lines included only as an aid to locate points; they have no quantitative meaning.
0.0
0.2
Surface Bottom
Depth
Silver
Thallium
Tin
Total Suspended Solids
Vanadium
Zinc

OCEANOGRAPHY AND MARINE WATER QUALITY—COOK INLET DRAINAGES
0.4
0.6
0.8
1.0
1.2
1.4
1.6M
ean
-ad
just
ed c
on
cen
trat
ion
Aluminum
Antimony
Arsenic
Barium
Beryllium
Boron
Cadmium
Chromium
Cobalt
Copper
Iron
Lead
Manganese
Mercury
Nickel
Nitrogen, Ammonia (as N)
Selenium
Legend
FIGURE 34-14Geographical Variation of Inorganic Constituents in Marine Water, Combined over Depth and Time, 2008Note: Lines included only as an aid to locate points; they have no quantitative meaning.
Sample station identification label: MPS4.
0.0
0.2
MPS4 MOPP1 MPS1
Station
Silver
Thallium
Tin
Total Suspended Solids
Vanadium
Zinc

OCEANOGRAPHY AND MARINE WATER QUALITY—COOK INLET DRAINAGES
0.4
0.6
0.8
1.0
1.2
1.4
1.6
1.8
2.0M
ean
-ad
just
ed c
on
cen
trat
ion
(u
nit
less
)
Aluminum
Antimony
Arsenic
Barium
Beryllium
Boron
Cadmium
Chromium
Cobalt
Copper
Iron
Lead
Manganese
Mercury
Nickel
Nitrogen, Ammonia (as N)
Selenium
Silver
Thallium
Legend
FIGURE 34-15Tidal Variation of Inorganic Constituents in Marine Water, Iliamna and Iniskin Bays Combined, May, July and September 2008
0.0
0.2
High Low
Tidal Elevation
Tin
Total Suspended Solids
Vanadium
Zinc

OCEANOGRAPHY AND MARINE WATER QUALITY—COOK INLET DRAINAGES
APPENDIX A
Laboratory Statement on Marine Surface Water Analyses

OCEANOGRAPHY AND MARINE WATER QUALITY—APPENDIX 34B
Appendix A
Laboratory Statement on Marine Surface Water Analyses

OCEANOGRAPHY AND MARINE WATER QUALITY—APPENDIX 34A

OCEANOGRAPHY AND MARINE WATER QUALITY—APPENDIX 34B

OCEANOGRAPHY AND MARINE WATER QUALITY—APPENDIX 34A

OCEANOGRAPHY AND MARINE WATER QUALITY—APPENDIX 34B
APPENDIX B
Laboratory Data Summary for Trace Elements in
Marine Water (2004, 2008)

2004-2008 Pebble Project Marine Study Ocean Water Laboratory Results Summary
Parameters
Total/DissolvedUnits
Sample Date05/28/08 56 0.025 150 25 0.5 0.5 1.45 1.43 4.8 4.3 0.01 0.01 2920 2960 0.06 0.0607/18/08 10 0.027 55 15 0.42 0.41 1.35 1.32 4.5 4.3 0.01 0.02105 3220 3280 0.055 0.0509/16/08 12 0.039 171 15 0.1 0.1 1.41 1.36 7.3 6.9 0.002 0.0005 2860 2880 0.051 0.047
26 0.030 125 18 0.34 0.34 1.40 1.37 5.5 5.2 0.007 0.011 3000 3040 0.06 0.05 12 0.027 150 15 0.42 0.41 1.41 1.36 4.8 4.3 0.01 0.01 2920 2960 0.055 0.05 26 0.008 62 6 0.21 0.21 0.05 0.06 1.5 1.5 0.005 0.010 193 212 0.00 0.01
0 3 0 0 0 3 3 3 3 3 3 3 3 3 3 3 0 0 3 3 3 3 10 0.025 55 15 0.1 0.1 1.35 1.32 4.5 4.3 0.002 0.0005 2860 2880 0.051 0.047 56 0.039 171 25 0.5 0.5 1.45 1.43 7.3 6.9 0.01 0.02105 3220 3280 0.06 0.06
33% 100% 67% 67% 67% 100%2 1 1 2 2 1
0.795 500 500 36 36 200 200 100 100 1200 1200 8.8 8.8
Sample Date05/28/08 60 0.025 163 51 0.5 0.2 1.53 1.48 5.3 4.1 0.01 0.01 2960 2930 0.06 0.05907/18/08 18 0.018 141 15 0.45 0.2 1.28 1.36 4.9 4.1 0.01 3250 3190 0.056 0.04909/16/08 19 0.020 274 15 0.1 0.1 1.49 1.45 8.6 6.9 0.003 0.0005 3020 3020 0.052 0.052
32 0.021 193 27 0.35 0.17 1.43 1.43 6.3 5.0 0.008 0.005 3077 3047 0.06 0.05 19 0.02 163 15 0.45 0.2 1.49 1.45 5.3 4.1 0.01 0.00525 3020 3020 0.056 0.052 24 0.004 71 21 0.22 0.06 0.13 0.06 2.0 1.6 0.004 0.007 153 132 0.00 0.01
0 3 0 0 0 3 3 3 3 3 3 3 3 3 3 2 0 0 3 3 3 3 18 0.018 141 15 0.1 0.1 1.28 1.36 4.9 4.1 0.003 0.0005 2960 2930 0.052 0.049 60 0.025 274 51 0.5 0.2 1.53 1.48 8.6 6.9 0.01 0.01 3250 3190 0.06 0.059
33% 67% 67% 100% 67% 100%2 1 1 2 1
0.795 500 500 36 36 200 200 100 100 1200 1200 8.8 8.8
Sample Date05/25/08 59 0.025 202 15 0.5 0.5 1.49 1.41 5.6 4.5 0.01 0.01 2880 2900 0.073 0.06807/14/08 13 0.004 101 38 0.2 0.2 1.29 1.22 4.2 4.4 0.0012 0.0002 3320 3340 0.054 0.05309/15/08 19 0.031 324 15 0.2 0.2 1.34 1.49 8.5 6.8 0.004 0.0005 3020 3030 0.056 0.052
30 0.020 209 23 0.30 0.30 1.37 1.37 6.1 5.2 0.005 0.004 3073 3090 0.06 0.06 19 0.025 202 15 0.2 0.2 1.34 1.41 5.6 4.5 0.004 0.0005 3020 3030 0.056 0.053 25 0.014 112 13 0.17 0.17 0.10 0.14 2.2 1.4 0.004 0.006 225 226 0.01 0.01
0 3 0 0 0 3 3 3 3 3 3 3 3 3 3 3 0 0 3 3 3 3 13 0.004 101 15 0.2 0.2 1.29 1.22 4.2 4.4 0.0012 0.0002 2880 2900 0.054 0.052 59 0.031 324 38 0.5 0.5 1.49 1.49 8.5 6.8 0.01 0.01 3320 3340 0.073 0.068
67% 67% 67% 67% 33% 100%1 1 1 1 1 2 2
0.795 500 500 36 36 200 200 100 100 1200 1200 8.8 8.8
% of values undetected# of values between MDL and MRL
MeanMedian
St. Deviation# of values
Hardness
Total Suspended
Solids
Minimum
Total Dissolvedμg/L μg/L μg/L μg/L
Chloride
Station: MOPP1Sample A: Surface
Maximum
Bismuth Boron CadmiumSulfateTotal
CyanideTotal
Ammonia Aluminum Antimony Arsenic Barium BerylliumTotal Dissolved Total Dissolved Total Dissolved Total DissolvedDissolvedTotal Dissolved Total Dissolved Total
mg/L mg/L mg/L mg/L mg/L mg/L μg/L μg/L μg/L μg/Lμg/L μg/L μg/L μg/L μg/L μg/L μg/L μg/L
% of values undetected# of values between MDL and MRL
Station: MOPP1Sample C: Near Bottom
MeanMedian
St. Deviation
Maximum
% of values undetected
NOAA SQuiRT Criteria Limit
# of valuesMinimum
NOAA SQuiRT Criteria Limit
# of values between MDL and MRL
Station: MPS1Sample A: Surface
MeanMedian
St. Deviation# of values
Minimum
NOAA SQuiRT Criteria Limit
Maximum
Page 1 of 12

2004-2008 Pebble Project Marine Study Ocean Water Laboratory Results Summary
Parameters
Total/DissolvedUnits
Sample Date05/28/0807/18/0809/16/08
Sample Date05/28/0807/18/0809/16/08
Sample Date05/25/0807/14/0809/15/08
% of values undetected# of values between MDL and MRL
MeanMedian
St. Deviation# of values
Minimum
Station: MOPP1Sample A: Surface
Maximum
% of values undetected# of values between MDL and MRL
Station: MOPP1Sample C: Near Bottom
MeanMedian
St. Deviation
Maximum
% of values undetected
NOAA SQuiRT Criteria Limit
# of valuesMinimum
NOAA SQuiRT Criteria Limit
# of values between MDL and MRL
Station: MPS1Sample A: Surface
MeanMedian
St. Deviation# of values
Minimum
NOAA SQuiRT Criteria Limit
Maximum
0.4 0.1 0.11 0.043 0.96 0.49 207 35.6 0.222 0.073 8.8 5.3 0.00104 0.68 0.550.3 0.21 0.075 0.021 1.06 0.69 122 31.7 0.221 0.086 6.3 2.1 0.0005 0.61 0.49
0.37 0.22 0.162 0.067 1.01 0.666 263 35.3 0.279 0.068 8.4 3.3 0.0005 0.65 0.48 0.36 0.18 0.116 0.044 1.01 0.62 197 34 0.241 0.076 7.8 3.6 0.00068 0.65 0.51 0.37 0.21 0.11 0.043 1.01 0.666 207 35.3 0.222 0.073 8.4 3.3 0.0005 0.65 0.49 0.05 0.07 0.044 0.023 0.05 0.11 71 2 0.033 0.009 1.3 1.6 0.00031 0.04 0.04
0 0 3 3 3 3 3 3 3 3 3 3 0 0 3 3 3 0 0 3 30.3 0.1 0.075 0.021 0.96 0.49 122 31.7 0.221 0.068 6.3 2.1 0.0005 0.61 0.480.4 0.22 0.162 0.067 1.06 0.69 263 35.6 0.279 0.086 8.8 5.3 0.00104 0.68 0.55
67% 33% 67%2
50 50 1 1 3.1 3.1 50 50 8.1 8.1 100 100 0.94 8.2 8.2
0.32 0.1 0.108 0.035 1.1 0.56 204 36.5 0.41 0.095 6.8 2.5 0.0005 0.87 0.50.21 0.1 0.073 0.051 1 0.73 221 34.4 0.174 0.05 8.2 1.9 0.0005 0.49 0.580.41 0.27 0.195 0.043 1.19 0.658 442 34.4 0.124 0.026 11 1.1 0.0005 0.77 0.52
0.31 0.16 0.125 0.043 1.10 0.65 289 35 0.236 0.057 8.7 1.8 0.00050 0.71 0.53 0.32 0.1 0.108 0.043 1.1 0.658 221 34.4 0.174 0.05 8.2 1.9 0.0005 0.77 0.52 0.10 0.10 0.063 0.008 0.10 0.09 133 1 0.153 0.035 2.1 0.7 0.00000 0.20 0.04
0 0 3 3 3 3 3 3 3 3 3 3 0 0 3 3 3 0 0 3 30.21 0.1 0.073 0.035 1 0.56 204 34.4 0.124 0.026 6.8 1.1 0.0005 0.49 0.50.41 0.27 0.195 0.051 1.19 0.73 442 36.5 0.41 0.095 11 2.5 0.0005 0.87 0.58
67% 33% 100%2
50 50 1 1 3.1 3.1 50 50 8.1 8.1 100 100 0.94 8.2 8.2
0.42 0.1 0.165 0.062 1.45 0.86 311 39.1 0.58 0.203 13 7.1 0.00265 0.76 0.590.24 0.1 0.127 0.084 0.82 0.48 158 37.8 0.364 0.081 16 11 0.0005 0.57 0.490.78 0.238 0.052 1.33 0.765 501 43.5 0.227 0.045 12 1.5 0.0005 0.92 0.670.48 0.10 0.177 0.066 1.20 0.70 323 40 0.390 0.110 13.7 6.5 0.00122 0.75 0.580.42 0.1 0.165 0.062 1.33 0.765 311 39.1 0.364 0.081 13 7.1 0.0005 0.76 0.590.27 0.00 0.056 0.016 0.33 0.20 172 3 0.178 0.083 2.1 4.8 0.00124 0.18 0.09
0 0 3 2 3 3 3 3 3 3 3 3 0 0 3 3 3 0 0 3 30.24 0.1 0.127 0.052 0.82 0.48 158 37.8 0.227 0.045 12 1.5 0.0005 0.57 0.490.78 0.1 0.238 0.084 1.45 0.86 501 43.5 0.58 0.203 16 11 0.00265 0.92 0.67
100% 67%1
50 50 1 1 3.1 3.1 50 50 8.1 8.1 100 100 0.94 8.2 8.2
Calcium Chromium Cobalt Copper Mercury MolybdenumIron LeadTotal Dissolved Total Dissolved Total Dissolved Total
Magnesium Manganese NickelDissolvedDissolved DissolvedTotal Dissolved Total Dissolved TotalTotal Dissolved Total Total Dissolved Total
μg/L μg/L μg/Lμg/L μg/Lμg/L μg/L μg/L μg/L μg/L μg/L μg/Lμg/L μg/L μg/L μg/Lμg/L μg/L μg/L μg/L μg/L
Page 2 of 12

2004-2008 Pebble Project Marine Study Ocean Water Laboratory Results Summary
Parameters
Total/DissolvedUnits
Sample Date05/28/0807/18/0809/16/08
Sample Date05/28/0807/18/0809/16/08
Sample Date05/25/0807/14/0809/15/08
% of values undetected# of values between MDL and MRL
MeanMedian
St. Deviation# of values
Minimum
Station: MOPP1Sample A: Surface
Maximum
% of values undetected# of values between MDL and MRL
Station: MOPP1Sample C: Near Bottom
MeanMedian
St. Deviation
Maximum
% of values undetected
NOAA SQuiRT Criteria Limit
# of valuesMinimum
NOAA SQuiRT Criteria Limit
# of values between MDL and MRL
Station: MPS1Sample A: Surface
MeanMedian
St. Deviation# of values
Minimum
NOAA SQuiRT Criteria Limit
Maximum
0.1 0.1 0.01 0.01 0.01 0.01 0.3 0.3 3 3 1.64 1.380.007 0.005 0.0209 0.02105 0.3 0.3 3 3 1.73 1.75
0.1 0.1 0.006 0.002 0.012 0.01 0.07 0.07 3 8 2.12 1.08 0.1 0.1 0.008 0.006 0.014 0.014 0.22 0.22 3 4.7 1.83 1.40 0.1 0.1 0.007 0.005 0.012 0.01 0.3 0.3 3 3 1.73 1.38 0 0 0.002 0.004 0.006 0.006 0.13 0.13 0 2.9 0.26 0.34
0 0 2 2 0 3 3 0 0 3 3 3 3 3 3 3 3 0.1 0.1 0.006 0.002 0.01 0.01 0.07 0.07 3 3 1.64 1.08 0.1 0.1 0.01 0.01 0.0209 0.02105 0.3 0.3 3 8 2.12 1.75
100% 100% 33% 67% 33% 100% 100% 100% 100% 67%2 1 1 1
71 71 0.95 0.95 17 17 50 50 81 81
0.5 0.1 0.01 0.01 0.01 0.01 0.3 0.3 3 3 1.6 2.070.0005 0.002 0.01 0.01015 0.3 0.3 3 3 1.48 1.26
0.1 0.1 0.006 0.01 0.014 0.01 0.07 0.07 10.8 3 6.62 0.92 0.30 0.1 0.006 0.007 0.011 0.010 0.22 0.22 5.6 3.0 3.23 1.42 0.3 0.1 0.006 0.01 0.01 0.01 0.3 0.3 3 3 1.6 1.26 0.28 0 0.005 0.005 0.002 0.000 0.13 0.13 4.5 0.0 2.93 0.59
0 0 2 2 0 3 3 0 0 3 3 3 3 3 3 3 3 0.1 0.1 0.0005 0.002 0.01 0.01 0.07 0.07 3 3 1.48 0.92 0.5 0.1 0.01 0.01 0.014 0.01015 0.3 0.3 10.8 3 6.62 2.07
100% 100% 67% 67% 67% 100% 100% 100% 67% 100%1 1 1
71 71 0.95 0.95 17 17 50 50 81 81
0.1 0.1 0.01 0.01 0.01 0.01 0.3 0.3 3 3 4.6 3.620.0005 0.0005 0.0109 0.0094 0.3 0.3 3 3 1.97 1.77
0.1 0.1 0.007 0.01 0.017 0.01 0.07 0.07 3 3 2.73 1.59 0.10 0.1 0.006 0.007 0.013 0.010 0.22 0.22 3 3.0 3.10 2.33 0.1 0.1 0.007 0.01 0.0109 0.01 0.3 0.3 3 3 2.73 1.77 0.00 0 0.005 0.005 0.004 0.000 0.13 0.13 0.0 0.0 1.35 1.12
0 0 2 2 0 3 3 0 0 3 3 3 3 3 3 3 3 0.1 0.1 0.0005 0.0005 0.01 0.0094 0.07 0.07 3 3 1.97 1.59 0.1 0.1 0.01 0.01 0.017 0.01 0.3 0.3 3 3 4.6 3.62
100% 100% 67% 100% 33% 67% 100% 100% 100% 100%1 2 1
71 71 0.95 0.95 17 17 50 50 81 81
Vanadium ZincThallium TinSelenium Silicon Silver SodiumPotassiumDissolved TotalTotalTotal Dissolved Total Dissolved Dissolved Dissolved Total DissolvedDissolved Total Dissolved Total DissolvedTotal
μg/Lμg/L μg/L μg/L μg/Lμg/L μg/L μg/L μg/L μg/L μg/L μg/L μg/L μg/L μg/Lμg/L μg/L
Page 3 of 12

2004-2008 Pebble Project Marine Study Ocean Water Laboratory Results Summary
Parameters
Total/DissolvedUnits
Hardness
Total Suspended
SolidsTotal Dissolved
μg/L μg/L μg/L μg/L
Chloride Bismuth Boron CadmiumSulfateTotal
CyanideTotal
Ammonia Aluminum Antimony Arsenic Barium BerylliumTotal Dissolved Total Dissolved Total Dissolved Total DissolvedDissolvedTotal Dissolved Total Dissolved Total
mg/L mg/L mg/L mg/L mg/L mg/L μg/L μg/L μg/L μg/Lμg/L μg/L μg/L μg/L μg/L μg/L μg/L μg/L
Sample Date08/31/04 4300 29.6 18700 4110 0.00125 0.05 312 312 3.08 3.08 11.2 13.5 0.6 0.6 60 60 3230 3660 1.24 1.2405/25/08 64 0.025 369 25 0.5 0.5 1.65 1.46 6.7 3.5 0.01 0.01 2950 2940 0.0807/14/08 18 0.004 151 0.2 1.32 1.23 4.9 0.0022 0.00025 3400 0.056 0.04909/15/08 18 0.023 304 35 0.1 0.1 1.46 1.5 8.8 7 0.005 0.01 3020 3000 0.053 0.052
4300 32 18700 4110 0.00125 0.026 284 124 0.97 1.23 1.48 1.40 7.9 8.0 0.154 0.155 60 60 3150 3200 0.36 0.454300 23.8 18700 4110 0.00125 0.024 308 35 0.35 0.5 1.46 1.46 7.75 7 0.0075 0.01 60 60 3125 3000 0.068 0.052
NA 22 NA NA NA 0.019 93 163 1.42 1.62 0.17 0.15 2.7 5.1 0.297 0.297 NA NA 205 399 0.59 0.691 4 1 1 1 4 4 3 4 3 3 3 4 3 4 4 1 1 4 3 4 3
4300 18 18700 4110 0.00125 0.004 151 25 0.1 0.1 1.32 1.23 4.9 3.5 0.0022 0.00025 60 60 2950 2940 0.053 0.0494300 64 18700 4110 0.00125 0.05 369 312 3.08 3.08 1.65 1.5 11.2 13.5 0.6 0.6 60 60 3400 3660 1.24 1.24
100% 75% 25% 67% 100% 100% 50% 100% 100% 100% 25% 33%1 1 2 2 2
0.795 500 500 36 36 200 200 100 100 1200 1200 8.8 8.8
Sample Date09/15/08 22 0.049 532 15 0.1 0.1 1.4 1.35 9.1 6.1 0.01 0.01 2770 2750 0.049 0.048
0.795 500 500 36 36 200 200 100 100 1200 1200 8.8 8.8
Sample Date09/15/08 39 0.028 814 15 0.1 0.1 1.53 1.46 11.5 6.9 0.011 0.0005 3000 3000 0.052 0.051
0.795 500 500 36 36 200 200 100 100 1200 1200 8.8 8.8
Sample Date09/01/04 4810 89 16900 2450 0.00125 0.0155 1280 312 3.08 3.08 22 12.3 0.6 0.6 60 60 3650 3490 1.24 1.24
0.795 500 500 36 36 200 200 100 100 1200 1200 8.8 8.8
Sample Date09/01/04 4780 21.8 18400 3450 0.00125 0.05 312 312 3.08 3.08 14.1 11.3 0.6 0.6 60 60 3370 3830 1.24 1.24
0.795 500 500 36 36 200 200 100 100 1200 1200 8.8 8.8
Sample Date05/26/08 54 0.025 210 25 0.5 0.5 1.49 1.41 5.6 4.1 0.01 0.01 2870 2870 0.063 0.07607/13/08 23 0.004 252 32 0.2 0.2 1.36 1.22 5.4 4.7 0.0051 0.0006 3230 3310 0.053 0.04709/16/08 13 0.029 232 15 0.2 0.1 1.44 1.5 7.9 7.4 0.003 0.0005 2910 2940 0.05 0.048
30 0.019 231 24 0.30 0.27 1.43 1.38 6.3 5.4 0.006 0.004 3003 3040 0.06 0.06 23 0.025 232 25 0.2 0.2 1.44 1.41 5.6 4.7 0.0051 0.0006 2910 2940 0.053 0.048 21 0.013 21 9 0.17 0.21 0.07 0.14 1.4 1.8 0.004 0.005 197 236 0.01 0.02
Station: MPS1Sample C: Near Bottom
MeanMedian
St. Deviation
Station: MPS1Sample C: Near BottomTide: Low
Station: MPS1Sample A: SurfaceTide: Low
Maximum% of values undetected
# of values between MDL and MRL
# of valuesMinimum
NOAA SQuiRT Criteria Limit
NOAA SQuiRT Criteria Limit
NOAA SQuiRT Criteria Limit
NOAA SQuiRT Criteria Limit
NOAA SQuiRT Criteria Limit
Station: MPS3Sample C: Near Bottom
Station: MPS2Sample C: Near Bottom
Station: MPS4Sample A: Surface
MeanMedian
St. Deviation
Page 4 of 12

2004-2008 Pebble Project Marine Study Ocean Water Laboratory Results Summary
Parameters
Total/DissolvedUnits
Sample Date08/31/0405/25/0807/14/0809/15/08
Sample Date09/15/08
Sample Date09/15/08
Sample Date09/01/04
Sample Date09/01/04
Sample Date05/26/0807/13/0809/16/08
Station: MPS1Sample C: Near Bottom
MeanMedian
St. Deviation
Station: MPS1Sample C: Near BottomTide: Low
Station: MPS1Sample A: SurfaceTide: Low
Maximum% of values undetected
# of values between MDL and MRL
# of valuesMinimum
NOAA SQuiRT Criteria Limit
NOAA SQuiRT Criteria Limit
NOAA SQuiRT Criteria Limit
NOAA SQuiRT Criteria Limit
NOAA SQuiRT Criteria Limit
Station: MPS3Sample C: Near Bottom
Station: MPS2Sample C: Near Bottom
Station: MPS4Sample A: Surface
MeanMedian
St. Deviation
Calcium Chromium Cobalt Copper Mercury MolybdenumIron LeadTotal Dissolved Total Dissolved Total Dissolved Total
Magnesium Manganese NickelDissolvedDissolved DissolvedTotal Dissolved Total Dissolved TotalTotal Dissolved Total Total Dissolved Total
μg/L μg/L μg/Lμg/L μg/Lμg/L μg/L μg/L μg/L μg/L μg/L μg/Lμg/L μg/L μg/L μg/Lμg/L μg/L μg/L μg/L μg/L
249000 273000 4 4 1.24 1.24 248 248 4 4 893000 1070000 20 20 0.0005 12.4 12.40.61 0.1 0.228 0.04 1.19 0.5 543 36.7 0.382 0.13 13 2.5 0.00153 0.88 0.540.32 0.115 0.118 0.046 0.85 0.51 208 0.1 0.0115 11 0.0005 1.28 0.410.53 0.27 0.202 0.041 1.19 0.596 443 30.6 0.148 11 1 0.0005 0.77 0.6
249000 273000 1.37 1.12 0.447 0.342 1.08 0.54 361 105 1.158 1.381 893000 1070000 13.8 7.8 0.00076 12.4 12.4 0.98 0.52249000 273000 0.57 0.1925 0.215 0.0435 1.19 0.51 345.5 36.7 0.265 0.13 893000 1070000 12 2.5 0.0005 12.4 12.4 0.88 0.54
NA NA 1.76 1.92 0.531 0.599 0.20 0.05 159 124 1.899 2.269 NA NA 4.3 10.6 0.00052 NA NA 0.27 0.101 1 4 4 4 4 3 3 4 3 4 3 1 1 4 3 4 1 1 3 3
249000 273000 0.32 0.1 0.118 0.04 0.85 0.5 208 30.6 0.1 0.0115 893000 1070000 11 1 0.0005 12.4 12.4 0.77 0.41249000 273000 4 4 1.24 1.24 1.19 0.596 543 248 4 4 893000 1070000 20 20 0.00153 12.4 12.4 1.28 0.6
25% 75% 25% 25% 25% 33% 25% 67% 25% 67% 75% 100% 100%1
50 50 1 1 3.1 3.1 50 50 8.1 8.1 100 100 0.94 8.2 8.2
0.81 0.22 0.412 0.119 1.56 0.569 857 41.1 0.286 0.027 26 7 0.00145 1.08 0.5550 50 1 1 3.1 3.1 50 50 8.1 8.1 100 100 0.94 8.2 8.2
1.01 0.25 0.498 0.05 2.08 0.591 1290 32.9 0.32 0.026 32 1.2 0.00347 1.32 0.5450 50 1 1 3.1 3.1 50 50 8.1 8.1 100 100 0.94 8.2 8.2
260000 260000 4 4 2.82 1.24 2220 248 4 4 1010000 1020000 47.1 20 0.0012 12.4 12.450 50 1 1 3.1 3.1 50 50 8.1 8.1 100 100 0.94 8.2 8.2
267000 266000 4 4 1.24 1.24 498 248 4 4 999000 1040000 20 20 0.0073 12.4 12.450 50 1 1 3.1 3.1 50 50 8.1 8.1 100 100 0.94 8.2 8.2
0.5 0.1 0.17 0.077 2.01 1.17 313 39.7 2.06 0.558 12 6.7 0.00122 0.78 0.570.39 0.1 0.231 0.106 1.19 368 37.9 0.279 0.101 26 14 0.0005 0.77 0.470.55 0.34 0.178 0.064 1.12 0.664 391 43.6 0.134 0.028 11 2.7 0.0005 0.74 0.840.48 0.18 0.193 0.082 1.44 0.92 357 40 0.824 0.229 16.3 7.8 0.00074 0.76 0.63
0.5 0.1 0.178 0.077 1.19 0.917 368 39.7 0.279 0.101 12 6.7 0.0005 0.77 0.570.08 0.14 0.033 0.022 0.49 0.36 40 3 1.073 0.287 8.4 5.7 0.00042 0.02 0.19
Page 5 of 12

2004-2008 Pebble Project Marine Study Ocean Water Laboratory Results Summary
Parameters
Total/DissolvedUnits
Sample Date08/31/0405/25/0807/14/0809/15/08
Sample Date09/15/08
Sample Date09/15/08
Sample Date09/01/04
Sample Date09/01/04
Sample Date05/26/0807/13/0809/16/08
Station: MPS1Sample C: Near Bottom
MeanMedian
St. Deviation
Station: MPS1Sample C: Near BottomTide: Low
Station: MPS1Sample A: SurfaceTide: Low
Maximum% of values undetected
# of values between MDL and MRL
# of valuesMinimum
NOAA SQuiRT Criteria Limit
NOAA SQuiRT Criteria Limit
NOAA SQuiRT Criteria Limit
NOAA SQuiRT Criteria Limit
NOAA SQuiRT Criteria Limit
Station: MPS3Sample C: Near Bottom
Station: MPS2Sample C: Near Bottom
Station: MPS4Sample A: Surface
MeanMedian
St. Deviation
Vanadium ZincThallium TinSelenium Silicon Silver SodiumPotassiumDissolved TotalTotalTotal Dissolved Total Dissolved Dissolved Dissolved Total DissolvedDissolved Total Dissolved Total DissolvedTotal
μg/Lμg/L μg/L μg/L μg/Lμg/L μg/L μg/L μg/L μg/L μg/L μg/L μg/L μg/L μg/Lμg/L μg/L
243000 269000 750 0.248 0.248 7520000 8820000 1 1 12.4 12.4 10 10 18.8 18.80.1 0.1 0.01 0.01 0.01 0.01 0.3 0.3 3 3 3.79 2.85
0.003 0.0005 0.0133 0.0122 0.3 3 1.23 0.810.1 0.1 0.008 0.01 0.014 0.01 0.07 0.07 3 3 2.16
243000 269000 0.10 0.1 750 0.067 0.067 7520000 8820000 0.259 0.258 3.27 4.26 4.75 5.3 6.50 7.49243000 269000 0.1 0.1 750 0.009 0.01 7520000 8820000 0.01365 0.0111 0.3 0.3 3 3 2.975 2.85
NA NA 0.00 0 NA 0.121 0.121 NA NA 0.494 0.495 6.09 7.05 3.5 4.0 8.27 9.851 1 2 2 1 4 4 1 1 4 4 4 3 4 3 4 3
243000 269000 0.1 0.1 750 0.003 0.0005 7520000 8820000 0.01 0.01 0.07 0.07 3 3 1.23 0.81243000 269000 0.1 0.1 750 0.248 0.248 7520000 8820000 1 1 12.4 12.4 10 10 18.8 18.8
100% 100% 100% 50% 100% 50% 75% 100% 100% 100% 100% 25% 33%2 2 1
71 71 0.95 0.95 17 17 50 50 81 81
6.1 0.1 0.009 0.01 0.019 0.01 0.07 0.07 3 6.8 2.59 1.0871 71 0.95 0.95 17 17 50 50 81 81
0.1 0.1 0.009 0.002 0.023 0.01 0.07 0.07 3 7.2 3.4 0.6771 71 0.95 0.95 17 17 50 50 81 81
259000 259000 750 0.248 0.248 8610000 8370000 1 1 12.4 12.4 10 10 18.8 18.871 71 0.95 0.95 17 17 50 50 81 81
262000 266000 750 0.248 0.248 8290000 8840000 1 3.74 12.4 12.4 10 10 18.8 18.871 71 0.95 0.95 17 17 50 50 81 81
0.1 0.1 0.01 0.01 0.01 0.01 0.3 0.3 3 3 4.12 3.50.002 0.0005 0.0117 0.0095 0.3 0.3 3 3 1.61
0.1 0.1 0.008 0.01 0.015 0.01 0.07 0.07 3 3 1.32 0.10 0.1 0.007 0.007 0.012 0.010 0.22 0.22 3 3.0 2.35 3.50 0.1 0.1 0.008 0.01 0.0117 0.01 0.3 0.3 3 3 1.61 3.5 0.00 0 0.004 0.005 0.003 0.000 0.13 0.13 0.0 0.0 1.54 NA
Page 6 of 12

2004-2008 Pebble Project Marine Study Ocean Water Laboratory Results Summary
Parameters
Total/DissolvedUnits
Hardness
Total Suspended
SolidsTotal Dissolved
μg/L μg/L μg/L μg/L
Chloride Bismuth Boron CadmiumSulfateTotal
CyanideTotal
Ammonia Aluminum Antimony Arsenic Barium BerylliumTotal Dissolved Total Dissolved Total Dissolved Total DissolvedDissolvedTotal Dissolved Total Dissolved Total
mg/L mg/L mg/L mg/L mg/L mg/L μg/L μg/L μg/L μg/Lμg/L μg/L μg/L μg/L μg/L μg/L μg/L μg/L0 3 0 0 0 3 3 3 3 3 3 3 3 3 3 3 0 0 3 3 3 3 13 0.004 210 15 0.2 0.1 1.36 1.22 5.4 4.1 0.003 0.0005 2870 2870 0.05 0.047 54 0.029 252 32 0.5 0.5 1.49 1.5 7.9 7.4 0.01 0.01 3230 3310 0.063 0.076
67% 67% 67% 100% 33% 67%1 1 1 2 2 1
0.795 500 500 36 36 200 200 100 100 1200 1200 8.8 8.8NOAA SQuiRT Criteria Limit
Maximum% of values undetected
# of values between MDL and MRL
# of valuesMinimum
Page 7 of 12

2004-2008 Pebble Project Marine Study Ocean Water Laboratory Results Summary
Parameters
Total/DissolvedUnits
NOAA SQuiRT Criteria Limit
Maximum% of values undetected
# of values between MDL and MRL
# of valuesMinimum
Calcium Chromium Cobalt Copper Mercury MolybdenumIron LeadTotal Dissolved Total Dissolved Total Dissolved Total
Magnesium Manganese NickelDissolvedDissolved DissolvedTotal Dissolved Total Dissolved TotalTotal Dissolved Total Total Dissolved Total
μg/L μg/L μg/Lμg/L μg/Lμg/L μg/L μg/L μg/L μg/L μg/L μg/Lμg/L μg/L μg/L μg/Lμg/L μg/L μg/L μg/L μg/L0 0 3 3 3 3 3 2 3 3 3 3 0 0 3 3 3 0 0 3 3
0.39 0.1 0.17 0.064 1.12 0.664 313 37.9 0.134 0.028 11 2.7 0.0005 0.74 0.470.55 0.34 0.231 0.106 2.01 1.17 391 43.6 2.06 0.558 26 14 0.00122 0.78 0.84
67% 67%1
50 50 1 1 3.1 3.1 50 50 8.1 8.1 100 100 0.94 8.2 8.2
Page 8 of 12

2004-2008 Pebble Project Marine Study Ocean Water Laboratory Results Summary
Parameters
Total/DissolvedUnits
NOAA SQuiRT Criteria Limit
Maximum% of values undetected
# of values between MDL and MRL
# of valuesMinimum
Vanadium ZincThallium TinSelenium Silicon Silver SodiumPotassiumDissolved TotalTotalTotal Dissolved Total Dissolved Dissolved Dissolved Total DissolvedDissolved Total Dissolved Total DissolvedTotal
μg/Lμg/L μg/L μg/L μg/Lμg/L μg/L μg/L μg/L μg/L μg/L μg/L μg/L μg/L μg/Lμg/L μg/L0 0 2 2 0 3 3 0 0 3 3 3 3 3 3 3 1 0.1 0.1 0.002 0.0005 0.01 0.0095 0.07 0.07 3 3 1.32 3.5 0.1 0.1 0.01 0.01 0.015 0.01 0.3 0.3 3 3 4.12 3.5
100% 100% 33% 100% 33% 67% 100% 100% 100% 100%2 2 1
71 71 0.95 0.95 17 17 50 50 81 81
Page 9 of 12
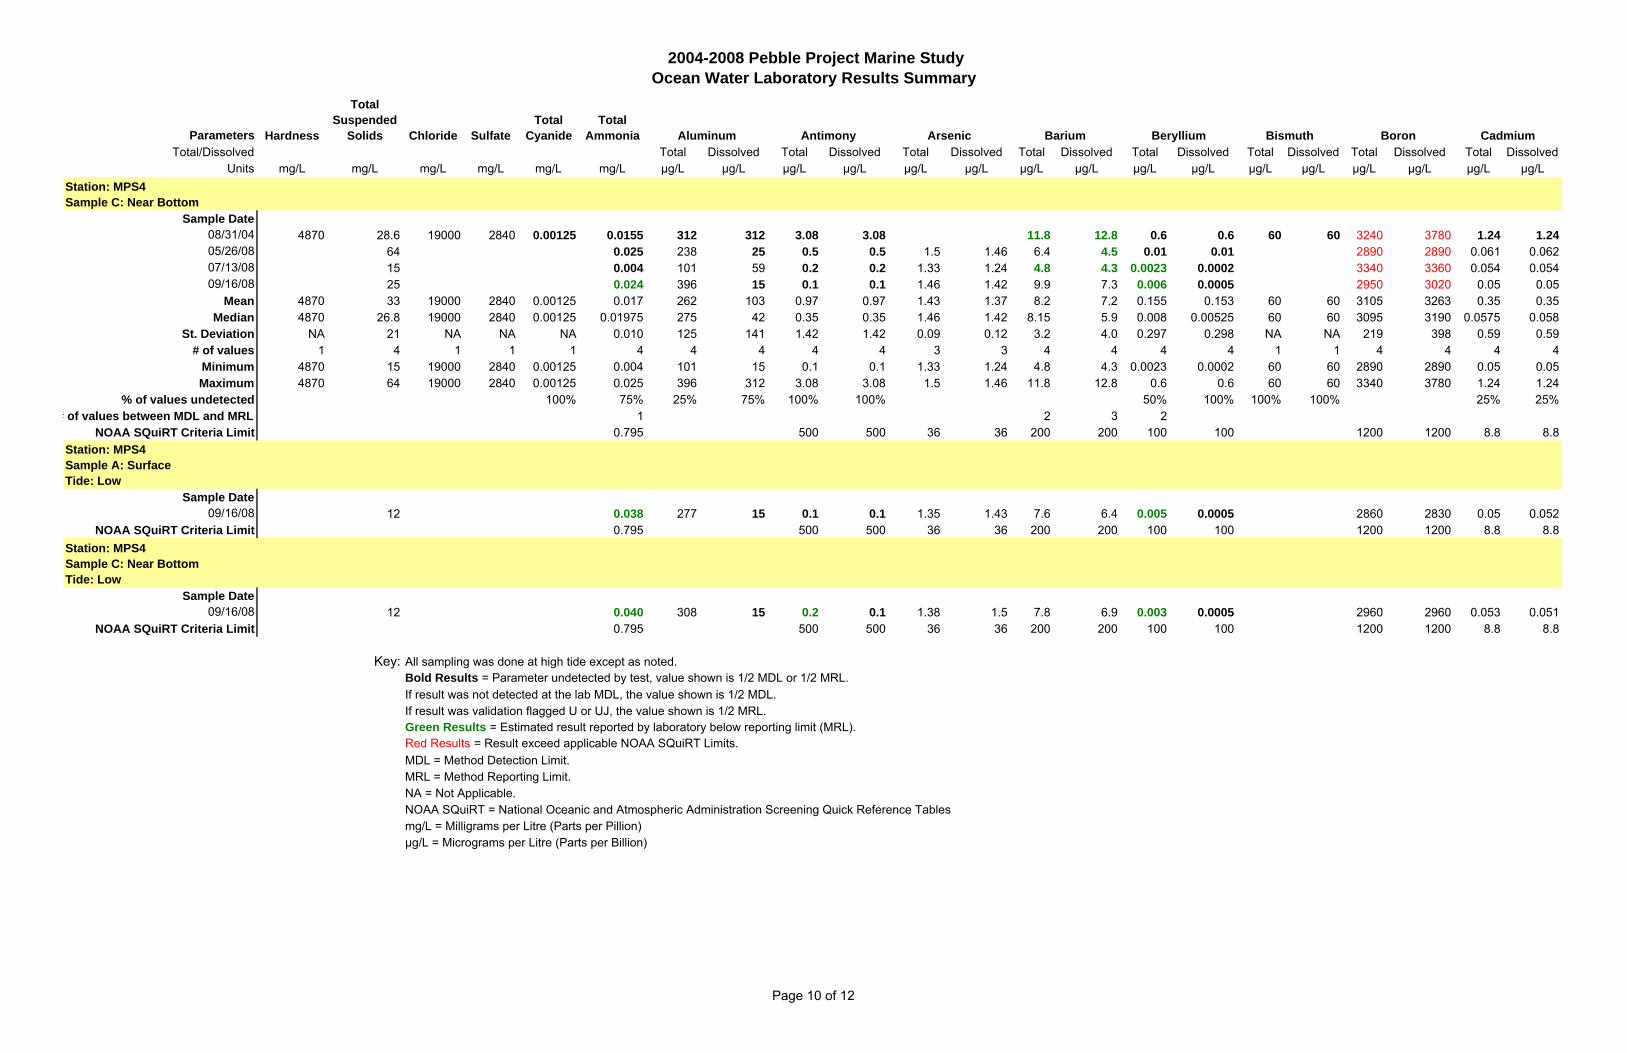
2004-2008 Pebble Project Marine Study Ocean Water Laboratory Results Summary
Parameters
Total/DissolvedUnits
Hardness
Total Suspended
SolidsTotal Dissolved
μg/L μg/L μg/L μg/L
Chloride Bismuth Boron CadmiumSulfateTotal
CyanideTotal
Ammonia Aluminum Antimony Arsenic Barium BerylliumTotal Dissolved Total Dissolved Total Dissolved Total DissolvedDissolvedTotal Dissolved Total Dissolved Total
mg/L mg/L mg/L mg/L mg/L mg/L μg/L μg/L μg/L μg/Lμg/L μg/L μg/L μg/L μg/L μg/L μg/L μg/L
Sample Date08/31/04 4870 28.6 19000 2840 0.00125 0.0155 312 312 3.08 3.08 11.8 12.8 0.6 0.6 60 60 3240 3780 1.24 1.2405/26/08 64 0.025 238 25 0.5 0.5 1.5 1.46 6.4 4.5 0.01 0.01 2890 2890 0.061 0.06207/13/08 15 0.004 101 59 0.2 0.2 1.33 1.24 4.8 4.3 0.0023 0.0002 3340 3360 0.054 0.05409/16/08 25 0.024 396 15 0.1 0.1 1.46 1.42 9.9 7.3 0.006 0.0005 2950 3020 0.05 0.05
4870 33 19000 2840 0.00125 0.017 262 103 0.97 0.97 1.43 1.37 8.2 7.2 0.155 0.153 60 60 3105 3263 0.35 0.354870 26.8 19000 2840 0.00125 0.01975 275 42 0.35 0.35 1.46 1.42 8.15 5.9 0.008 0.00525 60 60 3095 3190 0.0575 0.058
NA 21 NA NA NA 0.010 125 141 1.42 1.42 0.09 0.12 3.2 4.0 0.297 0.298 NA NA 219 398 0.59 0.591 4 1 1 1 4 4 4 4 4 3 3 4 4 4 4 1 1 4 4 4 4
4870 15 19000 2840 0.00125 0.004 101 15 0.1 0.1 1.33 1.24 4.8 4.3 0.0023 0.0002 60 60 2890 2890 0.05 0.054870 64 19000 2840 0.00125 0.025 396 312 3.08 3.08 1.5 1.46 11.8 12.8 0.6 0.6 60 60 3340 3780 1.24 1.24
100% 75% 25% 75% 100% 100% 50% 100% 100% 100% 25% 25%1 2 3 2
0.795 500 500 36 36 200 200 100 100 1200 1200 8.8 8.8
Sample Date09/16/08 12 0.038 277 15 0.1 0.1 1.35 1.43 7.6 6.4 0.005 0.0005 2860 2830 0.05 0.052
0.795 500 500 36 36 200 200 100 100 1200 1200 8.8 8.8
Sample Date09/16/08 12 0.040 308 15 0.2 0.1 1.38 1.5 7.8 6.9 0.003 0.0005 2960 2960 0.053 0.051
0.795 500 500 36 36 200 200 100 100 1200 1200 8.8 8.8
Key: All sampling was done at high tide except as noted.Bold Results = Parameter undetected by test, value shown is 1/2 MDL or 1/2 MRL.If result was not detected at the lab MDL, the value shown is 1/2 MDL.If result was validation flagged U or UJ, the value shown is 1/2 MRL.Green Results = Estimated result reported by laboratory below reporting limit (MRL).Red Results = Result exceed applicable NOAA SQuiRT Limits.MDL = Method Detection Limit. MRL = Method Reporting Limit.NA = Not Applicable.NOAA SQuiRT = National Oceanic and Atmospheric Administration Screening Quick Reference Tablesmg/L = Milligrams per Litre (Parts per Pillion)μg/L = Micrograms per Litre (Parts per Billion)
Station: MPS4Sample C: Near BottomTide: Low
Station: MPS4Sample A: SurfaceTide: Low
Maximum% of values undetected
# of values between MDL and MRL
# of valuesMinimum
NOAA SQuiRT Criteria Limit
Station: MPS4Sample C: Near Bottom
MeanMedian
St. Deviation
NOAA SQuiRT Criteria Limit
NOAA SQuiRT Criteria Limit
Page 10 of 12
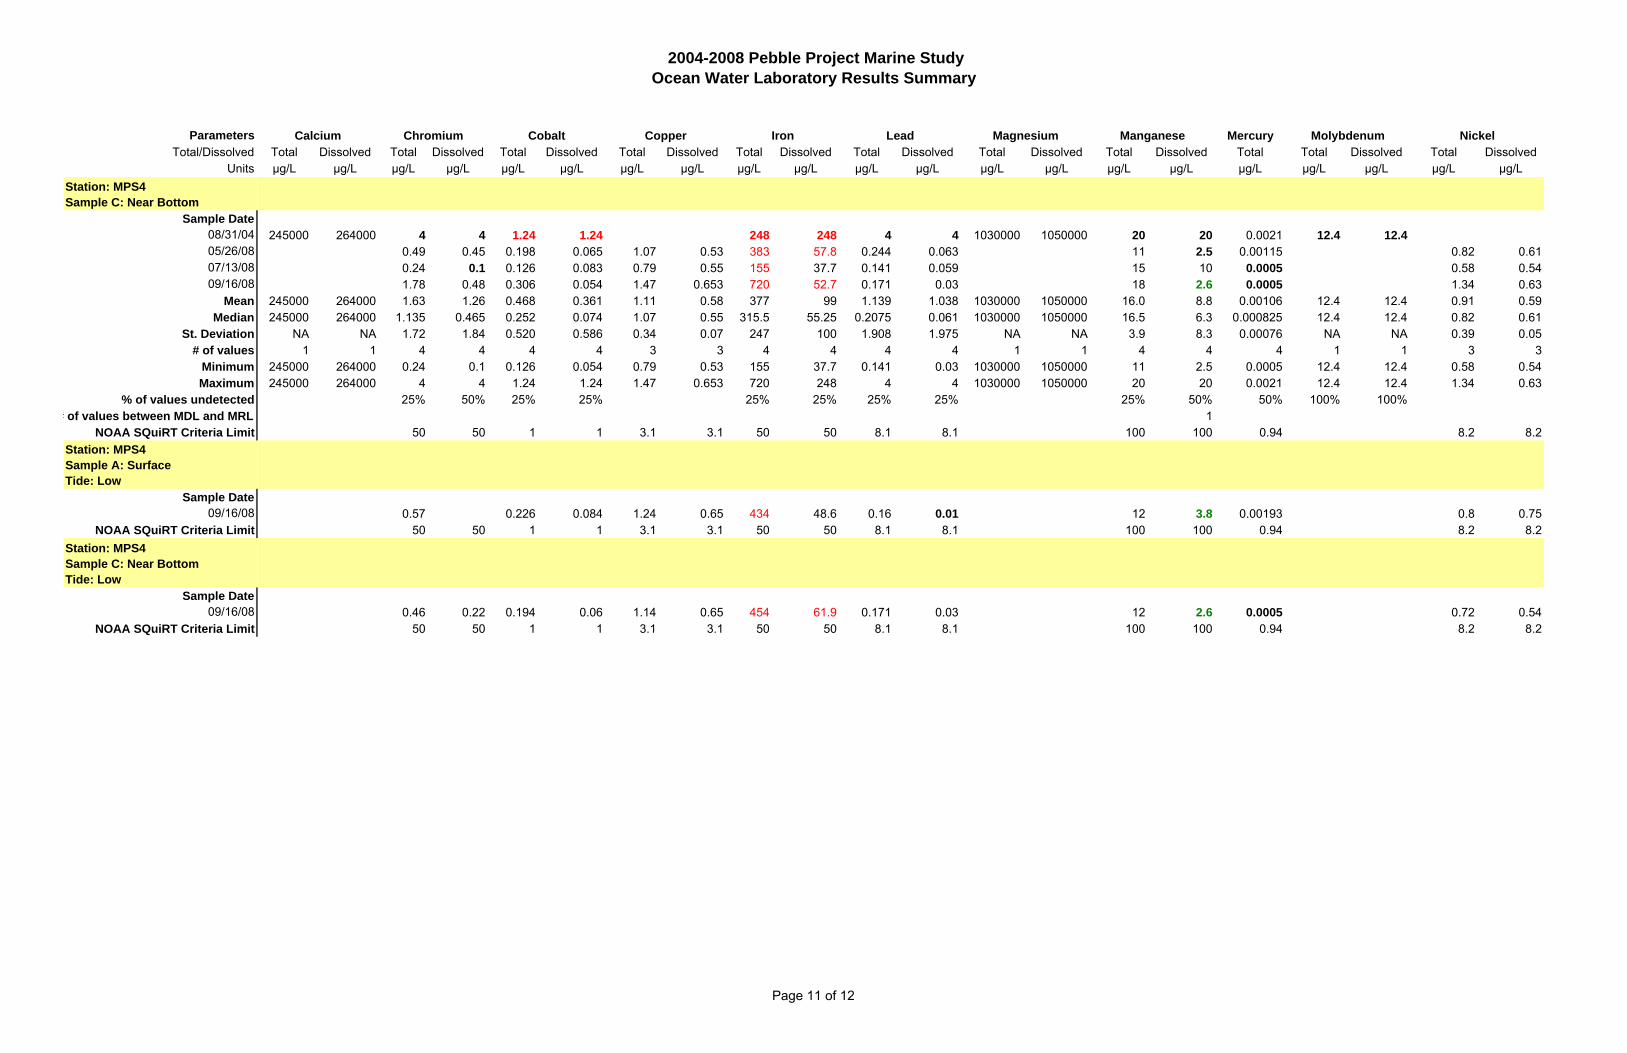
2004-2008 Pebble Project Marine Study Ocean Water Laboratory Results Summary
Parameters
Total/DissolvedUnits
Sample Date08/31/0405/26/0807/13/0809/16/08
Sample Date09/16/08
Sample Date09/16/08
Station: MPS4Sample C: Near BottomTide: Low
Station: MPS4Sample A: SurfaceTide: Low
Maximum% of values undetected
# of values between MDL and MRL
# of valuesMinimum
NOAA SQuiRT Criteria Limit
Station: MPS4Sample C: Near Bottom
MeanMedian
St. Deviation
NOAA SQuiRT Criteria Limit
NOAA SQuiRT Criteria Limit
Calcium Chromium Cobalt Copper Mercury MolybdenumIron LeadTotal Dissolved Total Dissolved Total Dissolved Total
Magnesium Manganese NickelDissolvedDissolved DissolvedTotal Dissolved Total Dissolved TotalTotal Dissolved Total Total Dissolved Total
μg/L μg/L μg/Lμg/L μg/Lμg/L μg/L μg/L μg/L μg/L μg/L μg/Lμg/L μg/L μg/L μg/Lμg/L μg/L μg/L μg/L μg/L
245000 264000 4 4 1.24 1.24 248 248 4 4 1030000 1050000 20 20 0.0021 12.4 12.40.49 0.45 0.198 0.065 1.07 0.53 383 57.8 0.244 0.063 11 2.5 0.00115 0.82 0.610.24 0.1 0.126 0.083 0.79 0.55 155 37.7 0.141 0.059 15 10 0.0005 0.58 0.541.78 0.48 0.306 0.054 1.47 0.653 720 52.7 0.171 0.03 18 2.6 0.0005 1.34 0.63
245000 264000 1.63 1.26 0.468 0.361 1.11 0.58 377 99 1.139 1.038 1030000 1050000 16.0 8.8 0.00106 12.4 12.4 0.91 0.59245000 264000 1.135 0.465 0.252 0.074 1.07 0.55 315.5 55.25 0.2075 0.061 1030000 1050000 16.5 6.3 0.000825 12.4 12.4 0.82 0.61
NA NA 1.72 1.84 0.520 0.586 0.34 0.07 247 100 1.908 1.975 NA NA 3.9 8.3 0.00076 NA NA 0.39 0.051 1 4 4 4 4 3 3 4 4 4 4 1 1 4 4 4 1 1 3 3
245000 264000 0.24 0.1 0.126 0.054 0.79 0.53 155 37.7 0.141 0.03 1030000 1050000 11 2.5 0.0005 12.4 12.4 0.58 0.54245000 264000 4 4 1.24 1.24 1.47 0.653 720 248 4 4 1030000 1050000 20 20 0.0021 12.4 12.4 1.34 0.63
25% 50% 25% 25% 25% 25% 25% 25% 25% 50% 50% 100% 100%1
50 50 1 1 3.1 3.1 50 50 8.1 8.1 100 100 0.94 8.2 8.2
0.57 0.226 0.084 1.24 0.65 434 48.6 0.16 0.01 12 3.8 0.00193 0.8 0.7550 50 1 1 3.1 3.1 50 50 8.1 8.1 100 100 0.94 8.2 8.2
0.46 0.22 0.194 0.06 1.14 0.65 454 61.9 0.171 0.03 12 2.6 0.0005 0.72 0.5450 50 1 1 3.1 3.1 50 50 8.1 8.1 100 100 0.94 8.2 8.2
Page 11 of 12

2004-2008 Pebble Project Marine Study Ocean Water Laboratory Results Summary
Parameters
Total/DissolvedUnits
Sample Date08/31/0405/26/0807/13/0809/16/08
Sample Date09/16/08
Sample Date09/16/08
Station: MPS4Sample C: Near BottomTide: Low
Station: MPS4Sample A: SurfaceTide: Low
Maximum% of values undetected
# of values between MDL and MRL
# of valuesMinimum
NOAA SQuiRT Criteria Limit
Station: MPS4Sample C: Near Bottom
MeanMedian
St. Deviation
NOAA SQuiRT Criteria Limit
NOAA SQuiRT Criteria Limit
Vanadium ZincThallium TinSelenium Silicon Silver SodiumPotassiumDissolved TotalTotalTotal Dissolved Total Dissolved Dissolved Dissolved Total DissolvedDissolved Total Dissolved Total DissolvedTotal
μg/Lμg/L μg/L μg/L μg/Lμg/L μg/L μg/L μg/L μg/L μg/L μg/L μg/L μg/L μg/Lμg/L μg/L
246000 263000 750 0.248 0.248 8670000 8770000 1 1 12.4 12.4 10 10 18.8 18.80.5 0.01 0.01 0.0233 0.0252 0.3 0.3 3 3 2.65 2.22
0.0005 0.0005 0.0112 0.0094 0.3 0.3 3 3 2.37 2.180.1 0.1 0.007 0.01 0.015 0.01 0.07 0.07 10.6 8 1.86
246000 263000 0.30 0.1 750 0.066 0.067 8670000 8770000 0.262 0.261 3.27 3.27 6.65 6.0 6.42 7.73246000 263000 0.3 0.1 750 0.0085 0.01 8670000 8770000 0.01915 0.0176 0.3 0.3 6.5 5.5 2.51 2.22
NA NA 0.28 NA NA 0.121 0.121 NA NA 0.492 0.493 6.09 6.09 4.2 3.6 8.26 9.581 1 2 1 1 4 4 1 1 4 4 4 4 4 4 4 3
246000 263000 0.1 0.1 750 0.0005 0.0005 8670000 8770000 0.0112 0.0094 0.07 0.07 3 3 1.86 2.18246000 263000 0.5 0.1 750 0.248 0.248 8670000 8770000 1 1 12.4 12.4 10.6 10 18.8 18.8
100% 100% 100% 75% 100% 25% 50% 100% 100% 75% 75% 25% 33%1 2 1 1
71 71 0.95 0.95 17 17 50 50 81 81
0.1 0.1 0.006 0.01 0.014 0.01 0.07 0.07 3 3 7.88 1.1271 71 0.95 0.95 17 17 50 50 81 81
0.1 0.1 0.004 0.01 0.016 0.01 0.07 0.07 3 3 1.81 2.1371 71 0.95 0.95 17 17 50 50 81 81
Page 12 of 12