chapter 3shodhganga.inflibnet.ac.in/bitstream/10603/8579/7/07_chapter 3.pdf · in this chapter the...
TRANSCRIPT

CHAPTER 3

EFFECT OF COPPER AND MERCURY ON THE HAEMATOLOGICAL
PARAMETER OF THE FISH Marcrones gulig
Fishes are susceptible to any change that may occur in theenvironment. It is expected that these changes would be reflectedin the physiology of the fish, particularly in the values ofhaematological parameters and haematology has been used as anindex of health status of a number of fish species. (Blaxhall,1972).
Blood takes part directly and indirectly in almost all theactivities of fish and that it can be a good indicator of stressconditions. The use of haematological parameters as indicators ofsublethal stress can provide information on the physiologicalresponses that the fish make to a changing environment. This isthe result of close association of the circulatory system withthe external environment and with tissues. Since haematologicaltests have been an important diagnostic tool in medicine for manyyears, it is speculated that they may be an equally valuableindicator of stress or disease condition of fish (Larsson,1975).
Haematological changes have been detected in response todiseases, pollutants, surgical procedures, hypoxia etc. (Eislerand Edmunds, 1966; De wilde and Houston, 1967; Gardner andYevich, 1969; Mckim et al. 1970; Soivio and Oikari, 1976;Duthie and Tort, 1985). Blood alteration or damage to thehaemopoietic organs in these organisms may also be associated

28
with pathological conditions related to water ~ borne pollutants(Reichenback—Klinke, 1966; Gardner and Yevich, 1969; Saad et al.
1973). One of the important functions of blood is thetranportation of oxygen and carbondioxide in the body. Theimmature red blood corpuscles (RBC) is uniquely concerned withthe synthesis of Hb. when the maturation is complete the RBCfunctions primarily in the transportation of haemoglobin (Hb).
The haemoglobin present in the red blood cell enables theblood to carry adequate amount of the gases to different tissuesas the capacity of the Hb to carry these gases is very high.Hence an estimation of the Hb in the blood provides usinformation about the physiological status of the body. Theincrease or decrease of the haemoglobin content and RBC,variation of the packed cell volume (PCV) or haematocrit(Hct), mean cell haemoglobin concentration (MCHC) etc indirectlyindicates the oxygen carrying capacity of the blood. Alternationsof the haemotological parameters can be due to factors likeretention of metabolites, metabolic problems, oxidation of Hb,increased or decreased erythropoiesis, haemodilution orhaemoconcentration.
RBC count is a long cumbersome procedure which now a days is
replaced by haemotocrit determination which express PCV (packedcell volume) as the percentage of the whole blood volume.Haematocrit provides a rapid approximation of the volume ofcirculating RBC and is used as a routine method for

29
haematological diagnosis of fish health in field studies. Thismethod has the advantage of speed and simplicity and is suitablefor the capillary blood.
Mckim et al. (1970) compared data for Hb, Hct, RBC countetc. of blood from male and female of fishes exposed to copperand found that no significant difference at 95% level. Bell(1968) also did not find any difference in the Hct Values betweenmale and female fishes.
In Physiological studies of fish, haematology is often usedas an index of the effect of xenobiotic compounds to theseanimals. The measurement of specific physiological andbiochemical changes in the blood of fish exposed to sublethalconcentrations of pollutants may provide a sensitive index inpredicting the effects of chronic exposure on survival of theanimals. Such analysis has considerable importance in mammals.But in fishes such applications are only limited.
In this chapter the effects of metals, copper and mercury onthe Hb, Hct, MCV, MCH and MCHC values of Magrones guilo weredescribed.
MAI§§IAL ANQ MEIHODS
Specimens of gagrones gulio were collected and acclimatizedin the laboratory for a week. The collection procedure was thesame that explained in Chapter II. The physico—chemica1

30
parameters of the acclimatization tank was, salinity — l5i2%qtemperature - 28ilOC pH — 7.5 i 0.5 and dissolved oxygen > 90%saturation. The saturation of oxygen was maintained by givingaeration in the tank. During the acclimation period the fisheswere fed with clam meat.
Fishes of immature stage with size range 10-13cm in lengthwere selected for the experiment, irrespective of sex. Thetwenty four fishes were then transferred into each experimentaltanks. Each tank contained 50 litres of water. For the study,filtered water containing corresponding hydrographical parametersof the collection area was used (salinity —.15i2%q temperature 28i 10C, pH — 7.5 1 0.5 and dissolved oxygen > 90% saturation).Based on the LC 50 values three different concentrations ofmetals, copper (0.001 ppm, 0.005 ppm and 0.01 ppm) and mercury(0.01 ppm, 0.015 ppm and 0.02 ppm) were added to the experimentaltank. One tank was kept as control without metal solution andduplicates were run for each metal concentration. The testmedium was renewed every 24 hrs. The physico-chemical parametersof the water were also measured. During the exposure of 15days the fishes were fed with clam meat and feeding stopped 24hprior to each test experiment. The fishes were caught andimmobilized with a hard blow on the head. Immediately thecaudal peduncle of the fish was cut and blood was collected insmall glass vials and were treated with heparin to preventcoagulation.

31
The different haematological analysis were carried outemploying standard techniques (Hesser, 1960; Blaxhall andDaisley, 1973) unless specified.
Iotaltfitytbyooyto Count lTECl
The techniques employed for the erythrocyte counts of fishblood were similar in most aspects to those used in mammaliancounts except a change in RBC diluting fluid. Hendrick's RBCdiluting fluid was used during the present study (Hendrick's1952). The Hendricks fluid contained 10 gm of sodium sulphate,2.5 gm of sodium chloride, 1.5 gm of sodium citrate and 50 ml ofglacial acetic acid per 506 ml of distilled water. Neubauertype Haemocytometer was used for RBC counting. Total erythrocytecount is expressed in millions of RBC per cubic mm of blood.
Estimation of haemoglobin
Cyanomethaemoglobin method described by Ortho diagnosticsystems (1986) was followed for estimating the haemoglobincontent. To 0.02 ml of blood, 5 ml of Drabkin's reagent wasadded and stirred well. The potassium ferricyanide present inthe reagent converts the haemoglobin iron from ferrous to ferricstate to form haemoglobin and this in turn combines withpotassium cyanide of the Drabkin‘s reagent to produce a stablepigment or the cyanomethaemoglobin which represents the sum ofoxyhaemoglobin, carboxy haemoglobin and methaemoglobin. Thecyanomethaemoglobin formed was measured spectrophotometrically at

32
540 nm. The calibration curve was prepared by the humanhaemoglobin standard provided with the reagent. The haemoglobincontent is expressed as g%.
Measurement of haematocrit values(or packed Cell volume — ht%)
Haematocrit value was measured by applying the method ofMcLeay and Gordon (1977). Blood was drawn into heparinisedmicrohaematocrit tube (0.55 i 0.05 mm diameter). One end of thetube was sealed and centrifuged in microhaematocrit centrifugeat 12000 rpm for 5 minutes. Haematocrit value was measuredwithin 30 minutes of centrifugation and measured the red cellcolumn using haematocrit counter provided along with themicrohaematocrit centrifuge, and expressed as the percentage ofwhole blood.
Computation Qf srxthrocyts constants
From the values of haemoglobin content (Hb%) haematocrit(Ht%) and total erythrocyte count (millions/mm3) the followingerythrocyte constants were calculated using the respectiveformula (Lamberg and Rothstein 1978).
Mean Corpussular Vqlume lMC!l
MCV represents the average of individual erythrocytes in3
cubic microns ( u ) and computed by the formula

33
MCV = Ht%- ————————————————————————————— —— x 10
3RBC (in millions/ mm )
Mean CQPBQSCUIBI Haemoqlqbin LMCHI
MCH represents the average weight of haemoglobin inindividual erythrocytes in picograms (Pg) and calculated by theformula
MCH = Hb%—————————————————————— —— x 10
3RBC (in million / mm )
Mean QorPu§9ular Haemoqlflbin Concentration
MCHC is the average haemoglobin concentration per 100 ml ofpacked erythrocytes in percent and computed by
Hb%MCHC = —-- x 100Ht%
Date Ana1y$iS
The data have been subjected to statistical analysis usingthe student's ‘t' test to manifest the variation in comparisonwith the control. The variations were reported at threesignificant levles Viz. P < 0.05, 0.01 and 0.001.

34
RESULTS
Total erythrocyte Count
Total erythrocyte count in mercury treated fishes are shownin the table 3 and Fig. 3. In fishes exposed to mercury theerythrocyte count did not vary from that of the control in 0.01ppm. In 0.15 ppm and 0.02 ppm the erythrocytic count wassignificantly increased (P < 0.001).
Total erythrocyte count of copper dosed fishes are shown intable 4 and fig.4. Fishes exposed to 0.01 ppm copperregistered a significant increase (P < 0.01) in erythrocyte countat all the time interval. In 0.005 ppm, the increase was only at10th day of exposure.
Ha@m99l9bin Concentration
Haemoglobin values of fishes exposed to mercury are givenin table.5 and fig.5. The Haemoglobin values of fishes exposedto 0.01 ppm mercury showed an increase (P <0.05) at 24 hr. In0.015 ppm the increase was at the 15th day of exposure. In 0.02ppm mercury showed significant increase (P<0.01) at all the timeintervel.
Haemoglobin values of fishes exposed to copper are given intable.6 and fig.6. In fishes exposed to copper the haemoglobinvalues did not vary from that of the control except in 0.01 ppmdosed fishes. In 0.01 ppm copper the haemoglobin valuesregistered a significant increase ( P < 0.01).

Table 3
Total erythrocyte count (as mittion/in‘ of blood) in §\1dC!'tlHL'.1”lIrt0 exposed to different concentrationsof mercury.
(ppm)1 Conc.
Time of exposure (days)
1
1
5 10 15
0
0.01
0.02
0.015
2.01 i 0.08
2.16 1“ 0.15
2.00 at 0.1.0
3.19 i 0.1;
1
2.0111 0.03
2.250 0.10
iii2021017
3.32 i 0.10‘
2.04 i 0.24
2.40 i 0.58
2.00 i 0.24
3.44 3. 0.24
213$ 0.58
2.44 i 0.24
2.99 1 0.20
3.00 1 0-00
Table 4
Total erythrocyte count (as mil|ionslmm° of blood) in Lflitrmncs giifm exposed to different concentrations of copper.
Conc.
(ppm)1.
Time of exposure (days
1-. 5.. _ 102 15
0
0.001
0.000
0.01
l
2.00 i 0.59
2.93 2 0.11
2.04 1. 0.31
3.32 .0 0.10 I
2.71: 0.43
2.99 1 0.20
3.19 0 0.17
3400010
2.01 i 0.24
2.99 i 0.20
3.21 i 0.10
3.50 1-" 0.30
2.01:0.57
3.053 0.46
3.22i0.54
35120.10
Values are the mean of six set of experiment .1. SD P< 0.001, “ P < 0.01, ‘ P< 0.05

Table 5
Concentration of Hb (as gm! 100ml)in ‘Macronc: gufia exposed different concentrations of mercury
T .-.I Conc. 1(ppm)
Time of exposure (days)| I\ 0
0.011 J0.015
0.02
1 5 10 15
7.02:1: 0.85i
8.22i0.38
8.65 i0.32
9.141:i
I
7.511090
828i001
8.77i0.8O
9.42i0.0*0
O
7.81i0.34
8.403-'O.B5
8.76i0.57
0.60i0.§Zt
8.10i0.66
8.51i1.37
8941.51.27
9.a0¢0.9t§
Table 6
Concentration of Hb(as gm/10m!) in fiftrcrorrcs gufio exposed to different concentrations
Conc.
O
0.001
0.005
0.01
ppm Time of exposure (days)1 5 ‘ 10 1 158.501109
9.10:t1.12
9.91 i1.04
10.49100}
8.79i1;04
958251.46
9.56 i1.24
11.51:t:1.¢11
8.86i 1.75
9.68 i 1.04
9.96 L 0.97
11.70i1.14'
8.02:‘. 1.70
9.756i0.94
10.96";0.91
11.87i0.82| ‘ 1 1i 1 I |1
I
Values are the mean of six sets of experimenti SD P< 0.001, “ P< 0.01, ‘ P< 0 05

RBC million/mm’
4¢ ~— U3-...
'v\‘>
I» 1‘I \:I1H’ A? »,1
.’/M0 Q __ _ %O 0.01 0.015 0.02Concentration (ppm)
Days B1 5 10 15
FIGURE 3 TOTAL ERYTHROCYTE COUNT IN $11/lC0{O7\”liS" §'UL1O EXPOSED TO MERCURY.

RBC million/mm’
4.. ?__~.. ~ j 7 *7 ** _ _ _ _ _ _ _ _ , 4“ W,"5‘J * TI3 _ _ ‘ ‘I\
f x
‘.....3...».-_.‘\ N -5'-'\‘~‘\'b‘l‘I.I~I
1L Q-01:-I Ll-lo 1| -1 i i‘0.001 0.000 0.01
Concentration (ppm)
Days 11 .\\\\\\\ 10 15
FlGURE 4 ; TOTAL ERYTHROCYTE coum m 5\rflC'KO5\f'"£.§ gvuo EXPOSED TO COPPER

Hb gm/100 ml
10L
0 -u _ 0.0; - 0.016 0.02
Concentration ( ppm)
Days $1 \\\\\\\‘ 5 10 15
FIGURE 5 ; HAEMOGLOBIN VALUES nu ;w,;:<>@<,<>M-5 gvuo EXPOSED TO MERCURY.

Hb gm/100 ml14V f _ 4- _ _ _12“?
1
1o‘—
\\\'
\ I . . .\\'\'
$1‘
FIGURE 6 HAEMOGLOBIN VALUES IN 9lUIC‘RO?~"IZ.$‘ QJULIOEXPOSED TO COPPER
ax *. . . .Q O I I Ixvi‘ :
Q00] — 0.006 _ 0.0
Concentration (ppm)
Days I1 6 10 E15
|~
4
00
.0D
0
n
I0

35
Haematocrii yalues
Hct values of fishes exposed to mercury are given in table 7and fig.7 Hct values of fishes exposed to different concentrationof mercury showed significant increase (P < 0.05) only in 0.02ppm at 5 and 15 days. Hct values of fishes exposed to copper aregiven in table 8 and fig.8. Hct values of fishes exposed tocopper did not show any significant variation.
Mean Corpussular Haemoglobin Cqncentratiqe
MCHC values of fishes exposed to mercury are given in table9 and fig.9. MCHC values of fishes exposed to 0.015 ppm mercury
shown significant increase (P < 0.05) at 5th day. MCHC value offishes exposed to copper are given in table 10 and fig.l0.Fishes exposed to 0.01 ppm registered a significant increase ( P< 0.05) in MCHC values at 10th day.
Mean Cqrpusler fiaemoslobin Values
MCH values of fishes exposed to mercury are given in tablell and fig.11.
MCH values in fishes exposed to 0.02 ppm mercury showedsignificant decrease (P < 0.01) at 1, 5, 10 and 15 days; in thosefishes exposed to 0.015 ppm mercury showed significant decrease(P < 0.01) at 10 days when compared with the control.

Table 7
Haemocrit values (as °/<1) in Lllacroncs gufio exposed to different concentrations of mercury.
com; Time of exposure (days)it (ppm) 1 1 s 10 15
it
. 0 45.00i 2.39 45.251“ 2.21 45.92 4.1 ‘. 1 1 ‘I
1
45.42:t2.76i
. 0.01 . 45.131144 40.501304 =1 47.701305 47.e1:4.3sA 5 A 1 49.01.1320i 0.01 1 47.25.121.21 1 47.07 1 7.34 40.0111471 i . , 11 1. 0.02 49.701245 40.00:.-.240 1 50.0ai2.sr§ 50.201205 1
1. 5. _ f — '5'Table 8
Haematocrit vatues (as %) in Bfacrorrcs 3064 exposed to ditierent concentrations of copper.
Conc.(ppm)
W ._. _Time of exposure (days)
1
0
iti 0.0010.005
0.01
1 5 10 15
48.243: 3.84
49.391-.1.96
50.08i2.38
50.87i1.76
48.57i 3.03
4952i 1.86
50.23 524.99
51.09 i1.50
48.74i2.73
49.62i2.48
50.25 i2.86
51.74 i4.74
48.81 ‘£1.47
48.92i3.20
50.56i2.54
52.47i3.40
4 _ . 2 _. .. . ._ » 4_ _ _Values are the mean of six set of experiment i SD “‘P < 0.001 , " P< 0.01, ' P< 0.05
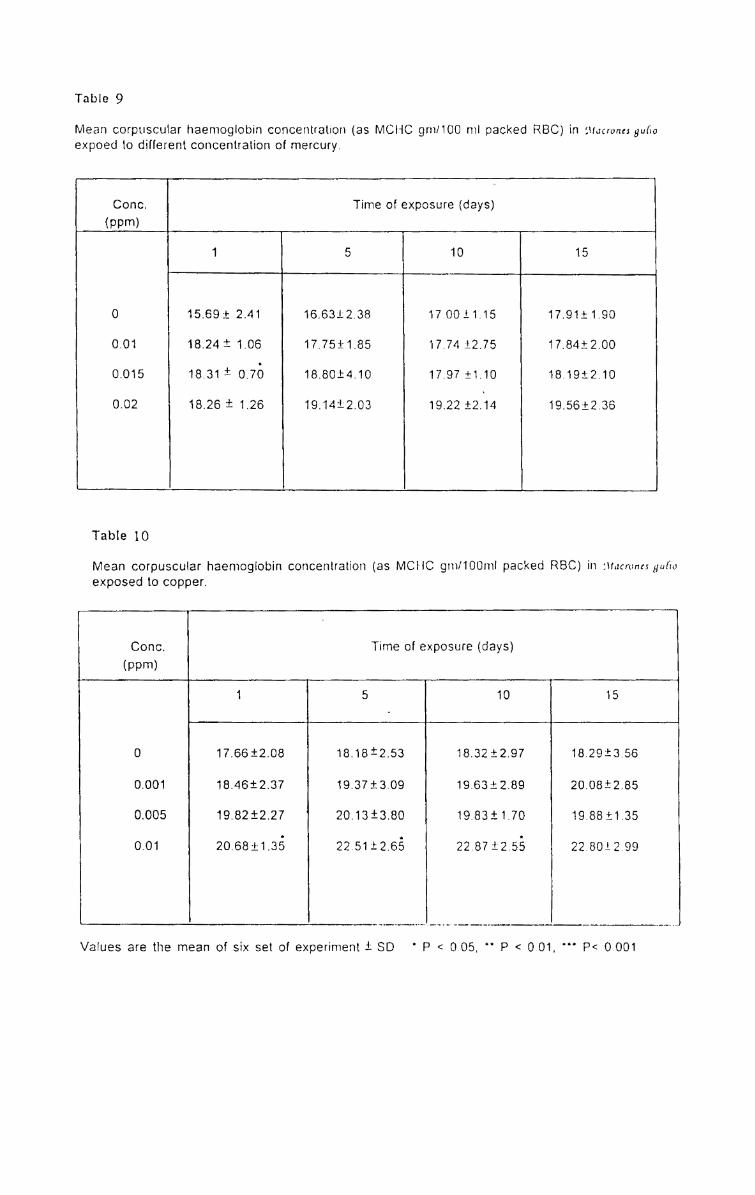
Table 9
Mean corpuscular haemoglobin concentration (as MCHC gm!1OO rnt packed RBC) in fltfacrorrcs 3066expoed to different concentration of mercury.
‘ .
Conc. Time of exposure (days)- teem) 1- _ - _ up _ 1
J
O
I
0.01
0.015
0.02
1
1 5 1O— 7 7 — '11 ‘ _a_'_:-- ' »i‘ -»
151
15.69 ".t 2.41
18.24 i 1.06
16.3131 0.70
16.26 11.26
16.63J;2.38
17.75‘*_-1.85
18.8Oi4.1O
19.14'*_'2.03
17.00!."1.15
17.74 i2.-/5
17.97 i1.1O
19.22 i2.14
17.91i1.9O
17.841‘ 2.00
18.19i2.1O
19.56i2.36
1
Table 10
Mean corpuscular haemoglobin concentration (as MCI-IO gin/100ml packed RBC) in :1r.i¢mmg11r}tiexposed to copper
O
0.0
1... .____
0.001
0.005
1 I.
1 5
Conc. Time of exposure (days)> (ppm),. . _ . * 7 . ' -;'__ —-— -_—_7 ' 3.2 __ _ 7 7 :f‘__
i
I
10 15
17.662206
16.462237
19.82i2.27
20.66-_i~1.35
16.161263
19.37.363.00
201313.60
226112.65
2-— ___ _ _ _ ____ ---0-uivwv ---u-av--1----n~-—---.---q , p.
133212.07
1:-1.e3¢.2.s9
19.63 i1.70
22.372256
18.29i3.56
20.08t2.85
19.88 £1.35
22.8Oi2.99
urani --_14@_—
Values are the mean of six set of experiment i SD ' P < 0.05. “ P < 0.01, P< 0.001
-Q;--1

Table 11
. - - - ._ . ' d to different concenMean corpuscular haemoglobin (as picograins (pg)) in _,1f¢ICl'nm3 Uiifw exposetration of mercury.. .. . . M--. » 1r in "Vif Geno i Time of exposure (days)’ (ppm) 1 _ A —
O
0.01
0.015
1 -2
35.02i4.31
38.26t1.88
33.-115i-2.41
0.02 290013.11
38.15i-4.52
37.05i5.56
33.72i4.36
28.39i2.14
_ I ' __ 7 inf 138.62i3.53 1
37.05i9.67flit
31.48i3.01 1
20.04 1~.3.3's§
-1
41.26i12.18
s4.01i4.v0
30.521006
27.301575
Table 12
- ~ ' - . ~ r‘ ex osed to different concenMean corpuscular haemoglobin (as picogram (D9)) 1“ 1"“-""'“ 11" “‘ Ptrations of copper
(ppm)‘ Conc._ _ .,_7_ __ ' __ 7 I, 7
Time of exposure (days)
qr '7 -: _.; 7" . '
0
0.001
0.005
0.01
1 5 10 15 0 1
ss.s2¢7.77
31.131315
33.22:6.s7
31.621‘ 1.81
32.87i 5.59
32.31;t5.42
31.19 i3.12
33.86 i370
_.. _. W. » --~_ ~___ . ll _ _
7 7 _ _]:’ ii; 33.051‘ 3.36 ‘
32.39i2.94 1
_1_ __ W, _ ._ .1. _._
34.04i10.22
32.82i5.99
“ 32.99 10.09 ‘ 32.29is.a7
33.r9¢2..40 33.38i2.45
.. -11
Values are the mean of six set of experiment i SD “‘P < 0 001 , " f>< 0.01, ‘ P< 0.05

Haematocrit %
son; -— in in - ~—- —-~n T~~ J — - —~ -—»-n - V .¥ \50:‘ ' if40%so n‘— ,20? A
‘\1‘ \‘IO '*'_.L0.01 0.016 0.02
Concentration (ppm )
Days $1 \\\\\\\‘ 10 15
FIGURE 7 ; HAEMATOCRITE VALUES m :»w/:01<09v'1-45' g,-mm EXPOSED TO MERCURY

FEGURE 8
Haematocrit %so M60.
T
I .
40%
n4'
1'
‘\'\ N
-'1'?I-1'125:31
sol:
20,7"*1 13+
10 }- -5§E5§;-4--.\“a' 0
‘:~.§?§‘\§\~§‘\~.\ §\ .‘ \ \‘ §Q:\\\ \\§>§.
0.001 0.005 0.01Concentration (ppm )
Days I1 s\\\\\\‘ 5 10
'1 HAEMATOCRITE VALUES an 5%UIC‘RO5v'Z-1? G
10
vuoexposeo TO COPPER.
I

MCHC gm/100 ml
25 ; I 1% i : T 1: ~ 1 1? _ - -— é j —20¢ ___ }-u— H,\
‘I
X
\
J
1A x‘ \__ _L0.01 0.015 0.02
Concentration ( P131")
Days E1 6 10 E16
FIGURE 9 ; MEAN CORPUSCULAR HAEMOGLOBIN cowcsmrmnou IN an/'10;go9\"Y35 gvuo EXPOSEDTO MERCURY

MCHCgm/100ml
2s~ ~ — ~ -1 K —- - ,
N\\
20¢" ... --1 If . M
\\\ \ \ \>> .\:.\.‘.-.-.§$>_.~T§~.\
15.‘q- \
\\\\
‘ I I.' \' '1' Q,\ ~ . .L \\\\ ‘ '\\\' ;1 O fl-.s: , ,’
\\ \\'\\ _\\_\ \
\- xv. .= ~1
5. §~§~\\§- xx ?$rG§§§l
1 .v-_s; ~ls\-.15L
-~.;~.
I\\\\\ ‘'.'.'.'.'- 1 I\ -as--. \-1 in-Q 1 N 110.001 0.006 ' 0.01
Concentration (ppm )
Days -1 5 10 15
FIGURE 10 MEAN CORPUSCULAR HAEMOGLOBIN CONCENTRATION IN iv,-"I(_‘*RO9'\T9 QULIOEXPOSEDTO COPPER.

MCH(Pg)
60 -0
40+
so Lv\\\‘h
'l\.
10*
O 0.01 0.016 0.02Concentration (ppm)
DZLYS 1 5 1Q 15
FIGUREIII MEAN CORPUSCULAR HAEMOGLOBIN IN 5/V/"lC‘R,09\”?;S‘ QULJO EXPOSED TO MERCURY

MCH(pg)40 ~~ -_ _ _ -~35} lg
\|‘ vim.
PO (00| OT" ‘T
l20 *- __ __:=:>.>.-2:-'0.-.\-_.- n n -- .- 0 u 1 nu - - ,. Q
.u I$;I;I;I;Z.9. I... 0.!‘
16¢
10.-‘IL -vn‘. 55 \ .~~.~;-.\'\'
0L._ _o 0.00? _ 0.005 0.01Concentration (ppm)
Days E1 \\\\\\\ 5 1o 15
FIGURE 13 1 MEAN CORPUSCULAR HAEMOGLOBIN m :.\r_;:<_'u<<>:.w:.s‘ §',"U£I0 EXPOSED TO COPPER

36
MCH values of fishes exposed to copper are given in table 12and fig.l2. MCH values of fishes exposed to differentconcentrations of copper did not vary from that of control.
Mean Corpuscular Volume
MCV values in fishes exposed to mercury are given in table13 and fig.l3.
MCV Values in fishes exposed to 0.015 ppm mercury showedsignificant decrease (P < 0.01) at 1, 5, 10 and 15 days whencompared to control. In those fishes exposed to 0.02 ppm mercuryshowed significant decrease (P < 0.001) at 1, 5, l0 and 15 dayswhen compared with that of the control. MCV values in fishes,exposed to copper are given in table 14 and fig.l4. MCV valuesin fishes, exposed to 0.01 ppm mercury showed significantdecrease (P < 0.05) at 5th day of exposure.
DISCUSSION
The result indicates an increase in haemoglobin content infishes exposed to copper and mercury towards the later period ofthe experiment. There are reports of elevated Hb levles in brooktrout exposed to copper (McFadden, 1965); in §. fontinalisexposed to methyl mercury (Christensen et al. 1977) ; in Channai__punctatus exposed to mercury ( Chitra and RamanaRao, 1986) and indog fish exposed to cadmium (Tort and Torres, 1988).

Table 13
Mean corpuscular volume (as cubic micronsp, -‘ ~) in flfacrorre: 3050 exposed to differentconcentrations of mercury.
~ ppmConc.
Time of exposure (days)
1,0. 0.010
, 0.0151 0.02
Table 14 , 3 _ .Mean corpuscular volumeias cubic micronstt ) in f_1fin'rmn'.\ Writ» exposed to diiierent concentrationoicopper
5 1011 T 'T T1 : 7 7': T 7* 5* 77 ‘L77’ ‘"1 * *1 : * 7 : 7 “ 1 T1 11i_ _ 2. ._ 15
1
224.85 2520.53 ”
210.25 £14.41vr
182.77 i13.15$80
156.69 £11.19
224.28i13.57
208.761“-25.02
§O182.721‘-23.52
4+0149.41i13.62
225.85 i12.21
215.46 i70.58
175.271“ 14.20
14621121096
228.13i55.77
196.26 i'19. 19
165.89 i20.48
138.49i14.80
.. _ .4- . 2 2 _ _ _ __ 4 f _ _ 4 1 _ 4
i ’*iI Conc.. ppmF; ___'1 _" — 7 7 7' 5" fax’ It 777; 7 ; 7
Time of exposure (days)
T. 0.010
0.015
0.02
1:7‘ _i4'
1 0 1
_.1 _...
1 5
190.20 3:37.531 181.46 i24.44
168.9421: 5.22
1687611628
153.65 2210.01
I 166.8i13.55
1 158.48i'21.04I1 0 1
A 1507311802
*_1.?- *' Ti; l
_1_.. . _... W *4 .._.:I __ 7 17 ._, . _ if 1 - ~— es ‘— 1 * *
101
175.31 1:20.33
167.44 i20.47
156.79-.t10.93
149.64i22.96
.,_1
1
1
15
179.36 i29.24 ‘
163.72 i23.64
161.08 129.18
150.29i14.96
Values are the mean of six set of experiment i SD P< 0.001, " P < 0.01, ‘ P< 0.05

MCV-p‘2so»U~— ~- »< -~ ;> 1 ~j E Ezoor ........ -9\‘ .\\\
160pi
'.\\ s‘:'
100]
6O ~ ;§~1¢\ ‘» . _:ss.~>‘: '~‘*¢\\'\4{ a KS0 i_.J _ _ ( ..O 0.01 0.015 0.02Concentration (ppm)
Days -1 6 10 £16
FIGURE l3|: MEAN CORPUSCULAR VOLUME IN 91!/'!(,“J(_09'v’llS' QULJO EXPOSED TO MERCURY.

MCV-p’200 —~- - ~ F7‘?160
.- nna .O) I .g.5-.3...*°° ‘ fiiiiiiiei
-‘I
\\\‘ ‘.--_-'1.0 - u u 0- 0 - u
1'
-'-‘.'-R‘ouono-..-.e\~..-|-b
\\\
O00] 0.000 0.01Concentration \ ppm)
Days" I1 5 10 16
£6
RE 14 ; mam CORPUSCULAR vowmz aw m/m<<wm gvuo sxposeom co
'/
\..‘?>\~
In
_\
ll:00.u_
I .
'1
P

37
In the present study haematocrit values showed an increaseduring the entire experimental period in fishes exposed to copperand mercury. In the early period of the experiment, an increasein the Hct values without any change in the Hb values may be dueto Haemodilution. Haemodilution results in swelling oferythrocytes as reported in the dog fish. 5, canicula in responseto copper (tort et al. 1987) and hence an increase in Hct valueswithout a change in Hb values.
Haemodilution has been interpreted as a mechanism whichreduces the concentration of an irritating factor in thecirculatory system (Smith et al. 1979). Decreased osmoregulationis the consequence of copper toxicity in fish (Leland andKuwabara, 1985). Haemodilutin has been obserrved in Colisafasciatus exposed to zinc by Mishra and Srivastava (l979,l98O).One of the consequences of haemodilution is the decrease inplasma osmotic pressure as observed in lgtalurus punctatus inresponse to copper and zinc (Lewis and Lewis, 1971). An increasein the erythrocyte size is generally considered as a responseagainst stress. The swelling of RBC would be a consequence offactors like high pCo , high lactate concentration or low PO inthe blood. leading tozlow ATP concentration, which would incieasethe oxygen affinity of blood (Soivio and Nikinmaa, 1981).Abrahamsson and Nilsson (1975) observed that the contraction ofspleen of cod exposed to a stressed would release blood cell intothe blood stream. A similar pattern has been detected in

38
Cyprinus garpio after cadmium exposure (Koyama and Ozaki, 1984),in which haematocrit decreases.
Helmy et al. (1978) reported a decrease in RBC count, Hb andHct in the fish mullet exposed to copper and mercury. Similareffects were detected in flounder exposed to cadmium (Johansson —
Sjobeck and Larsson, 1978); in winter flounder exposed to mercury(Dawson, 1979); in marine teleost, gphanius dispar (Hilmy et al.1980) and CL carpio exposed to cadmium and mercury (Beena andViswaranjan, 1987). Panigrahi and Misra (1978, 1980) reportedlow Hb and RBC count associated with reduced respiratory rate inthe fresh water fish gnabas scandens and Iilapia mQ§$§mbica dosedwith mercury.
Decrease in Hb was observed in perch in response to cadmium(Larsson, 1975); in brook trout exposed to lead (Christensen etal. 1977); in Anabas scandens dosed with mercury (Panigrahi, andMisra 1977); in fix mossambicus exposed to mercury (Aruna andGopal, 1987); and in Qlarias lazera intoxicated with copper (EL —Domiaty, 1987).
In the present study there was a significant increase inhaemoglobin content and a corresponding increase in thehaematocrit values in the later part of experiment. This may bedue to the adaptation of the fishes body to metal stress.Haemodilution could be an initial reaction of the body to stress.Afterwards the living system rectified the imbalance by removingwater from the blood. This could result in haemoconcentration.

39
Hilmy et al. (1980) reported that values of Hct, Hb and RBC countreturned to control levels after an initial decrease in marineteleost AL dispar in response to mercury toxicity. Buckley (1976)also observed a partial recovery of Hb after a decline in Cohosalmon exposed to treated water containing total residualchlorine (TRCl ). He suggested (1) decreased haemolysis as aresult of elimination of susceptible cells and decreasedsensitivity of younger cells to oxidants and (2) compensatoryerythropoiesis with the establishment of a balance between celldestruction and formation resulting in reduced number ofcirculating cells. But tort and Torres (1988) ruled out thehemolysis or RBC destruction as the RBC count increased in thefish after cadmium exposure. They postulated that the RBC countelevation was due to consequences of blood cell reserve combinedwith cell shrinkage, probably due to osmotic alterations of bloodby the action of the metal. In addition, haemoglobin measurementsby Tort and Torress (1988) in plasma showed no increase ofextracellular haemoglobin. Torres et al. (1986) found that infish subjected to confined stress condition, zinc treatmentsignificantly decreased Hct and RBC count and the decrease wasidentical.
Gluth and Hanke (1985) postulated a biphasic response topollutant in Q. carpio consisting of water loss followed by awater gain in the blood. But in the present study the biphasicresponse observed in the copper dosed fish was just the reverse,that is, water gain followed by a water loss. Gill and Pant

40
(1981) also obtained a biphasic response similar to the findingsin the present study. They observed a fall in haemoglobin, RBCfollowing l-3 weeks exposure to sublethal concentrations of
YL
mercury in the Puntaus conchonius, but recorded an increase in Hband RBC count after 8 weeks of exposure.
During the entire experimental period there was nosignificant variation in the mean copuscular haemoglobinconcentration (MCHC) in the present study. Svobodova (1982) inQ. carpio treated with copper and mercury; Gill and Pant (1985)in Q. conchonius dosed with cadmium did not find any significantdifference in MCHC values from that of control values. Because
MCHC is the ratio of blood haemoglobin concentration to the Hct,it is not dependent on the blood volume or on the number of redcells per unit volume. This clearly indicates that the decreaseof Hb noted in the present study was not due to haemolysis orunusual RBC destruction but caused by haemodilution. Similarlythe increase in haemoglobin and a corresponding increase in Hctwas due to either haemoconcentration or increased erythropoiesisor both.
The lack or decrease in Hb in mercury trated fishes could bedue to increased production of urine which might remove theexcess water present in the blood as a result of haemodilution.Lock et al. (1981) observed that increased water uptake by thegills did not result in the decreased haemotocrit values ofmercury treated rainbow trout and instead there was an increase

41
in the haematocrit values. He suggested that the inflow of wateris offset by an enhanced urine flow. The enzyme Na, K—ATPaseappears to be involved in osmoregulatory transepithelialelectrolyte transport in the gills, intestine and urinary bladderas well as in active sodium potassium exchange across all cellmembranes (Schmidt - Neilsen, 1974). In a wide variety of tissuethis enzyme is sensitive to mercurials and other sulphydrylreagent (Schwartz et al. 1975). Mercury may prevent thereabsorption of water across kidney and tubules, resulting in theincreased urine flow and hence haemoconcentration.
The Hb content in both the copper and mercury dosed fishesincreased at all time interval. There was an increase in thehaematocrit values as well. The significant increase of Hb andHct observed in copper and mercury treated fishes could have dueto an increased production of RBC by the erythropoetic organsalong with haemoconcentration. Mckim et al. (1970) in brooktrout fialyelinus fontinalis and Svobodova (1982) in Q. carpioexposed to copper reported a significant increase in RBC, Hct andHb. The mean cell volume (MCV) and mean corpuscular haemoglobin
concentration (MCHC) in Q. carpio remain in without changes.This indicats that the incerase in Hb and Hct is due to anincrease in RBC number. Svobodova (1982) explained the changesin the haematological parameters in the intoxicated carp asdisorders in the oxidation process in the fish. An increase inHb, Hct values were observed in S,fgntinali§ in response tocopper (Mckim et a1- 1970) in lctalurns nshulesus exposed to

42
copper (Christensen et al. 1972) in Q. fasciatus treated withnickel (Agrawal et al. 1979) and in rainbow trout dosed withcopper (Wotten and Williams, 1980).
Haemoglobin levels were elevated in response to copper inbrook trout (McFadden, 1965); in §. fontinalis in response tomethyl mercury (Christensen et al. 1977); in Channa punctatus inresponse to mercury (Chitra and Ramana Rao 1986) and in dog fishin response to cadmium (Tort and Torres, 1988). Similarly Hctvalues increased in rainbow trout exposed to methyl mercury andin Mystus vitatus in response to copper and zinc (Singh andSingh, 1982).
The increase in Hb and Hct observed in the present study inmetal dosed fishes may be an attempt by the body to counteractthe low oxygen content of the blood. The low oxygen content maybe due to the low oxygen carrying capacity of the blood or faultygaseous exchange caused by damage to the gills.
It has been widely reported that many pollutants enter theRBC and either oxidise or denature the Hb by inhibiting theGlycolysis or metabolism of the hexose monophosphate shunt(HMPS). Fairbanks (1967) showed that copper penetrates theintact erythrocyte inhibiting glycolysis, denaturing Hb andoxidising glutathione. Chlorine also seemed to diffuse readilythrough gills oxidising Hb to methaemoglobin and disruptingerythrocyte membrane resulting to haemolysis (Zeitoun, 1977).Grothe and Eaton (1975) found a methaemoglobin (MHb) level of 30%

43
of total Hb. Formation of Methaemoglobin reduces the oxygencarrying capacity of the blood. Scarano et al. (1984) observed adecrease in Hb and increase in methaemoglobin in Seabass exposedto nitrate.
Asano and Hoikari (1987) stated toxic concentration ofcopper may cause cytotoxicity by its oxidant action and canaffect the function of erythrocytic enzymes leading to oxidationof Hb, a disulphide formation of the membrane proteins and adecrease in the intracellular concentration of glutathione.
Hodson et al. (1980) studied the effects of water borneselenium on_rain bow trout and found that even though the bloodparameters decreased from the control levels by 30% the fishappeared to be compensating for these changes by increasederythropoiesis. Sahib et al. (1981) found that the exposure offish to a sublethal concentration of malathion showed aconsistent increase in the oxygen consumption up to 24 hr andlater declined to 48% suggesting reduction of oxidativemetabolism at the end of 48 hr. Panigrahi and Misra (1980) foundthat the uptake of oxygen decreased 27% in _'lapia mossambica111 t
exposed in mercury. Similarly Chlorine produced oxidants (CPO)reduced oxygen carrying capacity of the fish Leiostomus xanthurus(Middaugh et al. 1980).
A decrease in the oxygen carrying capacity may stimulateerythropoiesis in fish so that blood carries enough oxygen tomeet the requirement of the body. The increase in Hb and Hct in

44
metal exposed fishes of the present study may be due to thisphenomenon. An increased erythropoiesis may result in anincrease in RBC count, Hb and Hct. An increase in RBC count orpolycythemia in fishes after exposure to various toxicants werereported by many authors (Buckley et al. 1976, 1979; Agrawal etal. 1979; Juelich, 1979; Verma et al. 1981 C; Singh and Singh,1982; Junjea and Mahajan, 1983; Lal et al. 1986; Haniffa et al.1986; and Pant et al. 1987). Along with stimulation oferythropoiesis, a reduction in plasma volume and a mobilizationof new erythrocytes into circulation could also have contributedto the increase in Hb and Hct. Erythrocyte recruitment wasassociated with depletion of spleenic RBC reserves which may bereflected in the erythrocyte count (Milligan and wood, 1982). Lalet al. (1986) found that increase in RBC count was followed by areduction in spleenosomatic index indicating a release of RBCfrom the spleen. Buckley (1976) and Buckley et al. (1979) hadshown that there is an increase in the number of circulatingimmature erythrocytes when" fishes were exposed to differentpollutants. Buckley (1976) postulated that increased number ofRBC in the circulatory system was an attempt by the body to meetthe elevated demands for O or CO transport as a result ofincreased metabolic activity guring itress or by a destruction ofgill membrane causing faulty gaseous exchange. Nayak andMadhyastha (1980) found an erythropoietic response as evidencedby significant increase in the number of immature RBC.

45
Pollutants can influence the functioning of all parts ofrespiratory chain. Pollutant may not only restrict gas transfer,but their irritant effect can also interfere with ventilation(Hughes, 1981). Lindahl and Hell (1970) found that the gills fromfishes exposed to mercurials show clear tissue injuries. Thelayer of epithelial cells is detached from the deeper layers.This causes faulty gaseous exchange. when gills from fish exposedto phenyl mercurial were studied. a decrease in the circulationof blood was observed in the secondary lamellae. This may eitherbe the effect of decreased circulation of the blood in thesecondary lamellae or diminished exchange between water and blood
in the secondary lamellae or structural change in the haemoglobinmolecule due to binding of phenyl mercury ions. Diffusingcapacity of the gill is reduced, following the action ofpollutants and consequently there is a fall in oxygen supply tothe tissues which become hypoxic.
wedmeyer (1971) explained the increased pituitary activityin formalin treated rainbow trout on the basis of a chemicaladversely affecting gill function. Such an interference with gillfunction can be expected to reduce its respiratory role so thatthe Hb was increased in the treated fish to compensate the loss.This sort of compensatory reaction is known to occur in fishesinfected by certain parasites (Kabata, 1970).
So a faulty gaseous exchange of gases as a result of damageto the gills by the action of metals or oxidation of haemoglobin

46
to MHB by various toxicants lowers the Oxygen carrying capacityof the blood. Reaction to such a situation would be stimulatingthe erythropoietic tissue and increasing the Hb content of theblood. The increased Hb and Hct values observed in the metaltreated fishes of the present study could be due to the increasederythropoiesis and Hb synthesis.