chapter 4 · chapter 4 a combined cell-free protein synthesis and fluorescence-based approach to...
TRANSCRIPT
Chapter 4
A Combined Cell-Free Protein Synthesis and Fluorescence-Based Approach to Investigate GPCR Binding Properties
Anne Zemella, Theresa Richter, Lena Thoring, and Stefan Kubick
Abstract
Fluorescent labeling of de novo synthesized proteins is in particular a valuable tool for functional andstructural studies of membrane proteins. In this context, we present two methods for the site-specificfluorescent labeling of difficult-to-express membrane proteins in combination with cell-free protein syn-thesis. The cell-free protein synthesis system is based on Chinese Hamster Ovary Cells (CHO) since thissystem contains endogenous membrane structures derived from the endoplasmic reticulum. Theseso-called microsomes enable a direct integration of membrane proteins into a biological membrane. Inthis protocol the first part describes the fluorescent labeling by using a precharged tRNA, loaded with afluorescent amino acid. The second part describes the preparation of a modified aminoacyl-tRNA-synthe-tase and a suppressor tRNA that are applied to the CHO cell-free system to enable the incorporation of anon-canonical amino acid. The reactive group of the non-canonical amino acid is further coupled to afluorescent dye. Both methods utilize the amber stop codon suppression technology. The successfulfluorescent labeling of the model G protein-coupled receptor adenosine A2A (Adora2a) is analyzed byin-gel-fluorescence, a reporter protein assay, and confocal laser scanning microscopy (CLSM). Moreover, aligand-dependent conformational change of the fluorescently labeled Adora2a was analyzed by biolumi-nescence resonance energy transfer (BRET).
Key words Cell-free protein synthesis, G protein-coupled receptor, Protein modification, Non-canonical amino acids, Amber suppression, Confocal laser scanning microscopy
1 Introduction
G protein-coupled receptors (GPCRs) are involved in vital pro-cesses including the regulation of signaling pathways and thesubsequent triggering of essential physiological responses. Up todate more than 50% of pharmaceutical drugs are targeting GPCRsand GPCR interaction partners [1]. Therefore, the development ofnovel production processes of GPCRs for structural and functionalcharacterization remains essential. In a natural environment, mem-brane proteins are only present in small concentrations [2]. Theoverexpression of membrane proteins is usually performed in het-erologous systems involving a complex vector design. Nevertheless,
Mario Tiberi (ed.), G Protein-Coupled Receptor Signaling: Methods and Protocols, Methods in Molecular Biology, vol. 1947,https://doi.org/10.1007/978-1-4939-9121-1_4, © The Author(s) 2019
57
overexpression obstacles such as low solubility, cytotoxicity, andlow stability can occur [3]. In addition, detergents used to solubi-lize membrane proteins often induce altered ligand binding proper-ties [4]. Cell-free protein synthesis based on translationally activelysates represents an approved alternative for membrane proteinsynthesis. Eukaryotic cell lysates based on insect, CHO, andhuman cell lines are predestined for membrane protein synthesisdue to the presence of endogenous membrane structures[5]. These microsomes enable an integration of membrane proteinsinto a biological membrane. In addition, posttranslational modifi-cations such as disulfide bridging, phosphorylation, and partlyglycosylation are possible [6]. Furthermore, the CHO cell-freesystem is characterized by a high productivity of complexproteins [7].
In the context of protein modification and fluorescent labelingby using genetic code expansion [8], cell-free systems are of specialinterest due to their open reaction mode [9]. Exogenouslyprepared components can be easily and directly added to the cell-free protein synthesis reaction to incorporate a defined non-canon-ical amino acid site-specifically at the position of a redefined codonwithin the gene sequence [10]. In a first step, addressing of adefined amber stop codon can be verified by the addition of aprecharged tRNA to the cell-free protein synthesis reaction. ThetRNAs in this report are aminoacylated to a lysine residue that iscoupled to a Bodipy TMR dye (BP). The tRNA recognizes eitherthe amber stop codon or the phenylalanine codon. The lysineresidue with the coupled fluorescent dye is subsequently site-specifically (BP-CUA) or statistically (BP-GAA) incorporated.The lack of a re-aminoacylating mechanism of the tRNA leads tothe consumption of large amounts of precharged tRNA. Therefore,we describe an alternative system that is inspired by the naturalaminoacylation of tRNAs in vivo.
The addition of non-canonical amino acids in vivo that usuallydo not permeate the cell wall can be realized in cell-free systems dueto the missing cell wall. Even high concentrations of non-canonicalamino acids can be added to the reaction. Moreover, the suppressortRNA and the modified aminoacyl-tRNA-synthetase can be appliedto the cell-free reaction in defined concentrations enabling anidentification of optimal concentrations for highest suppressionefficiency. Here, the described experimental setup is based on anevolved aminoacyl tRNA-synthetase (aaRS) derived from E.coli[11, 12] and a modified suppressor tRNA recognizing the UAGamber stop codon [13]. The combination of the aaRS, tRNA, and aphenylalanine-derivate (p-propargyloxy-L-phenylalanine, pPa) withan alkyne group in para-position resulted in an efficient incorpora-tion of the non-canonical amino acid into the model protein aden-osine A2A receptor (Adora2a). The human Adora2a is expressed inalmost every tissue of the body. Primarily, the membrane protein
58 Anne Zemella et al.
can be detected in the brain, cells of the immune system, leuco-cytes, and platelets. In peripheral tissues, the Adora2a is involved ininflammation reactions and affects the control of the cardiovascularsystem [14]. The interaction of the Adora2a with different neuro-transmitters in the brain is of highest interest since the receptordisplays an important role in the regulation of dopamine andglutamate release thereby making it a promising therapeutic targetfor the treatment of depression, insomnia, and Parkinson’s disease[15]. Consequently, a better understanding of the detailed interac-tions between membrane proteins and their specific ligands is man-datory. Information on the structural and functional relationship ofa defined GPCR might be gained by a visualization of the targetmembrane protein in a nature-like lipid environment [14]. A highlypreferred method to determine GPCR interaction is based on thespatial proximity of two fluorescent moieties. Interaction partnerscan be determined by an intermolecular fluorescence resonanceenergy transfer (FRET) and specific conformation changes by anintramolecular FRET. For the Adora2a, intermolecular as well asintramolecular FRETs were established to analyze the receptors’behavior [16, 17]. In this way, the conformational rearrangementof the helices III and VI induced by agonist binding was elucidated[18]. A coupled fluorescent dye in the region of amino acid 215 willbe excited by a C-terminally fused NanoLuciferase (Nluc) resultingin a detectable bioluminescence resonance energy transfer (BRET).A signal change of the BRET value after the addition of a ligandindicates a conformational change of the Adora2a. The main objec-tive of this chapter is to describe a cell-free protein synthesis-basedalternative methodology to the standard protein visualizationmethods typically used in vivo. Our cell-free procedure is basedon the site-specific and statistical incorporation of a prechargedtRNA and a site-specific incorporation of a non-canonical aminoacid into the target protein. The cell-free synthesized protein issubsequently labeled by using a chemoselective reaction. Moreover,we adapted an intramolecular BRET for the Adora2a to show aligand-dependent conformational change. In addition, we presentthe preparation of the evolved aminoacyl-tRNA-synthetase and thesuppressor tRNA.
2 Materials
2.1 Preparation
of Enhanced
Orthogonal Aminoacyl-
tRNA-Synthetase
1. Coding sequence for the modified tyrosyl-tRNA-synthetase(eAzFRS, including the mutations Thr37, Ser182, Ala183,and Arg265 [11, 12] and a C-terminal Strep-Tag) from E.coli.
2. E.coli expression system (RTS 500 E.coli HY Kit,biotechrabbit).
3. 100 mM Isopropyl β-D-1-thiogalactopyranoside (IPTG).
Investigation of GPCR Binding Properties Using Cell-Free Systems 59
4. Gravity flow Strep-Tactin® superflow mini-column (0.2 ml).
5. Strep-Tactin® Purification Buffer Set: 10� Washing Buffer(1 M Tris–Cl, pH 8.0, 1.5 M NaCl, 10 mM EDTA), 10�Elution Buffer (1 M Tris–Cl, pH 8.0, 1.5 M NaCl, 10 mMEDTA, 25 mM Desthiobiotin) and 10� Regeneration Buffer(1 M Tris–Cl, 1.5 M NaCl, 10 mM EDTA, 10 mM HABA(hydroxyl-azophenyl-benzoic acid)).
6. Zeba™ Spin Desalting Columns (7 K MWCO, 0.5 ml).
7. Amicon® Ultra Centrifugal Filters (10 K device, 0.5 ml).
8. Synthetase storage buffer: 50 mM HEPES pH 7.6, 10 mMKOAc, 1 mM MgCl2, 4 mM DTT.
9. Thermomixer with a microtiter plate adapter and a RTS500 adapter.
2.2 Preparation
of Suppressor tRNA
2.2.1 Generation of PCR
Product
1. Vector containing the nucleotide sequence of tRNATyrCUA(SupF Gene).
2. tRNATyrCUA-specific forward primer (50 CgA gCT CgCCCA CCg gAA TTC 30) and 20-OMe reverse primer (50 TggTgg Tgg ggg AAg gAT TCg 30).
3. 0.2 ml PCR tubes.
4. PCR cycler.
5. Taq DNA polymerase.
6. Taq buffer.
7. dNTPs.
8. 25 mM MgCl2.
9. Agarose gel electrophoresis chambers.
10. Agarose.
11. Rotiphorese 10� TBE buffer.
12. DNA stain.
13. DNA ladder.
14. PCR Purification Kit.
2.2.2 Generation of RNA
Transcript
1. T7 RNA Polymerase (f.c. 1 U/μl, Agilent).2. 5� NTP mix containing 18.75 mM ATP, 18.75 mM CTP,
18.75 mM UTP and 7.5 mM GTP.
3. 5� transcription buffer: 400 mM HEPES-KOH, 0.5 mMSpermidine, 50 mM DTE and 75 mM MgCl2.
4. DNAseI (1 U per μg plasmid DNA).
5. 10� MOPS buffer: 200 mM MOPS, 50 mM NaOAc, 10 mMEDTA, pH 8.0.
60 Anne Zemella et al.
6. MOPS sample buffer: 8% (v/v) formaldehyde, 12 ml formam-ide, 2.4 ml 10�MOPS buffer, 0.05% (v/v) bromophenol blueto a total volume of 24 ml.
2.2.3 RNA Isolation
and Folding
1. TRIzol reagent.
2. High Performance Liquid Chromatography (HPLC) gradeChloroform.
3. HPLC grade Isopropyl.
4. 75% Ethanol.
5. Cooled centrifuge.
6. Nanodrop 2000c.
2.3 Cell-Free Protein
Synthesis
and Fluorescent
Labeling of Modified
Adora2a
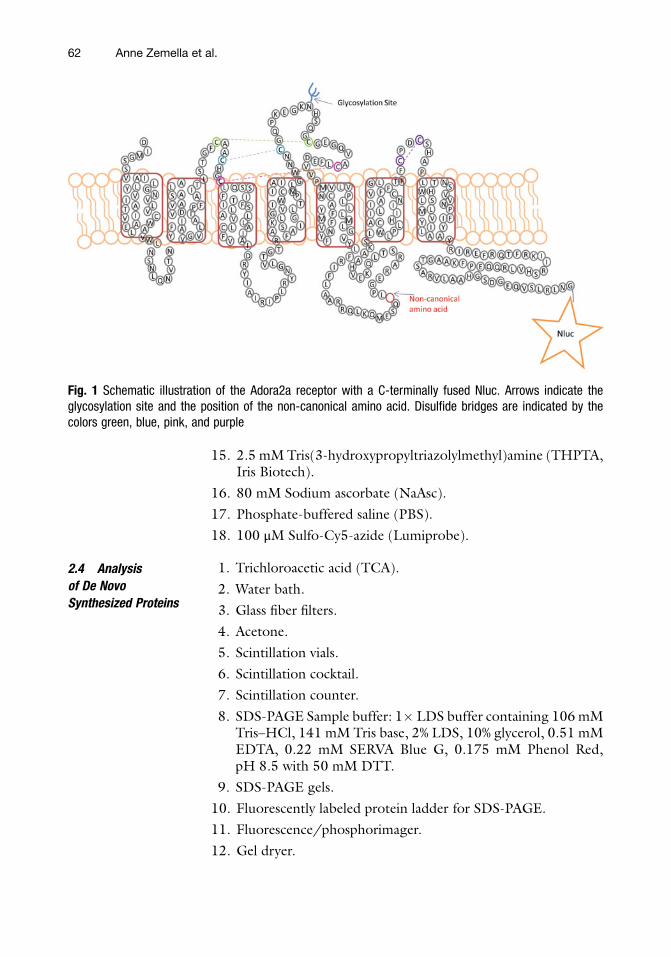
1. Coding sequence for the modified adenosine A2A receptor(Uniprot: P29274, amino acids 1-340, with and withoutamber stop codon at nucleotide sequence coding for P215)with a receptor C-terminally fused Nanoluciferase (Fig. 1).Flanking sequences containing 50 regulatory sequences(T7 RNA polymerase promotor, Cricket paralysis virus(CRPV) IGR IRES sequence (Genbank accessionno. AF218039, nucleotides 6025-6216)) and 30 regulatorysequences (T7 terminator), cloned with the coding sequenceinto a plasmid (BioCat or Thermo Fisher Scientific).
2. 1.5 ml reaction tubes.
3. CHO lysate prepared as described [19, 20] (see Note 1).
4. 10� translation mix: 300 mM HEPES-KOH (pH 7.6),2250 mMKOAc, 2.5 mM spermidine, 1 mM of each canonicalamino acid (Merck) and 39 mM Mg(OAc)2.
5. 5� energy: 100 mM creatine phosphate, 1.5 mM GTP,1.5 mM CTP, 1.5 mM UTP 8.75 mM ATP and 0.5 mMm7G(ppp)G cap analogue.
6. 100 μM Polyguanylic acid (polyG, IBA).
7. T7 RNA polymerase (f.c. 1 U/μl).8. 14C-leucine.
9. 100 μM Bodipy-TMR-lysine-tRNACUA (BP-CUA,biotechrabbit).
10. 100 μM Bodipy-TMR-lysine-tRNAGAA (BP-GAA,biotechrabbit).
11. 100 μM eAzFRS.
12. 100 μM tRNATyrCUA.
13. 100 mM p-propargyloxy-L-phenylalanine (pPa, Iris Biotech).
14. 5 mM Copper(II) sulfate (CuSO4).
Investigation of GPCR Binding Properties Using Cell-Free Systems 61
15. 2.5 mMTris(3-hydroxypropyltriazolylmethyl)amine (THPTA,Iris Biotech).
16. 80 mM Sodium ascorbate (NaAsc).
17. Phosphate-buffered saline (PBS).
18. 100 μM Sulfo-Cy5-azide (Lumiprobe).
2.4 Analysis
of De Novo
Synthesized Proteins
1. Trichloroacetic acid (TCA).
2. Water bath.
3. Glass fiber filters.
4. Acetone.
5. Scintillation vials.
6. Scintillation cocktail.
7. Scintillation counter.
8. SDS-PAGE Sample buffer: 1� LDS buffer containing 106 mMTris–HCl, 141 mM Tris base, 2% LDS, 10% glycerol, 0.51 mMEDTA, 0.22 mM SERVA Blue G, 0.175 mM Phenol Red,pH 8.5 with 50 mM DTT.
9. SDS-PAGE gels.
10. Fluorescently labeled protein ladder for SDS-PAGE.
11. Fluorescence/phosphorimager.
12. Gel dryer.
Fig. 1 Schematic illustration of the Adora2a receptor with a C-terminally fused Nluc. Arrows indicate theglycosylation site and the position of the non-canonical amino acid. Disulfide bridges are indicated by thecolors green, blue, pink, and purple
62 Anne Zemella et al.
13. Phosphorscreens.
14. Adenosine.
15. Nano-Glo® Luciferase Assay System.
16. 96-well microtiter plate.
17. Multimode Microplate Reader Mithras2 LB 943.
18. μ-Ibidi-Slide (μ-Slide 18 well, flat, Ibidi).
19. Confocal laser scanning microscope.
3 Methods
3.1 Preparation
of Enhanced
Orthogonal Aminoacyl-
tRNA-Synthetase
1. For prokaryotic cell-free synthesis, the eAzFRS gene should becloned into a vector containing a T7 promotor, ribosomalbinding site, and T7 terminator such as pIX3.0, pIVEX2.3d,and pIVEX2.4d vectors or alternatively containing a T5 pro-motor such as pQE2 vectors as used in this protocol. eAzFRS issynthesized in a cell-free system using an E. coli lysate in adialysis mode. A typical 1.1 ml reaction is composed of0.525 ml E.coli lysate, 0.225 ml reaction mix, 0.27 ml aminoacids without methionine, 30 μl methionine, 11 μl IPTG forthe induction of the protein expression pQE2 vector, 39 μltemplate containing 110 μg plasmid DNA.
2. The surrounding feeding mixture contains 7990 μl feedingmix, 110 μl IPTG, 2650 μl amino acids without methionineand 300 μl methionine (see Note 2).
3. Fill the reaction solution into the reaction compartment(marked through the red lid).
4. Fill the feeding mix into the feeding chamber (marked throughthe colorless lid).
5. Insert the prepared chamber into the RTS 500 adapter in athermomixer. The reaction time is 20 h at 30 �C and a shakingspeed of 900 rpm.
6. For the separation of aggregated proteins from soluble eAzFRSa centrifugation step at 16,000 � g for 10 min at 4 �C isrecommended.
7. Equilibrate two Strep-Tactin columns with 400 μl of 10�washing buffer and add 500 μl of the supernatant of the cell-free reaction to each column.
8. After the supernatant has completely entered the column, washeach column 5� with 200 μl washing buffer (see Note 3).
9. Elute the protein 6� with 100 μl elution buffer and collect thefractions.
10. Elution fractions containing the target protein are pooled.
Investigation of GPCR Binding Properties Using Cell-Free Systems 63
11. Regenerate the column with 3� 1 ml of 1� regenerationbuffer and remove the regeneration buffer 2� with 800 μl of1� washing buffer. Store the column in 2 ml washing buffer at4 �C.
12. The combined elution fractions are applied to Zeba™ SpinDesalting Columns to exchange the elution buffer of thestrep-tag purification to a synthetase storage buffer. Therefore,remove the storage solution of the Zeba™ Spin DesaltingColumn by centrifugation at 1500 � g for 1 min. Add 300 μlof the synthetase storage buffer to the resin bed and centrifugeat 1500� g for 1 min. Repeat this step 2�. Place the column ina new collection tube and apply 100 μl of the pooled synthetasesolution to each column. Centrifuge at 2000� g for 2 min andcollect the synthetase.
13. The concentration of the synthetase can be performed withAmicon® Ultra Centrifugal Filters. Add up to 500 μl of thesynthetase solution to the concentrator and centrifuge at14,000 � g for 10 min and 4 �C. Collect the concentratedsample and determine the concentration by NanoDrop mea-surement using the molecular mass (48.6 kDa) and the extinc-tion coefficient (54.3) (see Note 4).
14. The synthetase can be stored at �80 �C after shock freezing inliquid nitrogen.
3.2 Preparation
of Suppressor tRNA
3.2.1 Generation of PCR
Product
1. For specific and homogenous 30-ends of the suppressor tRNA,an additional PCR step before transcription reaction isincluded. Therefore, the reverse primer contains a 20-OMe-group to prevent unspecific nucleotides at the 30-end of thetRNA that can be added by the T7 polymerase during tran-scription reaction. Amplify the template by pipetting in a PCRtube final concentrations of 1� Taq Buffer, 0.2 mM dNTPmix, 0.5 μM forward primer, 0.5 μM reverse primer, 2.5 mMMgCl2, 0.01 ng/μl plasmid and 0.04 U/μl Taq DNA polymer-ase. Fill the reaction with water to a final volume of 250 μl (seeNote 5).
3.2.2 Generation of RNA
Transcript
1. Thaw the components for in vitro transcription on ice andpipette the reaction at room temperature. Mix 1� transcriptionbuffer, 1�NTP mix, 1 U/μl T7 RNA Polymerase and 8 ng/μltemplate DNA. Fill the reaction with water to the final volumeof 500 μl. Incubate the reaction for 3–6 h at 37 �C and500 rpm.
2. Centrifuge the RNA at 12,000 � g for 1 min und use thesupernatant for the DNAseI treatment (see Note 6) Add 1 UDNAseI per 1 μg DNA. Incubate for 10 min at 37 �C and500 rpm.
64 Anne Zemella et al.
3.2.3 RNA Isolation
and Folding
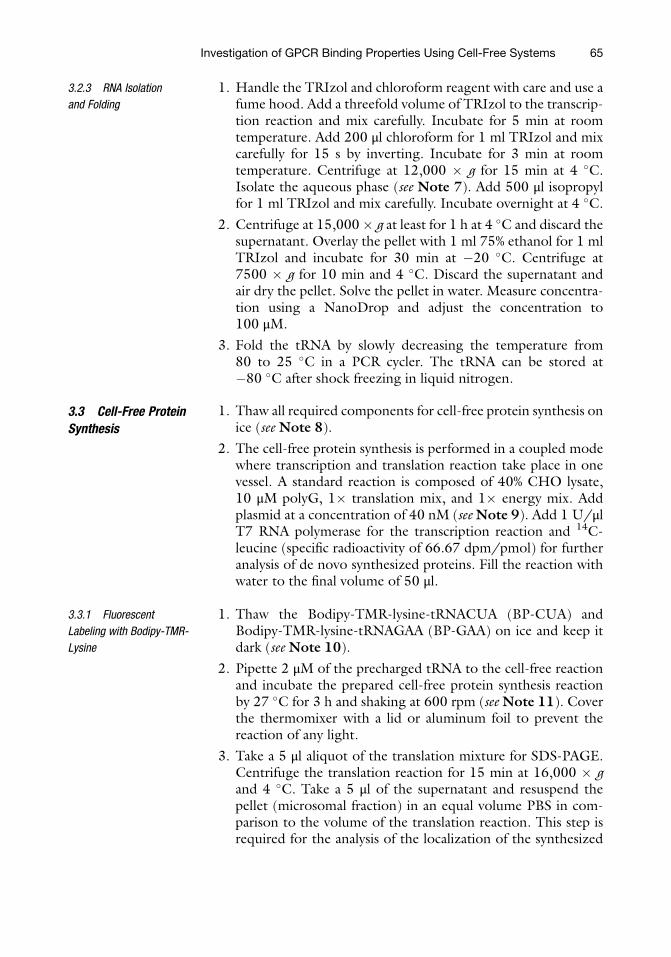
1. Handle the TRIzol and chloroform reagent with care and use afume hood. Add a threefold volume of TRIzol to the transcrip-tion reaction and mix carefully. Incubate for 5 min at roomtemperature. Add 200 μl chloroform for 1 ml TRIzol and mixcarefully for 15 s by inverting. Incubate for 3 min at roomtemperature. Centrifuge at 12,000 � g for 15 min at 4 �C.Isolate the aqueous phase (see Note 7). Add 500 μl isopropylfor 1 ml TRIzol and mix carefully. Incubate overnight at 4 �C.
2. Centrifuge at 15,000� g at least for 1 h at 4 �C and discard thesupernatant. Overlay the pellet with 1 ml 75% ethanol for 1 mlTRIzol and incubate for 30 min at �20 �C. Centrifuge at7500 � g for 10 min and 4 �C. Discard the supernatant andair dry the pellet. Solve the pellet in water. Measure concentra-tion using a NanoDrop and adjust the concentration to100 μM.
3. Fold the tRNA by slowly decreasing the temperature from80 to 25 �C in a PCR cycler. The tRNA can be stored at�80 �C after shock freezing in liquid nitrogen.
3.3 Cell-Free Protein
Synthesis
1. Thaw all required components for cell-free protein synthesis onice (see Note 8).
2. The cell-free protein synthesis is performed in a coupled modewhere transcription and translation reaction take place in onevessel. A standard reaction is composed of 40% CHO lysate,10 μM polyG, 1� translation mix, and 1� energy mix. Addplasmid at a concentration of 40 nM (seeNote 9). Add 1 U/μlT7 RNA polymerase for the transcription reaction and 14C-leucine (specific radioactivity of 66.67 dpm/pmol) for furtheranalysis of de novo synthesized proteins. Fill the reaction withwater to the final volume of 50 μl.
3.3.1 Fluorescent
Labeling with Bodipy-TMR-
Lysine
1. Thaw the Bodipy-TMR-lysine-tRNACUA (BP-CUA) andBodipy-TMR-lysine-tRNAGAA (BP-GAA) on ice and keep itdark (see Note 10).
2. Pipette 2 μM of the precharged tRNA to the cell-free reactionand incubate the prepared cell-free protein synthesis reactionby 27 �C for 3 h and shaking at 600 rpm (see Note 11). Coverthe thermomixer with a lid or aluminum foil to prevent thereaction of any light.
3. Take a 5 μl aliquot of the translation mixture for SDS-PAGE.Centrifuge the translation reaction for 15 min at 16,000 � gand 4 �C. Take a 5 μl of the supernatant and resuspend thepellet (microsomal fraction) in an equal volume PBS in com-parison to the volume of the translation reaction. This step isrequired for the analysis of the localization of the synthesized
Investigation of GPCR Binding Properties Using Cell-Free Systems 65
protein. The expectations of the incorporation of the differentBodipy-tRNAs are described in Table 1 (see Note 12).
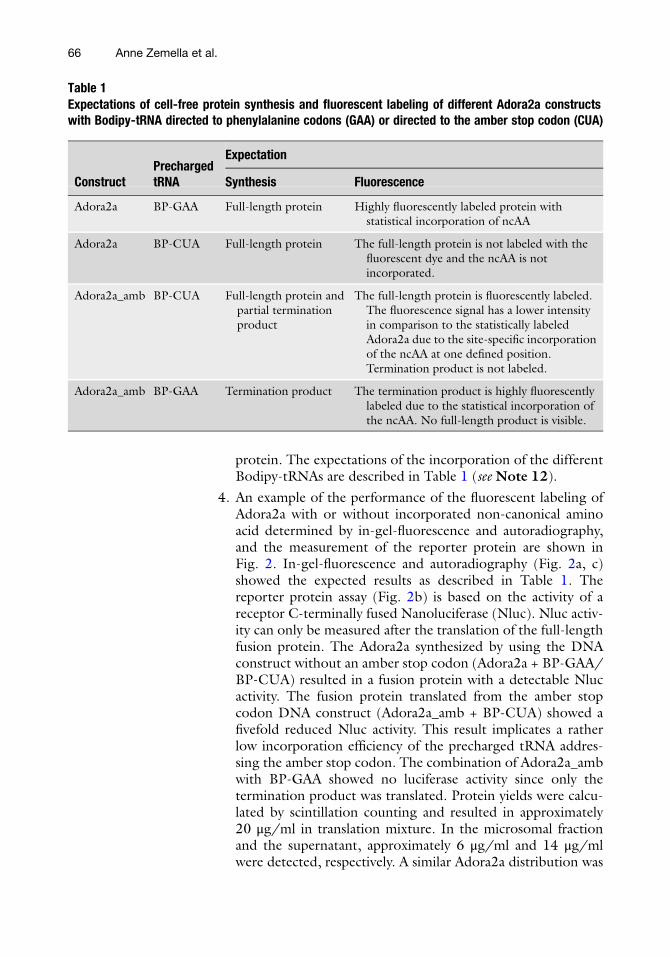
4. An example of the performance of the fluorescent labeling ofAdora2a with or without incorporated non-canonical aminoacid determined by in-gel-fluorescence and autoradiography,and the measurement of the reporter protein are shown inFig. 2. In-gel-fluorescence and autoradiography (Fig. 2a, c)showed the expected results as described in Table 1. Thereporter protein assay (Fig. 2b) is based on the activity of areceptor C-terminally fused Nanoluciferase (Nluc). Nluc activ-ity can only be measured after the translation of the full-lengthfusion protein. The Adora2a synthesized by using the DNAconstruct without an amber stop codon (Adora2a + BP-GAA/BP-CUA) resulted in a fusion protein with a detectable Nlucactivity. The fusion protein translated from the amber stopcodon DNA construct (Adora2a_amb + BP-CUA) showed afivefold reduced Nluc activity. This result implicates a ratherlow incorporation efficiency of the precharged tRNA addres-sing the amber stop codon. The combination of Adora2a_ambwith BP-GAA showed no luciferase activity since only thetermination product was translated. Protein yields were calcu-lated by scintillation counting and resulted in approximately20 μg/ml in translation mixture. In the microsomal fractionand the supernatant, approximately 6 μg/ml and 14 μg/mlwere detected, respectively. A similar Adora2a distribution was
Table 1Expectations of cell-free protein synthesis and fluorescent labeling of different Adora2a constructswith Bodipy-tRNA directed to phenylalanine codons (GAA) or directed to the amber stop codon (CUA)
ConstructPrechargedtRNA
Expectation
Synthesis Fluorescence
Adora2a BP-GAA Full-length protein Highly fluorescently labeled protein withstatistical incorporation of ncAA
Adora2a BP-CUA Full-length protein The full-length protein is not labeled with thefluorescent dye and the ncAA is notincorporated.
Adora2a_amb BP-CUA Full-length protein andpartial terminationproduct
The full-length protein is fluorescently labeled.The fluorescence signal has a lower intensityin comparison to the statistically labeledAdora2a due to the site-specific incorporationof the ncAA at one defined position.Termination product is not labeled.
Adora2a_amb BP-GAA Termination product The termination product is highly fluorescentlylabeled due to the statistical incorporation ofthe ncAA. No full-length product is visible.
66 Anne Zemella et al.
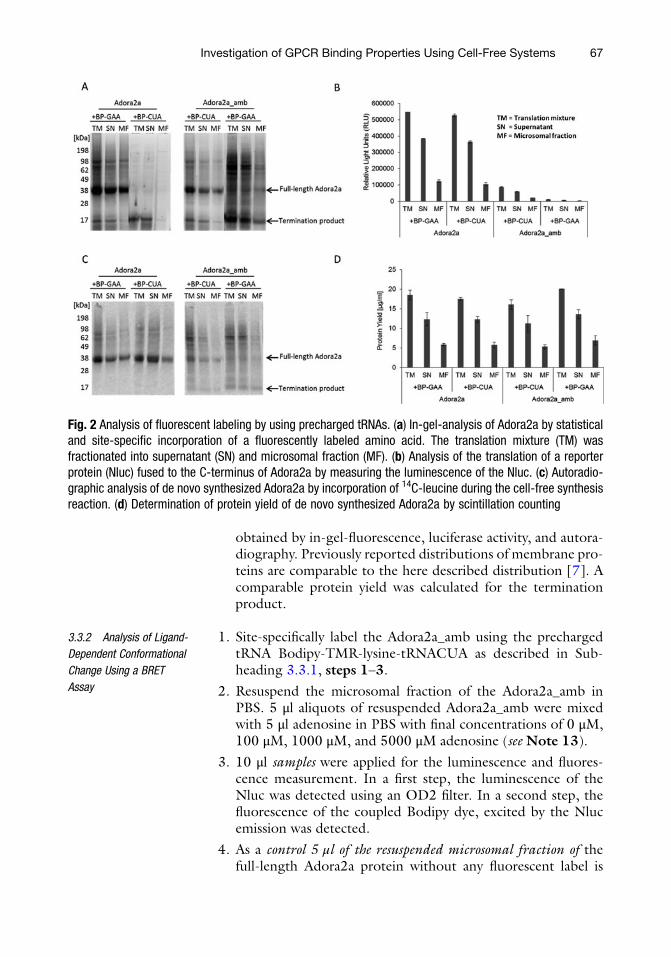
obtained by in-gel-fluorescence, luciferase activity, and autora-diography. Previously reported distributions of membrane pro-teins are comparable to the here described distribution [7]. Acomparable protein yield was calculated for the terminationproduct.
3.3.2 Analysis of Ligand-
Dependent Conformational
Change Using a BRET
Assay
1. Site-specifically label the Adora2a_amb using the prechargedtRNA Bodipy-TMR-lysine-tRNACUA as described in Sub-heading 3.3.1, steps 1–3.
2. Resuspend the microsomal fraction of the Adora2a_amb inPBS. 5 μl aliquots of resuspended Adora2a_amb were mixedwith 5 μl adenosine in PBS with final concentrations of 0 μM,100 μM, 1000 μM, and 5000 μM adenosine (see Note 13).
3. 10 μl samples were applied for the luminescence and fluores-cence measurement. In a first step, the luminescence of theNluc was detected using an OD2 filter. In a second step, thefluorescence of the coupled Bodipy dye, excited by the Nlucemission was detected.
4. As a control 5 μl of the resuspended microsomal fraction of thefull-length Adora2a protein without any fluorescent label is
Fig. 2 Analysis of fluorescent labeling by using precharged tRNAs. (a) In-gel-analysis of Adora2a by statisticaland site-specific incorporation of a fluorescently labeled amino acid. The translation mixture (TM) wasfractionated into supernatant (SN) and microsomal fraction (MF). (b) Analysis of the translation of a reporterprotein (Nluc) fused to the C-terminus of Adora2a by measuring the luminescence of the Nluc. (c) Autoradio-graphic analysis of de novo synthesized Adora2a by incorporation of 14C-leucine during the cell-free synthesisreaction. (d) Determination of protein yield of de novo synthesized Adora2a by scintillation counting
Investigation of GPCR Binding Properties Using Cell-Free Systems 67
treated with the same concentrations of adenosine (step 2) todetermine background fluorescence caused by the broad emis-sion spectrum of the Nluc and possible interactions of adeno-sine with the Nluc.
5. The BRET ratio is calculated as follows:
BRETratio ¼ Fluorescence sampleð ÞLuminescence sampleð Þ �
Fluorescence controlð ÞLuminescence controlð Þ
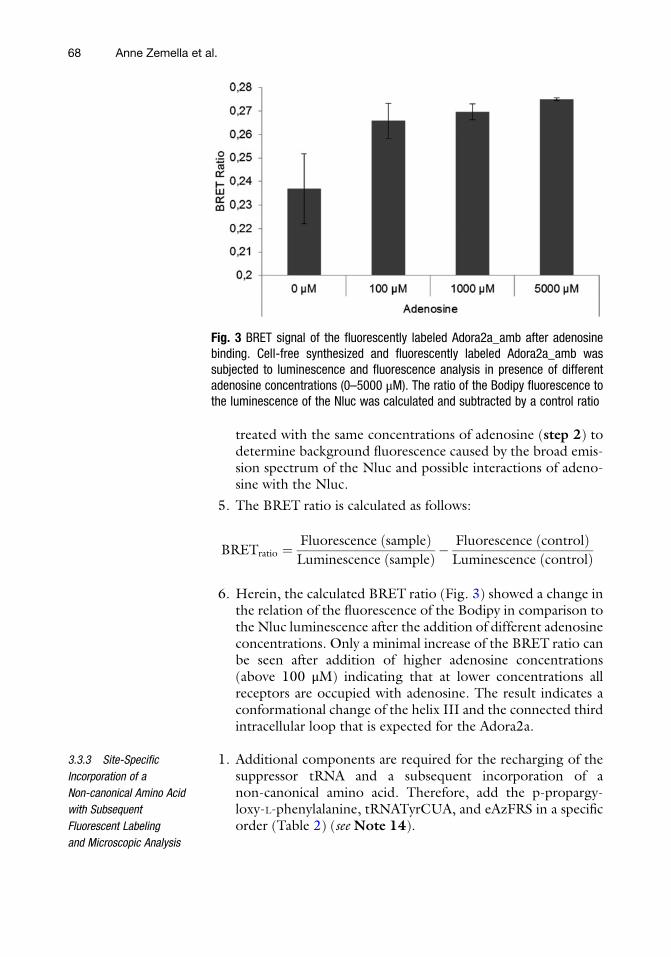
6. Herein, the calculated BRET ratio (Fig. 3) showed a change inthe relation of the fluorescence of the Bodipy in comparison tothe Nluc luminescence after the addition of different adenosineconcentrations. Only a minimal increase of the BRET ratio canbe seen after addition of higher adenosine concentrations(above 100 μM) indicating that at lower concentrations allreceptors are occupied with adenosine. The result indicates aconformational change of the helix III and the connected thirdintracellular loop that is expected for the Adora2a.
3.3.3 Site-Specific
Incorporation of a
Non-canonical Amino Acid
with Subsequent
Fluorescent Labeling
and Microscopic Analysis
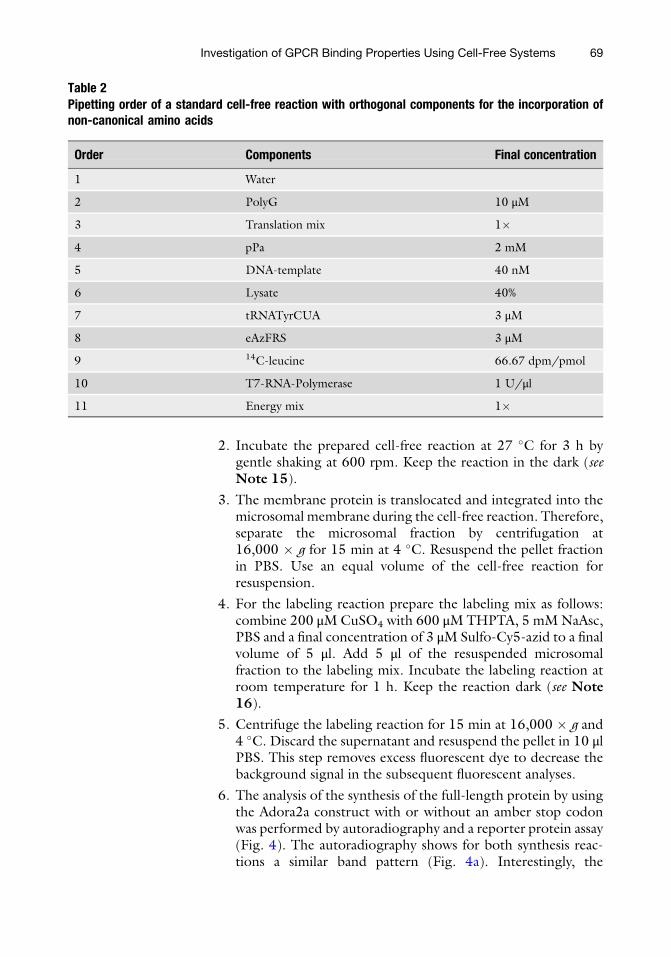
1. Additional components are required for the recharging of thesuppressor tRNA and a subsequent incorporation of anon-canonical amino acid. Therefore, add the p-propargy-loxy-L-phenylalanine, tRNATyrCUA, and eAzFRS in a specificorder (Table 2) (see Note 14).
Fig. 3 BRET signal of the fluorescently labeled Adora2a_amb after adenosinebinding. Cell-free synthesized and fluorescently labeled Adora2a_amb wassubjected to luminescence and fluorescence analysis in presence of differentadenosine concentrations (0–5000 μM). The ratio of the Bodipy fluorescence tothe luminescence of the Nluc was calculated and subtracted by a control ratio
68 Anne Zemella et al.
2. Incubate the prepared cell-free reaction at 27 �C for 3 h bygentle shaking at 600 rpm. Keep the reaction in the dark (seeNote 15).
3. The membrane protein is translocated and integrated into themicrosomal membrane during the cell-free reaction. Therefore,separate the microsomal fraction by centrifugation at16,000 � g for 15 min at 4 �C. Resuspend the pellet fractionin PBS. Use an equal volume of the cell-free reaction forresuspension.
4. For the labeling reaction prepare the labeling mix as follows:combine 200 μMCuSO4 with 600 μMTHPTA, 5 mMNaAsc,PBS and a final concentration of 3 μM Sulfo-Cy5-azid to a finalvolume of 5 μl. Add 5 μl of the resuspended microsomalfraction to the labeling mix. Incubate the labeling reaction atroom temperature for 1 h. Keep the reaction dark (see Note16).
5. Centrifuge the labeling reaction for 15 min at 16,000 � g and4 �C. Discard the supernatant and resuspend the pellet in 10 μlPBS. This step removes excess fluorescent dye to decrease thebackground signal in the subsequent fluorescent analyses.
6. The analysis of the synthesis of the full-length protein by usingthe Adora2a construct with or without an amber stop codonwas performed by autoradiography and a reporter protein assay(Fig. 4). The autoradiography shows for both synthesis reac-tions a similar band pattern (Fig. 4a). Interestingly, the
Table 2Pipetting order of a standard cell-free reaction with orthogonal components for the incorporation ofnon-canonical amino acids
Order Components Final concentration
1 Water
2 PolyG 10 μM
3 Translation mix 1�4 pPa 2 mM
5 DNA-template 40 nM
6 Lysate 40%
7 tRNATyrCUA 3 μM
8 eAzFRS 3 μM
9 14C-leucine 66.67 dpm/pmol
10 T7-RNA-Polymerase 1 U/μl
11 Energy mix 1�
Investigation of GPCR Binding Properties Using Cell-Free Systems 69
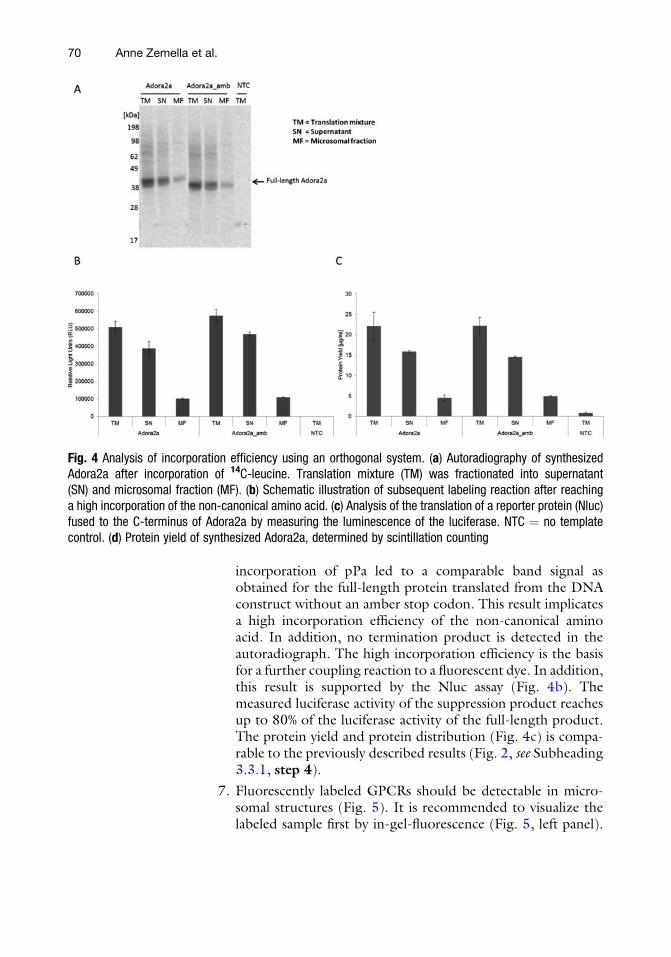
incorporation of pPa led to a comparable band signal asobtained for the full-length protein translated from the DNAconstruct without an amber stop codon. This result implicatesa high incorporation efficiency of the non-canonical aminoacid. In addition, no termination product is detected in theautoradiograph. The high incorporation efficiency is the basisfor a further coupling reaction to a fluorescent dye. In addition,this result is supported by the Nluc assay (Fig. 4b). Themeasured luciferase activity of the suppression product reachesup to 80% of the luciferase activity of the full-length product.The protein yield and protein distribution (Fig. 4c) is compa-rable to the previously described results (Fig. 2, see Subheading3.3.1, step 4).
7. Fluorescently labeled GPCRs should be detectable in micro-somal structures (Fig. 5). It is recommended to visualize thelabeled sample first by in-gel-fluorescence (Fig. 5, left panel).
Fig. 4 Analysis of incorporation efficiency using an orthogonal system. (a) Autoradiography of synthesizedAdora2a after incorporation of 14C-leucine. Translation mixture (TM) was fractionated into supernatant(SN) and microsomal fraction (MF). (b) Schematic illustration of subsequent labeling reaction after reachinga high incorporation of the non-canonical amino acid. (c) Analysis of the translation of a reporter protein (Nluc)fused to the C-terminus of Adora2a by measuring the luminescence of the luciferase. NTC ¼ no templatecontrol. (d) Protein yield of synthesized Adora2a, determined by scintillation counting
70 Anne Zemella et al.
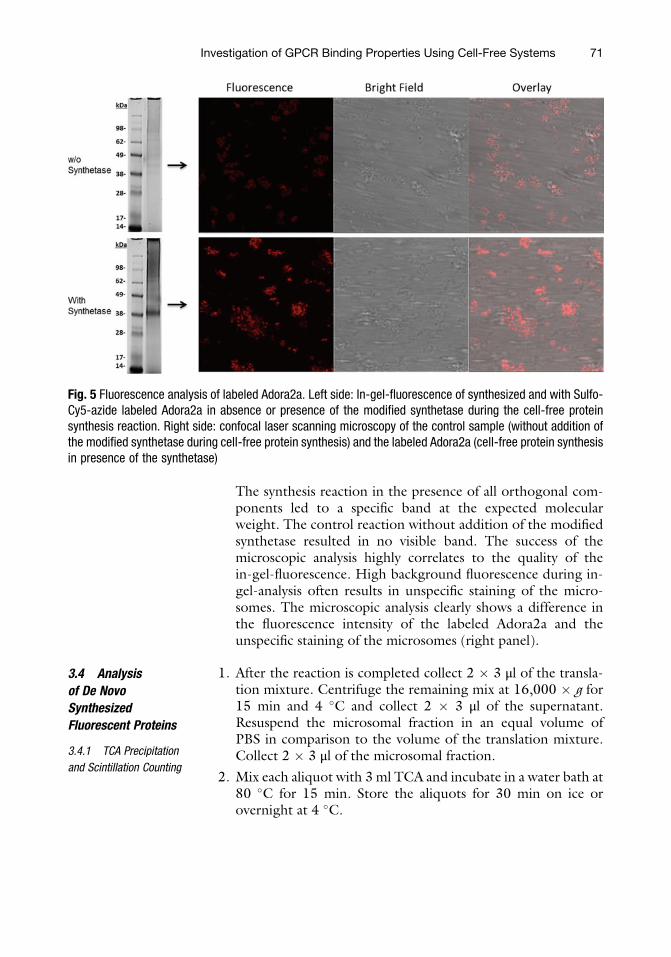
The synthesis reaction in the presence of all orthogonal com-ponents led to a specific band at the expected molecularweight. The control reaction without addition of the modifiedsynthetase resulted in no visible band. The success of themicroscopic analysis highly correlates to the quality of thein-gel-fluorescence. High background fluorescence during in-gel-analysis often results in unspecific staining of the micro-somes. The microscopic analysis clearly shows a difference inthe fluorescence intensity of the labeled Adora2a and theunspecific staining of the microsomes (right panel).
3.4 Analysis
of De Novo
Synthesized
Fluorescent Proteins
3.4.1 TCA Precipitation
and Scintillation Counting
1. After the reaction is completed collect 2 � 3 μl of the transla-tion mixture. Centrifuge the remaining mix at 16,000 � g for15 min and 4 �C and collect 2 � 3 μl of the supernatant.Resuspend the microsomal fraction in an equal volume ofPBS in comparison to the volume of the translation mixture.Collect 2 � 3 μl of the microsomal fraction.
2. Mix each aliquot with 3 ml TCA and incubate in a water bath at80 �C for 15 min. Store the aliquots for 30 min on ice orovernight at 4 �C.
Fig. 5 Fluorescence analysis of labeled Adora2a. Left side: In-gel-fluorescence of synthesized and with Sulfo-Cy5-azide labeled Adora2a in absence or presence of the modified synthetase during the cell-free proteinsynthesis reaction. Right side: confocal laser scanning microscopy of the control sample (without addition ofthe modified synthetase during cell-free protein synthesis) and the labeled Adora2a (cell-free protein synthesisin presence of the synthetase)
Investigation of GPCR Binding Properties Using Cell-Free Systems 71
3. The mixture is applied to a vacuum filtration system to separatenon-incorporated 14C-leucine from the radioactively labeledprotein. Filters with the collected protein are washed twicewith TCA and twice with acetone. Dry the filters underthe hood.
4. The filters are transferred into the scintillation vials and overlaidwith 3 ml scintillation cocktail. After an incubation time of 1 hwith gentle shaking, scintillation vessels are counted in scintil-lation counter.
3.4.2 In-Gel-
Fluorescence
and Autoradiography
1. For preparation of SDS-PAGE samples take a 5 μl aliquot(Subheading 3.3.1, steps 1–3) or 10 μl site-specifically labeledaliquot (Subheading 3.3.3, steps 1–5) of each prepared sam-ple. Add 45 μl water and 150 μl cold acetone to the 5 or 10 μlaliquots and incubate for 15 min on ice. Keep the fluorescentlylabeled samples in dark during the whole procedure. Centri-fuge the samples at 16,000 � g for 10 min at 4 �C and discardthe supernatant.
2. Dry the pellets for 1 h at 45 �C in a thermo mixer witha shaking speed of 1000 rpm.
3. Resuspend the dried pellets in 20 μl SDS-PAGE sample bufferand load the samples on a prepared 10% SDS-PAGE gel. Use aladder with fluorescently labeled bands. Run the gel.
4. Transfer the gel to the fluorescence imaging system and detectthe labeled protein bands. For Bodipy-TMR-lysine use a532 nm laser and a 580 nm emission filter. Sulfo-Cy5 can bedetected with extinction at 633 nm and emission at 670 nm.
5. Afterwards dry the gel for 60 min at 70 �C using a unigeldryer.The dried gels are exposed on a phosphorscreen for minimal3 days and read out using a multi-mode imager.
3.4.3 Confocal Laser
Scanning Microscopy
1. For confocal laser scanning microscopy use 5 μl of the fluores-cently labeled protein in the microsomal fraction and dilute thesample in 20 μl PBS. Add the mixture to a μ-Ibidi-Slide.
2. Fix the slide. Use a plan-apochromat objective with a 60� or100� magnification. Microsomal structures usually have adiameter of 1–10 μm.
3. Adjust the beam path to the coupled fluorescent dye. Standarddyes such as Cy5 and FITC usually have a preset configuration.Cy5 is excited at 633 nm and the emission is detected with along-pass filter above a wavelength of 670 nm.
4. Adjust the microscope settings (laser intensity, gain master,focus, pinhole) according to the individual sample (seeNote 17).
72 Anne Zemella et al.
4 Notes
1. Preparation of CHO lysate: The cultivation was carried out in aBiostat B-DCU II bioreactor (Sartorius Stedium BiotechGmbH) at 37 �C with a chemical defined and serum-freemedia. Cells were harvested at a density of 3.5–5 � 106 cells/ml by centrifugation at 200 � g for 5 min. The cell pellet wasresuspended in 40 mM HEPES-KOH, pH 7.5, 100 mMNaOAc and 4 mM DTT. The cell suspension was passedthrough a 20-gauge needle to mechanically disrupt the cellmembrane. Nuclei and cell debris were removed by a centrifu-gation step at 10,000 � g for 10 min. Raw lysate is applied toequilibrated Sephadex G-25 columns. Elution fractions withthe highest measured RNA concentration were pooled andtreated with micrococcal S7 nuclease to digest endogenousmRNA. The inactivation of the calcium-dependent nucleasewas performed by adding 6.7 mM EGTA to complex thecalcium ions. The lysate was further supplemented with crea-tine kinase (f.c. 100 μg/ml) to ensure the regeneration of ATPout of creatine phosphate. The prepared lysate was shock fro-zen in liquid nitrogen and stored at �80 �C.
2. The cell-free reaction in a dialysis mode is performed in atwo-chamber device. The reaction chamber (1.1 ml, red lid)and the feeding chamber (11 ml, colorless lid) are separated bya semipermeable membrane with a molecular weight cut-off of10 kDa. Whereas inhibitory byproducts such as accumulatingphosphates are removed, amino acids and energy componentsare delivered to the reaction chamber.
3. It is recommended to collect samples of the translation mix,supernatant, purification steps including flow through, wash-ing fractions and elution fractions as well as buffer exchangeprocedure and concentration. The aliquots can be diluted inSDS-PAGE sample buffer and loaded to the SDS-PAGE inorder to monitor the purity of the aminoacyl-tRNA-synthetaseduring the preparation.
4. Concentrate the synthetase to a concentration of 5 g/l toensure a minimal final concentration of 100 μM. If necessaryrepeat the concentration step.
5. The PCR product is purified with the QIAquick PCR Purifica-tion Kit and the concentration is determined by using a Nano-Drop 2000c. For further analysis prepare a 1% (w/v) agarosegel and load 1 μl of the PCR product. The expected band size is123 bps.
Investigation of GPCR Binding Properties Using Cell-Free Systems 73
6. The prepared RNA can be analyzed by gel-electrophoresis runin 1� TBE buffer (Subheading 2.2.1, item 11). Therefore,prepare a 2% (w/v) agarose gel. Mix 2 μl of the RNA with 6 μlMOPS sample buffer (Subheading 2.2.2, item 6) and load thesample to the agarose gel. Use a RNA ladder. The expectedband size is around 200 bps.
7. After centrifugation three phases are present: on top the aque-ous phase with approximately 50% of the total volume, contain-ing the RNA; a middle interphase that is nearly invisible andbelow the red phenol/chloroform phase. Try to isolate onlythe aqueous phase.
8. It is important that the components are dissolved completely toensure the correct concentration. Vortex the components andstore them in aliquots to avoid repeated thaw and freeze cycles.
9. The plasmid concentration can be varied and can be dependenton the chosen vector backbone. It is recommended to applydifferent plasmid concentrations in the range of 20–100 nM tothe cell-free protein synthesis reaction.
10. The fluorescent dye is susceptible to light. An illumination willdecrease the fluorescence intensity of the dye. Use coloredtubes or wrap the tube with aluminum foil. In addition, keepin mind that the precharged tRNACUA will address the amberstop codon whereas the precharged tRNAGAA will addressstatistically phenylalanine codons.
11. The optimal temperature for cell-free protein synthesis reactionin a CHO lysate is 30 �C. However, a temperature series isrecommended to determine the optimal conditions for anindividual protein in terms of folding and activity. TheAdora2a-Nluc construct showed the highest Nluc activity at27 �C.
12. It is recommended to analyze the incorporation efficiency ofthe non-canonical amino acid. With a low efficiency thesubsequent labeling reaction will yield as well in a low amountof labeled protein. Therefore, two different methods can beutilized.
(a) Adding a reporter protein downstream of the amber stopcodon. The reporter protein will only be translated if theamber stop codon is addressed by the tRNA and thenon-canonical amino acid is transferred to the polypeptidechain. The intensity of the reporter protein signal isdirectly correlated to the amount of full-length proteinand in conclusion to the incorporation efficiency. A com-parison to a DNA construct without amber stop codon ispossible.
74 Anne Zemella et al.
(b) Determine the amount of full-length protein with autora-diography. If the termination product has an adequateamount of incorporated 14C-leucine during the cell-freeprotein synthesis reaction and a detectable size, an addi-tional band should be visible in the autoradiography. Theratio of full-length product and termination product canbe calculated.
13. It is recommended to evaluate different agonist concentrationsbecause at a defined concentration the binding sites of the cell-free synthesized Adora2a should be completely occupiedresulting in a saturation effect in the BRET signal. The satura-tion effect supports the specific conformational rearrangementafter ligand binding.
14. The non-canonical amino acid is solubilized in 0.5 M NaOH.The alkaline pH of NaOH will shift the pH of the lysate thatmight result in an inactivation of enzymes involved in proteinsynthesis. Therefore, dilute the ncAA in translation mix, waterand components that are not affected by an alkaline pH.
15. Reactive groups of ncAA are often instable and susceptible toillumination. If the reactive group is inert a following couplingto a fluorescent dye is not possible. Therefore, keep the ncAAin the dark by using colored or wrapped tubes.
16. Copper has a toxic effect on proteins due to oxidative damage,but it is necessary as catalyst for the copper(I)-catalyzed alkyne-azide cycloaddition (CuAAC). It is recommended to use dif-ferent copper concentrations for the labeling reaction. For theAdora2a_amb construct we have seen a highest labeling effi-ciency with 200 μM copper. The lowest copper concentrationresulting in a detectable fluorescent band was 50 μM. Keep inmind that the concentration of THPTA has to be adjusted aswell (threefold concentration of THPTA to CuSO4). In addi-tion, it is recommended to adjust the incubation time of thelabeling reaction. In general, CuAAC is a fast and efficient clickreaction. A decrease in incubation time might enhance proteinsactivity.
17. The same microscopic settings that are chosen for the fluores-cently labeled sample should be applied to the negative controlto exclude an unspecific labeling of microsomal structures.Fluorescent dyes are usually highly hydrophobic and tend tostick unspecific to lipid membranes. It is recommended toevaluate the unspecific binding of different dyes to figure outthe most suitable dye for certain applications. For our images apinhole of 1 Airy unit (118 μm), laser intensities of 22% (brightfield) and 8% (fluorescence) resulted in the optimal recordingof fluorescently labeled Adora2a.
Investigation of GPCR Binding Properties Using Cell-Free Systems 75
Acknowledgments
This work is supported by the European Regional DevelopmentFund (EFRE), the German Ministry of Education and Research(BMBF, No. 031B0078A), and the German Research Foundation(DFG Priority Programme 1623).
References
1. Sarramegn V, Muller I, Milon A et al (2006)Recombinant G protein-coupled receptorsfrom expression to renaturation: a challengetowards structure. Cell Mol Life Sci 63(10):1149–1164. https://doi.org/10.1007/s00018-005-5557-6
2. Serebryany E, Zhu GA, Yan EC (2012) Artifi-cial membrane-like environments for in vitrostudies of purified G-protein coupled recep-tors. Biochim Biophys Acta 1818(2):225–233. https://doi.org/10.1016/j.bbamem.2011.07.047
3. Andrell J, Tate CG (2012) Overexpression ofmembrane proteins in mammalian cells forstructural studies. Mol Membr Biol 30(1-2):52–63. https://doi.org/10.3109/09687688.2012.703703
4. Jamshad M, Charlton J, Lin Y et al (2014)G-protein coupled receptor solubilization andpurification for biophysical analysis and func-tional studies, in the total absence of detergent.Biosci Rep 35(2):e00188. https://doi.org/10.1042/BSR20140171
5. Brodel AK, Sonnabend A, Roberts LO et al(2013) IRES-mediated translation of mem-brane proteins and glycoproteins in eukaryoticcell-free systems. PLoS One 8(12):e82234.https://doi.org/10.1371/journal.pone.0082234
6. Zemella A, Thoring L, Hoffmeister C et al(2015) Cell-free protein synthesis: pros andcons of prokaryotic and eukaryotic systems.Chembiochem 16(17):2420–2431. https://doi.org/10.1002/cbic.201500340
7. Thoring L, Dondapati SK, Stech M et al(2017) High-yield production of “difficult-to-express” proteins in a continuous exchangecell-free system based on CHO cell lysates. SciRep 7:11710. https://doi.org/10.1038/s41598-017-12188-8
8. Daggett KA, Sakmar TP (2011) Site-specificin vitro and in vivo incorporation of molecularprobes to study G-protein-coupled receptors.Mol Divers 15(3):392–398. https://doi.org/10.1016/j.cbpa.2011.03.010
9. Quast RB, Mrusek D, Hoffmeister C et al(2015) Cotranslational incorporation ofnon-standard amino acids using cell-free pro-tein synthesis. FEBS Lett 589(15):1703–1712.https://doi.org/10.1016/j.febslet.2015.04.041
10. Quast RB, Ballion B, StechM et al (2016) Cell-free synthesis of functional human epidermalgrowth factor receptor: investigation of ligand-independent dimerization in Sf21 microsomalmembranes using non-canonical amino acids.Sci Rep 6:34048
11. Chin JW, Cropp TA, Anderson JC et al (2003)An expanded eukaryotic genetic code. Science301(5635):964. https://doi.org/10.1126/science.1084772
12. Takimoto JK, Adams KL, Xiang Z et al (2009)Improving orthogonal tRNA-synthetase rec-ognition for efficient unnatural amino acidincorporation and application in mammaliancells. Mol BioSyst 5(9):931–934. https://doi.org/10.1039/B904228H
13. Edwards H, Schimmel P (1990) A bacterialamber suppressor in Saccharomyces cerevisiaeis selectively recognized by a bacterialaminoacyl-tRNA synthetase. Mol Cell Biol 10(4):1633–1641
14. Aren W, Dierckx Rudi AJO, Xiaoyun Z et al(2017) Potential therapeutic applications ofadenosine A2A receptor ligands and opportu-nities for A2A receptor imaging. Med Res Rev38(1):5–56. https://doi.org/10.1002/med.21432
15. Chen J, Eltzschig HK, Fredholm BB (2013)Adenosine receptors as drug targets–what arethe challenges? Nat Rev Drug Discov 12:265
16. Hoffmann C, Gaietta G, Bunemann M et al(2005) A FlAsH-based FRET approach todetermine G protein–coupled receptor activa-tion in living cells. Nat Methods 2:171
17. Meritxell C, Javier B, Daniel M et al (2003)Homodimerization of adenosine A2A recep-tors: qualitative and quantitative assessmentby fluorescence and bioluminescence energytransfer. J Neurochem 88(3):726–734.
76 Anne Zemella et al.
https://doi.org/10.1046/j.1471-4159.2003.02200.x
18. Bissantz C (2003) Conformational changes ofG protein-coupled receptors during their acti-vation by agonist binding. J Recept SignalTransduct Res 23(2-3):123–153. https://doi.org/10.1081/RRS-120025192
19. Brodel AK,Wustenhagen DA, Kubick S (2015)Cell-free protein synthesis systems derivedfrom cultured mammalian cells. In: Owens RJ
(ed) Structural proteomics: high-throughputmethods. Springer New York, New York, NY,pp 129–140
20. Thoring L, Wustenhagen DA, Borowiak Met al (2016) Cell-free systems based on chocell lysates: optimization strategies, synthesisof “difficult-to-express” proteins and futureperspectives. PLoS One 11(9):e0163670.https://doi.org/10.1371/journal.pone.0163670
Open Access This chapter is licensed under the terms of the Creative Commons Attribution 4.0 InternationalLicense (http://creativecommons.org/licenses/by/4.0/), which permits use, sharing, adaptation, distributionand reproduction in any medium or format, as long as you give appropriate credit to the original author(s) and thesource, provide a link to the Creative Commons license and indicate if changes were made.
The images or other third party material in this chapter are included in the chapter’s Creative Commons license,unless indicated otherwise in a credit line to the material. If material is not included in the chapter’s CreativeCommons license and your intended use is not permitted by statutory regulation or exceeds the permitted use,you will need to obtain permission directly from the copyright holder.
Investigation of GPCR Binding Properties Using Cell-Free Systems 77