chapter 4chapter 4 current state of ict ccw3_a8224d04.indd 62w3_a8224d04.indd 62 22012/09/19...
TRANSCRIPT
Section 1ICT industry trends1. Economic size of the ICT in-
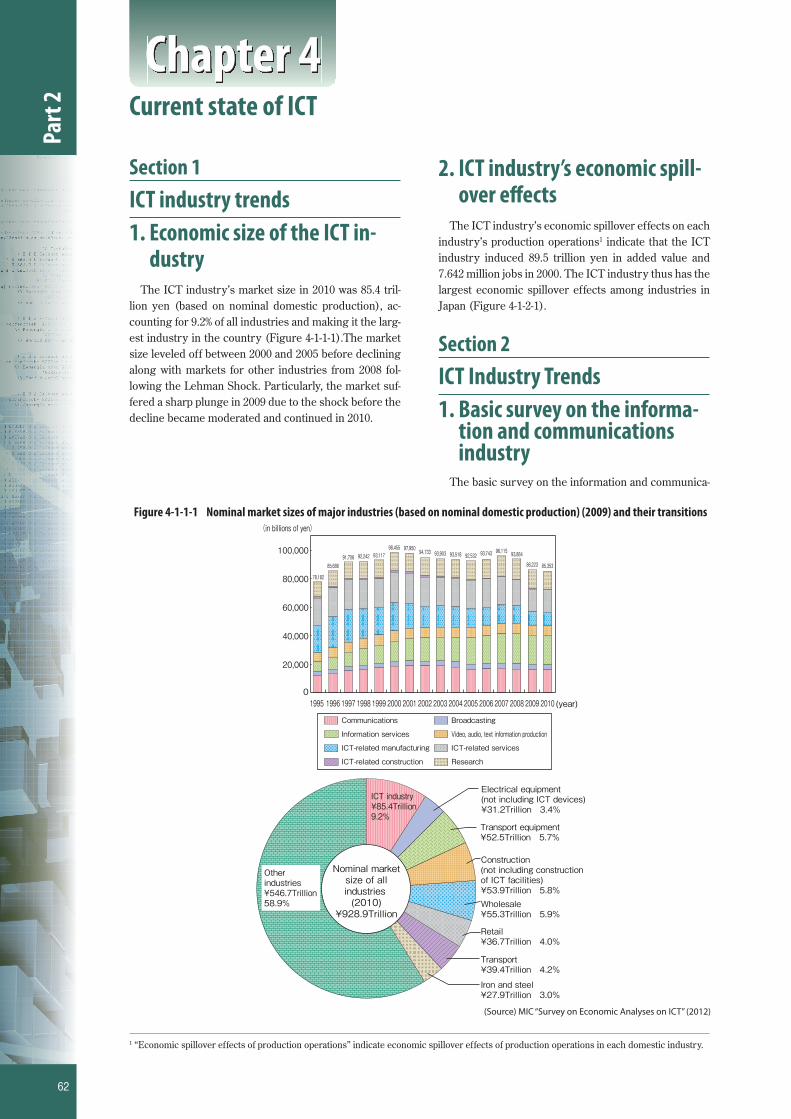
dustryThe ICT industry’s market size in 2010 was 85.4 tril-
lion yen (based on nominal domestic production), ac-counting for 9.2% of all industries and making it the larg-est industry in the country (Figure 4-1-1-1).The market size leveled off between 2000 and 2005 before declining along with markets for other industries from 2008 fol-lowing the Lehman Shock. Particularly, the market suf-fered a sharp plunge in 2009 due to the shock before the decline became moderated and continued in 2010.
2. ICT industry’s economic spill-over eff ects
The ICT industry’s economic spillover effects on each industry’s production operations1 indicate that the ICT industry induced 89.5 trillion yen in added value and 7.642 million jobs in 2000. The ICT industry thus has the largest economic spillover effects among industries in Japan (Figure 4-1-2-1).
Section 2ICT Industry Trends1. Basic survey on the informa-
tion and communications industry
The basic survey on the information and communica-
1 “Economic spillover effects of production operations” indicate economic spillover effects of production operations in each domestic industry.
Figure 4-1-1-1 Nominal market sizes of major industries (based on nominal domestic production) (2009) and their transitions (in billions of yen)
85,353
78,182
85,68691,706 93,11792,242
98,455 97,950 94,733 93,903 93,518 93,884
86,223
96,11593,74392,532
(year)20102009200820072006200520042003200220012000199919981997199619950
20,000
40,000
60,000
80,000
100,000
ResearchICT-related construction
ICT-related servicesICT-related manufacturing
Video, audio, text information productionInformation services
BroadcastingCommunications
ICT industry¥85.4Trillion9.2%
Electrical equipment(not including ICT devices)¥31.2Trillion 3.4%
Construction(not including constructionof ICT facilities)¥53.9Trillion 5.8%Wholesale¥55.3Trillion 5.9%
Transport¥39.4Trillion 4.2%
Retail¥36.7Trillion 4.0%
Iron and steel¥27.9Trillion 3.0%
Transport equipment¥52.5Trillion 5.7%
Nominal marketsize of allindustries (2010)
¥928.9Trillion
Otherindustries¥546.7Trillion58.9%
(Source) MIC “Survey on Economic Analyses on ICT” (2012)
62
Part
2Chapter 4
Current state of ICT
CW3_A8224D04.indd 62CW3_A8224D04.indd 62 2012/09/19 16:11:182012/09/19 16:11:18プロセスシアンプロセスシアンプロセスマゼンタプロセスマゼンタプロセスイエロープロセスイエロープロセスブラックプロセスブラック

tions industry is an ordinary statistical survey (started in 2010) that the MIC and the Ministry of Economy, Trade and Industry jointly conduct under the Statistics Act to specify trends of enterprises belonging to the ICT industry as Large Category G of the Japan Standard In-dustry Classifi cation and obtain basic data for ICT indus-try policies.
(1) Status of SalesThe ICT industry’s sales in FY 2010 totaled 41.3861
trillion yen. The telecommunications sector accounted
for the largest share of the industry’s sales, followed by the software sector and the data processing and provid-ing services sector. The three sectors capture 78.0% of the total ICT industry sales. The share of the total sales was 39.3% (up 1.5 percentage points from the previous year) for the telecommunications sector and 25.0% (up 2.5 points) for the software sector (Figure 4-2-1-1).
(2) BreakdownA breakdown of ICT industry enterprises by capital
size indicate that enterprises capitalized at less than 100
(Source) MIC “Survey on Economic Analyses on ICT” (2012)
Figure 4-1-2-1 Transitions in economic spillover eff ects (induced added value and jobs) of major industries’ production operations
(Trillion yen)
(year)
(10 thousand)
(year)
[Trends in the amount of production induced] [Trends in the number of jobs created]
0
100
200
300
400
500
600
700
800
900
1,000
2010200520001995
89.583.7
75.9
57.0
2010200520001995
764.2
730.3769.3653.6
0
10
20
30
40
50
60
70
80
90
100
ICT industry Iron and steelElectrical equipment (not including ICT devices)Transport equipmentConstruction (not including construction of ICT facilities)
RetailWholesale Transport
ICT industry Iron and steelElectrical equipment (not including ICT devices)Transport equipmentConstruction (not including construction of ICT facilities)
RetailWholesale Transport
Figure 4-2-1-1 ICT industry sales
(Source) MIC/METI “2011 Basic survey on the Information and Communications industry ”
Telecommunicationservice operators(407)162,57639.3%
Software service providers (2,687)103,627 25.0%
Informationprocessing
service providers(1,554)
56,591 13.7%( ) : number of companies,unit: one hundred million
Privatebroadcasters (380)22,787 5.5%
Internet-relatedservice
providers (674)17,006 4.1%
Newspaper companies (115)16,130 3.9%
Publication companies (320)14,671 3.5%
Film makers and distributers (462)8,137 2.0%
Cable broadcasting service providers (229)
4,628 1.1%
Advertising agencies (111)2,332 0.6%
Audio program producers (71)968 0.2%
Miscellaneouscommunicationservice providers3,716 0.9%
Service providers related to video, audio,or text information (104)691 0.2%
FY 2010 sales intelecommunication industries41,386,100million yen
Note: “Primary sales” refers to sales in the primary activities of a company. For example, the primary sales of a telecommunication company are the sales in their activities in telecommunication out of their entire sales.
Note: A miscellaneous communication service provider refers to a company who chose “miscellaneous” for their primary business in their response to the questionnaire.
63
Part
2
CW3_A8224D04.indd 63CW3_A8224D04.indd 63 2012/09/19 16:11:422012/09/19 16:11:42プロセスシアンプロセスシアンプロセスマゼンタプロセスマゼンタプロセスイエロープロセスイエロープロセスブラックプロセスブラック
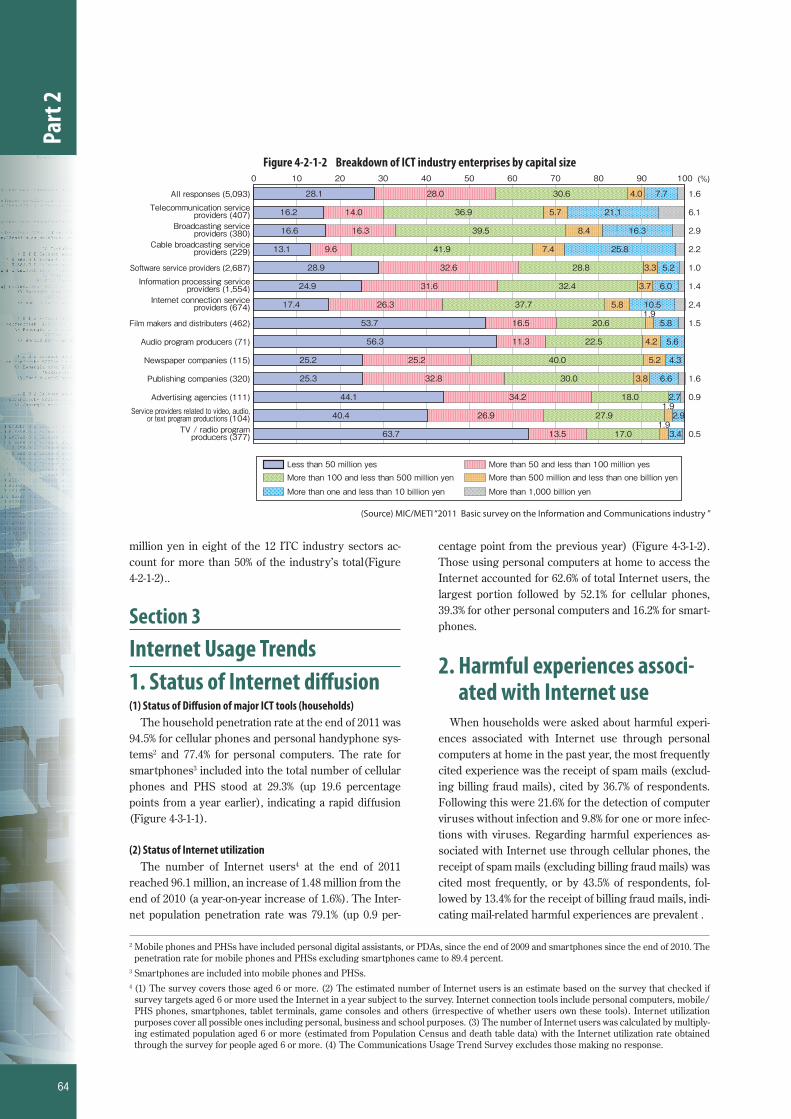
million yen in eight of the 12 ITC industry sectors ac-count for more than 50% of the industry’s total(Figure 4-2-1-2)..
Section 3Internet Usage Trends1. Status of Internet diff usion(1) Status of Diff usion of major ICT tools (households)
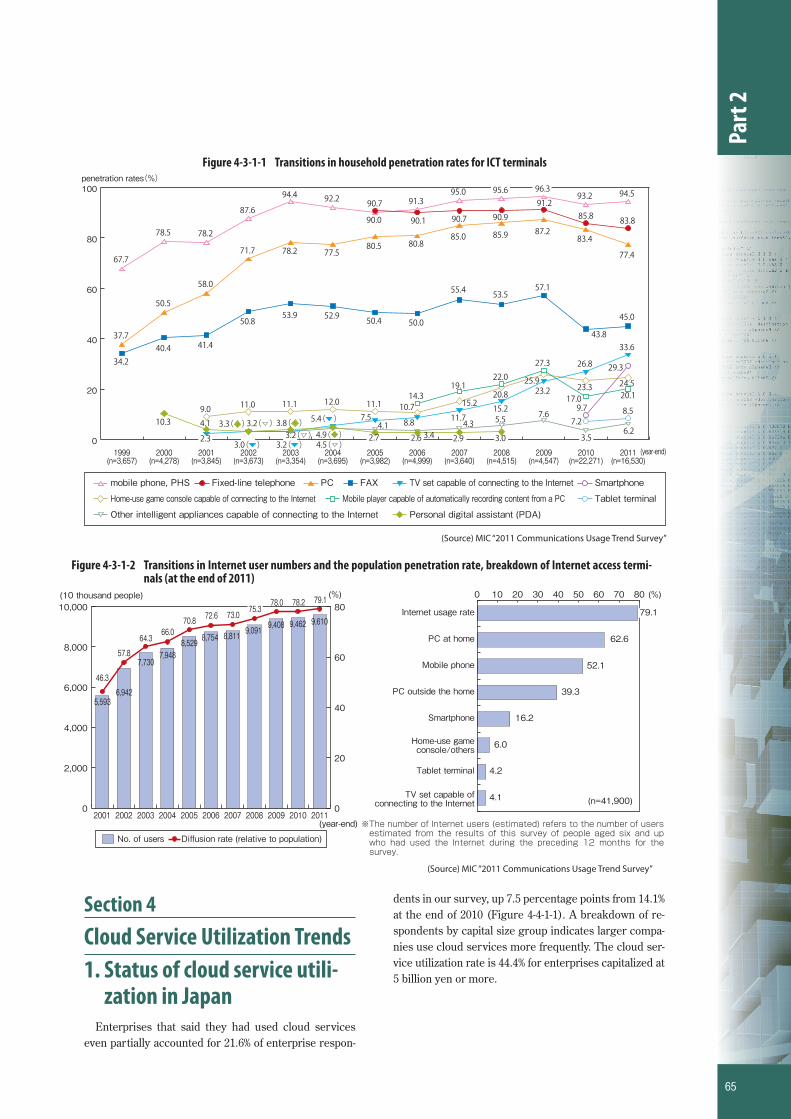
The household penetration rate at the end of 2011 was 94.5% for cellular phones and personal handyphone sys-tems2 and 77.4% for personal computers. The rate for smartphones3 included into the total number of cellular phones and PHS stood at 29.3% (up 19.6 percentage points from a year earlier), indicating a rapid diffusion (Figure 4-3-1-1).
(2) Status of Internet utilizationThe number of Internet users4 at the end of 2011
reached 96.1 million, an increase of 1.48 million from the end of 2010 (a year-on-year increase of 1.6%). The Inter-net population penetration rate was 79.1% (up 0.9 per-
centage point from the previous year) (Figure 4-3-1-2). Those using personal computers at home to access the Internet accounted for 62.6% of total Internet users, the largest portion followed by 52.1% for cellular phones, 39.3% for other personal computers and 16.2% for smart-phones.
2. Harmful experiences associ-ated with Internet use
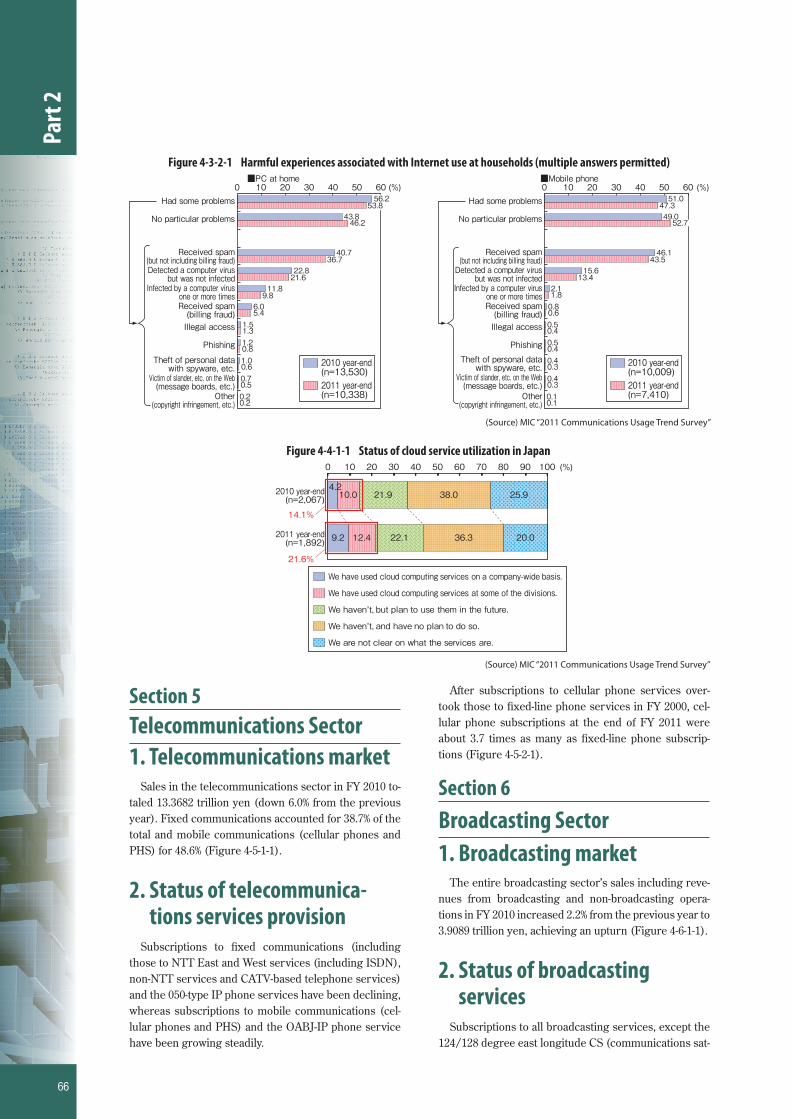
When households were asked about harmful experi-ences associated with Internet use through personal computers at home in the past year, the most frequently cited experience was the receipt of spam mails (exclud-ing billing fraud mails), cited by 36.7% of respondents. Following this were 21.6% for the detection of computer viruses without infection and 9.8% for one or more infec-tions with viruses. Regarding harmful experiences as-sociated with Internet use through cellular phones, the receipt of spam mails (excluding billing fraud mails) was cited most frequently, or by 43.5% of respondents, fol-lowed by 13.4% for the receipt of billing fraud mails, indi-cating mail-related harmful experiences are prevalent .
2 Mobile phones and PHSs have included personal digital assistants, or PDAs, since the end of 2009 and smartphones since the end of 2010. The penetration rate for mobile phones and PHSs excluding smartphones came to 89.4 percent.
3 Smartphones are included into mobile phones and PHSs.4 (1) The survey covers those aged 6 or more. (2) The estimated number of Internet users is an estimate based on the survey that checked if
survey targets aged 6 or more used the Internet in a year subject to the survey. Internet connection tools include personal computers, mobile/PHS phones, smartphones, tablet terminals, game consoles and others (irrespective of whether users own these tools). Internet utilization purposes cover all possible ones including personal, business and school purposes. (3) The number of Internet users was calculated by multiply-ing estimated population aged 6 or more (estimated from Population Census and death table data) with the Internet utilization rate obtained through the survey for people aged 6 or more. (4) The Communications Usage Trend Survey excludes those making no response.
(%)
28.1
16.2
16.6
13.1
28.9
24.9
17.4
53.7
56.3
25.2
25.3
44.1
40.4
63.7
28.0
14.0
16.3
9.6
32.6
31.6
26.31.9
4.2
25.2
32.8
1.9
1.9
30.6
36.9
39.5
41.9
28.8
32.4
37.7
16.5
11.3
40.0
30.0
34.2
26.9
13.5
4.0
5.7
8.4
7.4
3.3
3.7
5.8
20.6
22.5
5.2
3.8
18.0
27.9
17.0
7.7
21.1
16.3
25.8
5.2
6.0
10.5
5.8
5.6
4.3
6.6
2.7
2.9
3.4
1.6
6.1
2.9
2.2
1.0
1.4
2.4
1.5
1.6
0.9
0.5
0 10 20 30 40 50 60 70 80 90 100
TV / radio programproducers (377)
Service providers related to video, audio,or text program productions (104)
Advertising agencies (111)
Publishing companies (320)
Newspaper companies (115)
Audio program producers (71)
Film makers and distributers (462)
Internet connection serviceproviders (674)
Information processing serviceproviders (1,554)
Software service providers (2,687)
Cable broadcasting serviceproviders (229)
Broadcasting serviceproviders (380)
Telecommunication serviceproviders (407)
All responses (5,093)
More than one and less than 10 billion yen
More than 50 and less than 100 million yes
More than 1,000 billion yen
More than 100 and less than 500 million yen More than 500 million and less than one billion yenLess than 50 million yes
Figure 4-2-1-2 Breakdown of ICT industry enterprises by capital size
(Source) MIC/METI “2011 Basic survey on the Information and Communications industry ”
64
Part
2
CW3_A8224D04.indd 64CW3_A8224D04.indd 64 2012/09/19 16:11:542012/09/19 16:11:54プロセスシアンプロセスシアンプロセスマゼンタプロセスマゼンタプロセスイエロープロセスイエロープロセスブラックプロセスブラック
Section 4Cloud Service Utilization Trends1. Status of cloud service utili-
zation in JapanEnterprises that said they had used cloud services
even partially accounted for 21.6% of enterprise respon-
dents in our survey, up 7.5 percentage points from 14.1% at the end of 2010 (Figure 4-4-1-1). A breakdown of re-spondents by capital size group indicates larger compa-nies use cloud services more frequently. The cloud ser-vice utilization rate is 44.4% for enterprises capitalized at 5 billion yen or more.
(Source) MIC “2011 Communications Usage Trend Survey”
Figure 4-3-1-2 Transitions in Internet user numbers and the population penetration rate, breakdown of Internet access termi-nals (at the end of 2011)
(10 thousand people) (%)
5,5936,942
7,7307,948
8,529 8,754 8,811
9,462 9,6109,091
9,40864.3
46.3
57.8
66.070.8 72.6 73.0
79.178.278.075.3
(year-end)
0
2,000
4,000
6,000
8,000
10,000
201120102009200820072006200520042003200220010
20
40
60
80
No. of users Diffusion rate (relative to population)
(%)0 10 20 30 40 50 60 70 80
TV set capable ofconnecting to the Internet
Tablet terminal
Home-use gameconsole/others
Smartphone
PC outside the home
Mobile phone
PC at home
Internet usage rate 79.1
(n=41,900)
62.6
52.1
39.3
16.2
6.0
4.2
4.1
※The number of Internet users (estimated) refers to the number of users estimated from the results of this survey of people aged six and up who had used the Internet during the preceding 12 months for the survey.
Figure 4-3-1-1 Transitions in household penetration rates for ICT terminals
(Source) MIC “2011 Communications Usage Trend Survey”
penetration rates(%)
0
20
40
60
80
100
2011(n=16,530)
2010(n=22,271)
2009(n=4,547)
2008(n=4,515)
2007(n=3,640)
2006(n=4,999)
2005(n=3,982)
2004(n=3,695)
2003(n=3,354)
2002(n=3,673)
2001(n=3,845)
2000(n=4,278)
1999(n=3,657)
(year-end)
34.240.4 41.4
50.853.9 52.9 50.4 50.0
55.4 53.557.1
43.8
45.0
67.7
78.5 78.2
87.6
94.4 92.2
90.0
91.395.0 95.6 96.3
93.2 94.5
37.7
50.5
58.0
71.7 78.2 77.580.5 80.8
85.0 85.9 87.283.4
77.4
4.13.4
4.3 5.5 7.6
3.56.2
14.319.1
22.0
27.3
17.0 20.1
90.7
90.1 90.7 90.9
91.285.8 83.8
9.7
29.3
7.28.5
10.3 4.1
2.7 2.6 2.9 3.0
9.0 11.0 11.1 12.0 11.1 10.7 15.220.8
25.923.3 24.5
2.3
7.5 8.8 11.715.2
23.2
26.8
33.6
Tablet terminalHome-use game console capable of connecting to the Internet Mobile player capable of automatically recording content from a PC
Other intelligent appliances capable of connecting to the Internet Personal digital assistant (PDA)
mobile phone, PHS SmartphoneTV set capable of connecting to the InternetPC FAXFixed-line telephone
3.3( ) 3.8( )4.9( )
3.0( ) 3.2( )
5.4( )
4.5( )3.2( )
3.2( )
65
Part
2
CW3_A8224D04.indd 65CW3_A8224D04.indd 65 2012/09/19 16:12:062012/09/19 16:12:06プロセスシアンプロセスシアンプロセスマゼンタプロセスマゼンタプロセスイエロープロセスイエロープロセスブラックプロセスブラック
Section 5Telecommunications Sector1. Telecommunications market
Sales in the telecommunications sector in FY 2010 to-taled 13.3682 trillion yen (down 6.0% from the previous year). Fixed communications accounted for 38.7% of the total and mobile communications (cellular phones and PHS) for 48.6% (Figure 4-5-1-1).
2. Status of telecommunica-tions services provision
Subscriptions to fi xed communications (including those to NTT East and West services (including ISDN), non-NTT services and CATV-based telephone services) and the 050-type IP phone services have been declining, whereas subscriptions to mobile communications (cel-lular phones and PHS) and the OABJ-IP phone service have been growing steadily.
After subscriptions to cellular phone services over-took those to fi xed-line phone services in FY 2000, cel-lular phone subscriptions at the end of FY 2011 were about 3.7 times as many as fi xed-line phone subscrip-tions (Figure 4-5-2-1).
Section 6Broadcasting Sector1. Broadcasting market
The entire broadcasting sector’s sales including reve-nues from broadcasting and non-broadcasting opera-tions in FY 2010 increased 2.2% from the previous year to 3.9089 trillion yen, achieving an upturn (Figure 4-6-1-1).
2. Status of broadcastingservices
Subscriptions to all broadcasting services, except the 124/128 degree east longitude CS (communications sat-
Figure 4-3-2-1 Harmful experiences associated with Internet use at households (multiple answers permitted)
(Source) MIC “2011 Communications Usage Trend Survey”
■PC at home ■Mobile phone(%)(%)
51.047.3
56.253.8
49.052.7
43.846.2
46.143.5
40.736.7
15.613.4
22.821.6
2.11.8
11.89.8
0.80.6
6.05.4
0.50.4
1.51.3
0.50.4
1.20.8
0.40.3
1.00.6
0.40.3
0.70.5
0.10.1
0.20.2
0 10 20 30 40 50 60 0 10 20 30 40 50 60
Other(copyright infringement, etc.)
Victim of slander, etc. on the Web(message boards, etc.)
Theft of personal datawith spyware, etc.
Phishing
Illegal access
Received spam (billing fraud)
Infected by a computer virusone or more times
Detected a computer virusbut was not infected
Received spam (but not including billing fraud)
No particular problems
Had some problems
2010 year-end(n=13,530)2011 year-end(n=10,338)
2010 year-end(n=10,009)2011 year-end(n=7,410)
Figure 4-4-1-1 Status of cloud service utilization in Japan
(Source) MIC “2011 Communications Usage Trend Survey”
(%)
10.04.2
12.49.2
21.9
22.1
38.0
36.3
25.9
20.0
0 10 20 30 40 50 60 70 80 90 100
2011 year-end(n=1,892)
2010 year-end(n=2,067)
We haven’t, and have no plan to do so.
We are not clear on what the services are.
We haven’t, but plan to use them in the future.
We have used cloud computing services at some of the divisions.
We have used cloud computing services on a company-wide basis.
14.1%
21.6%
66
Part
2
CW3_A8224D04.indd 66CW3_A8224D04.indd 66 2012/09/19 16:12:212012/09/19 16:12:21プロセスシアンプロセスシアンプロセスマゼンタプロセスマゼンタプロセスイエロープロセスイエロープロセスブラックプロセスブラック

ellite) digital broadcast, increased in FY 2010 (Figure 4-6-2-1).
Section 7Radio Utilization1. Status of radio utilization
and the number of radiostations
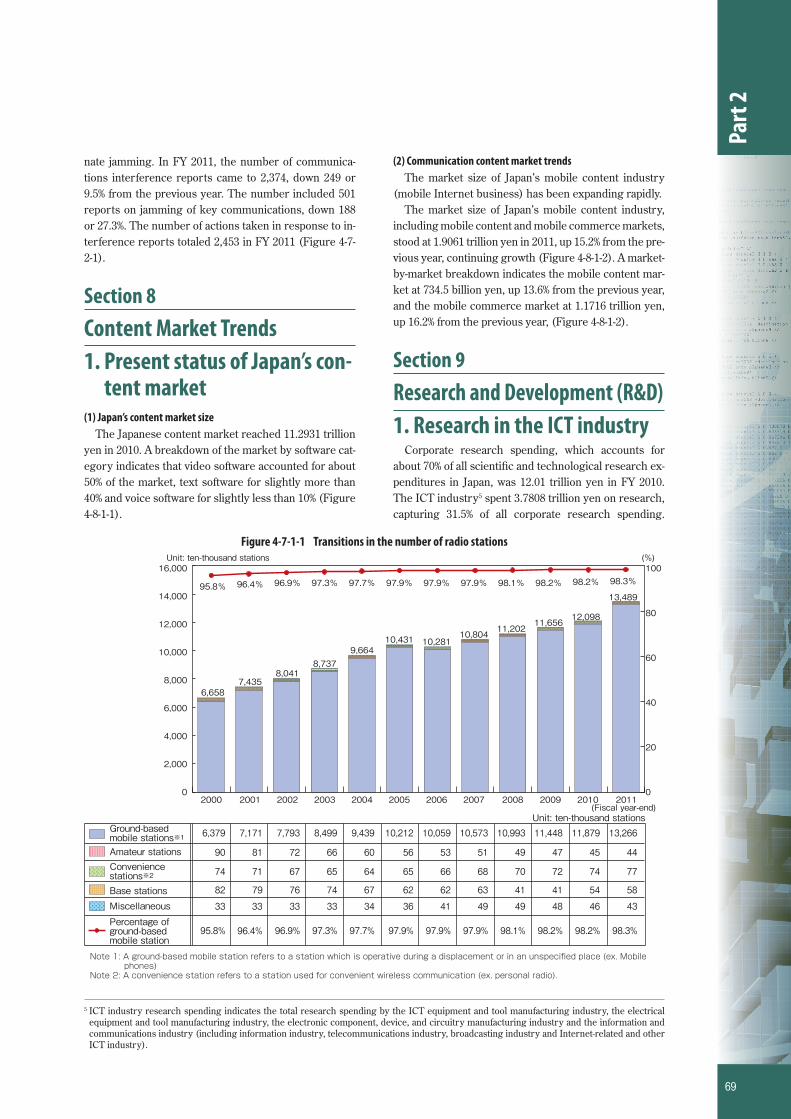
The number of radio stations (excluding PHS and wireless LAN terminals and other radio stations for which no license is required) at the end of FY 2011 in-creased 11.5% from a year earlier to 134.89 million, in-
cluding 132.66 million land mobile stations (such as cel-lular phones), up 11.7%. The land mobile stations’ share of the total number of radio stations was as high as 98.3%. The number of amateur stations declined to 440,000 (Figure 4-7-1-1).
2. Protection of the electro-magnetic environment
The radio utilization environment has been kept good thanks to the implementation of measures against jam-ming of key communications and the crackdown on ille-gal radio stations. Since FY 2010, we have operated a system to accept reports on jamming of key communica-tions over 24 hours a day in an effort to promptly elimi-
Figure 4-5-2-1 Transitions in subscriptions to telecommunications services
Prepared on the basis of the MIC “Status of Telecommunications Service Subscriptions” (March 31, 2012)
(10,000 subscriptions)
(Fiscal year)
11,630
4,334
1,453
864
11,205
4,732
906
1,1162,096
753
6,196
7,4828,112
8,6659,147
9,64810,170
3,595
13,276
1,790
790
3,957
12,329
6,678
6,133
8
1
524
4
6,077 6,0225,961 5,808 5,515
1,027
421
10,734
5,123
978
776
1,003
142
812
19201120102009200820072006200520042003200220012000
0
1,500
3,500
5,500
7,500
9,500
11,500
13,500
Note: as for the fixed-line, the number of subscribers is a sum of the subscribers of East/ West NTT (including subscribers of ISDN service), direct-line services, and CATV-phone services
Note: as for the mobile communication, the number of subscribersis a sum of subscribers of mobile phones and PHS.Note: As for OABJ-number type and 050-number type IP phone, the numbers for FY 2002 and 2003 are based on the
poll-responses from operators, while the numbers for FY2004 and later are based on the operators’ reports submitted following the Regulations of Telecommunication Operators’ Report Submission.
Note: The numbers for the years before 2002 are estimated based on the detailed analysis.
Mobile communications
Fixedcommunications
050 IP phones 0ABJ IP phones
Prepared on the basis of MIC/METI “2011 Basic Survey on the ICT Industry”Note: Data for FY 2005 were prepared on the basis of the MIC “Basic Survey on the Communications and Broadcasting Industry”
Figure 4-5-1-1 Transitions in telecommunications sector sales, and sales shares for fi xed communications and mobile communi-cations
(in 100 millions of yen)
(Fiscal year)
144,055133,682
142,182153,063145,537 151,036
201020092008200720062005
Comparisons must be made with caution, as sales are the simple sum of figures from all responding carriers and each year the number of responding carriers changes
0
30,000
60,000
90,000
120,000
150,000
180,0000 20 40 60 80 100 (%)
(Fiscal year)35.7 51.4 12.9
37.3 50.6 12.1
40.1 49.0 10.9
41.8 48.3 9.9
40.1 47.2 12.7
38.7 48.6 12.72010
2009
2008
2007
2006
2005
Fixed communications Mobile communications others
67
Part
2
CW3_A8224D04.indd 67CW3_A8224D04.indd 67 2012/09/19 16:12:332012/09/19 16:12:33プロセスシアンプロセスシアンプロセスマゼンタプロセスマゼンタプロセスイエロープロセスイエロープロセスブラックプロセスブラック

Figure 4-6-1-1 Transitions in the broadcasting sector’s market size (total sales) and a breakdown
Prepared on the basis of MIC materials and the NHK Yearbook for each fi scal year
Terrestrial-based broadcasters (Community broadcasts included in total above)Satellite-based broadcasters*1
Cable TV broadcasters*2
NHK*3TOTAL
(Fiscal year) 2002 20102003 2004 2005 2006 2007(Unit: 100 millions of yen)
2009200824,8631392,7693,0766,75037,355
25,2291412,9953,3306,80338,356
26,1531403,1583,5336,85539,698
26,1381403,4143,8506,74940,152
26,091144※5
3,5254,0506,75640,422
25,847148※5
3,7374,7466,84841,178
24,493150※5
3,9054,6676,62439,689
22,574123※5
3,8875,1346,65838,254
22,6551164,1855,4376,81239,089
200125,9601372,3352,7186,67637,689
200026,4661251,8912,4636,55937,378
199924,823ー 1,6072,2446,45035,124
199824,488ー 1,3271,9316,33734,083
Private broadcasters
Note 1: As for the satellite broadcasting operators, the numbers are estimated based on their operating incomes of broadcasting services on consignment or broadcast-on-telecommunication services.
Note 2: A cable television operator refers to a profit corporation whose primary business is cable television service provision, and registered as a general broadcasting business (general cable broadcasting operator), excluding business operators who serve as general broadcasting service providers (based on the stipulations of the former Act on Cable Television Broadcasting Article 9) solely by providing cable-television-broadcasting facilities, or operators who are providing broadcasting services by IP multicast.
Note 3: For NHK, the number is their ordinary operating income.Note 4: Details of terrestrial broadcasting operators from 2008 to 2009 are not available.Note 5: Community broadcasting operators who provide cable-television-services are excluded.
(Unit: 100 millions of yen)
(Fiscal year)
39,08934,083 35,124
37,378 37,689 37,355 38,356 39,698 40,152 38,25439,68941,17840,422
05,00010,00015,00020,00025,00030,00035,00040,00045,000
2010200920082007200620052004200320022001200019991998
Terrestrial-based broadcasters Satellite-based broadcasters*1 Cable TV broadcasters*2 NHK*3
Figure 4-6-2-1 Subscriptions to broadcasting services
Prepared on the basis of data from JEITA, Japan Cable Laboratories, NHK, and MIC
Note: The number of subscribers of NHK terrestrial broadcasting is the number of the subscription-contractsNote: The number of subscribers of NHK BS broadcasting is the number of the subscription-contracts.Note: The number of subscribers of 110 CS is the number of the subscription-contracts for Ska-per ! e2Note: The number of subscribers of 124/ 128 CS is the number of the subscription-contracts for Sak-per !Note: The number of subscribers of cable television is a sum of the numbers of subscribers of licensed broadcasting facilities (including the registered
facilities according to the former Act Concerning Broadcast on Telecommunications Services, and the facilities using the same broadcasting methods as those stipulated in the former Cable Television Broadcast Act) .
Note: The number of units shipment of terrestrial digital broadcasting receivers in 2003 is referential only.
(Unit: 10,000)
(Fiscal year)(Unit: 10,000)
(Unit: 10,000)
201020092008200720062005200420030
2,000
4,000
6,000
8,000
10,000
12,000
3,815.71,200.9248.5306.711.5
1,653.8
3,792.11,235.9246.1314.916.1
1,788.2
3,751.21,254.3238.2325.523.4
1,912.8
3,754.71,292.2243.4320.235.7
2,061.1
3,780.41,342.3243.8302.055.9
2,194.4
3,893.21,475.2249.0245.6112.62,470.6
3,975.11,567.2251.2221.1140.42,601.6
Terrestrial-based broadcastersNHK-BSWOWOW124/128ºEast CS digital broadcasters110ºEast CS digital broadcastersCable TV
Reference: No. of broadcast receivers shipped(107.2)360.0
403.9655.3
991.41,242.5
1,971.52,221.1
7,374.17,254.0
11,130.910,609.0
3,820.21,399.9247.6273.783.0
2,300.7
4,969.05,010.0
3,370.13,492.5
For terrestrial digital broadcastsFor BS digital broadcasts
68
Part
2
CW3_A8224D04.indd 68CW3_A8224D04.indd 68 2012/09/19 16:12:452012/09/19 16:12:45プロセスシアンプロセスシアンプロセスマゼンタプロセスマゼンタプロセスイエロープロセスイエロープロセスブラックプロセスブラック
nate jamming. In FY 2011, the number of communica-tions interference reports came to 2,374, down 249 or 9.5% from the previous year. The number included 501 reports on jamming of key communications, down 188 or 27.3%. The number of actions taken in response to in-terference reports totaled 2,453 in FY 2011 (Figure 4-7-2-1).
Section 8Content Market Trends1. Present status of Japan’s con-
tent market(1) Japan’s content market size
The Japanese content market reached 11.2931 trillion yen in 2010. A breakdown of the market by software cat-egory indicates that video software accounted for about 50% of the market, text software for slightly more than 40% and voice software for slightly less than 10% (Figure 4-8-1-1).
(2) Communication content market trendsThe market size of Japan’s mobile content industry
(mobile Internet business) has been expanding rapidly. The market size of Japan’s mobile content industry,
including mobile content and mobile commerce markets, stood at 1.9061 trillion yen in 2011, up 15.2% from the pre-vious year, continuing growth (Figure 4-8-1-2). A market-by-market breakdown indicates the mobile content mar-ket at 734.5 billion yen, up 13.6% from the previous year, and the mobile commerce market at 1.1716 trillion yen, up 16.2% from the previous year, (Figure 4-8-1-2).
Section 9Research and Development (R&D)1. Research in the ICT industry
Corporate research spending, which accounts for about 70% of all scientifi c and technological research ex-penditures in Japan, was 12.01 trillion yen in FY 2010. The ICT industry5 spent 3.7808 trillion yen on research, capturing 31.5% of all corporate research spending.
5 ICT industry research spending indicates the total research spending by the ICT equipment and tool manufacturing industry, the electrical equipment and tool manufacturing industry, the electronic component, device, and circuitry manufacturing industry and the information and communications industry (including information industry, telecommunications industry, broadcasting industry and Internet-related and other ICT industry).
Figure 4-7-1-1 Transitions in the number of radio stations(%)
0
20
40
60
80
100
11,44810,993 11,879 13,2666,379 7,171 7,793 8,499 9,439 10,212 10,059 10,573
10,804
12,098
13,489
6,6587,435
8,0418,737
9,66410,431 10,281
97.9% 97.9%97.7%97.3%96.9%96.4%95.8% 98.3%98.2%97.9%
11,656
98.2%
11,202
98.1%
0
2,000
4,000
6,000
8,000
10,000
12,000
14,000
16,000
Amateur stationsConveniencestations※2
Miscellaneous
Unit: ten-thousand stations
(Fiscal year-end)Unit: ten-thousand stations
Ground-basedmobile stations※1
Percentage ofground-basedmobile station
Note 1: A ground-based mobile station refers to a station which is operative during a displacement or in an unspecified place (ex. Mobile phones)Note 2: A convenience station refers to a station used for convenient wireless communication (ex. personal radio).
95.8%
33
82
74
90
96.4%
33
79
71
81
96.9%
33
76
67
72
97.3%
33
74
65
66
97.7%
34
67
64
60
97.9%
36
62
65
56
97.9%
41
62
66
53
97.9%
49
63
68
51
98.1%
49
41
70
49
98.2%
48
41
72
47
98.2%
46
54
74
45
98.3%
43
58
77
44
2000 2001 2002 2003 2004 2005 2006 2007 2008 2009 2010 2011
Base stations
69
Part
2
CW3_A8224D04.indd 69CW3_A8224D04.indd 69 2012/09/19 16:13:022012/09/19 16:13:02プロセスシアンプロセスシアンプロセスマゼンタプロセスマゼンタプロセスイエロープロセスイエロープロセスブラックプロセスブラック
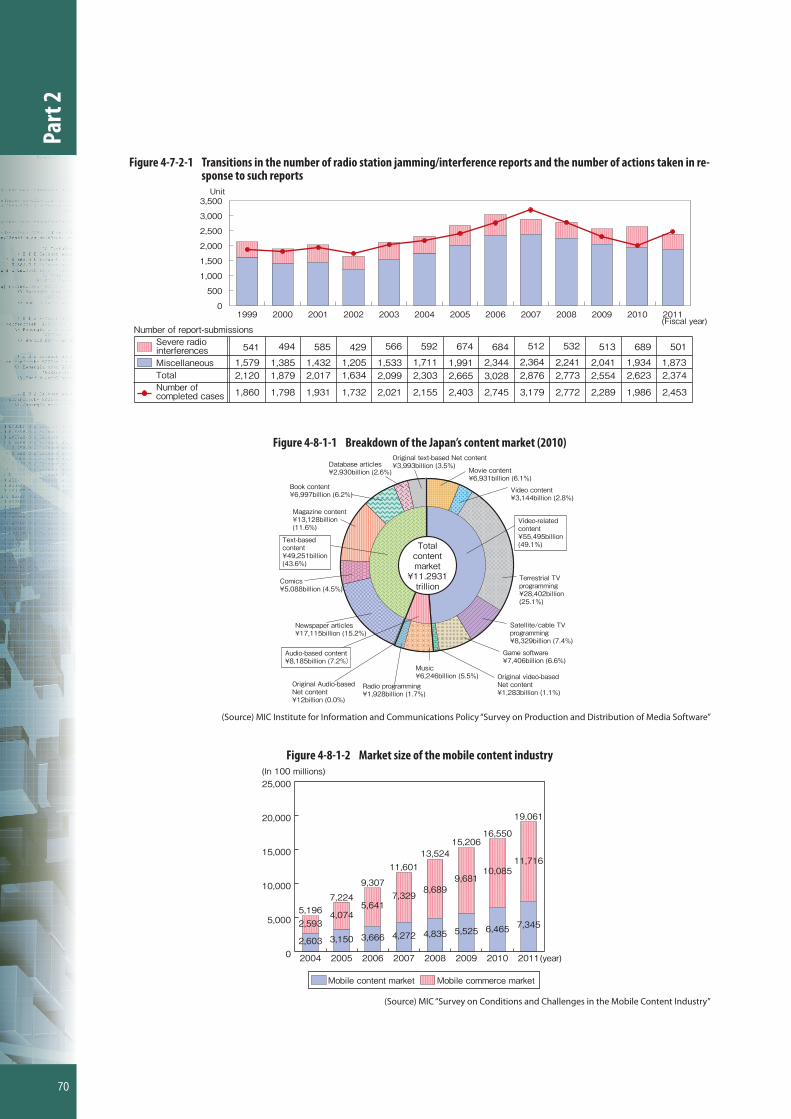
Figure 4-7-2-1 Transitions in the number of radio station jamming/interference reports and the number of actions taken in re-sponse to such reports
0
500
1,000
1,500
2,000
2,500
3,000
3,500
494541 429585 566 674592 512684 689 501513532
1,7981,860 1,7321,931 2,021 2,4032,155 3,1792,745 1,986 2,4532,2892,772
Severe radiointerferencesMiscellaneousTotalNumber ofcompleted cases
Unit
(Fiscal year)2011
Number of report-submissions
1999 2000 2001 2002 2003 2004 2005 2006 2007 2008 2009 2010
2,1201,579
1,8791,385
2,0171,432
1,6341,205
2,0991,533
2,3031,711
2,6651,991
3,0282,344
2,8762,364
2,7732,241
2,5542,041
2,6231,934
2,3741,873
(Source) MIC Institute for Information and Communications Policy “Survey on Production and Distribution of Media Software”
Figure 4-8-1-1 Breakdown of the Japan’s content market (2010)Database articles¥2,930billion (2.6%)
Original text-based Net content¥3,993billion (3.5%)
Book content¥6,997billion (6.2%)
Magazine content¥13,128billion(11.6%)
Comics¥5,088billion (4.5%)
Newspaper articles¥17,115billion (15.2%)
Radio programming¥1,928billion (1.7%)
Music¥6,246billion (5.5%) Original video-based
Net content¥1,283billion (1.1%)
Satellite/cable TVprogramming¥8,329billion (7.4%)
Game software¥7,406billion (6.6%)
Movie content¥6,931billion (6.1%)
Terrestrial TVprogramming¥28,402billion(25.1%)
Video content¥3,144billion (2.8%)
Text-basedcontent¥49,251billion(43.6%)
Audio-based content¥8,185billion (7.2%)
Video-relatedcontent ¥55,495billion(49.1%)Total
contentmarket¥11.2931trillion
Original Audio-basedNet content¥12billion (0.0%)
(Source) MIC “Survey on Conditions and Challenges in the Mobile Content Industry”
Figure 4-8-1-2 Market size of the mobile content industry(In 100 millions)
5,1962,593
2,603
19,061
11,716
7,345
16,550
10,085
6,465
15,206
9,681
5,5253,666
5,641
9,307
4,835
8,689
13,524
4,272
7,329
11,601
7,224
4,074
3,150
(year)0
5,000
10,000
15,000
20,000
25,000
20112010200920082007200620052004
Mobile content market Mobile commerce market
70
Part
2
CW3_A8224D04.indd 70CW3_A8224D04.indd 70 2012/09/19 16:13:242012/09/19 16:13:24プロセスシアンプロセスシアンプロセスマゼンタプロセスマゼンタプロセスイエロープロセスイエロープロセスブラックプロセスブラック
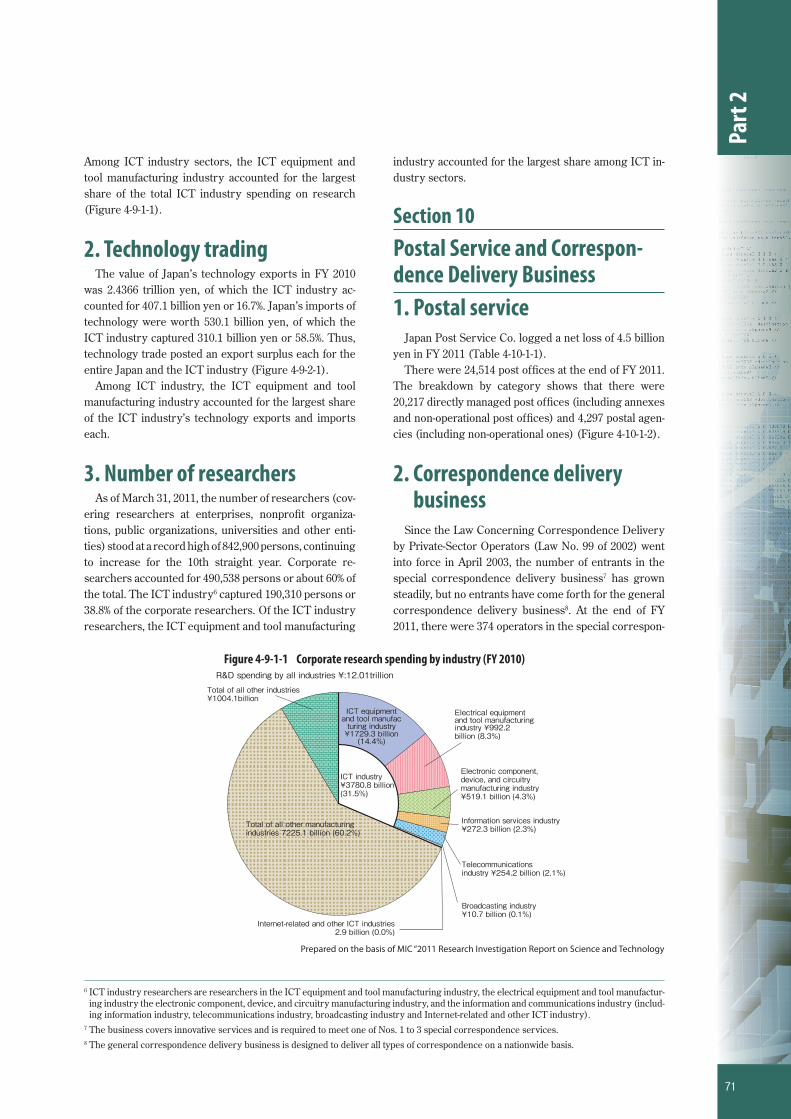
Among ICT industry sectors, the ICT equipment and tool manufacturing industry accounted for the largest share of the total ICT industry spending on research (Figure 4-9-1-1).
2. Technology tradingThe value of Japan’s technology exports in FY 2010
was 2.4366 trillion yen, of which the ICT industry ac-counted for 407.1 billion yen or 16.7%. Japan’s imports of technology were worth 530.1 billion yen, of which the ICT industry captured 310.1 billion yen or 58.5%. Thus, technology trade posted an export surplus each for the entire Japan and the ICT industry (Figure 4-9-2-1).
Among ICT industry, the ICT equipment and tool manufacturing industry accounted for the largest share of the ICT industry’s technology exports and imports each.
3. Number of researchersAs of March 31, 2011, the number of researchers (cov-
ering researchers at enterprises, nonprofi t organiza-tions, public organizations, universities and other enti-ties) stood at a record high of 842,900 persons, continuing to increase for the 10th straight year. Corporate re-searchers accounted for 490,538 persons or about 60% of the total. The ICT industry6 captured 190,310 persons or 38.8% of the corporate researchers. Of the ICT industry researchers, the ICT equipment and tool manufacturing
industry accounted for the largest share among ICT in-dustry sectors.
Section 10Postal Service and Correspon-dence Delivery Business1. Postal service
Japan Post Service Co. logged a net loss of 4.5 billion yen in FY 2011 (Table 4-10-1-1).
There were 24,514 post offi ces at the end of FY 2011. The breakdown by category shows that there were 20,217 directly managed post offi ces (including annexes and non-operational post offi ces) and 4,297 postal agen-cies (including non-operational ones) (Figure 4-10-1-2).
2. Correspondence delivery business
Since the Law Concerning Correspondence Delivery by Private-Sector Operators (Law No. 99 of 2002) went into force in April 2003, the number of entrants in the special correspondence delivery business7 has grown steadily, but no entrants have come forth for the general correspondence delivery business8. At the end of FY 2011, there were 374 operators in the special correspon-
6 ICT industry researchers are researchers in the ICT equipment and tool manufacturing industry, the electrical equipment and tool manufactur-ing industry the electronic component, device, and circuitry manufacturing industry, and the information and communications industry (includ-ing information industry, telecommunications industry, broadcasting industry and Internet-related and other ICT industry).
7 The business covers innovative services and is required to meet one of Nos. 1 to 3 special correspondence services.8 The general correspondence delivery business is designed to deliver all types of correspondence on a nationwide basis.
Figure 4-9-1-1 Corporate research spending by industry (FY 2010)
Prepared on the basis of MIC “2011 Research Investigation Report on Science and Technology
Total of all other manufacturingindustries 7225.1 billion (60.2%)
R&D spending by all industries ¥:12.01trillionTotal of all other industries¥1004.1billion
ICT equipmentand tool manufacturing industry¥1729.3 billion(14.4%)
Electrical equipmentand tool manufacturingindustry ¥992.2billion (8.3%)
Information services industry¥272.3 billion (2.3%)
Telecommunicationsindustry ¥254.2 billion (2.1%)
Broadcasting industry¥10.7 billion (0.1%)
Internet-related and other ICT industries 2.9 billion (0.0%)
ICT industry¥3780.8 billion(31.5%)
Electronic component, device, and circuitry manufacturing industry ¥519.1 billion (4.3%)
71
Part
2
CW3_A8224D04.indd 71CW3_A8224D04.indd 71 2012/09/19 16:13:392012/09/19 16:13:39プロセスシアンプロセスシアンプロセスマゼンタプロセスマゼンタプロセスイエロープロセスイエロープロセスブラックプロセスブラック

dence delivery business (Figure 4-10-2-1). A breakdown by provided service indicates that a relatively large num-ber of operators have entered the No. 1 Service market.
Prepared on the basis of data from Japan Post Service Co.
Figure 4-10-1-1 Postal business loss/profi t (fi nancial statement)
283 26 18 -756 694 -45-354-474298
(hundred million yen)
Net income
Note: The figures corresponding to the period from FY2004 to the first half of FY2007 are based on the postal service segment information on the financial reports of the Japan Postal Service Corporation. The figures corresponding to the period from the second half of FY2007 to FY2011 are based on the financial reports of the Postal Service Inc. Therefore, simple comparisons cannot be made.Note: The figures corresponding to the period from FY2004 to the first half of FY2007 are representing net incomes. The figures corresponding to the period from the second half of FY2007 to FY2011 are representing the net incomes in the terms (post-corporate-tax income).Note: The figure corresponding to the second half of FY2007 is representing the figure after disposal of disposable assets including burden charges (extraordinary loss). The cause of loss in the first half of FY2007 is the income imbalance between the first and second half. The operating income in the second half is generally larger due to the sales of new year greeting cards and postal package services for season gifts.Note: The cause of loss in FY2009 is the appraisal loss in share holding of a package-service subsidiary (extraordinary loss).Note: The cause of loss in FT2010 is the decrease in income due to the declining number of mails and the temporary decrease in the number of postal packages after the package-delivery-delay incidents.
2004 2005 2006 First halfof 2007
Second halfof 2007 2008 2009 2010 2011(FY)
Figure 4-10-1-2 Breakdown of the number of post offi ces (end of FY 2011)
Prepared on the basis of data from Japan Post Service Co.
20,124 29 4,069 24,222 24,51464 ー 228 292
Notes:
Operational postal officesDirectly managedpostal offices
Directly managedpostal offices
(in offices)
total
Non-operational postal offices
- “Postal agencies” are post offices operated by contract.- “Non-operational post offices” are post offices that have been temporarily closed and where counter services have been suspended.-Of the 64 non-operational directly managed post offices, 53 have beentemporarily closed due to the Great East Japan Earthquake.-Of the 228 non-operational postal agencies, 29 have been temporarilyclosed dueto the Great East Japan Earthquake.-Of the 228 non-operational postal agencies, 55 are providing outcallservices by transfer employees or PR employees.-Of the 29 annexes currently in operation, one have been set up temporarilyas an emergency measure to replace temporarily closed postal agencies.
Postaloffices
Postaloffices
Branchoffices
Branchoffices
PostalAgencies
PostalAgenciesSubtotal Subtotal
Prepared on the basis of MIC “2011 Research Investigation Report on Science and Technology”
Figure 4-9-2-1 Technology trade by industry (FY 2010)
ICT equipment and toolmanufacturing industry243.3 billion (10.0%)
Electrical equipmentand tool manufacturingindustry 97.6 billion (4.0%)
Information and Communication industry 31.3 billion(1.3%)
Total of all othermanufacturingindustries 2000.9billion (82.1%)
Total of all otherindustries 28.7billion (1.2%)
export import
ICT equipment and tool manufacturing industry 208.3 billion (39.3%)
Electrical equipment andtool manufacturing industry27.4 billion (5.2%)
Information and Communication
industry 63.4 billion (12.0%)
Total of all othermanufacturing industries 207.1billion (39.1%)
Total of all otherindustries 12.8billion(2.4%)
Technology exportby all industries(Total of all industries ¥2436.6 billion)
Technology importby all industries(Total of all industries ¥530.1billion)
ICT industry310.1 billion(58.5%)
ICT industry407.1 billion(16.7%)
Electronic component,device, and circuitrymanufacturing industry34.9 billion (1.4%)
Electronic component, device,and circuitry manufacturingindustry 10.9 billion (2.1%)
72
Part
2
CW3_A8224D04.indd 72CW3_A8224D04.indd 72 2012/09/19 16:13:492012/09/19 16:13:49プロセスシアンプロセスシアンプロセスマゼンタプロセスマゼンタプロセスイエロープロセスイエロープロセスブラックプロセスブラック

Figure 4-10-2-1 Transitions in the number of special correspondence delivery business operators
317346
283253
213
374
159
(Operators)
(Fiscal year-end)2011201020092008200720062005
0
50
100
150
200
250
300
350
400
73
Part
2
CW3_A8224D04.indd 73CW3_A8224D04.indd 73 2012/09/19 16:14:032012/09/19 16:14:03プロセスシアンプロセスシアンプロセスマゼンタプロセスマゼンタプロセスイエロープロセスイエロープロセスブラックプロセスブラック