chapter 4 - comparative financial performance: … community banking study december 2012 4–1...
TRANSCRIPT

FDIC CommunIty BankIng StuDy ■ DeCemBer 2012 4–1
Chapter 4 - Comparative Financial Performance: Community versus Noncommunity Banks
Any meaningful comparison between community and noncommunity banks must address the issue of financial performance, and one common measure for comparing the financial performance of banks of different sizes is return on assets (ROA) or, more precisely, pretax ROA.1 A comparison of pretax ROA reveals that during most of the study period, noncommunity banks have outperformed community banks. The weighted average pretax ROA for noncommunity banks was 1.31 percent over the study 1 A focus on pretax ROA, as opposed to return on assets after tax, facilitates comparisons between banks organized as C corporations, which are taxed at the bank level, and S corporations, in which tax obli-gations pass through to shareholders.
period, compared with 1.02 percent for community banks. This earnings gap was most notable during the period 1993 through 2006, when the profitability advantage for noncommunity institutions averaged 35 basis points, as seen in Chart 4.1.
Table 4.1 Weighted Average Pretax ROA by Structural Subgroups
1986-1990 1991-1995 1996-2000 2001-2005 2006-2010Aggregate 1985-2011
All Banks 0.50% 1.38% 1.79% 1.90% 0.77% 1.26%Community Banks 0.47% 1.31% 1.56% 1.49% 0.60% 1.05%Noncommunity Banks 0.51% 1.41% 1.85% 1.99% 0.80% 1.31%
1986-1990 1991-1995 1996-2000 2001-2005 2006-2010Aggregate 1985-2011
Headquartered in a Metropolitan AreaCommunity Banks 0.38% 1.20% 1.53% 1.49% 0.45% 0.94%Noncommunity Banks 0.50% 1.40% 1.83% 1.98% 0.79% 1.30%
Not Headquartered in a Metropolitan AreaCommunity Banks 0.78% 1.60% 1.63% 1.50% 0.95% 1.25%Noncommunity Banks 1.10% 1.87% 2.91% 2.39% 1.34% 1.88%
1986-1990 1991-1995 1996-2000 2001-2005 2006-2010Aggregate 1985-2011
Continuously Operating 1985-2011Community Banks 1.20% 1.60% 1.66% 1.56% 0.84% 1.27%Noncommunity Banks 0.78% 1.55% 1.79% 1.85% 0.84% 1.26%
Not Continuously Operating 1985-2011Community Banks 0.20% 1.13% 1.45% 1.38% 0.03% 0.76%Noncommunity Banks 0.44% 1.35% 1.90% 2.17% 0.68% 1.37%
1986-1990 1991-1995 1996-2000 2001-2005 2006-2010Aggregate 1985-2011
Less Than 5 Years OldCommunity Banks -1.12% 0.71% 0.04% 0.26% -0.74% -0.29%Noncommunity Banks 0.63% 1.56% 2.30% 1.68% 0.34% 1.16%
5-10 Years OldCommunity Banks -0.11% 1.00% 1.44% 1.32% 0.20% 0.64%Noncommunity Banks 1.55% 1.82% 2.43% 2.07% 0.59% 1.56%
10-25 Years OldCommunity Banks -0.05% 1.17% 1.66% 1.74% 0.47% 1.01%Noncommunity Banks 0.46% 2.11% 2.24% 2.74% 0.91% 1.80%
25-50 Years OldCommunity Banks 0.02% 1.30% 1.62% 1.64% 0.46% 0.93%Noncommunity Banks -0.14% 1.03% 1.76% 1.97% 1.03% 1.21%
More Than 50 Years OldCommunity Banks 0.73% 1.38% 1.58% 1.50% 0.78% 1.14%Noncommunity Banks 0.53% 1.36% 1.76% 1.82% 0.79% 1.23%
Source: FDIC.

FDIC CommunIty BankIng StuDy ■ DeCemBer 2012 4–2
Table 4.1 shows how particular subgroups of community banks have performed compared with their noncommunity bank counterparts. Noncommunity banks outperformed community banks in both metropolitan and nonmetropoli-tan areas. Older community banks generally performed more favorably compared with noncommunity banks, but among younger banks, noncommunity banks generally had much stronger earnings.
The factors behind the earnings advantage for noncom-munity banks over community banks can be found by breaking down pretax ROA into its major components—net interest income, noninterest income, noninterest expense, and provisions for loan losses. Noncommunity banks have had greater success in generating noninterest income from a variety of sources, explaining much of the gap in earnings. The erosion in recent years of the advan-tage that community banks have typically enjoyed in generating net interest income from traditional lending activities also contributes to the gap in earnings. Because of their heavy dependence on lending as a source of income, community banks have been disproportionately affected by the long-term trend toward lower net interest margins. Nonetheless, community banks have almost always incurred lower credit losses than noncommunity banks—a difference that has been most notable during economic downturns—which has helped to narrow the overall earnings gap in recent years. Still, while commu-nity banks enjoyed a significant advantage prior to 2000 in terms of lower noninterest expenses, noncommunity banks have since managed to substantially reduce their noninter-est expenses to a level that is comparable to community banks when expressed as a percentage of assets.
Noninterest Income Explains Much of the Earnings GapThe largest and most apparent advantage in profitability for noncommunity banks compared with community banks is their ability to generate much higher volumes of noninterest income. Over the study period, noninterest income averaged 2.05 percent of average assets at noncom-munity banks, compared with only 0.8 percent for commu-nity banks. As illustrated in Chart 4.2, throughout the late 1980s and the 1990s, noncommunity banks steadily increased the level of their noninterest income relative to their assets (from 1.21 percent in 1985 to 2.6 percent in 1999), while noninterest income levels remained essen-tially unchanged at community banks.
The ability of noncommunity banks to generate such high levels of noninterest income relative to community banks is closely connected to their ability to earn noninterest income from a wider range of sources. Table 4.2 illustrates the primary sources of noninterest income for community banks and noncommunity banks that filed Call Reports over the last 11 years of the study period.2 For example, almost 13 percent of the noninterest income earned by these noncommunity banks came from market-sensitive revenues, which include income from trading, venture capital, and investment banking activities. This compares to only 3.4 percent of the noninterest income earned by 2 Beginning in 2001, FDIC-insured institutions that filed Call Reports began reporting more detailed data on noninterest income components. Similar data are not available for Thrift Financial Report (TFR) filers. To show TFR filers’ share of the industry, as of December 31, 2011, TFR filers represented 8.5 percent of community banks and 10.8 percent of community bank assets, 11.1 percent of noncommunity banks and 5.6 percent of noncommunity bank assets. As of December 31, 2001, TFR filers represented 10.4 percent of community banks and 16.1 percent of community bank assets, 12.1 percent of noncommunity banks and 11.7 percent of noncommunity bank assets.
Chart 4.1
-0.5%
0.0%
0.5%
1.0%
1.5%
2.0%
2.5%
1985 1987 1989 1991 1993 1995 1997 1999 2001 2003 2005 2007 2009 2011
Community BanksNoncommunity Banks
Pretax Return on Assets, 1985-2011
Source: FDIC.
Chart 4.2
0.0%
0.5%
1.0%
1.5%
2.0%
2.5%
3.0%
3.5%
4.0%
1985 1987 1989 1991 1993 1995 1997 1999 2001 2003 2005 2007 2009 2011
Community BanksNoncommunity Banks
Noninterest Income to Average Assets, 1985-2011
Source: FDIC.

FDIC CommunIty BankIng StuDy ■ DeCemBer 2012 4–3
community banks from such sources. Noncommunity banks also generate much higher levels of income from asset servicing and fiduciary (trust) activities. By compari-son, community banks obtained about 40 percent of their noninterest income from service charges on deposit accounts and about 10 percent from asset sales.
Table 4.2 illustrates the categories of noninterest income that are reported in every Call Report. Other categories of noninterest income (which are included in all other noninterest income) are reported by banks only if they exceed minimum levels.3 Based upon the incomplete infor-mation available on the “all other” category, interchange
3 The minimum level is an amount greater than $25,000 and exceeding 3 percent of total noninterest income. Examples of items that might be reported as all other noninterest income include income and fees from the printing and sale of checks, earnings on or the increase in value of cash surrender value of life insurance, income and fees from automated teller machines, rent and other income from other real estate owned, safe deposit box rent, net change in the fair values of financial instru-ments accounted for under a fair value option, bank card and credit card interchange fees, and gains on bargain purchases.
fees appear to be the single most important component of “other noninterest income” for both community and noncommunity bank Call Report filers in 2011. Amounts reported for 2011 by banks that itemized these fees indicate that they may be significantly more important for noncom-munity banks (14.6 percent of total noninterest income) than for community banks (8.8 percent).
Narrower Margins Pose a Challenge for Community BanksHistorically, community banks have been more successful than noncommunity banks in generating net interest income (see Chart 4.3). Over the entire study period, the ratio of net interest income to total assets has been higher at community banks in all but one year.
A similar pattern can be seen in the net interest margin, which measures the spread between asset yields and fund-ing costs for earning assets. Peak levels for net interest
Table 4.2 Noninterest Income at Community and Noncommunity Banks (Call Report Filers Only)As a Percentage of Noninterest Income
As a Percentage of Average Assets
Category of Noninterest IncomeCommunity
BanksNoncommunity
BanksCommunity
BanksNoncommunity
BanksService Charges on Deposit Accounts 40% 16% 0.34% 0.35%Fiduciary Income 8% 12% 0.07% 0.28%Gains on Asset Sales 10% 3% 0.09% 0.08%Market Sensitive Revenue* 3% 13% 0.03% 0.29%Securitization Income 0% 8% 0.02% 0.18%Servicing Income 3% 8% 0.02% 0.17%Insurance Income 3% 2% 0.03% 0.04%All Other Noninterest Income 33% 38% 0.28% 0.86%Total Noninterest Income 100% 100% 0.85% 2.25%Source: FDIC. Weighted averages of Call Report data from 2001-2011. * Includes trading, venture capital, and investment banking income.Note: Beginning in 2011, FDIC-insured institutions that file Call Reports began reporting more detailed data on noninterest income components. Similar data are not available for Thrift Financial Report filers.
Chart 4.3
0.0%
0.5%
1.0%
1.5%
2.0%
2.5%
3.0%
3.5%
4.0%
4.5%
1985 1987 1989 1991 1993 1995 1997 1999 2001 2003 2005 2007 2009 2011
Community BanksNoncommunity Banks
Net Interest Income to Average Assets, 1985-2011
Source: FDIC.
Chart 4.4
0.0%
0.5%
1.0%
1.5%
2.0%
2.5%
3.0%
3.5%
4.0%
4.5%
5.0%
1985 1987 1989 1991 1993 1995 1997 1999 2001 2003 2005 2007 2009 2011
Community BanksNoncommunity Banks
Net Interest Margin, 1985-2011
Source: FDIC.

FDIC CommunIty BankIng StuDy ■ DeCemBer 2012 4–4
margins were reached by both groups in 1993 and 1994 (Chart 4.4). The subsequent decline in the net interest margin has had more significant competitive implications for community banks, as net interest income accounts for more than 80 percent of community bank net operating revenue, compared with about two-thirds of revenue at noncommunity banks. In addition, the long-term advan-tage in net interest income for community banks has narrowed in recent years, as the net interest margin for noncommunity banks rose sharply from 2008 through 2010.
Community Banks Generally Have Higher Yields on Earning AssetsOne key to the traditional advantage of community banks in generating net interest income is a generally higher yield on earning assets. The ratio of interest income to earning assets at community banks has exceeded that of noncommunity banks in 17 of the past 27 years (see Chart 4.7), including every year since 2001. Over the entire study period, total interest income as a percent of earning assets averaged 7.6 percent at community banks, compared with just 6.7 percent for noncommunity banks. One factor that may contribute to a higher yield on earning assets for community banks is the nature of their loan portfolios.
Loans held by community banks tend to be less homoge-neous in structure and terms than loans made by noncom-munity banks, which are more likely to be large-scale, transactional lenders. Interest-earning assets represent a larger share of total assets at community banks. Over the study period, earning assets averaged 91.8 percent of total assets at community banks, compared with 86 percent at noncommunity banks.
Another possibility, however, is that community banks have maintained higher yields in part by changing the composition of their loan portfolios, as shown by the three measures in Table 4.3. First, community banks have increased the share of loans on their balance sheets. Loan balances rose as a share of total assets at community banks from a low of 56.9 percent at the end of 1992 to a peak level of 70.1 percent at the end of 2008 (see Chart 4.6). While the loans-to-assets ratio declined for community banks in each of the next three years, it remained at 62 percent at the end of 2011, compared with only 50.8 percent at noncommunity banks. Second, community banks also have increased their holdings of longer-maturity loans and securities. The share of community bank assets with remaining maturities of five years or more rose from 19 percent at the end of 2006 to 27 percent at the end of 2011. During this interval, the share of long-term assets at
Table 4.3 Asset Composition Trends
Total Loans / Total Assets CRE Loans / Total Assets*Long-Term Assets / Total
Assets**1990 2000 2011 1990 2000 2011 1990 2000 2011
Community Banks 60.9% 65.8% 62.0% 14.5% 19.6% 26.7% 14.9% 22.3% 27.4%Noncommunity Banks 62.0% 60.2% 50.8% 12.1% 9.9% 8.8% 14.6% 19.5% 22.6%Source: FDIC.* Includes real estate construction and development loans, loans secured by nonfarm nonresidential and multifamily residential real estate properties, and loans to finance construction and commercial real estate not secured by real estate properties.** Call Report filers only.
Chart 4.5
3%
4%
5%
6%
7%
8%
9%
10%
11%
12%
1985 1987 1989 1991 1993 1995 1997 1999 2001 2003 2005 2007 2009 2011
Community BanksNoncommunity Banks
Average Yield on Earning Assets, 1985-2011
Source: FDIC.
Chart 4.6
0%
10%
20%
30%
40%
50%
60%
70%
80%
1985 1987 1989 1991 1993 1995 1997 1999 2001 2003 2005 2007 2009 2011
Community BanksNoncommunity Banks
Net Loans and Leases to Average Assets, 1985-2011
Source: FDIC.

FDIC CommunIty BankIng StuDy ■ DeCemBer 2012 4–5
noncommunity banks declined slightly, from 24 percent to 23 percent. Finally, community banks have evolved over the study period from being predominantly retail lenders to commercial lenders, with a particular focus on lending secured by commercial real estate. This shift will be discussed in greater detail in Chapter 5 of the study, which discusses bank lending specialty groups.
Noncommunity Banks Generally Have Lower Borrowing CostsIn contrast to the traditionally higher asset yields found at community banks, noncommunity banks have typically had an advantage in funding costs (see Chart 4.5). Interest expenses averaged 3.4 percent of total assets for commu-nity banks over the study period, compared with 2.7 percent for noncommunity banks. Community banks did report lower average funding costs in ten of the past 27 years, but noncommunity banks have usually fared better when interest rates have been low or falling, as has been the case during most of the past decade.
Several factors explain the higher cost of funds for community banks in recent years. First, community banks rely much more on time deposits for funding compared with noncommunity banks. Time deposits tend to be cost-lier and reprice more slowly than other liabilities. From 1985 through 2011, time deposits funded an average of 41 percent of community bank assets, more than twice the average for noncommunity banks. Also, when short-term interest rates fall to especially low levels, competitive pres-sures may result in an effective floor for interest-bearing deposits, pricing them above other forms of short-term funding. This helps to explain why community bank fund-ing costs have compared favorably with noncommunity
banks when interest rates were stable or rising, but have not compared as well when rates fell to very low levels (see Chart 4.8). More recently, the cost of funds at noncommu-nity banks has benefited from guarantees or additional insurance above the normal FDIC insurance limit for noninterest-bearing deposits, as the bulk of these noninter-est-bearing deposits have flowed into noncommunity banks.4
Community Banks Have Lower Expenses for Credit LossesCommunity banks have generally had a sizable advantage over noncommunity banks with respect to expenses for credit losses. This difference is reflected in the loan-loss provisions of the two groups, shown in Chart 4.9, and mirrors the relative loss rates in their loan portfolios. Noncommunity banks generally had higher loan-loss rates both in the early years of the study period, when their loan portfolios were more heavily weighted toward commercial loans, as well as in more recent years, after their portfolios shifted more to consumer lending. Loan-loss rates at community banks have remained lower throughout the study period even as their loan mix shifted in the opposite direction, from retail to commercial loans.
One reason that the shift in loan mix and the overall increase in the risk of community bank portfolios has not
4 The Dodd-Frank Wall Street Reform and Consumer Protection Act (Dodd-Frank), enacted on July 21, 2010, provides temporary unlimited deposit insurance coverage for noninterest-bearing transaction accounts from December 31, 2010, through December 31, 2012, regard-less of the balance in the account and the ownership capacity of the funds. The unlimited coverage is available to all depositors, including consumers, businesses and government entities. The coverage is sepa-rate from, and in addition to, the insurance coverage provided for a depositor’s other accounts held at an FDIC-insured bank.
Chart 4.7
0%
1%
2%
3%
4%
5%
6%
7%
8%
1985 1987 1989 1991 1993 1995 1997 1999 2001 2003 2005 2007 2009 2011
Community BanksNoncommunity Banks
Total Interest Expense to Average Assets, 1985-2011
Source: FDIC.
Chart 4.8
-3%-2%-1%0%1%2%3%4%5%6%7%8%9%
10%
1985 1987 1989 1991 1993 1995 1997 1999 2001 2003 2005 2007 2009 2011
Community BanksNoncommunity BanksFed Funds Rate
Spread Between Average Funding Cost and Fed Funds Rate, 1985-2011
Sources: FDIC, Federal Reserve.

FDIC CommunIty BankIng StuDy ■ DeCemBer 2012 4–6
led to a convergence in credit loss rates is that most prob-lem loans at community banks are secured loans, while a higher share of problem loans at noncommunity banks are unsecured. Between 1991 through 2011, credit card lines alone account for more than one-third of net loan charge-offs at noncommunity banks. Moreover, a comparison of loss rates on individual loan categories suggests that community banks may also do a better job of underwriting loans than noncommunity institutions (see Table 4.4). In two retail loan categories—residential real estate loans and loans to individuals—community banks consistently reported lower average loss rates from 1991 through 2011, the period for which these data are available. While aver-age loss rates on commercial real estate loans have been comparable for community and noncommunity banks in noncrisis years when losses were low, loan loss rates were much higher at noncommunity banks than at community banks during real estate downturns, when loss rates rose. Similarly, while noncommunity banks have generally reported lower average loss rates on commercial and indus-
trial (C&I) loans during economic expansions, their C&I loan losses spiked well above those at community banks during economic downturns.
In the end, the relative advantage that community banks have enjoyed in terms of lower loan-loss expenses has served only to mitigate, not reverse, their overall earnings gap with noncommunity banks. Despite generally higher loan-loss rates, noncommunity banks have been able to consistently generate higher returns on assets.
Table 4.4 Average Net Charge-Off Rates by Loan Type
Loan Type Bank Type 1991-1995 1996-2000 2001-2005 2006-2010Aggregate 1991-2011
Nonfarm, nonresidential CRE
Community 0.55% 0.07% 0.09% 0.35% 0.29%Noncommunity 1.21% 0.04% 0.11% 0.61% 0.49%
Construction and development
Community 0.87% 0.08% 0.09% 2.04% 1.25%Noncommunity 2.56% 0.04% 0.09% 2.86% 1.82%
1-4 family residential Community 0.13% 0.06% 0.06% 0.35% 0.18%Noncommunity 0.24% 0.12% 0.11% 1.16% 0.65%
C&I Community 1.30% 0.63% 0.67% 1.06% 0.89%Noncommunity 0.83% 0.48% 1.13% 1.24% 0.91%
Credit card Community 2.41% 3.61% 4.02% 7.76% 3.73%Noncommunity 3.80% 4.70% 5.30% 6.91% 5.58%
Other consumer Community 0.59% 0.70% 0.81% 0.90% 0.74%Noncommunity 0.82% 1.12% 1.46% 2.11% 1.54%
Agricultural* Community 0.17% 0.15% 0.14% 0.15% 0.15%Noncommunity 0.26% 0.20% 0.33% 0.44% 0.34%
Source: FDIC.* Includes agricultural production loans and real estate loans secured by farmland. Detailed data on loss rates by loan type were not reported prior to 1991.
Chart 4.9
0.0%
0.5%
1.0%
1.5%
2.0%
2.5%
1985 1987 1989 1991 1993 1995 1997 1999 2001 2003 2005 2007 2009 2011
Community BanksNoncommunity Banks
Loss Provision to Average Assets, 1985-2011*
* Does not include Thrift Financial Report filers prior to 1987.Source: FDIC.
Chart 4.10
0.0%
0.5%
1.0%
1.5%
2.0%
2.5%
3.0%
3.5%
4.0%
1985 1987 1989 1991 1993 1995 1997 1999 2001 2003 2005 2007 2009 2011
Community BanksNoncommunity Banks
Noninterest Expense to Average Assets, 1985-2011
Source: FDIC.

FDIC CommunIty BankIng StuDy ■ DeCemBer 2012 4–7
Community Banks Have Historically Had Lower Noninterest ExpensesOver the course of the study, average noninterest expenses have almost always been lower at community banks than at noncommunity banks (see Chart 4.10). Total noninter-est expense averaged 2.9 percent of assets for community banks from 1985 through 2011 compared with an average of 3.1 percent for noncommunity banks. Despite a long-term advantage of 22 basis points, the gap in expense ratios between the two groups has been gradually narrow-ing for more than a decade. Noncommunity banks have reduced their expenses, so that the gap is now almost nonexistent.
In the early years of the study period, noncommunity banks reported higher expense ratios for both salaries and employee benefits and for expenses associated with prem-ises and fixed assets (see Chart 4.11 and Chart 4.12). During the latter half of the period, however, noncommu-nity banks were able to reduce these costs below commu-nity bank levels. Community banks have not been able to reduce these costs in a similar fashion, and in fact have increased their overall payroll costs over time, although community banks do continue to report lower average payroll expenses per employee than noncommunity banks. Because community banks maintain more employees per dollar of assets, their payroll expenses are higher than those of noncommunity banks when measured as a percentage of assets. Over time, institutions of all sizes have been able to reduce their numbers of employees per dollar of assets. Noncommunity banks, however, have been particularly successful in this regard, raising the ratio of assets per employee from $2.6 million in 1984 to $7.2 million by 2011. Despite the significant expansion in the number of total banking offices since 2000, noncommu-
nity banks have managed to steadily reduce their premises and fixed asset expense levels, while these expenses have remained largely unchanged at community banks (see Chart 4.12).
The “Efficiency Gap” Between Community and Noncommunity InstitutionsThe individual income and expense components that make up pretax ROA reveal a more detailed picture of how the performance of community and noncommunity banks differ. Taken together, they indicate that community banks have typically not generated the same level of earnings as noncommunity banks over the long term.
Three of these earnings components—noninterest expense, noninterest income and net interest income—can be rearranged into what is commonly referred to as the efficiency ratio:
The efficiency ratio is a simple expression of the underly-ing operational performance of banks apart from differ-ences in performance caused by asset quality factors. It compares the level of overhead costs (total noninterest expense) to net operating revenues (the sum of net interest income and total noninterest income). A higher efficiency ratio actually suggests inefficiency, as it indicates that the bank is less productive in terms of converting expenditures into revenue.
Noninterest ExpenseEfficiency Ratio =
Net Operating Revenue
Net Operating Revenue = Net Interest Income+ Noninterest Income
Chart 4.11
0.0%
0.2%
0.4%
0.6%
0.8%
1.0%
1.2%
1.4%
1.6%
1.8%
1985 1987 1989 1991 1993 1995 1997 1999 2001 2003 2005 2007 2009 2011
Community BanksNoncommunity Banks
Salaries and Employee Benefits Expense to Average Assets, 1985-2011
Source: FDIC.
Chart 4.12
0.0%
0.1%
0.2%
0.3%
0.4%
0.5%
0.6%
1985 1987 1989 1991 1993 1995 1997 1999 2001 2003 2005 2007 2009 2011
Community BanksNoncommunity Banks
Premises and Fixed Asset Expense to Average Assets, 1985-2011
Source: FDIC.

FDIC CommunIty BankIng StuDy ■ DeCemBer 2012 4–8
Comparing the efficiency ratio of community and noncommunity banks over time (see Chart 4.13) shows that community banks have traditionally been less effi-cient than noncommunity banks—that is, they have incurred more expenses per dollar revenue. This “efficiency gap” has widened considerably since the late 1990s. The average annual gap between community and noncommu-nity banks was 3.5 percent between 1985 and 1998, but widened to an average level of 9.2 percent between 1999
and 2011. This widening of the efficiency gap mirrors the gap that has emerged in terms of profitability as measured by pretax ROA.
Chart 4.14 takes a closer look at the widening of the effi-ciency gap over time. The last time the efficiency gap was less than 2 percent was in 1998, when it narrowed to just 1.3 percent. Since 1998, the efficiency gap has widened considerably, reaching a peak of 19.5 percent in 2009 before narrowing to a still wide 9.7 percent in 2011. Almost all of the cumulative widening of the gap that took place over this 13-year period occurred as a result of a deteriora-tion in the efficiency ratio of community banks. While the community bank efficiency ratio increased from 61.9 percent to 69.9 percent over this period, the efficiency ratio of noncommunity banks improved slightly, from 60.6 percent to 60.2 percent. Chart 4.14 also shows that the 9.7 percent efficiency gap reported in 2011 was actually a sizable improvement from a gap of 19.5 percent in 2009. The efficiency gap as of 2009 reflected cumulative deterio-ration in the efficiency ratio of community banks since 1998 from 61.9 percent to 72.7 percent, improvement in the efficiency ratio of noncommunity banks from 60.6 percent as of 1998 to 53.2 percent as of 2009, plus a rela-
Chart 4.13
0%
10%
20%
30%
40%
50%
60%
70%
80%
90%
1985 1987 1989 1991 1993 1995 1997 1999 2001 2003 2005 2007 2009 2011
Community BanksNoncommunity Banks
Efficiency Ratio, 1985-2011
Source: FDIC.
Chart 4.14
50%
55%
60%
65%
70%
75%
1998 1999 2000 2001 2002 2003 2004 2005 2006 2007 2008 2009 2010 2011
Community Bank Efficiency Ratio
Source: FDIC.
Noncommunity Bank Efficiency Ratio
Efficiency Gap in 1998: 1.3%
Efficiency Gap in 2011: 9.7%
Cumulative Deterioration in Community Bank
Efficiency Ratio
Cumulative Improvement in Noncommunity Bank Efficiency Ratio
Efficiency Ratio
A Sizable Efficiency Gap Has Developed Between Community and Noncommunity Banks Since 1998
FDIC CommunIty BankIng StuDy ■ DeCemBer 2012 4–9
tively small 1.3 percent efficiency gap that existed as of 1998.
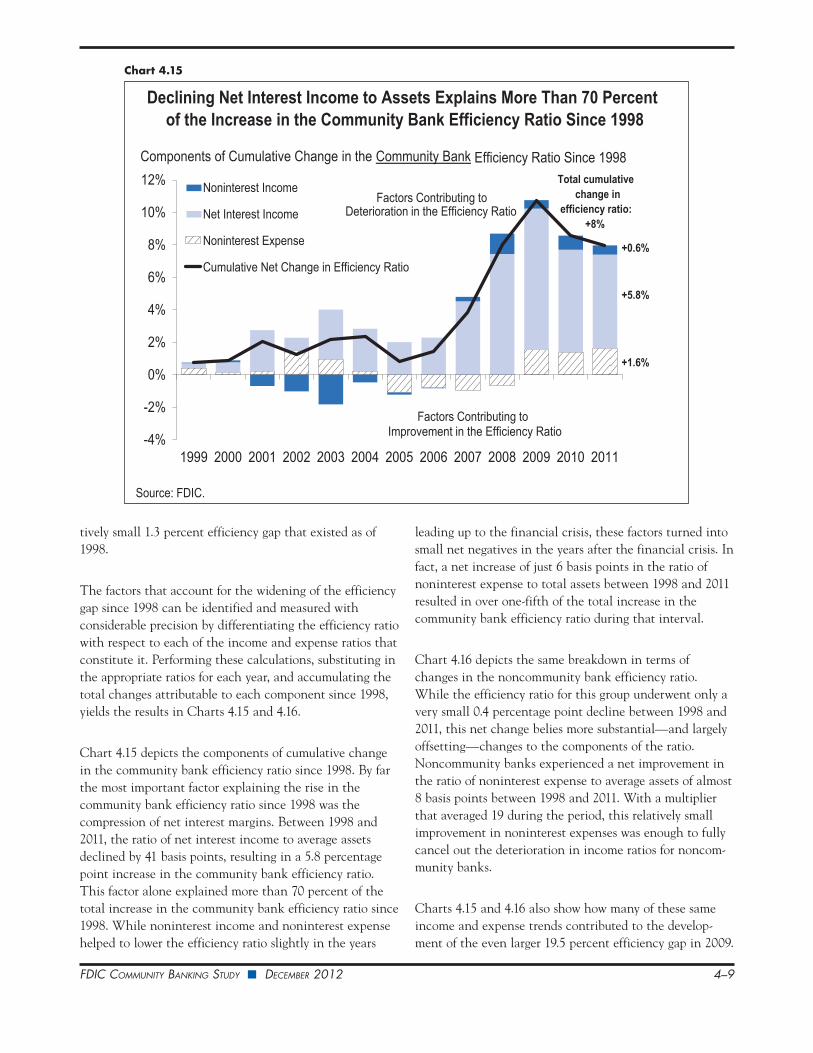
The factors that account for the widening of the efficiency gap since 1998 can be identified and measured with considerable precision by differentiating the efficiency ratio with respect to each of the income and expense ratios that constitute it. Performing these calculations, substituting in the appropriate ratios for each year, and accumulating the total changes attributable to each component since 1998, yields the results in Charts 4.15 and 4.16.
Chart 4.15 depicts the components of cumulative change in the community bank efficiency ratio since 1998. By far the most important factor explaining the rise in the community bank efficiency ratio since 1998 was the compression of net interest margins. Between 1998 and 2011, the ratio of net interest income to average assets declined by 41 basis points, resulting in a 5.8 percentage point increase in the community bank efficiency ratio. This factor alone explained more than 70 percent of the total increase in the community bank efficiency ratio since 1998. While noninterest income and noninterest expense helped to lower the efficiency ratio slightly in the years
leading up to the financial crisis, these factors turned into small net negatives in the years after the financial crisis. In fact, a net increase of just 6 basis points in the ratio of noninterest expense to total assets between 1998 and 2011 resulted in over one-fifth of the total increase in the community bank efficiency ratio during that interval.
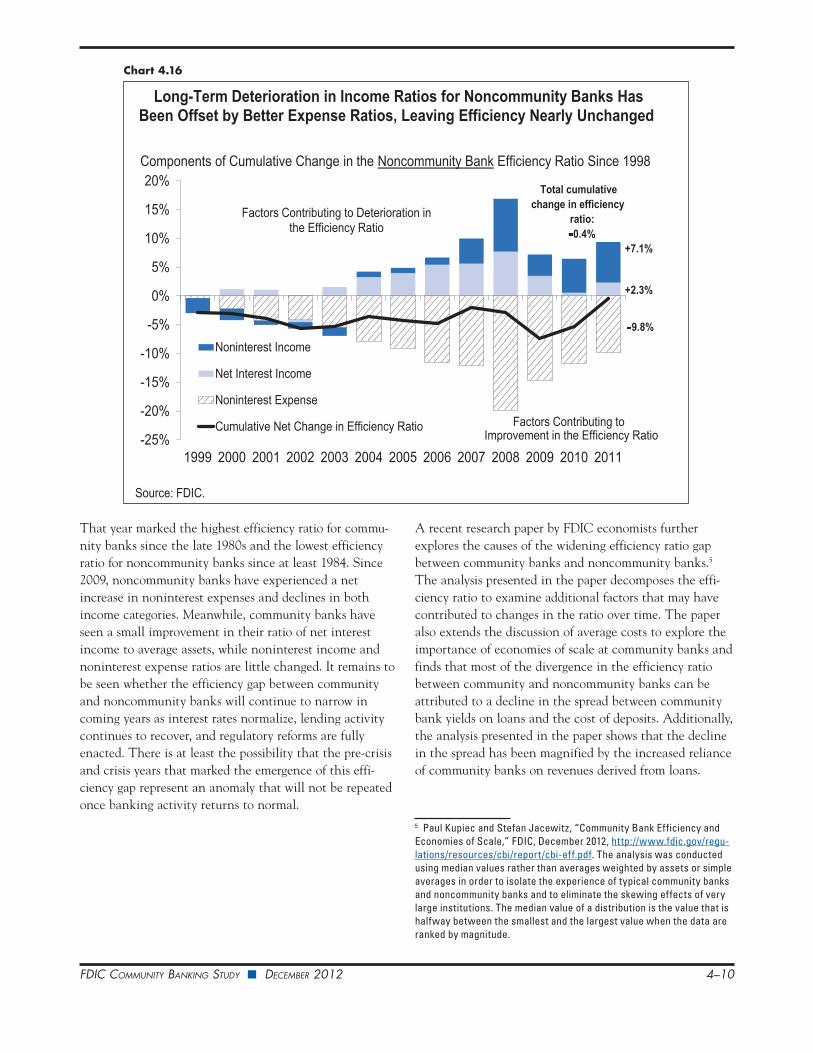
Chart 4.16 depicts the same breakdown in terms of changes in the noncommunity bank efficiency ratio. While the efficiency ratio for this group underwent only a very small 0.4 percentage point decline between 1998 and 2011, this net change belies more substantial—and largely offsetting—changes to the components of the ratio. Noncommunity banks experienced a net improvement in the ratio of noninterest expense to average assets of almost 8 basis points between 1998 and 2011. With a multiplier that averaged 19 during the period, this relatively small improvement in noninterest expenses was enough to fully cancel out the deterioration in income ratios for noncom-munity banks.
Charts 4.15 and 4.16 also show how many of these same income and expense trends contributed to the develop-ment of the even larger 19.5 percent efficiency gap in 2009.
Chart 4.15
-4%
-2%
0%
2%
4%
6%
8%
10%
12%
1999 2000 2001 2002 2003 2004 2005 2006 2007 2008 2009 2010 2011
Noninterest Income
Net Interest Income
Noninterest Expense
Cumulative Net Change in Efficiency Ratio
Components of Cumulative Change in the Community Bank Efficiency Ratio Since 1998
+5.8%
+1.6%
+0.6%
Declining Net Interest Income to Assets Explains More Than 70 Percentof the Increase in the Community Bank Efficiency Ratio Since 1998
Source: FDIC.
Total cumulative change in
efficiency ratio: +8%
Factors Contributing to Deterioration in the Efficiency Ratio
Factors Contributing to Improvement in the Efficiency Ratio
FDIC CommunIty BankIng StuDy ■ DeCemBer 2012 4–10
That year marked the highest efficiency ratio for commu-nity banks since the late 1980s and the lowest efficiency ratio for noncommunity banks since at least 1984. Since 2009, noncommunity banks have experienced a net increase in noninterest expenses and declines in both income categories. Meanwhile, community banks have seen a small improvement in their ratio of net interest income to average assets, while noninterest income and noninterest expense ratios are little changed. It remains to be seen whether the efficiency gap between community and noncommunity banks will continue to narrow in coming years as interest rates normalize, lending activity continues to recover, and regulatory reforms are fully enacted. There is at least the possibility that the pre-crisis and crisis years that marked the emergence of this effi-ciency gap represent an anomaly that will not be repeated once banking activity returns to normal.
A recent research paper by FDIC economists further explores the causes of the widening efficiency ratio gap between community banks and noncommunity banks.5 The analysis presented in the paper decomposes the effi-ciency ratio to examine additional factors that may have contributed to changes in the ratio over time. The paper also extends the discussion of average costs to explore the importance of economies of scale at community banks and finds that most of the divergence in the efficiency ratio between community and noncommunity banks can be attributed to a decline in the spread between community bank yields on loans and the cost of deposits. Additionally, the analysis presented in the paper shows that the decline in the spread has been magnified by the increased reliance of community banks on revenues derived from loans.
5 Paul Kupiec and Stefan Jacewitz, “Community Bank Efficiency and Economies of Scale,” FDIC, December 2012, http://www.fdic.gov/regu-lations/resources/cbi/report/cbi-eff.pdf. The analysis was conducted using median values rather than averages weighted by assets or simple averages in order to isolate the experience of typical community banks and noncommunity banks and to eliminate the skewing effects of very large institutions. The median value of a distribution is the value that is halfway between the smallest and the largest value when the data are ranked by magnitude.
Chart 4.16
-25%
-20%
-15%
-10%
-5%
0%
5%
10%
15%
20%
1999 2000 2001 2002 2003 2004 2005 2006 2007 2008 2009 2010 2011
Noninterest Income
Net Interest Income
Noninterest Expense
Cumulative Net Change in Efficiency Ratio
Components of Cumulative Change in the Noncommunity Bank Efficiency Ratio Since 1998
+2.3%
- 9.8%
+7.1%
Long-Term Deterioration in Income Ratios for Noncommunity Banks Has Been Offset by Better Expense Ratios, Leaving Efficiency Nearly Unchanged
Source: FDIC.
Total cumulative change in efficiency
ratio: -0.4%
Factors Contributing to Deterioration in the Efficiency Ratio
Factors Contributing to Improvement in the Efficiency Ratio
FDIC CommunIty BankIng StuDy ■ DeCemBer 2012 4–11
SummaryThe most important factor in the earnings difference between community and noncommunity banks is the abil-ity of noncommunity banks to generate noninterest income. Looking at the earnings gap through the lens of the efficiency ratio, the relationship between noninterest expense and net operating revenue shows a similar advan-tage for noncommunity banks. Another major element in bank earnings is the trade-off between net interest income and credit losses. Community banks generally have an advantage over noncommunity banks in each of those areas, reporting both higher average yields and lower loan losses than noncommunity banks. Nonetheless, gradual erosion in the net interest income ratio of community banks in recent years has pushed their efficiency ratio higher, even as community banks have added risk to their balance sheets in search of additional yield. Chapter 5 examines the shift in community bank balance sheets and the prevalence and performance of different bank lending specialties.

FDIC CommunIty BankIng StuDy ■ DeCemBer 2012 4–12