chapter 4. crop and growing conditions in china 4. crop and growing conditions in china |73...
TRANSCRIPT

68 |
Chapter 4. Crop and growing conditions in
China
Chapter 4 presents a detailed CropWatch analysis for China, focusing on seven regions. Environmental
indices by province are provided in table A.4 in Annex A.
4.1. Overview
In China, early October—the beginning of the reporting period for this bulletin—is the time most winter
crops like winter wheat and rapeseed are planted, right after the harvesting of the autumn crops. From
October 2013 to January 2014, environmental conditions in China were generally favorable, compared to
averages for the same period over the previous five years (table 4.1). Specifically, average temperature
was almost one and a half degrees above the five-year and 2001-2013 average. It should be highlighted
that rainfall was 25 percent higher than normal and PAR even exceeded the record level of 2001,
reaching 680 W/m2. However, the maximum Vegetation Condition Index (VCI) for China was only at a 12-
year average level and slightly below the recent five-year average. Figure 4.1 illustrates the maximum VCI
by pixel.
Figure 4.1. China maximum Vegetation Condition Index (VCI), by pixel
Environmental conditions are distributed unevenly, resulting in a very interesting situation. Favorable
conditions benefited winter crops in Sichuan Basin and neighboring regions, as well as Guangxi, eastern
Jiangsu, and north coastal area of the Bohai Gulf. However, for the Central of North China Plain—major
winter wheat producing regions—rainfall was only 61 mm during October to January, 20 percent below
normal. In addition, almost no snow fell until the end of January and the winter wheat in this region is
suffering agricultural drought. Then, in early February, a wide range of heavy snowfall occurred, covering
the whole northern China. Good moisture conditions were maintained after the snow melted. Together
with the warmer and sunny winter weather, the development of winter wheat in those regions will be
advanced, despite the drought during the winter period.

CHAPTER 4. CROP AND GROWING CONDITIONS IN CHINA |69
The ratio of uncropped arable land (UAL, figure 4.2) was 0.31 for the last four months, with most of the
UAL found in the Northeast China region and the most northern part of the North China Plain where
almost no crops can survive during the cold winter. In general, because of the warmer temperatures
across China, more winter crops survived and the UAL ratio was 3 percent below the 2001-2013 average.
Figure 4.2. Cropped and uncropped arable land for major winter wheat producing regions in China, November 2013
Note: Map based on 30m resolution HJ-1 CCD images. White (inside the major producing region) means no arable land; white (outside the major producing region) means not covered; invalid means no data.
Considering only the twelve provincial level divisions (the colored sections in figure 4.2) that normally
produce 85 percent of wheat in China, the uncropped arable land ratio is 0.02 below the ratio of the
winter crop season in 2012-2013 (0.28), a notable decrease—indicating that the planting area of winter
crops (winter wheat and rapeseed) increased compared to last year.
Table 4.1. Environmental and crop indices for China, October 2013 to January 2014 departure from 5YA and 12YA
Environmental indices departure
from 12YA (2001-2013)
Crop indicators departure from 5YA
(2008-2013)
Rainfall
total
(%)
Temperature
average
(°C)
PAR
accumulation
(%)
Biomass
accumulation
(%)
Uncropped arable
land in % of pixels
(Absolute difference
in % points)
Maximum VCI
(absolute
difference)
Huanghuaihai -25 0.9 13 -16 -2.5 0.01
Inner Mongolia 38 1.7 7 43 -18.2 0.16
Loess region 3 1.0 12 0 1.5 0.03
Lower Yangtze 16 0.4 14 -13 1.4 0.00
North-East 55 1.3 6 28 -2.5 0.02
Southern China 20 0.3 4 3 0.2 -0.01
South West 26 -0.5 5 5 -5.0 0.03
Note: Departures are expressed in relative terms (percentage) for all variables, except for temperature, for which absolute departure in degrees Celsius is given. Zero means no change from the average value; Relative departures are calculated as (C-R)/R*100, with C=current value and R=reference value, which is the five- or twelve-year average for the same period between October 2008 and January 2013 (5YA) or October 2001 and January 2013 (12YA). VCI=Vegetation condition index.

70 | CROPWATCH BULLETIN FEBRUARY 2014
Most of the uncropped arable land this reporting period was located in northern and western Gansu
province, mountain areas in eastern Shanxi province, and in southern Anhui. Farmlands in the first two
regions were uncropped due to the low temperatures, while the uncropped arable land in southern
Anhui and southeastern Sichuan are paddy fields kept for rice cultivation in spring. Uncropped arable
lands were also observed along the west coast areas of the Bohai Bay and in the Yellow river delta. In
these regions, salinization and alkalization of farmland soil are the major problems for the crops.
Minimum VHI during the last four months indicates that Chongqing and adjacent provinces, as well as
Henan, north of Jiangxi, and Yangtze River delta experienced mild water stress, while in other regions,
water was adequate for crop growth or planting (figure 4.3).
Figure 4.3. Minimum Vegetation Health Index China, October 2013-January 2014
4.2. Regional analysis
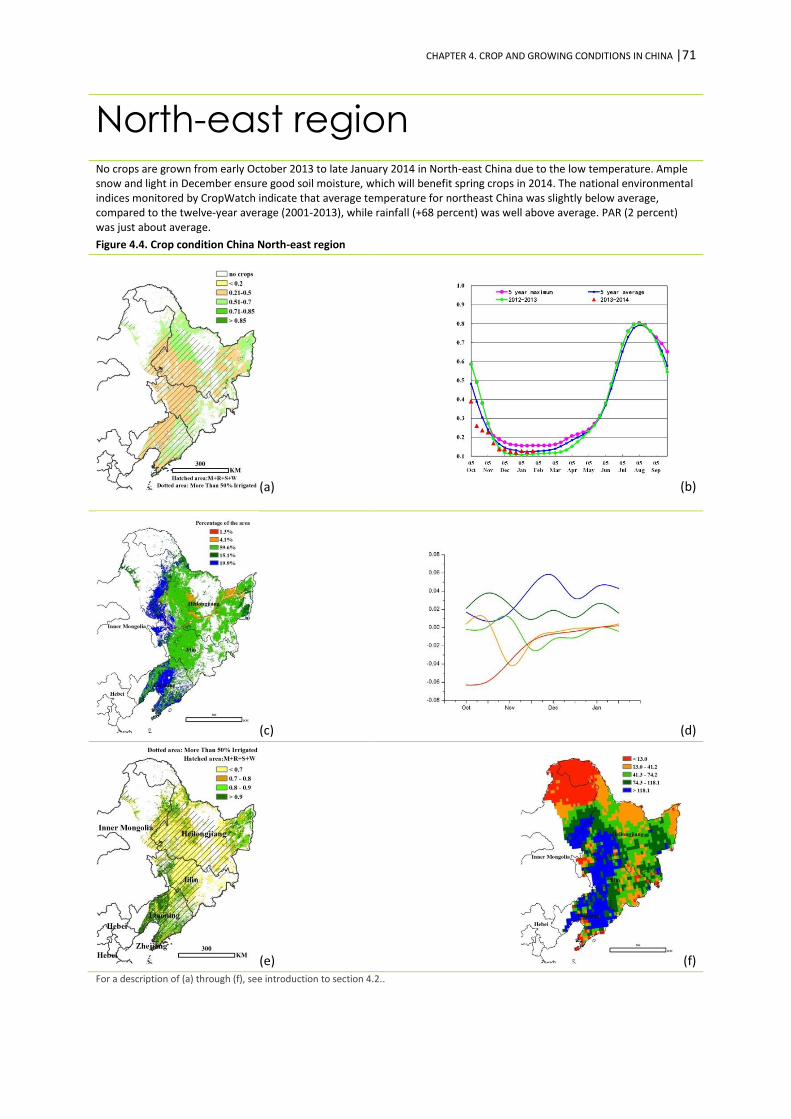
For each of China’s seven regions, the figures 4.4 through 4.10 present crop condition information. The
provided information is as follows: (a) General setting: NDVI background; combined maize, rice, soybean
and wheat cultivation area, and areas where more than 50 percent of the land is irrigated; (b) Crop
condition development graph based on NDVI, comparing the latest season (since October 2013) to the
five-year average (5YA), the five-year maximum, and the October 2012-October 2013 period; (c) Spatial
NDVI patterns for October 3 2013- January 3 2014 (compared to the (5YA); (d) NDVI profiles associated
with the spatial patterns under (c); (e) maximum VCI (over arable land mask) for October 1 2013- January
30 2014; and (f) biomass for the period October 1 2013 – January 30 2014. Additional information about
environmental indices for China is provided in Annex A, table A.4.
CHAPTER 4. CROP AND GROWING CONDITIONS IN CHINA |71
North-east region
No crops are grown from early October 2013 to late January 2014 in North-east China due to the low temperature. Ample snow and light in December ensure good soil moisture, which will benefit spring crops in 2014. The national environmental indices monitored by CropWatch indicate that average temperature for northeast China was slightly below average, compared to the twelve-year average (2001-2013), while rainfall (+68 percent) was well above average. PAR (2 percent) was just about average.
Figure 4.4. Crop condition China North-east region
(a) (b)
(c) (d)
(e) (f) For a description of (a) through (f), see introduction to section 4.2..

72 | CROPWATCH BULLETIN FEBRUARY 2014
Inner Mongolia
Due to low temperature, no crops can survive in the four months (October to January) covered by this bulletin. Considering the last four months, rainfall and biomass index are above the recent five-year average. As a result, conditions will be favorable for the sowing of spring crops. However, temperature was higher than average and rainfall below average in January in most areas in Inner Mongolia, which may have some influence on spring crops by prematurely depleting soil moisture reserves.
Figure 4.5. Crop condition China Inner Mongolia region
(a) (b)
(c) (d)
(e) (f)
For a description of (a) through (f), see introduction to section 4.2.

CHAPTER 4. CROP AND GROWING CONDITIONS IN CHINA |73
Huanghuaihai
After winter wheat sowing in October 2013 in Huanghuaihai region, the crop was initially negatively affected by dry weather: compared with the 2001-13 (twelve-year) average, rainfall and biomass decreased, while temperature and PAR were above average. In early November, enough rainfall and moderate temperature promoted the growth of crops; by the end of January 2014, crop condition was better than that of the last year and recent five-year average. The profiles of NDVI clusters are mostly above average, except for the regions in central Shandong where maximum VCI is low (as shown in figure (e)). The uncropped arable land ratio decreased by 2.5 percentage points, indicating an increased winter wheat area. Maximum VCI was 1 percentage point higher than the average of the previous five years.
Figure 4.6. Crop condition China Huanghuaihai region
(a) (b)
(c) (d)
(e) (f)
For a description of (a) through (f), see introduction to section 4.2.

74 | CROPWATCH BULLETIN FEBRUARY 2014
Loess region
The early growth of winter wheat in the Loess region was inhibited due to drought and high temperature. In November, weather conditions favored the growth of winter wheat, while in December rainfall was below the previous year’s. Crop condition showed fluctuations conditioned by rainfall changes. The NDVI cluster and profiles confirm that crop condition was below normal in the north of Henan province, while in most of Shanxi, Shaanxi, and Gansu provinces, crop condition was above average when compared to the recent five years. The maximum vegetation condition indices are very high in central Gansu province, and the value of maximum VCI increased by 3 percent when compared to the twelve-year average. This might be the result of favorable rainfall (+18 percent over the last decade), temperature (+1.1 percent), and PAR (+10 percent).
Figure 4.7. Crop condition China Loess region
(a) (b)
(c) (d)
(e) (f)
For a description of (a) through (f), see introduction to section 4.2.

CHAPTER 4. CROP AND GROWING CONDITIONS IN CHINA |75
Lower Yangtze region
The environmental indices indicate that rainfall, temperature, and PAR are higher than the twelve-year average in the Lower Yangtze region, which promoted the growth of winter wheat in the past four months. From October 2013, the drought and below average rainfall constrained the growth of crops. In November, temperature in most areas in the region remained normal or was above temperatures the previous year; suitable moisture favored the recovery of crops. By the end of November, crop condition was better than the five-year average. As for January 2014, crops in the Lower Yangtze region were affected by heavy rainfall, resulting in below average condition in the center the region. The profiles of NDVI clusters are mostly above average, in other words, crops in Lower Yangtze region performed well over the monitoring season. High value of the maximum vegetation condition index in Jiangsu and Hunan province also support this.
Figure 4.8. Crop condition China Lower Yangtze region
(a) (b)
(c) (d)
(e) (f) For a description of (a) through (f), see introduction to section 4.2.

76 | CROPWATCH BULLETIN FEBRUARY 2014
Southwest China
The characteristics of the ongoing season in Southwest China were excessive precipitation (17 percent above the twelve-year average), lower temperature (0.3°C below the average) and normal PAR accumulation. All these features led to an increase in biomass by 5 percent. In October, the dry weather inhibited the growth of the crops in southwest China. In early November, southeast Sichuan, southwest Chongqing, and northwestern parts of Guizhou all experienced excessive rainfall along with limited sunshine (less than 40 hours of bright sunshine per month) which reduced crop photosynthesis. Furthermore, lower temperature in December limited the growth of crops. In January, favorable temperature and adequate light boosted the growth of crops. The cluster and profiles of NDVI show that crop condition in the east of Sichuan province was better than in the other areas. The maximum VCI in most regions of Southwest China was above 0.8 which indicates a positive outcome of the season is not unlikely.
Figure 4.9. Crop condition Southwest China region
(a) (b)
(c) (d)
(e) (f) For a description of (a) through (f), see introduction to section 4.2.

CHAPTER 4. CROP AND GROWING CONDITIONS IN CHINA |77
Southern China
In Southern China, November is the main harvesting season for late rice. The results of the environmental conditions monitoring by CropWatch in the past four months show that the maximum VCI decreased by 1 percent from the five-year (2008-2013) average and average temperature increased by 0.4°C from the twelve-year average; PAR also increased (+2 percent) and rainfall exceeded the average of the recent twelve years by 17 percent. All these changes led to an estimated biomass accumulation increase of 3 percent. The profile of NDVI clusters and maximum VCI indicate that crops in Guangxi grew better than in other regions: only 23 percent of pixels show crop condition below the average of the recent five years. The maximum VCI is below 0.7 in southeast of Fujian and Guangdong province, which indicates that crop condition in these regions was inferior to the average of the previous five years. Several reasons can account for this, especially typhoon Haiyan (which brought excessive precipitations in November) as well as the low temperature in January 2014.
Figure 4.10. Crop condition Southern China region
(a) (b)
(c) (d)
(e) (f)
For a description of (a) through (f), see introduction to section 4.2.