chapter 4 engineering surveys and investigations · • soil and material investigations •...
TRANSCRIPT

Chapter 4
Engineering Surveys and Investigations
KD5 :Final Feasibility Report including Schedules
Consultancy Services for Preparation of Feasibility Report for Construction of Bridges including Approaches on Tamu – Kyigone – Kalewa Road Section from km 0.00 to km 149.70 in Myanmar
MEA 4-1
4. ENGINEERING SURVEYS AND INVESTIGATIONS
4.1 GENERAL
Based on the requirement enumerated in the terms of reference for “Preparation of Feasibility Report for Construction of Bridges including Approaches on Tamu – Kyigone – Kalewa Road Section from km 0.00 to km 149.70 in Myanmar” consultants had carried out engineering surveys and investigations as given below: • Topographical Survey • Road Inventory and Condition survey (for bridge approaches) • Inventory of 71 steel bridges • Inventory of culverts and other structures falling on bridge approaches • Pavement Condition Survey • Soil and Material investigations • Hydrology and Drainage Studies • Traffic Surveys and Analysis • Geo-Technical Investigations
4.2 TOPOGRAPHICAL SURVEY
4.2.1 Introduction
Consultants has carried out the Topographical Survey required in connection with preparation of Feasibility Report for construction of bridges including approaches on Tamu – Kyigone – Kalewa Road section from km 0.0 to km 149.70 in Myanmar. The total numbers of existing Steel Bridges on project section are 71.This section covers the technical details for establishment of control framework and subsequent detailed Topographical Surveys for the project road.
4.2.2 Objective
The basic objective of topographical survey is to determine three dimensional positions of all ground features in the form of x, y and z coordinates with respect to a defined reference systemto generate accurate digital terrain model of the project road corridor for preparation of strip plan,designing, working out improvements, rehabilitation, and up-gradation of the project road, design additional facilities, alterations and additions for its development.
4.2.3 Scope of Work
Broad outline of the scope of services are:
i) Carryout Topographical Survey using Total Station for Bridge and Approaches (generally for a length of 300m on either side)
ii) Fixing of control frame work comprising of the following activities:
a) Establishment of Main Control by DGPS.
b) Establishment of Subsidiary Control Points by Total Station.
c) Establishment of Height Control by Digital Level.
iii) Additional survey as required for geometric improvements at bridge locations, hydrological requirements and realignments.
KD5 :Final Feasibility Report including Schedules
Consultancy Services for Preparation of Feasibility Report for Construction of Bridges including Approaches on Tamu – Kyigone – Kalewa Road Section from km 0.00 to km 149.70 in Myanmar
MEA 4-2
4.2.4 General Terrain
The road passes through Plain and Rolling terrain from km 0.00 to km 121.690 and from km 121.690 tokm 149.70 of the project road is passing through hilly terrain.
4.2.5 Methodology
The complete methodology adopted for conducting topographical survey for the project road comprises of the following activities.
4.2.5.1 Establishment of Main Control by DGPS
(a) Fixing of GPS Pillars
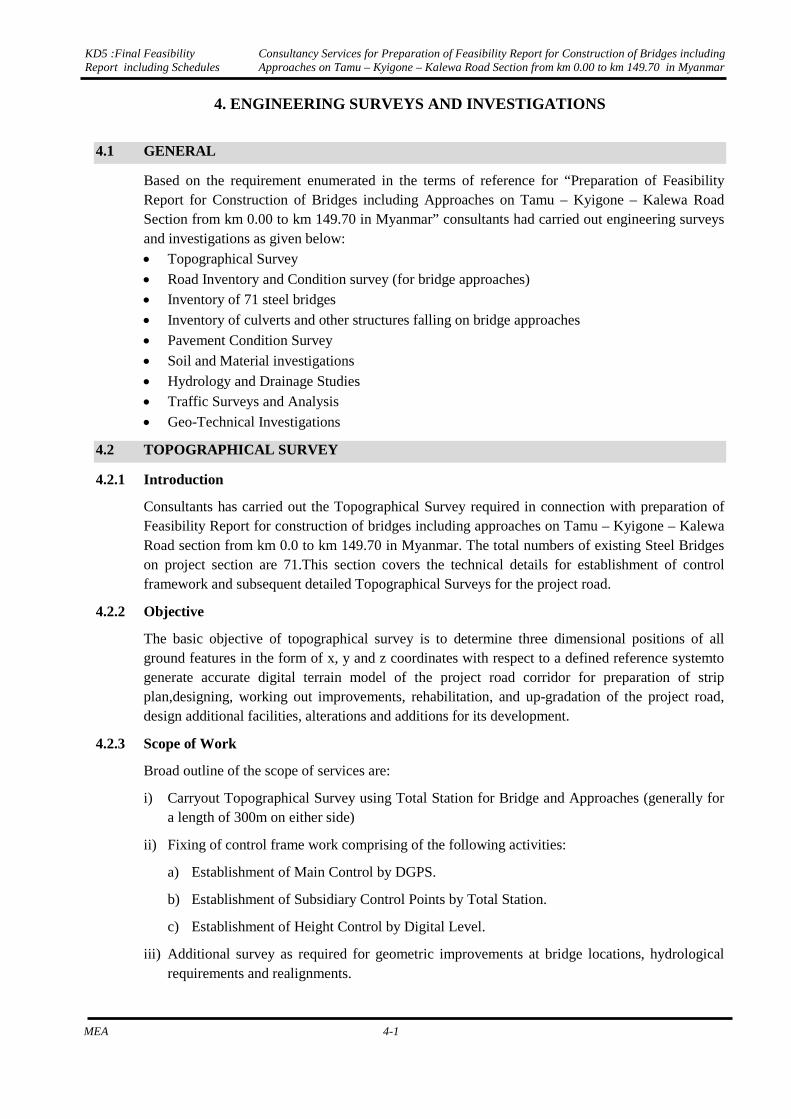
Keeping in view the importance and stability of control points, RCC pillars of specified dimensions 150 mm x 150 mm and 450 mm in height with an iron pin fixed at the top center of each pillar were got pre-casted. After proper curing, these precast RCC pillars were embedded in ground projecting about 15 cm above ground level. The balance 30cm was embedded in ground with concrete cement layer all around to ascertain stability of the pillars. The top projected part of the pillar was painted yellow. All pillars were uniquely numbered. The locations of pillars were arranged in such a way that twin inter-visible points about 200-250m apart are available at 50 bridge locations (those Bridges which are very close have been clubbed together). Pair of twin GPS pillars has the advantage that any stretch can be independently used for starting and closing the traverse by Total Station.
The location of the pillars was suitably selected away from the road but within the ROW so that it is not disturbed by traffic. Also the site was selected in an open area so that the signals from the satellite are received from all. Proper description and sketch of the location of each pillar with respect to the surrounding details were prepared to ensure easy identification and traceability.Photo 4.1 to 4.4depicts the fixing of pillars.
Photo 4.1: GPS Pillar fixing in progress Photo 4.2: Painting on GPS Pillar
KD5 :Final Feasibility Report including Schedules
Consultancy Services for Preparation of Feasibility Report for Construction of Bridges including Approaches on Tamu – Kyigone – Kalewa Road Section from km 0.00 to km 149.70 in Myanmar
MEA 4-3
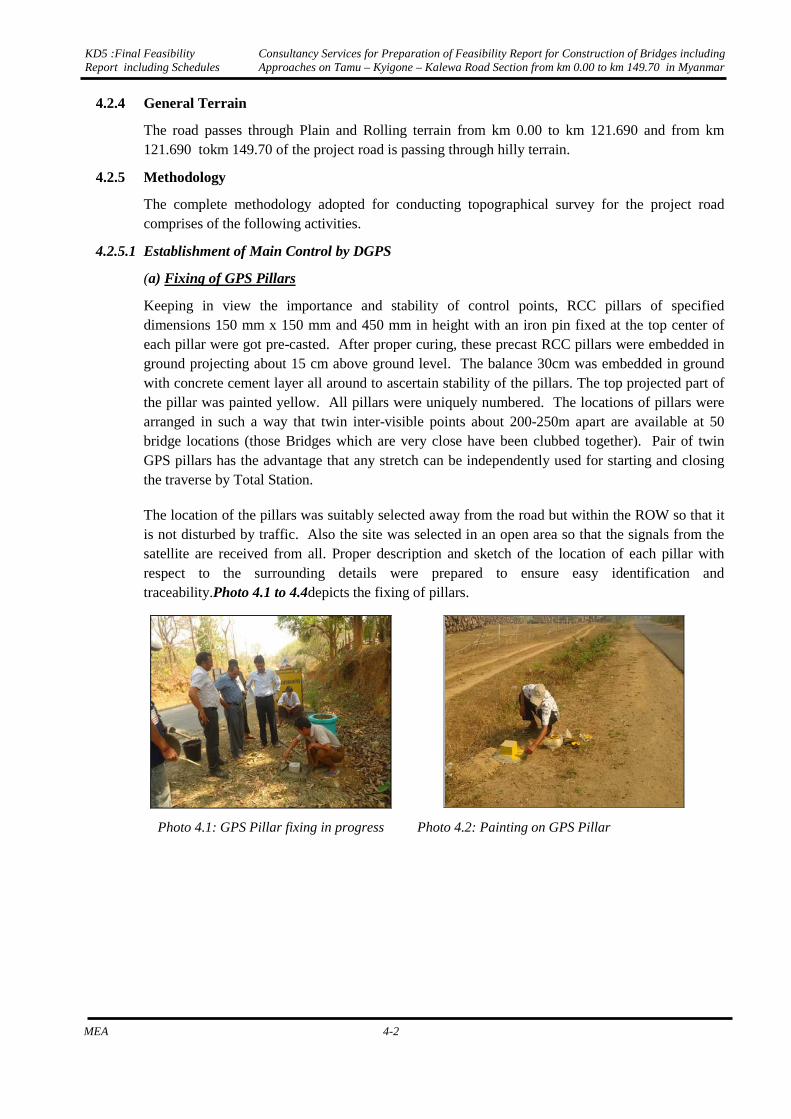
Photo 4.3: GPS Pillar after Identification Photo 4.4: GPS Pillar after Identification
(b) GPS Observations
Geomax ZENITH - 20, DUAL FREQUENCY DGPS GEOMAX - 72 CHANNEL WITH GLONOSS, RTK & POST PROCESSING ACTIVATED instruments were used. For the purpose of fixing starting control point to the best possible absolute accuracy, GPS observations were taken continuously for a period of about 12 hours near Bridge No.1 at km 0.00 (near immigration office) in Tamu and near Bridge No. 71 in Kalewa. Based on this long observation, the coordinates of GPS were computed in “single point positioning” mode. Accepting GPS as the fixed point, the other points were observed in continuity and computed in “base line” mode.
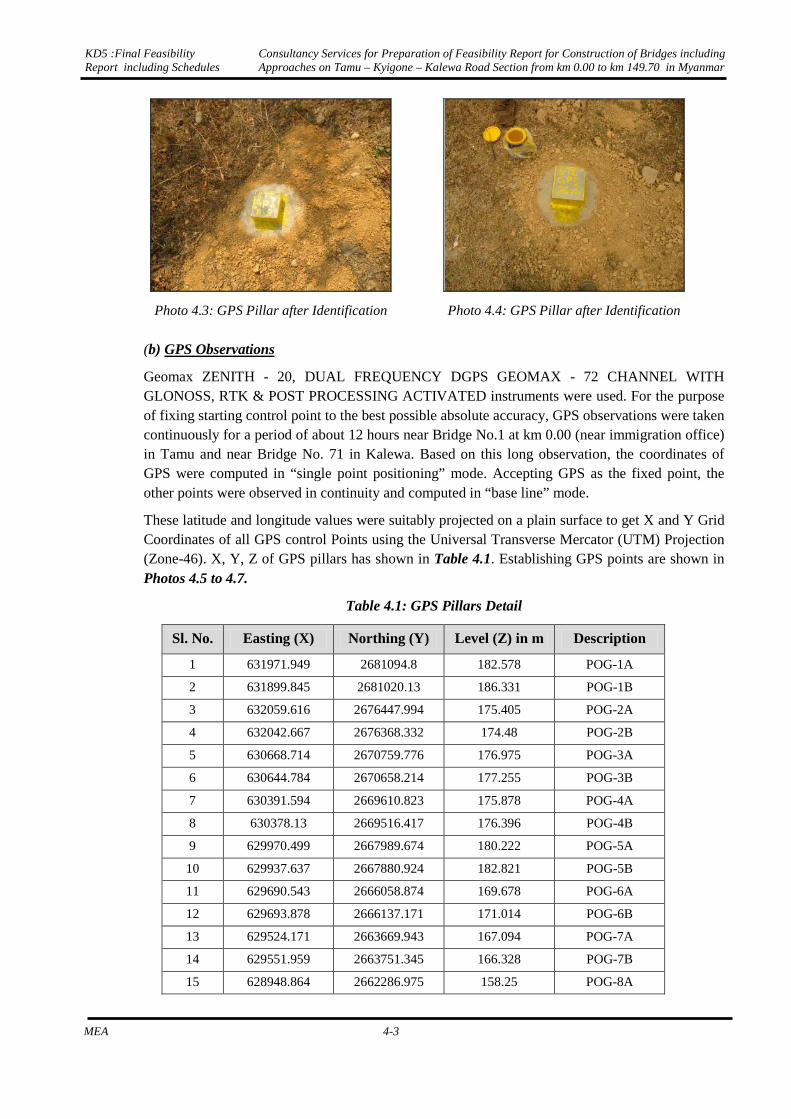
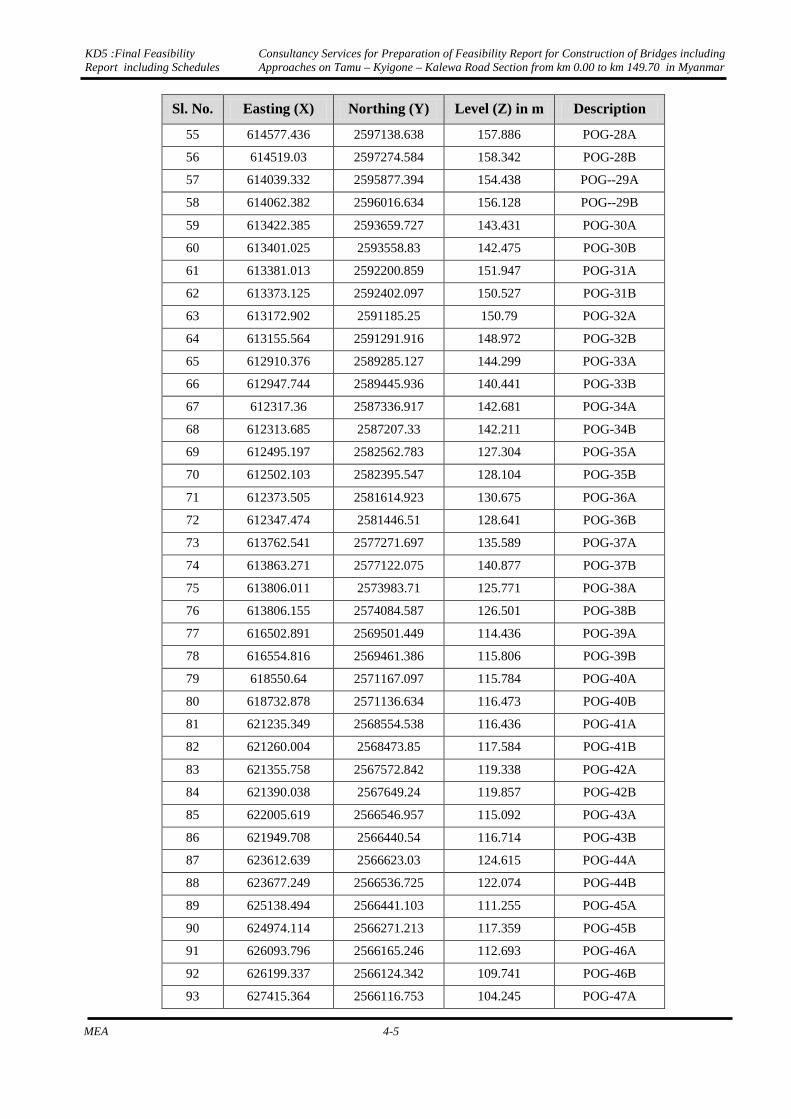
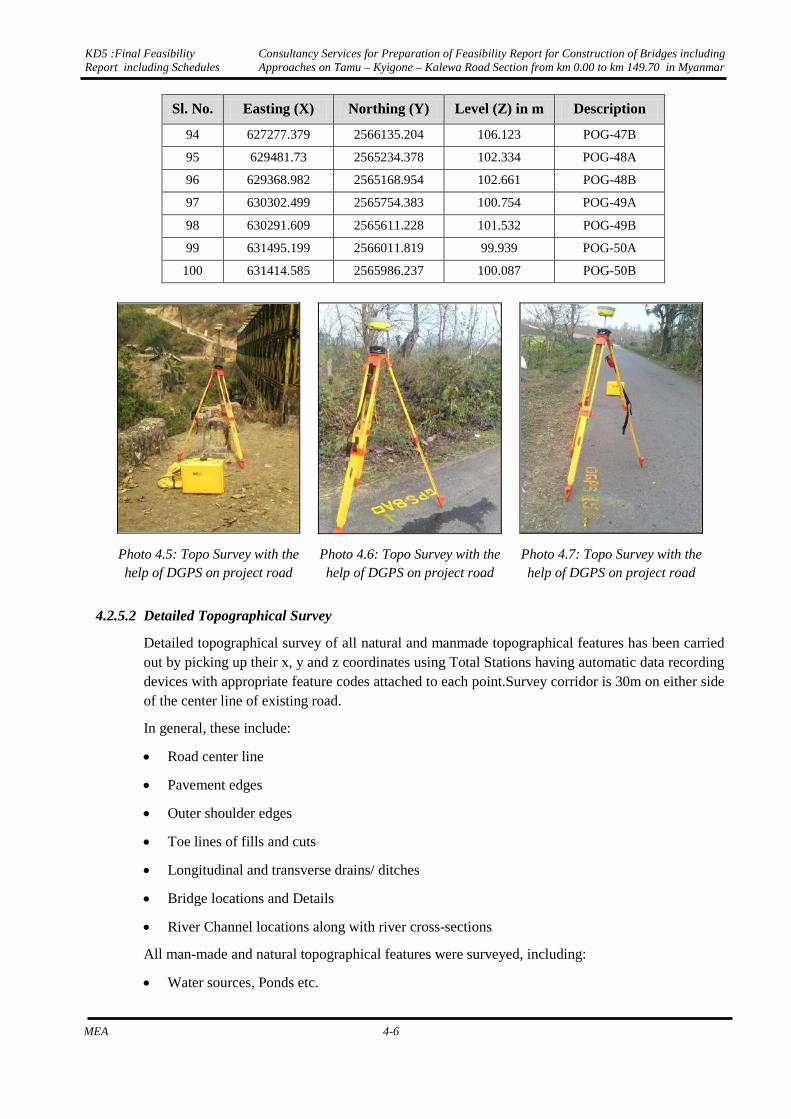
These latitude and longitude values were suitably projected on a plain surface to get X and Y Grid Coordinates of all GPS control Points using the Universal Transverse Mercator (UTM) Projection (Zone-46). X, Y, Z of GPS pillars has shown in Table 4.1. Establishing GPS points are shown in Photos 4.5 to 4.7.
Table 4.1: GPS Pillars Detail
Sl. No. Easting (X) Northing (Y) Level (Z) in m Description
1 631971.949 2681094.8 182.578 POG-1A
2 631899.845 2681020.13 186.331 POG-1B
3 632059.616 2676447.994 175.405 POG-2A
4 632042.667 2676368.332 174.48 POG-2B
5 630668.714 2670759.776 176.975 POG-3A
6 630644.784 2670658.214 177.255 POG-3B
7 630391.594 2669610.823 175.878 POG-4A
8 630378.13 2669516.417 176.396 POG-4B
9 629970.499 2667989.674 180.222 POG-5A
10 629937.637 2667880.924 182.821 POG-5B
11 629690.543 2666058.874 169.678 POG-6A
12 629693.878 2666137.171 171.014 POG-6B
13 629524.171 2663669.943 167.094 POG-7A
14 629551.959 2663751.345 166.328 POG-7B
15 628948.864 2662286.975 158.25 POG-8A
KD5 :Final Feasibility Report including Schedules
Consultancy Services for Preparation of Feasibility Report for Construction of Bridges including Approaches on Tamu – Kyigone – Kalewa Road Section from km 0.00 to km 149.70 in Myanmar
MEA 4-4
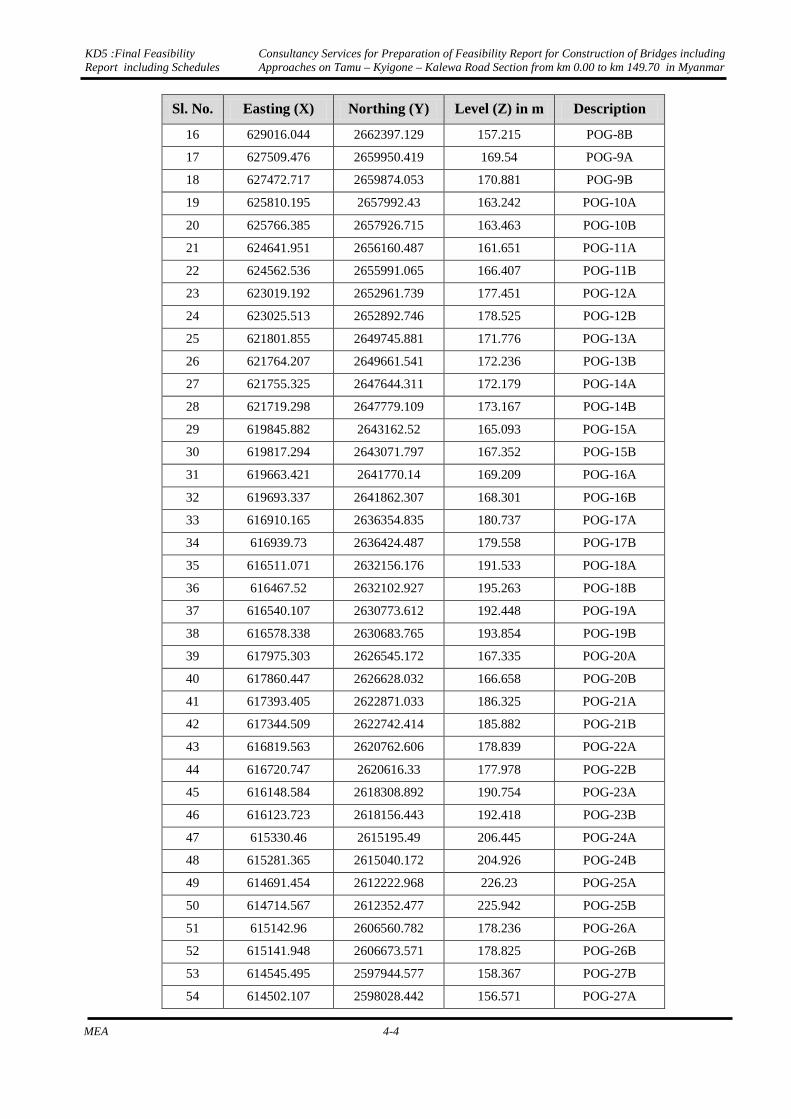
Sl. No. Easting (X) Northing (Y) Level (Z) in m Description
16 629016.044 2662397.129 157.215 POG-8B
17 627509.476 2659950.419 169.54 POG-9A
18 627472.717 2659874.053 170.881 POG-9B
19 625810.195 2657992.43 163.242 POG-10A
20 625766.385 2657926.715 163.463 POG-10B
21 624641.951 2656160.487 161.651 POG-11A
22 624562.536 2655991.065 166.407 POG-11B
23 623019.192 2652961.739 177.451 POG-12A
24 623025.513 2652892.746 178.525 POG-12B
25 621801.855 2649745.881 171.776 POG-13A
26 621764.207 2649661.541 172.236 POG-13B
27 621755.325 2647644.311 172.179 POG-14A
28 621719.298 2647779.109 173.167 POG-14B
29 619845.882 2643162.52 165.093 POG-15A
30 619817.294 2643071.797 167.352 POG-15B
31 619663.421 2641770.14 169.209 POG-16A
32 619693.337 2641862.307 168.301 POG-16B
33 616910.165 2636354.835 180.737 POG-17A
34 616939.73 2636424.487 179.558 POG-17B
35 616511.071 2632156.176 191.533 POG-18A
36 616467.52 2632102.927 195.263 POG-18B
37 616540.107 2630773.612 192.448 POG-19A
38 616578.338 2630683.765 193.854 POG-19B
39 617975.303 2626545.172 167.335 POG-20A
40 617860.447 2626628.032 166.658 POG-20B
41 617393.405 2622871.033 186.325 POG-21A
42 617344.509 2622742.414 185.882 POG-21B
43 616819.563 2620762.606 178.839 POG-22A
44 616720.747 2620616.33 177.978 POG-22B
45 616148.584 2618308.892 190.754 POG-23A
46 616123.723 2618156.443 192.418 POG-23B
47 615330.46 2615195.49 206.445 POG-24A
48 615281.365 2615040.172 204.926 POG-24B
49 614691.454 2612222.968 226.23 POG-25A
50 614714.567 2612352.477 225.942 POG-25B
51 615142.96 2606560.782 178.236 POG-26A
52 615141.948 2606673.571 178.825 POG-26B
53 614545.495 2597944.577 158.367 POG-27B
54 614502.107 2598028.442 156.571 POG-27A
KD5 :Final Feasibility Report including Schedules
Consultancy Services for Preparation of Feasibility Report for Construction of Bridges including Approaches on Tamu – Kyigone – Kalewa Road Section from km 0.00 to km 149.70 in Myanmar
MEA 4-5
Sl. No. Easting (X) Northing (Y) Level (Z) in m Description
55 614577.436 2597138.638 157.886 POG-28A
56 614519.03 2597274.584 158.342 POG-28B
57 614039.332 2595877.394 154.438 POG--29A
58 614062.382 2596016.634 156.128 POG--29B
59 613422.385 2593659.727 143.431 POG-30A
60 613401.025 2593558.83 142.475 POG-30B
61 613381.013 2592200.859 151.947 POG-31A
62 613373.125 2592402.097 150.527 POG-31B
63 613172.902 2591185.25 150.79 POG-32A
64 613155.564 2591291.916 148.972 POG-32B
65 612910.376 2589285.127 144.299 POG-33A
66 612947.744 2589445.936 140.441 POG-33B
67 612317.36 2587336.917 142.681 POG-34A
68 612313.685 2587207.33 142.211 POG-34B
69 612495.197 2582562.783 127.304 POG-35A
70 612502.103 2582395.547 128.104 POG-35B
71 612373.505 2581614.923 130.675 POG-36A
72 612347.474 2581446.51 128.641 POG-36B
73 613762.541 2577271.697 135.589 POG-37A
74 613863.271 2577122.075 140.877 POG-37B
75 613806.011 2573983.71 125.771 POG-38A
76 613806.155 2574084.587 126.501 POG-38B
77 616502.891 2569501.449 114.436 POG-39A
78 616554.816 2569461.386 115.806 POG-39B
79 618550.64 2571167.097 115.784 POG-40A
80 618732.878 2571136.634 116.473 POG-40B
81 621235.349 2568554.538 116.436 POG-41A
82 621260.004 2568473.85 117.584 POG-41B
83 621355.758 2567572.842 119.338 POG-42A
84 621390.038 2567649.24 119.857 POG-42B
85 622005.619 2566546.957 115.092 POG-43A
86 621949.708 2566440.54 116.714 POG-43B
87 623612.639 2566623.03 124.615 POG-44A
88 623677.249 2566536.725 122.074 POG-44B
89 625138.494 2566441.103 111.255 POG-45A
90 624974.114 2566271.213 117.359 POG-45B
91 626093.796 2566165.246 112.693 POG-46A
92 626199.337 2566124.342 109.741 POG-46B
93 627415.364 2566116.753 104.245 POG-47A
KD5 :Final Feasibility Report including Schedules
Consultancy Services for Preparation of Feasibility Report for Construction of Bridges including Approaches on Tamu – Kyigone – Kalewa Road Section from km 0.00 to km 149.70 in Myanmar
MEA 4-6
Sl. No. Easting (X) Northing (Y) Level (Z) in m Description
94 627277.379 2566135.204 106.123 POG-47B
95 629481.73 2565234.378 102.334 POG-48A
96 629368.982 2565168.954 102.661 POG-48B
97 630302.499 2565754.383 100.754 POG-49A
98 630291.609 2565611.228 101.532 POG-49B
99 631495.199 2566011.819 99.939 POG-50A
100 631414.585 2565986.237 100.087 POG-50B
Photo 4.5: Topo Survey with the help of DGPS on project road
Photo 4.6: Topo Survey with the help of DGPS on project road
Photo 4.7: Topo Survey with the help of DGPS on project road
4.2.5.2 Detailed Topographical Survey
Detailed topographical survey of all natural and manmade topographical features has been carried out by picking up their x, y and z coordinates using Total Stations having automatic data recording devices with appropriate feature codes attached to each point.Survey corridor is 30m on either side of the center line of existing road.
In general, these include:
• Road center line
• Pavement edges
• Outer shoulder edges
• Toe lines of fills and cuts
• Longitudinal and transverse drains/ ditches
• Bridge locations and Details
• River Channel locations along with river cross-sections
All man-made and natural topographical features were surveyed, including:
• Water sources, Ponds etc.
KD5 :Final Feasibility Report including Schedules
Consultancy Services for Preparation of Feasibility Report for Construction of Bridges including Approaches on Tamu – Kyigone – Kalewa Road Section from km 0.00 to km 149.70 in Myanmar
MEA 4-7
• Culverts with their type and number
• Electric and telephone lines
• Huts, Buildings, fences, stairs, hand pumps, bore wells, wells
• All Buildings were collected with suitable codes depending upon its classification like residential, commercial, educational, health Center, industrial, religious etc.
• Oil and gas pipe lines
• All trees with girth greater than 0.3 meter.
At locations, where existing alignment cross other roads, the survey was extended to 100 to 200 m on either side of the road center to allow for the geometric improvements. Cross sections at every 50 m interval in flat terrain and at lesser interval on undulating terrain or horizontal curves were also taken using Total Stations.
Rivers/ Streams/Canals Crossing
All crossing rivers/canals were surveyed up to 200-300m on upstream and downstream sides. Cross Sections across the channel were taken. Top and bottom of both the banks and center line of the deepest bed channel has been precisely picked up by total station survey.
Longitudinal and Cross-Sections
The topographic survey for Longitudinal and cross-section covers the following
Levels for longitudinal section were picked up at an interval of 25 meter or less at intersections and change of slope along the centerline of the road.
Cross sections were generally taken at every 50 meter interval along the existing road, but cross section interval is reduced in rolling/undulating terrain to take care of rapid change of slope.
4.2.6 Data Processing
All data from the total stations, and other field records, was downloaded regularly on to the field computer and processed with Geomax software, to form proper connectivity of linear features based on the feature code and sequence of points collected on ground. Based on the heights of linear features and spot heights, Digital Elevation Model was generated to check for any holes or void in the model. The hard copy output of the plan survey drawing on suitable scale was taken to the ground by senior surveyor for physical verification on the ground to check details and for picking up names of the villages and other missing relevant information. After complete examination, the data was sent to Head Quarters for further processing for design and drawings.
4.2.7 Feature Codes
Surveyors used unique feature codes for all ground features while picking up the X, Y and Z coordinates by Total Station during field survey of topographical details.
4.2.8 Quality Control
Adequate quality assurance measures were incorporated in the methodology, which were followed at every stage. The senior surveyor assigned for the total survey work carried out constant check on day-to-day survey activities. The senior surveyor had constant check on the accuracy part including proper adjustment procedures and ensured that criteria of adjustment required for traverse and leveling were within the allowable limits. The final survey sheets were physically
KD5 :Final Feasibility Report including Schedules
Consultancy Services for Preparation of Feasibility Report for Construction of Bridges including Approaches on Tamu – Kyigone – Kalewa Road Section from km 0.00 to km 149.70 in Myanmar
MEA 4-8
verified by the senior surveyor during ground visits. Digital terrain models were generated at the field headquarters to ensure quality output.
4.3 BRIDGE/ STRUCTURES INVENTORY
4.3.1 General
As two existing steel bridges are under construction, remaining 69 steel bridges were considered for the study for preparation of feasibility report.
4.3.2 Secondary data
Before undertaking field surveys, all concerned authorities were contacted to ascertain the availability of any past inventory and condition survey reports of existing bridges, sub-surface and geotechnical data, hydraulic data, as-built drawings, etc. Accordingly detailed field survey, site investigation and collection of data were carried out by the Consultant’s team of engineers.
4.3.3 Field Surveys
The following field surveys were carried out in accordance with the provisions of IRC: SP: 35-1990.
• Inventory of existing bridges / structures
• Visual condition survey of existing bridges / structures
Details of Bridges with photographs are presented in Annexure 4.1.
Detailed Bridge inventory and Condition Survey are presented in Annexure 4.2 and 4.3.
Detailed inventory and condition survey of 3 nos. of R.C.C. minor bridges which are falling on 69 steel bridge approaches have also been carriedout and presented in Annexure 4.4.
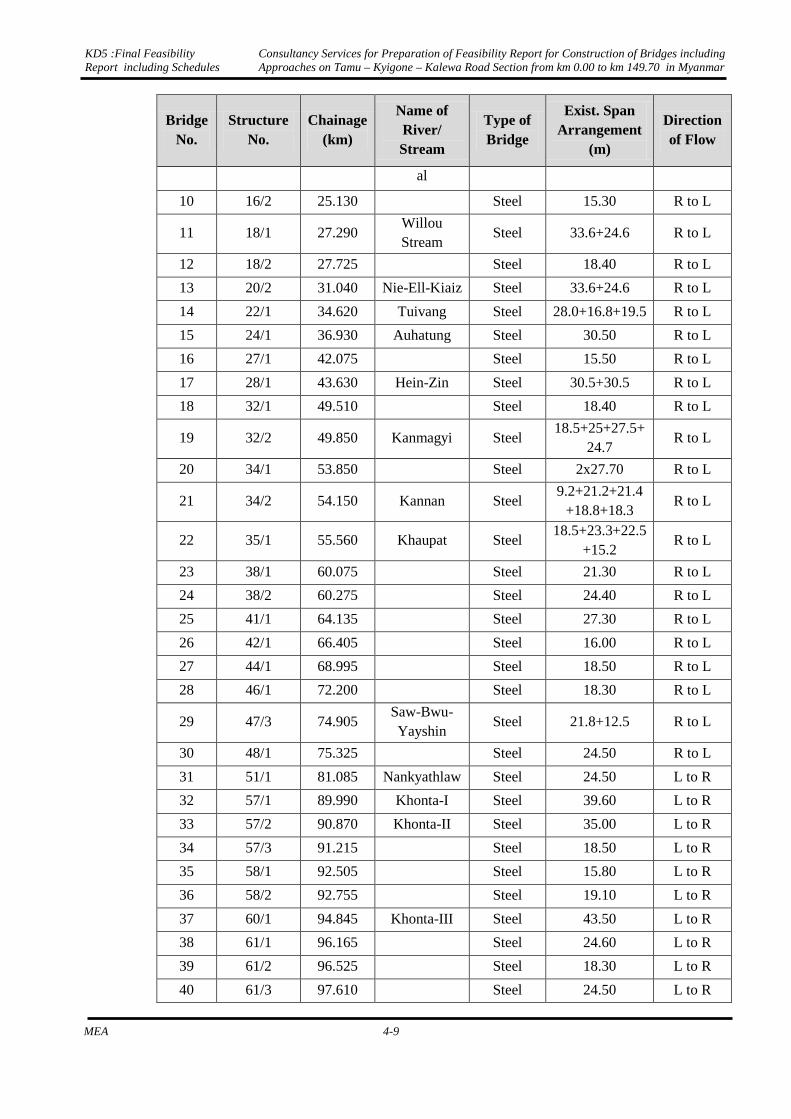
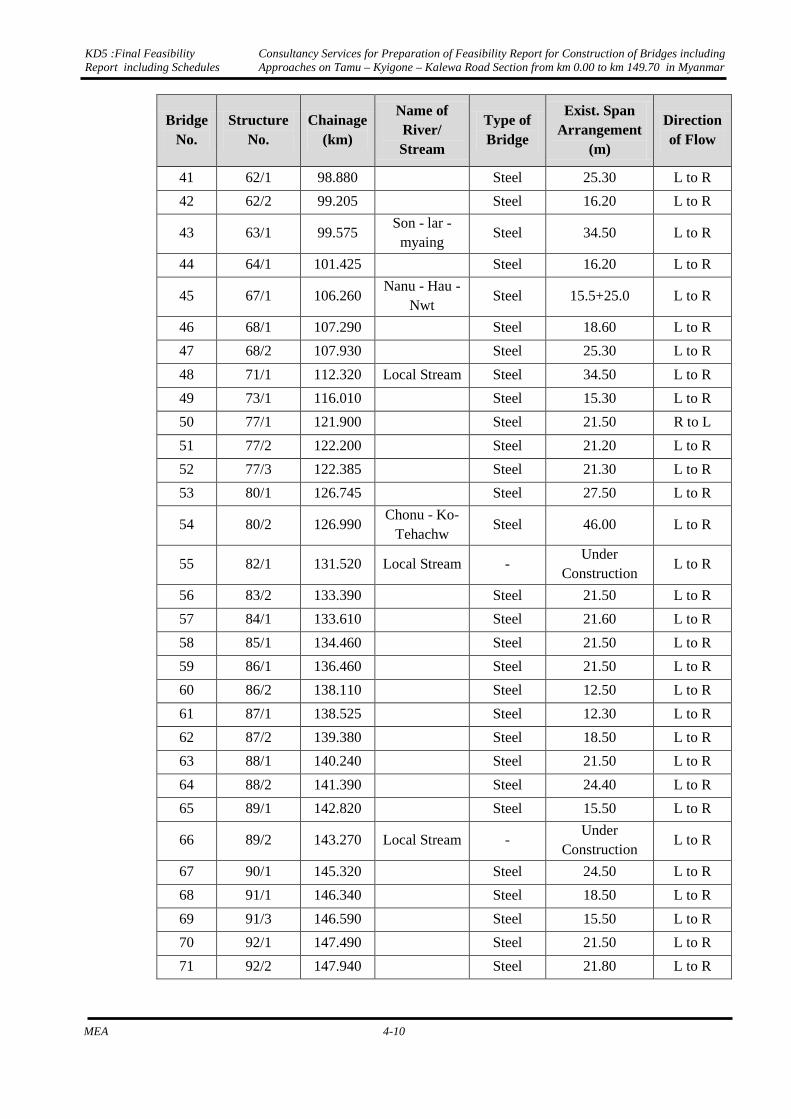
Details of Existing Bridges
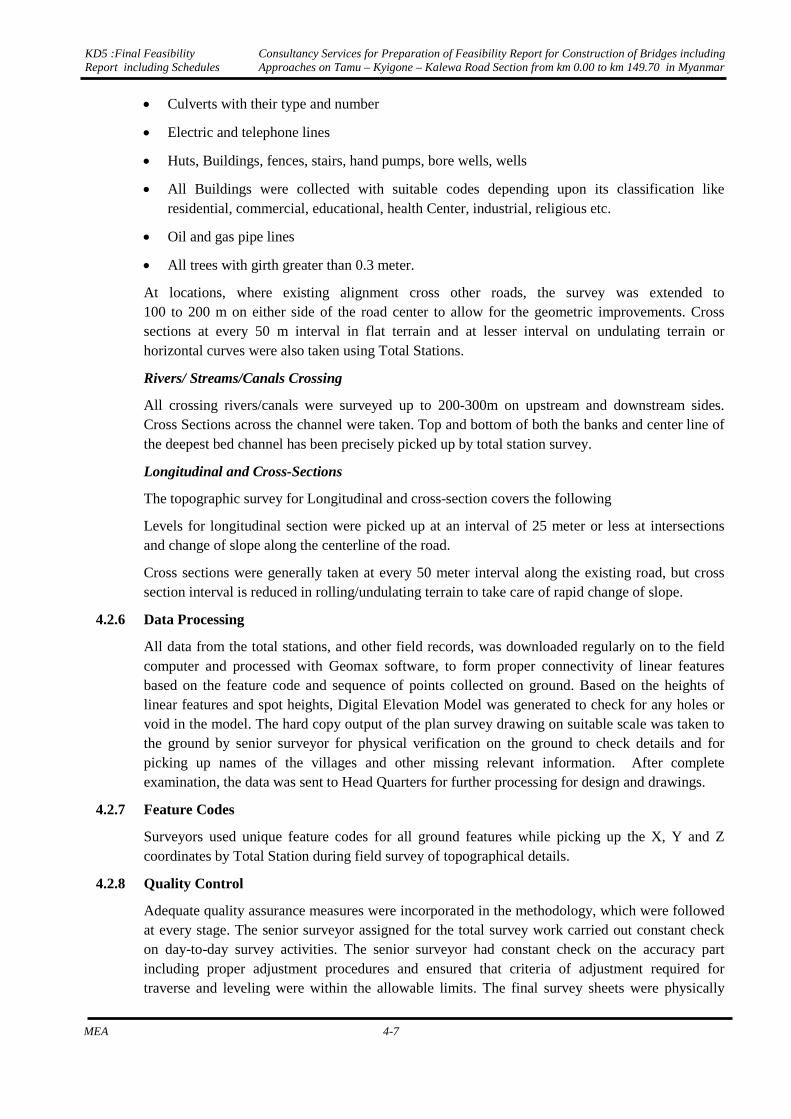
Salient features of existing bridges such as name, location, span arrangement and other details are given in the Table 4.2.
Table 4.2: Details of Existing Bridges
BridgeNo.
Structure No.
Chainage (km)
Name of River/ Stream
Type of Bridge
Exist. Span Arrangement
(m)
Direction of Flow
1 1/1 0.030 Lokchao Steel 43.00 R to L
2 4/1 4.880 Luei Steel 36.60 R to L
3 7/1 10.880 Nanpalong Steel 27.50 R to L
4 8/1 12.000
Steel 18.30 R to L
5 9/1 13.740 Pantha Steel 2x15.4 R to L
6 10/2 15.760
Steel 12.20 R to L
7 12/1 18.240 Lallim Steel 17.8+27.8+27.5 R to L
8 13/2 19.575
Steel 19.40 R to L
9 15/1 22.470 ZaangLienph Steel 27.50 R to L
KD5 :Final Feasibility Report including Schedules
Consultancy Services for Preparation of Feasibility Report for Construction of Bridges including Approaches on Tamu – Kyigone – Kalewa Road Section from km 0.00 to km 149.70 in Myanmar
MEA 4-9
BridgeNo.
Structure No.
Chainage (km)
Name of River/ Stream
Type of Bridge
Exist. Span Arrangement
(m)
Direction of Flow
al
10 16/2 25.130
Steel 15.30 R to L
11 18/1 27.290 Willou Stream
Steel 33.6+24.6 R to L
12 18/2 27.725
Steel 18.40 R to L
13 20/2 31.040 Nie-Ell-Kiaiz Steel 33.6+24.6 R to L
14 22/1 34.620 Tuivang Steel 28.0+16.8+19.5 R to L
15 24/1 36.930 Auhatung Steel 30.50 R to L
16 27/1 42.075
Steel 15.50 R to L
17 28/1 43.630 Hein-Zin Steel 30.5+30.5 R to L
18 32/1 49.510
Steel 18.40 R to L
19 32/2 49.850 Kanmagyi Steel 18.5+25+27.5+
24.7 R to L
20 34/1 53.850
Steel 2x27.70 R to L
21 34/2 54.150 Kannan Steel 9.2+21.2+21.4
+18.8+18.3 R to L
22 35/1 55.560 Khaupat Steel 18.5+23.3+22.5
+15.2 R to L
23 38/1 60.075
Steel 21.30 R to L
24 38/2 60.275
Steel 24.40 R to L
25 41/1 64.135
Steel 27.30 R to L
26 42/1 66.405
Steel 16.00 R to L
27 44/1 68.995
Steel 18.50 R to L
28 46/1 72.200
Steel 18.30 R to L
29 47/3 74.905 Saw-Bwu-Yayshin
Steel 21.8+12.5 R to L
30 48/1 75.325
Steel 24.50 R to L
31 51/1 81.085 Nankyathlaw Steel 24.50 L to R
32 57/1 89.990 Khonta-I Steel 39.60 L to R
33 57/2 90.870 Khonta-II Steel 35.00 L to R
34 57/3 91.215
Steel 18.50 L to R
35 58/1 92.505
Steel 15.80 L to R
36 58/2 92.755
Steel 19.10 L to R
37 60/1 94.845 Khonta-III Steel 43.50 L to R
38 61/1 96.165
Steel 24.60 L to R
39 61/2 96.525
Steel 18.30 L to R
40 61/3 97.610
Steel 24.50 L to R
KD5 :Final Feasibility Report including Schedules
Consultancy Services for Preparation of Feasibility Report for Construction of Bridges including Approaches on Tamu – Kyigone – Kalewa Road Section from km 0.00 to km 149.70 in Myanmar
MEA 4-10
BridgeNo.
Structure No.
Chainage (km)
Name of River/ Stream
Type of Bridge
Exist. Span Arrangement
(m)
Direction of Flow
41 62/1 98.880
Steel 25.30 L to R
42 62/2 99.205
Steel 16.20 L to R
43 63/1 99.575 Son - lar -
myaing Steel 34.50 L to R
44 64/1 101.425
Steel 16.20 L to R
45 67/1 106.260 Nanu - Hau -
Nwt Steel 15.5+25.0 L to R
46 68/1 107.290
Steel 18.60 L to R
47 68/2 107.930
Steel 25.30 L to R
48 71/1 112.320 Local Stream Steel 34.50 L to R
49 73/1 116.010
Steel 15.30 L to R
50 77/1 121.900
Steel 21.50 R to L
51 77/2 122.200
Steel 21.20 L to R
52 77/3 122.385
Steel 21.30 L to R
53 80/1 126.745
Steel 27.50 L to R
54 80/2 126.990 Chonu - Ko-
Tehachw Steel 46.00 L to R
55 82/1 131.520 Local Stream - Under
Construction L to R
56 83/2 133.390
Steel 21.50 L to R
57 84/1 133.610
Steel 21.60 L to R
58 85/1 134.460
Steel 21.50 L to R
59 86/1 136.460
Steel 21.50 L to R
60 86/2 138.110
Steel 12.50 L to R
61 87/1 138.525
Steel 12.30 L to R
62 87/2 139.380
Steel 18.50 L to R
63 88/1 140.240
Steel 21.50 L to R
64 88/2 141.390
Steel 24.40 L to R
65 89/1 142.820
Steel 15.50 L to R
66 89/2 143.270 Local Stream - Under
Construction L to R
67 90/1 145.320
Steel 24.50 L to R
68 91/1 146.340
Steel 18.50 L to R
69 91/3 146.590
Steel 15.50 L to R
70 92/1 147.490
Steel 21.50 L to R
71 92/2 147.940
Steel 21.80 L to R
KD5 :Final Feasibility Report including Schedules
Consultancy Services for Preparation of Feasibility Report for Construction of Bridges including Approaches on Tamu – Kyigone – Kalewa Road Section from km 0.00 to km 149.70 in Myanmar
MEA 4-11
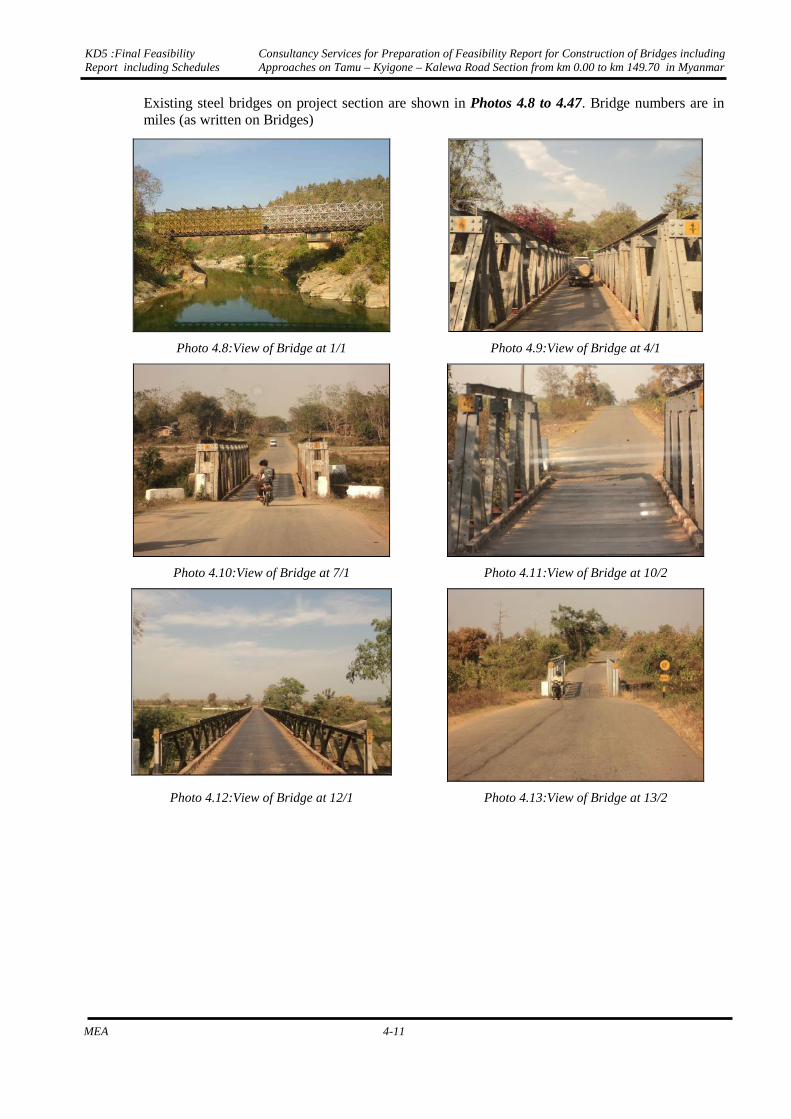
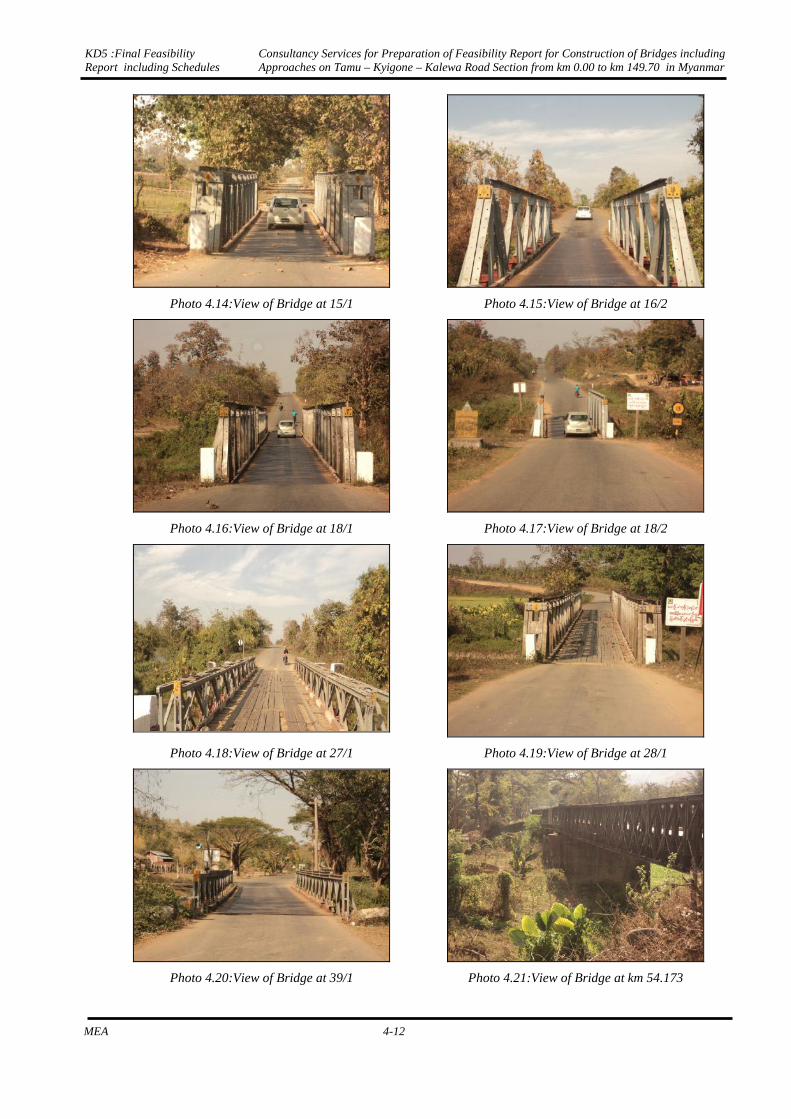
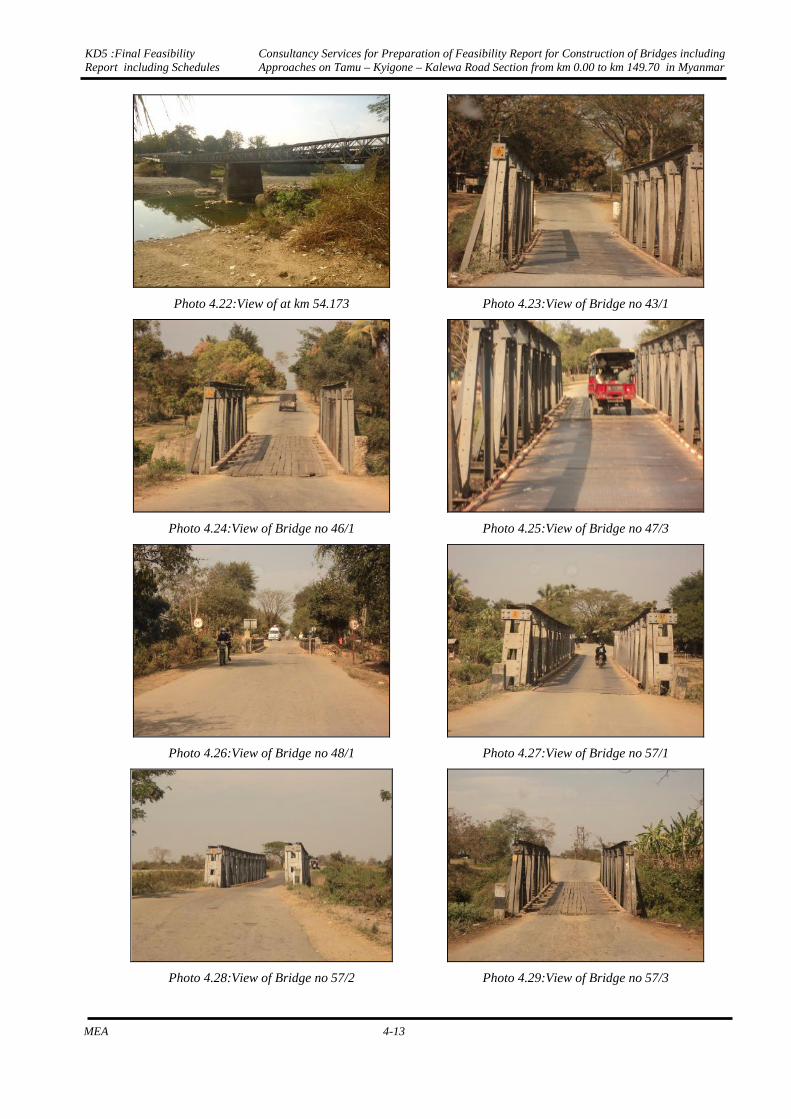
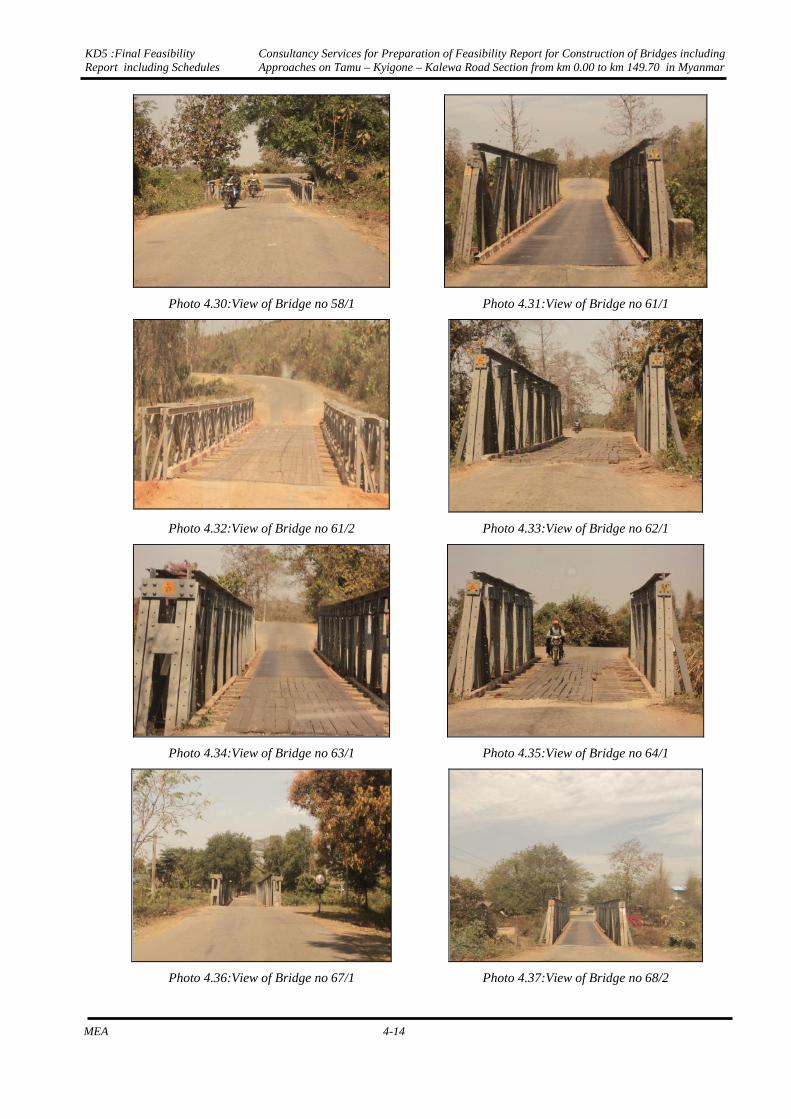
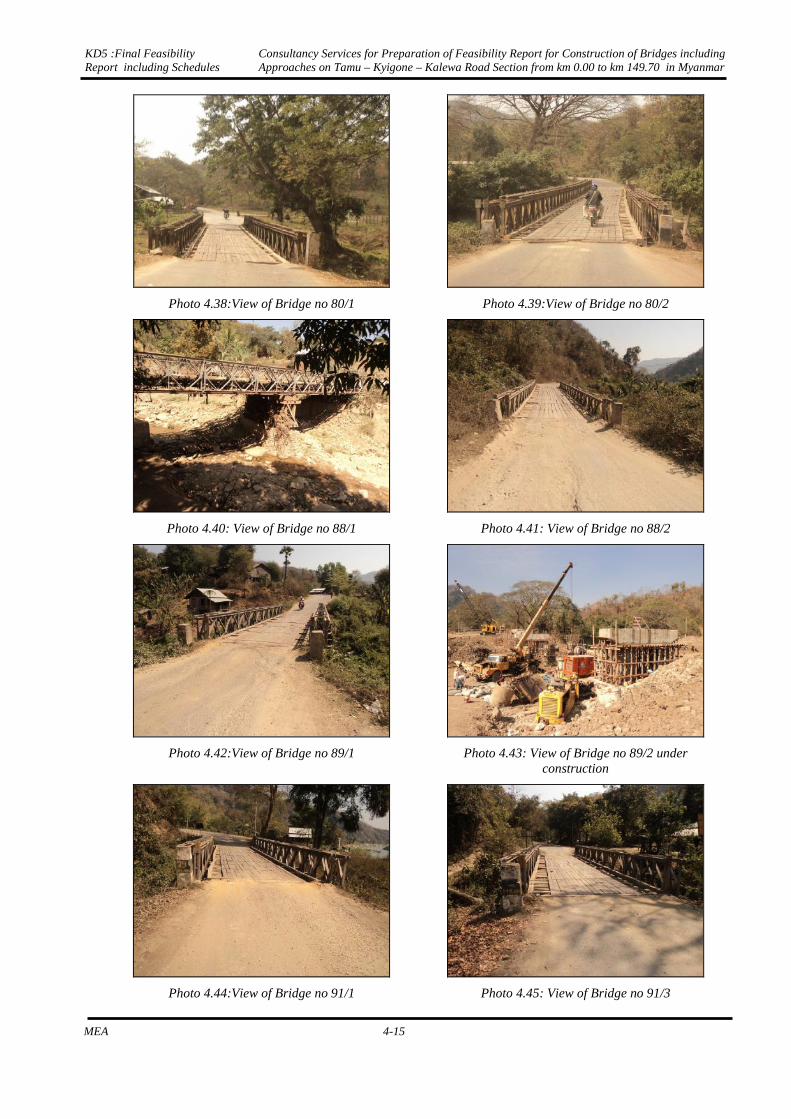
Existing steel bridges on project section are shown in Photos 4.8 to 4.47. Bridge numbers are in miles (as written on Bridges)
Photo 4.8:View of Bridge at 1/1 Photo 4.9:View of Bridge at 4/1
Photo 4.10:View of Bridge at 7/1 Photo 4.11:View of Bridge at 10/2
Photo 4.12:View of Bridge at 12/1 Photo 4.13:View of Bridge at 13/2
KD5 :Final Feasibility Report including Schedules
Consultancy Services for Preparation of Feasibility Report for Construction of Bridges including Approaches on Tamu – Kyigone – Kalewa Road Section from km 0.00 to km 149.70 in Myanmar
MEA 4-12
Photo 4.14:View of Bridge at 15/1 Photo 4.15:View of Bridge at 16/2
Photo 4.16:View of Bridge at 18/1 Photo 4.17:View of Bridge at 18/2
Photo 4.18:View of Bridge at 27/1 Photo 4.19:View of Bridge at 28/1
Photo 4.20:View of Bridge at 39/1 Photo 4.21:View of Bridge at km 54.173
KD5 :Final Feasibility Report including Schedules
Consultancy Services for Preparation of Feasibility Report for Construction of Bridges including Approaches on Tamu – Kyigone – Kalewa Road Section from km 0.00 to km 149.70 in Myanmar
MEA 4-13
Photo 4.22:View of at km 54.173 Photo 4.23:View of Bridge no 43/1
Photo 4.24:View of Bridge no 46/1 Photo 4.25:View of Bridge no 47/3
Photo 4.26:View of Bridge no 48/1 Photo 4.27:View of Bridge no 57/1
Photo 4.28:View of Bridge no 57/2 Photo 4.29:View of Bridge no 57/3
KD5 :Final Feasibility Report including Schedules
Consultancy Services for Preparation of Feasibility Report for Construction of Bridges including Approaches on Tamu – Kyigone – Kalewa Road Section from km 0.00 to km 149.70 in Myanmar
MEA 4-14
Photo 4.30:View of Bridge no 58/1 Photo 4.31:View of Bridge no 61/1
Photo 4.32:View of Bridge no 61/2 Photo 4.33:View of Bridge no 62/1
Photo 4.34:View of Bridge no 63/1 Photo 4.35:View of Bridge no 64/1
Photo 4.36:View of Bridge no 67/1 Photo 4.37:View of Bridge no 68/2
KD5 :Final Feasibility Report including Schedules
Consultancy Services for Preparation of Feasibility Report for Construction of Bridges including Approaches on Tamu – Kyigone – Kalewa Road Section from km 0.00 to km 149.70 in Myanmar
MEA 4-15
Photo 4.38:View of Bridge no 80/1 Photo 4.39:View of Bridge no 80/2
Photo 4.40: View of Bridge no 88/1 Photo 4.41: View of Bridge no 88/2
Photo 4.42:View of Bridge no 89/1 Photo 4.43: View of Bridge no 89/2 under construction
Photo 4.44:View of Bridge no 91/1 Photo 4.45: View of Bridge no 91/3
KD5 :Final Feasibility Report including Schedules
Consultancy Services for Preparation of Feasibility Report for Construction of Bridges including Approaches on Tamu – Kyigone – Kalewa Road Section from km 0.00 to km 149.70 in Myanmar
MEA 4-16
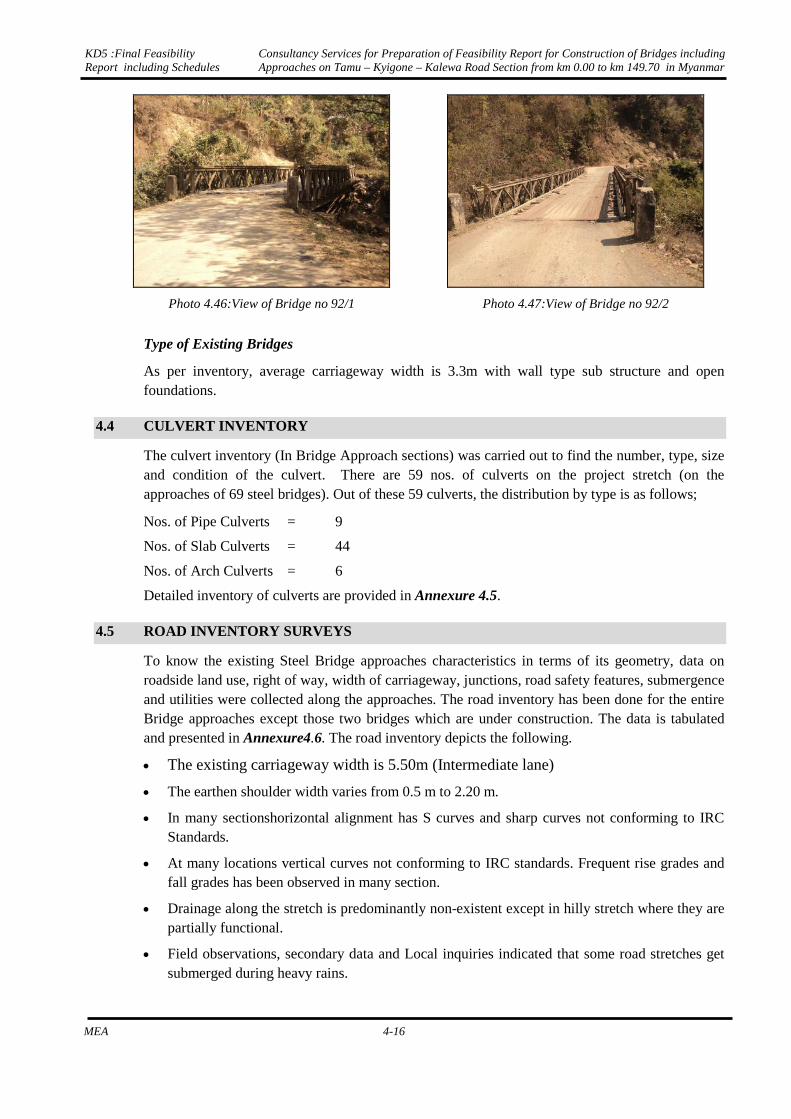
Photo 4.46:View of Bridge no 92/1 Photo 4.47:View of Bridge no 92/2
Type of Existing Bridges
As per inventory, average carriageway width is 3.3m with wall type sub structure and open foundations.
4.4 CULVERT INVENTORY
The culvert inventory (In Bridge Approach sections) was carried out to find the number, type, size and condition of the culvert. There are 59 nos. of culverts on the project stretch (on the approaches of 69 steel bridges). Out of these 59 culverts, the distribution by type is as follows;
Nos. of Pipe Culverts = 9
Nos. of Slab Culverts = 44
Nos. of Arch Culverts = 6
Detailed inventory of culverts are provided in Annexure 4.5.
4.5 ROAD INVENTORY SURVEYS
To know the existing Steel Bridge approaches characteristics in terms of its geometry, data on roadside land use, right of way, width of carriageway, junctions, road safety features, submergence and utilities were collected along the approaches. The road inventory has been done for the entire Bridge approaches except those two bridges which are under construction. The data is tabulated and presented in Annexure4.6. The road inventory depicts the following.
• The existing carriageway width is 5.50m (Intermediate lane)
• The earthen shoulder width varies from 0.5 m to 2.20 m.
• In many sectionshorizontal alignment has S curves and sharp curves not conforming to IRC Standards.
• At many locations vertical curves not conforming to IRC standards. Frequent rise grades and fall grades has been observed in many section.
• Drainage along the stretch is predominantly non-existent except in hilly stretch where they are partially functional.
• Field observations, secondary data and Local inquiries indicated that some road stretches get submerged during heavy rains.
KD5 :Final Feasibility Report including Schedules
Consultancy Services for Preparation of Feasibility Report for Construction of Bridges including Approaches on Tamu – Kyigone – Kalewa Road Section from km 0.00 to km 149.70 in Myanmar
MEA 4-17
• There is no clear demarcation at site of the existing right of way more over there are encroachment at many places.
• The existing ROW varies from 30m to 70m all along the project highway.
4.6 HYDROLOGY AND DRAINAGE
4.6.1 Introduction
The Average annual rainfall along the project road varies from 1600 mm to 2600 mm in last four years. The major rivers/ channels crossing project road are – Lokchao, Luei, Nanpalong, Pantha, Willou, Kanmagyi, Lallim, Tuivang, Hein-Zin, Kannan, Khaupar, Saw-Bwu-Yavshin, Khonta, and Chonu-Ko-Tehachw.
4.6.2 Reconnaissance Survey
A reconnaissance survey of the site was carried out in order to investigate hydrology and hydraulics of cross drainage (bridges and culverts) and roadside drainage. These investigations are primarily intended to examine the cross-drainage structures corresponding to the design discharge, highest flood level (HFL) and methodology for evaluating/computing design discharge, waterway, clear span, scour depth, velocity, afflux, and roadside drainage for this road project.
The various data/information collected during the site visit are:
• General idea about the topography of the project road and river/ stream catchments.
• Information regarding the performance of the existing bridges during recent critical flood years.
• Information regarding HFL/ FSL, LWL of rivers/ streams from local enquiry or visible water mark on the bridges, piers, abutments, etc.
• Discharge and HFL data, to the extent feasible, from local offices of Central Water Commission and from concerned Irrigation Departments.
4.6.3 Hydraulic Performance of Existing Bridges
As per local enquiry and visual inspection submergence was observed at 8 number of bridges. Detailed hydraulic calculations of all bridges has already been submitted in stage “KD3: Report on soil characteristics, sub-soil and hydraulic investigation, GAD for bridge and other structures”
4.7 TRAFFIC SURVEY AND ANALYSIS
4.7.1 Traffic Surveys
The traffic studies have been carried out to study the behavioral pattern of the traffic along the project road and determine the travel pattern on the project road.
Objective
The traffic surveys have been carried out along the corridor to establish base year traffic as well as travel characteristics. The baseline traffic characteristics are very important for the assessment of future traffic and travel pattern. The primary objectives of the traffic surveys are to:
• Determine the motorized and non-motorised traffic volumes along the corridor. • Determine axle loads distribution and vehicle damage factor required for pavement design. • Determine requirement of number of lanes in the future years.
KD5 :Final Feasibility Report including Schedules
Consultancy Services for Preparation of Feasibility Report for Construction of Bridges including Approaches on Tamu – Kyigone – Kalewa Road Section from km 0.00 to km 149.70 in Myanmar
MEA 4-18
• Determine the crust thickness based on the MSA calculation. Methodology
The traffic surveys have been carried out in accordance with the guidelines specified by IRC: 9-1972 and IRC: 102-1988. The methodology adopted for the traffic study is detailed below.
• The project road corridor is divided into traffic homogeneous sections based on change in traffic flow pattern.
• The traffic surveys including classified traffic volume count and axle load survey was carried out for each traffic homogeneous section.
Homogenous Sections
Based on the traffic flow characteristics, project road has been divided into two homogenous sections and the classified volume count surveys carried out accordingly. The details of homogenous sections are presented in Table 4.3.
Table 4.3: Homogeneous Sections of Project road
Homogeneous Section From km to km Description
HS 1 Km 0.000 to km 121.690 Road leads to Chin state
HS 2 Km 121.690 to km 149.700 Road leads to Mandalay
In order to understand the characteristics and the volume of traffic using the project road, data on project road and traffic and travel pattern of vehicles plying on the project road were collected through primary surveys.
The following traffic surveys were conducted in this study:
• Directional Classified Traffic Volume Count survey to derive the Average Daily Traffic (ADT) and Annual Average Daily Traffic (AADT).
• 24 hour axle load survey to assess the loading characteristics of goods vehicle plying on the project road.
Classified Traffic Volume Count Locations
The locations selected for classified volume counts were as given below: Two locations has been considered for classified volume counts. The locations are • Panthai.e Km 12.50 • Kyigonei.e Km 122.50
The above locations were (i) on a straight stretch for clear visibility and identification of vehicles, (ii) outside urban/built-up area to avoid local traffic, and (iii) where facilities, like, lighting, tables, chairs, etc, required for surveys were available.
Axle Load Survey Location
Axle Load survey has been conducted at two locations along the road stretch which are as follows: • Panthai.e Km 12.50 • Kyigonei.e Km 122.50
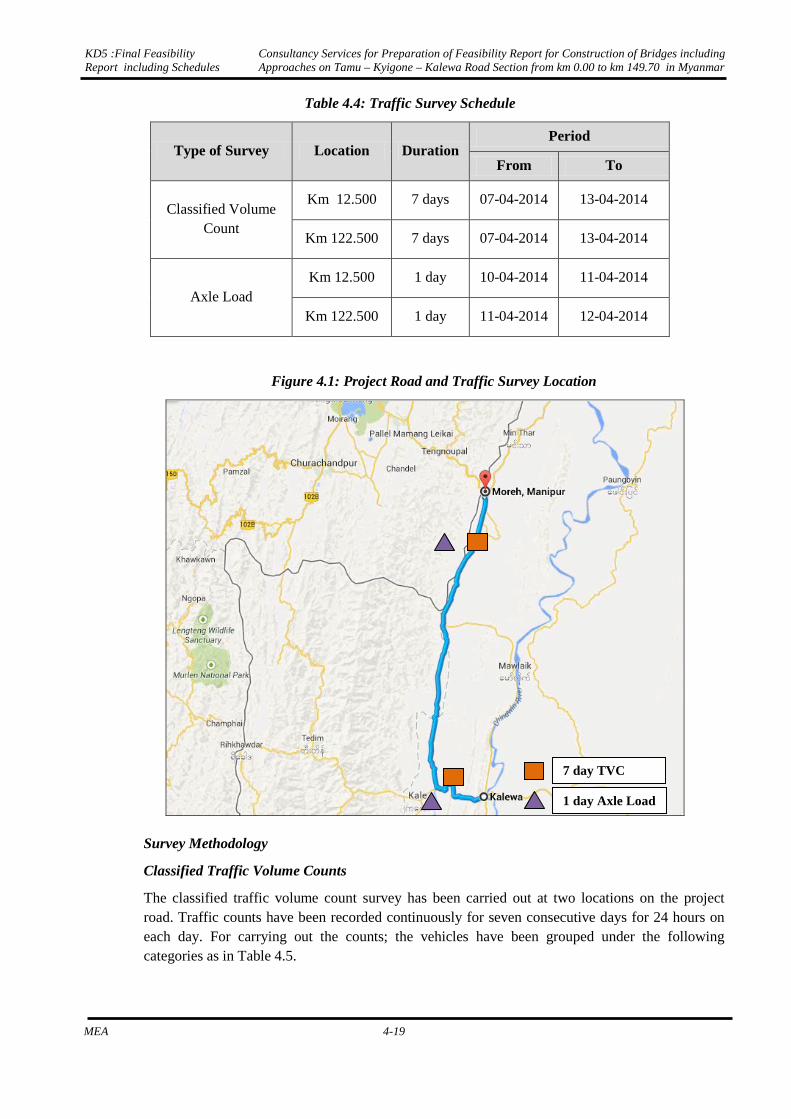
Traffic Survey details and schedules are provided in Table 4.4and graphically represented in Figure 4.1.
KD5 :Final Feasibility Report including Schedules
Consultancy Services for Preparation of Feasibility Report for Construction of Bridges including Approaches on Tamu – Kyigone – Kalewa Road Section from km 0.00 to km 149.70 in Myanmar
MEA 4-19
Table 4.4: Traffic Survey Schedule
Type of Survey Location Duration Period
From To
Classified Volume Count
Km 12.500 7 days 07-04-2014 13-04-2014
Km 122.500 7 days 07-04-2014 13-04-2014
Axle Load Km 12.500 1 day 10-04-2014 11-04-2014
Km 122.500 1 day 11-04-2014 12-04-2014
Figure 4.1: Project Road and Traffic Survey Location
Survey Methodology
Classified Traffic Volume Counts
The classified traffic volume count survey has been carried out at two locations on the project road. Traffic counts have been recorded continuously for seven consecutive days for 24 hours on each day. For carrying out the counts; the vehicles have been grouped under the following categories as in Table 4.5.
7 day TVC
1 day Axle Load
KD5 :Final Feasibility Report including Schedules
Consultancy Services for Preparation of Feasibility Report for Construction of Bridges including Approaches on Tamu – Kyigone – Kalewa Road Section from km 0.00 to km 149.70 in Myanmar
MEA 4-20
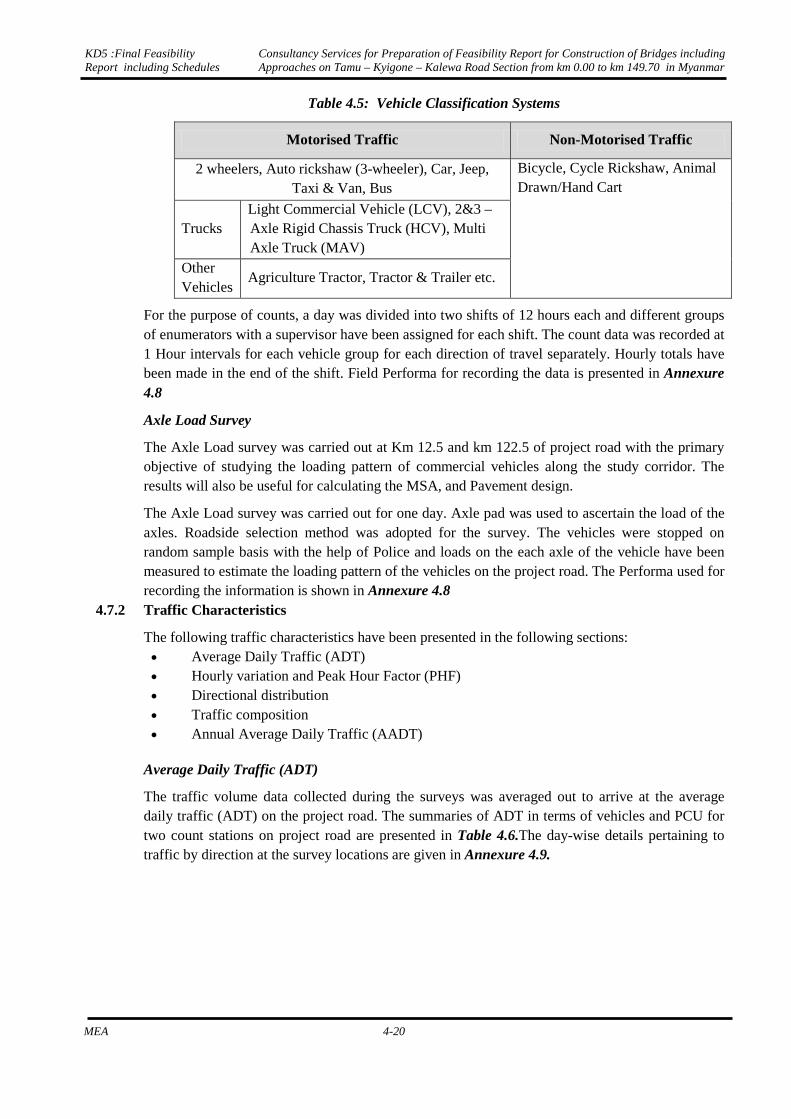
Table 4.5: Vehicle Classification Systems
Motorised Traffic Non-Motorised Traffic
2 wheelers, Auto rickshaw (3-wheeler), Car, Jeep, Taxi & Van, Bus
Bicycle, Cycle Rickshaw, Animal Drawn/Hand Cart
Trucks Light Commercial Vehicle (LCV), 2&3 – Axle Rigid Chassis Truck (HCV), Multi Axle Truck (MAV)
Other Vehicles
Agriculture Tractor, Tractor & Trailer etc.
For the purpose of counts, a day was divided into two shifts of 12 hours each and different groups of enumerators with a supervisor have been assigned for each shift. The count data was recorded at 1 Hour intervals for each vehicle group for each direction of travel separately. Hourly totals have been made in the end of the shift. Field Performa for recording the data is presented in Annexure 4.8
Axle Load Survey
The Axle Load survey was carried out at Km 12.5 and km 122.5 of project road with the primary objective of studying the loading pattern of commercial vehicles along the study corridor. The results will also be useful for calculating the MSA, and Pavement design.
The Axle Load survey was carried out for one day. Axle pad was used to ascertain the load of the axles. Roadside selection method was adopted for the survey. The vehicles were stopped on random sample basis with the help of Police and loads on the each axle of the vehicle have been measured to estimate the loading pattern of the vehicles on the project road. The Performa used for recording the information is shown in Annexure 4.8
4.7.2 Traffic Characteristics
The following traffic characteristics have been presented in the following sections: • Average Daily Traffic (ADT) • Hourly variation and Peak Hour Factor (PHF) • Directional distribution • Traffic composition • Annual Average Daily Traffic (AADT)
Average Daily Traffic (ADT)
The traffic volume data collected during the surveys was averaged out to arrive at the average daily traffic (ADT) on the project road. The summaries of ADT in terms of vehicles and PCU for two count stations on project road are presented in Table 4.6.The day-wise details pertaining to traffic by direction at the survey locations are given in Annexure 4.9.
KD5 :Final Feasibility Report including Schedules
Consultancy Services for Preparation of Feasibility Report for Construction of Bridges including Approaches on Tamu – Kyigone – Kalewa Road Section from km 0.00 to km 149.70 in Myanmar
MEA 4-21
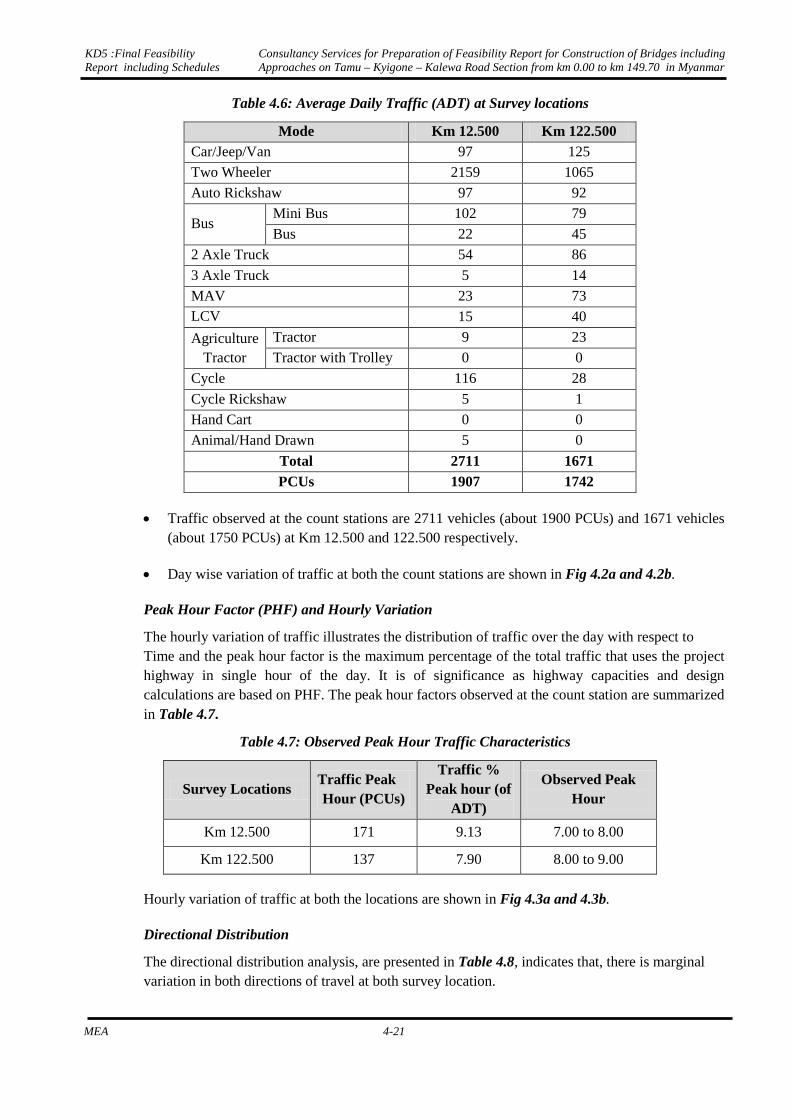
Table 4.6: Average Daily Traffic (ADT) at Survey locations
Mode Km 12.500 Km 122.500 Car/Jeep/Van 97 125
Two Wheeler 2159 1065
Auto Rickshaw 97 92
Bus Mini Bus 102 79
Bus 22 45
2 Axle Truck 54 86
3 Axle Truck 5 14
MAV 23 73 LCV 15 40
Agriculture Tractor
Tractor 9 23
Tractor with Trolley 0 0
Cycle 116 28
Cycle Rickshaw 5 1
Hand Cart 0 0
Animal/Hand Drawn 5 0
Total 2711 1671 PCUs 1907 1742
• Traffic observed at the count stations are 2711 vehicles (about 1900 PCUs) and 1671 vehicles (about 1750 PCUs) at Km 12.500 and 122.500 respectively.
• Day wise variation of traffic at both the count stations are shown in Fig 4.2a and 4.2b.
Peak Hour Factor (PHF) and Hourly Variation
The hourly variation of traffic illustrates the distribution of traffic over the day with respect to Time and the peak hour factor is the maximum percentage of the total traffic that uses the project highway in single hour of the day. It is of significance as highway capacities and design calculations are based on PHF. The peak hour factors observed at the count station are summarized in Table 4.7.
Table 4.7: Observed Peak Hour Traffic Characteristics
Survey Locations Traffic Peak Hour (PCUs)
Traffic % Peak hour (of
ADT)
Observed Peak Hour
Km 12.500 171 9.13 7.00 to 8.00
Km 122.500 137 7.90 8.00 to 9.00
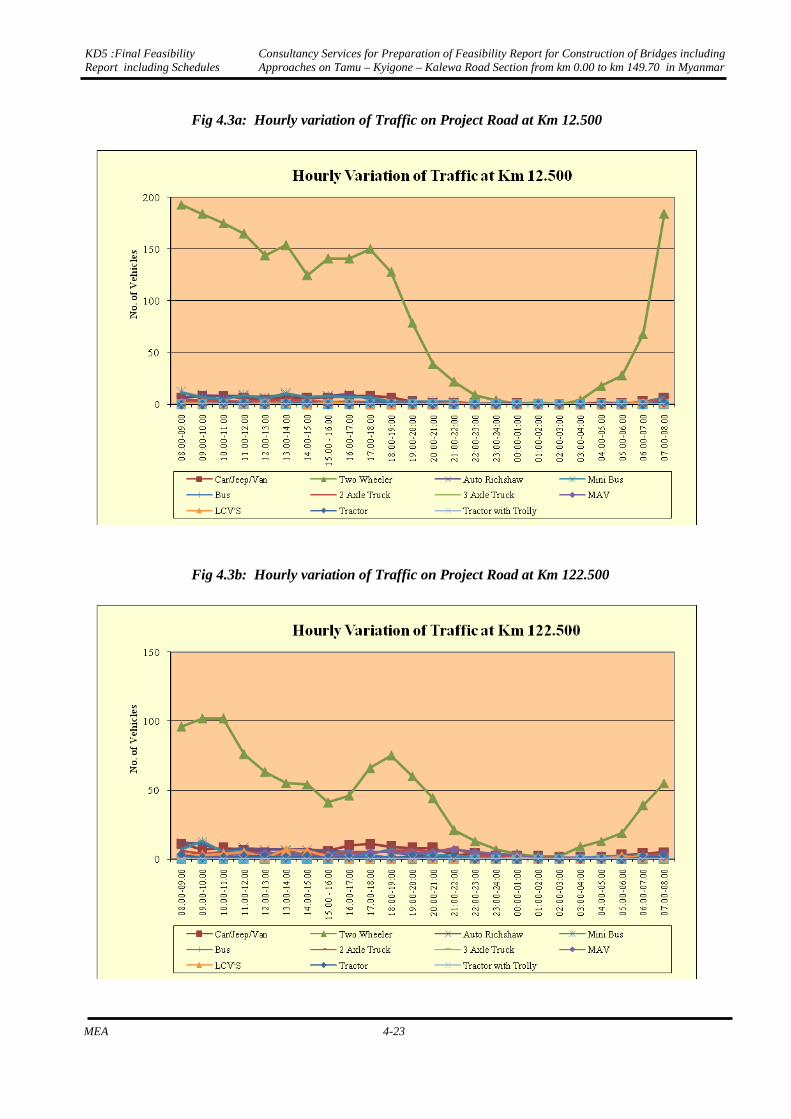
Hourly variation of traffic at both the locations are shown in Fig 4.3a and 4.3b.
Directional Distribution
The directional distribution analysis, are presented in Table 4.8, indicates that, there is marginal variation in both directions of travel at both survey location.
KD5 :Final Feasibility Report including Schedules
Consultancy Services for Preparation of Feasibility Report for Construction of Bridges including Approaches on Tamu – Kyigone – Kalewa Road Section from km 0.00 to km 149.70 in Myanmar
MEA 4-22
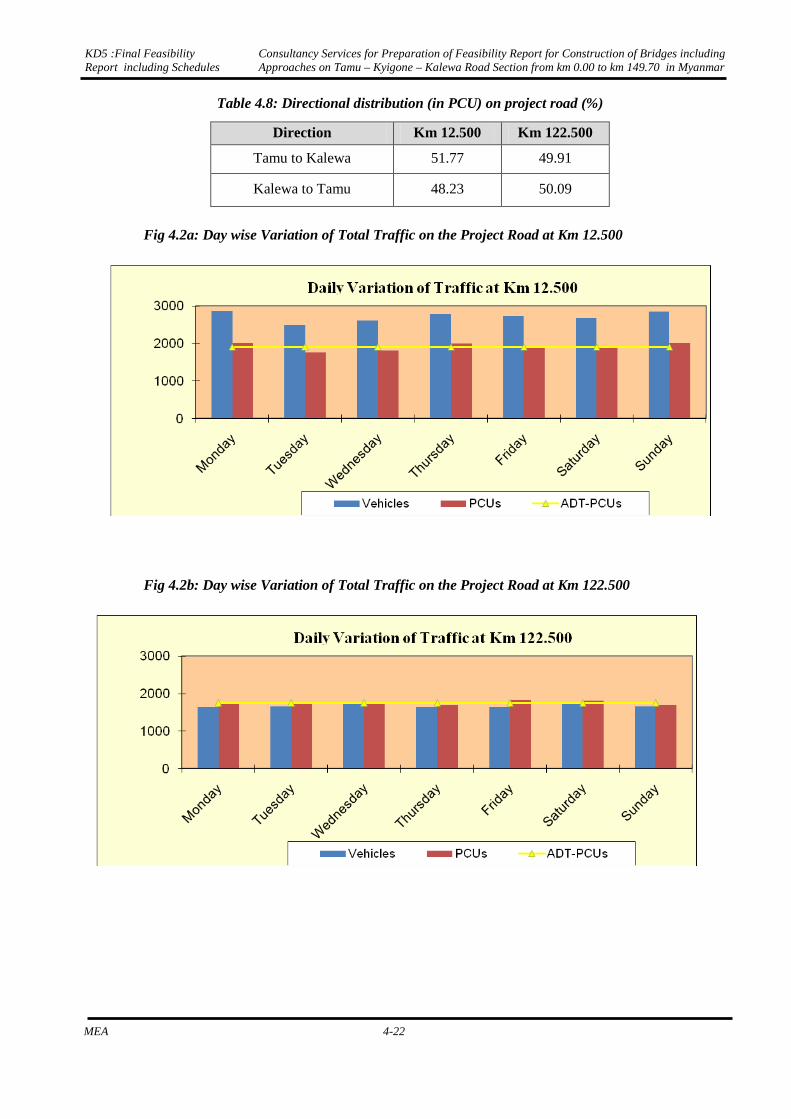
Table 4.8: Directional distribution (in PCU) on project road (%)
Direction Km 12.500 Km 122.500
Tamu to Kalewa 51.77 49.91
Kalewa to Tamu 48.23 50.09
Fig 4.2a: Day wise Variation of Total Traffic on the Project Road at Km 12.500
Fig 4.2b: Day wise Variation of Total Traffic on the Project Road at Km 122.500
KD5 :Final Feasibility Report including Schedules
Consultancy Services for Preparation of Feasibility Report for Construction of Bridges including Approaches on Tamu – Kyigone – Kalewa Road Section from km 0.00 to km 149.70 in Myanmar
MEA 4-23
Fig 4.3a: Hourly variation of Traffic on Project Road at Km 12.500
Fig 4.3b: Hourly variation of Traffic on Project Road at Km 122.500
KD5 :Final Feasibility Report including Schedules
Consultancy Services for Preparation of Feasibility Report for Construction of Bridges including Approaches on Tamu – Kyigone – Kalewa Road Section from km 0.00 to km 149.70 in Myanmar
MEA 4-24
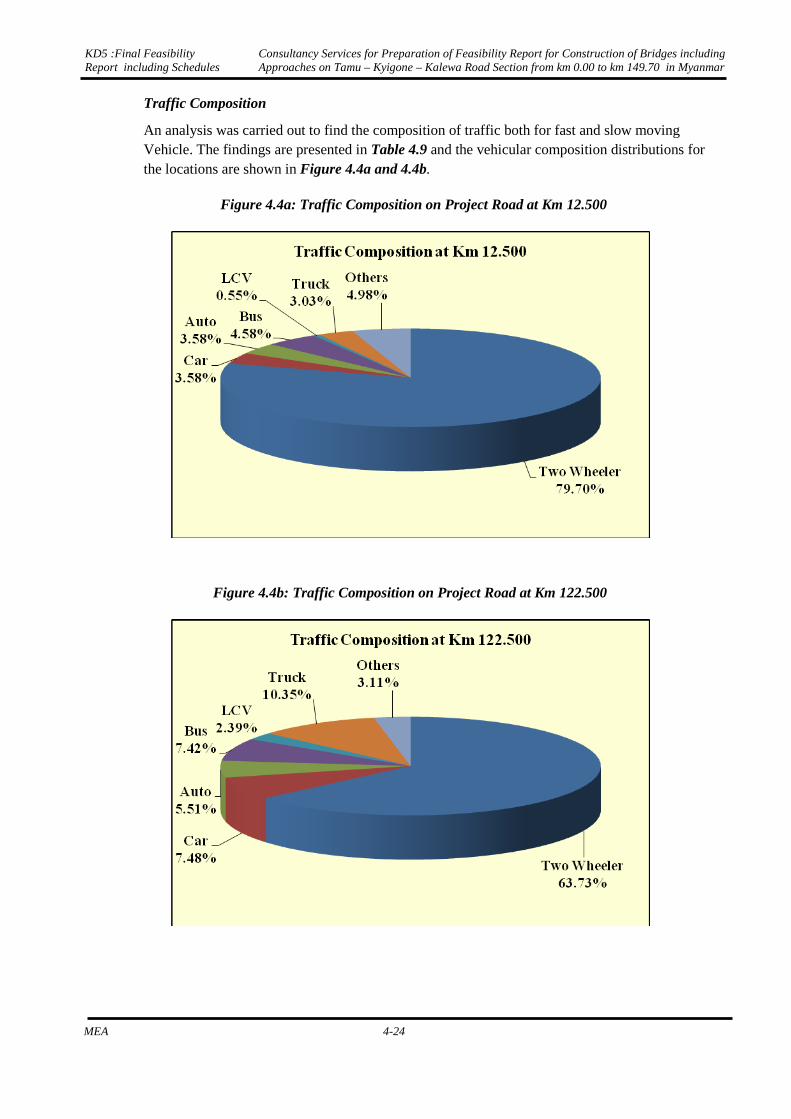
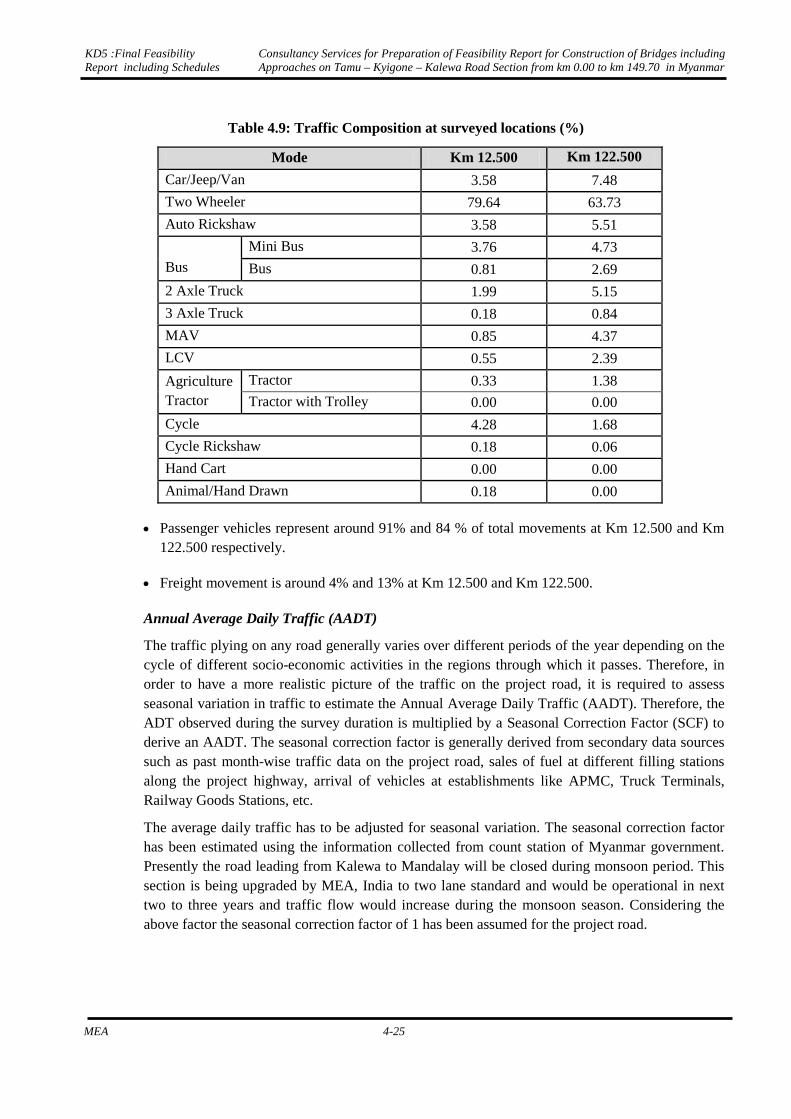
Traffic Composition
An analysis was carried out to find the composition of traffic both for fast and slow moving Vehicle. The findings are presented in Table 4.9 and the vehicular composition distributions for the locations are shown in Figure 4.4a and 4.4b.
Figure 4.4a: Traffic Composition on Project Road at Km 12.500
Figure 4.4b: Traffic Composition on Project Road at Km 122.500
KD5 :Final Feasibility Report including Schedules
Consultancy Services for Preparation of Feasibility Report for Construction of Bridges including Approaches on Tamu – Kyigone – Kalewa Road Section from km 0.00 to km 149.70 in Myanmar
MEA 4-25
Table 4.9: Traffic Composition at surveyed locations (%)
Mode Km 12.500 Km 122.500
Car/Jeep/Van 3.58 7.48
Two Wheeler 79.64 63.73
Auto Rickshaw 3.58 5.51
Bus
Mini Bus 3.76 4.73
Bus 0.81 2.69
2 Axle Truck 1.99 5.15
3 Axle Truck 0.18 0.84
MAV 0.85 4.37
LCV 0.55 2.39
Agriculture Tractor
Tractor 0.33 1.38
Tractor with Trolley 0.00 0.00
Cycle 4.28 1.68
Cycle Rickshaw 0.18 0.06
Hand Cart 0.00 0.00
Animal/Hand Drawn 0.18 0.00
• Passenger vehicles represent around 91% and 84 % of total movements at Km 12.500 and Km 122.500 respectively.
• Freight movement is around 4% and 13% at Km 12.500 and Km 122.500.
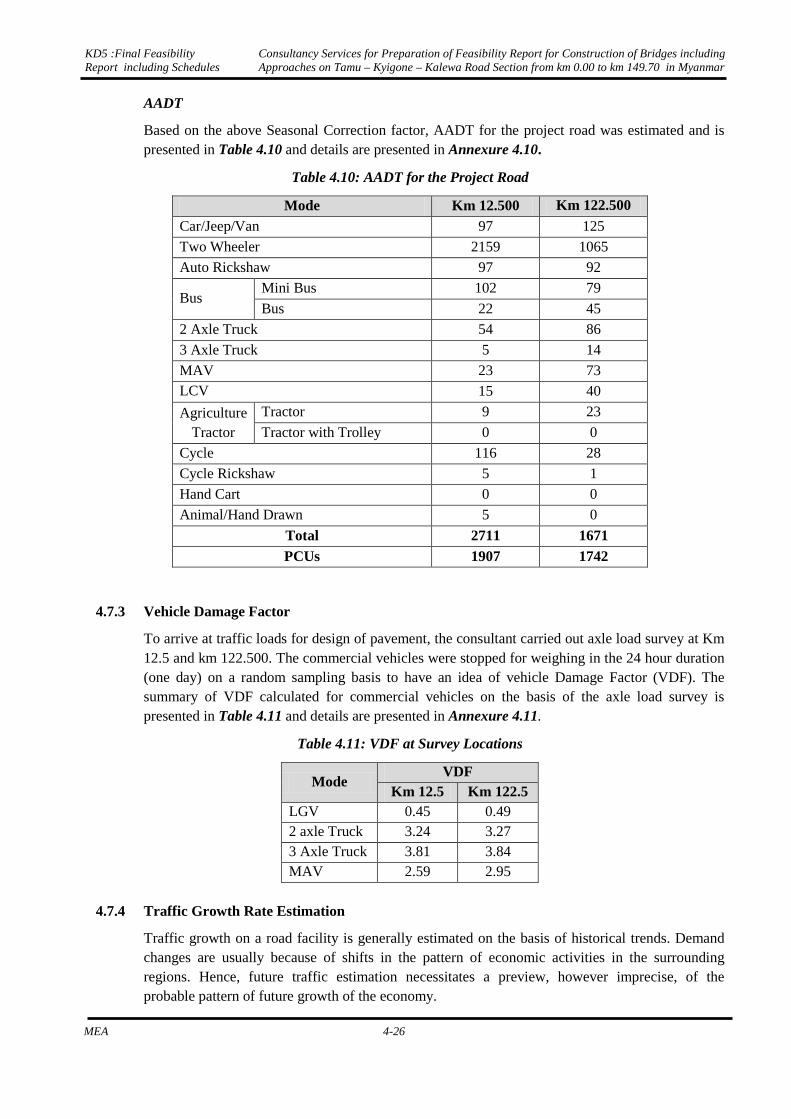
Annual Average Daily Traffic (AADT)
The traffic plying on any road generally varies over different periods of the year depending on the cycle of different socio-economic activities in the regions through which it passes. Therefore, in order to have a more realistic picture of the traffic on the project road, it is required to assess seasonal variation in traffic to estimate the Annual Average Daily Traffic (AADT). Therefore, the ADT observed during the survey duration is multiplied by a Seasonal Correction Factor (SCF) to derive an AADT. The seasonal correction factor is generally derived from secondary data sources such as past month-wise traffic data on the project road, sales of fuel at different filling stations along the project highway, arrival of vehicles at establishments like APMC, Truck Terminals, Railway Goods Stations, etc.
The average daily traffic has to be adjusted for seasonal variation. The seasonal correction factor has been estimated using the information collected from count station of Myanmar government. Presently the road leading from Kalewa to Mandalay will be closed during monsoon period. This section is being upgraded by MEA, India to two lane standard and would be operational in next two to three years and traffic flow would increase during the monsoon season. Considering the above factor the seasonal correction factor of 1 has been assumed for the project road.
KD5 :Final Feasibility Report including Schedules
Consultancy Services for Preparation of Feasibility Report for Construction of Bridges including Approaches on Tamu – Kyigone – Kalewa Road Section from km 0.00 to km 149.70 in Myanmar
MEA 4-26
AADT
Based on the above Seasonal Correction factor, AADT for the project road was estimated and is presented in Table 4.10 and details are presented in Annexure 4.10.
Table 4.10: AADT for the Project Road
Mode Km 12.500 Km 122.500 Car/Jeep/Van 97 125
Two Wheeler 2159 1065
Auto Rickshaw 97 92
Bus Mini Bus 102 79
Bus 22 45
2 Axle Truck 54 86
3 Axle Truck 5 14
MAV 23 73 LCV 15 40
Agriculture Tractor
Tractor 9 23
Tractor with Trolley 0 0
Cycle 116 28
Cycle Rickshaw 5 1
Hand Cart 0 0
Animal/Hand Drawn 5 0
Total 2711 1671 PCUs 1907 1742
4.7.3 Vehicle Damage Factor
To arrive at traffic loads for design of pavement, the consultant carried out axle load survey at Km 12.5 and km 122.500. The commercial vehicles were stopped for weighing in the 24 hour duration (one day) on a random sampling basis to have an idea of vehicle Damage Factor (VDF). The summary of VDF calculated for commercial vehicles on the basis of the axle load survey is presented in Table 4.11 and details are presented in Annexure 4.11.
Table 4.11: VDF at Survey Locations
Mode VDF
Km 12.5 Km 122.5 LGV 0.45 0.49 2 axle Truck 3.24 3.27 3 Axle Truck 3.81 3.84 MAV 2.59 2.95
4.7.4 Traffic Growth Rate Estimation
Traffic growth on a road facility is generally estimated on the basis of historical trends. Demand changes are usually because of shifts in the pattern of economic activities in the surrounding regions. Hence, future traffic estimation necessitates a preview, however imprecise, of the probable pattern of future growth of the economy.
KD5 :Final Feasibility Report including Schedules
Consultancy Services for Preparation of Feasibility Report for Construction of Bridges including Approaches on Tamu – Kyigone – Kalewa Road Section from km 0.00 to km 149.70 in Myanmar
MEA 4-27
The exercise of normal traffic growth rate estimation has been carried out by the consultants using the Vehicle registration method and elasticity approach.
The total traffic that is likely to patronize to improves road facility will comprise three distinct streams viai) normal traffic, ii) generated (or induced) traffic and iii) diverted traffic. Normal Traffic: refers that stream of traffic which is currently using the project road and will continue to grow even without the proposed improvement. Generated/Induced Traffic: connotes that stream of traffic which will get generated on account of the improved service (e.g. reduction in transport cost, reduced transit time, safe and comfortable travel, etc.,) attributes to the proposed improvements on the project road. The induced traffic is considered with development of trade between India and Myanmar. Diverted Traffic: denotes that stream of traffic which will get diverted from other routes / modes of transport to the project road because of the improved transport services traceable to the proposed improvements and possible diversions from project road sections to other road network. The scope for divertible trafficis minimum for the project.
Growth rates have been computed by the following two methods: 1. Vehicle Registration Data; 2. Elasticity Method from IRC:108-1996;
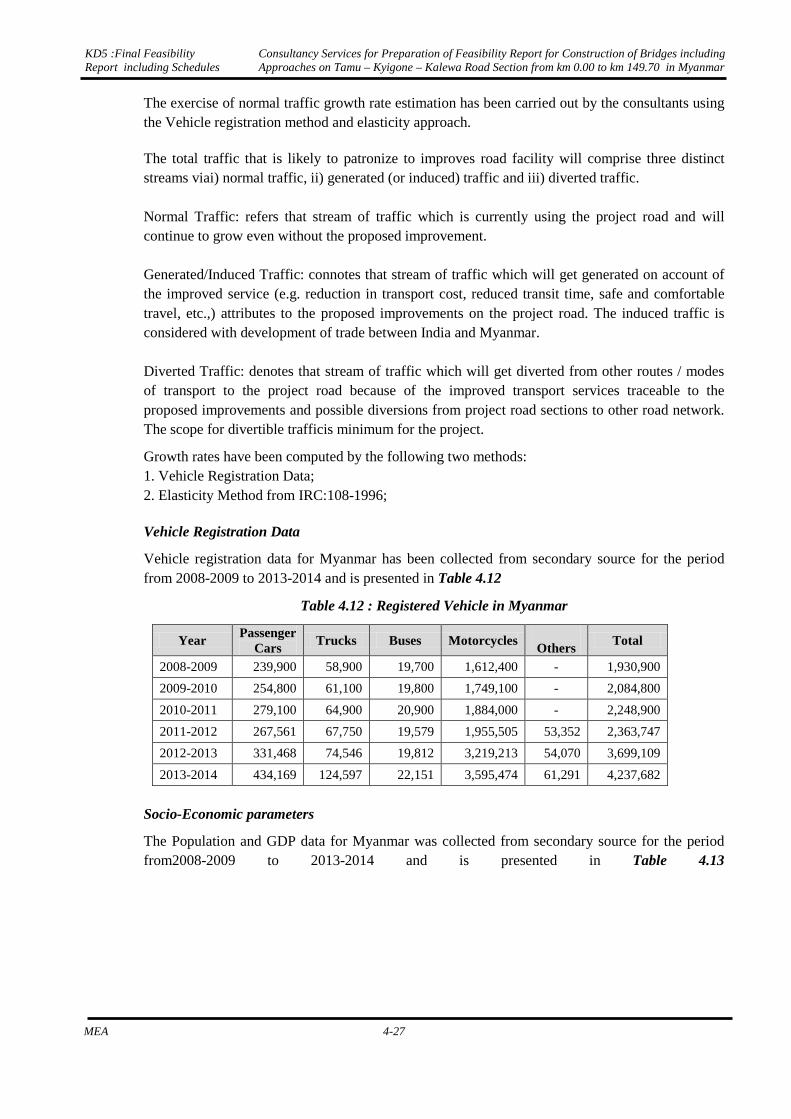
Vehicle Registration Data
Vehicle registration data for Myanmar has been collected from secondary source for the period from 2008-2009 to 2013-2014 and is presented in Table 4.12
Table 4.12 : Registered Vehicle in Myanmar
Year Passenger
Cars Trucks Buses Motorcycles
Others
Total
2008-2009 239,900 58,900 19,700 1,612,400 - 1,930,900
2009-2010 254,800 61,100 19,800 1,749,100 - 2,084,800
2010-2011 279,100 64,900 20,900 1,884,000 - 2,248,900
2011-2012 267,561 67,750 19,579 1,955,505 53,352 2,363,747
2012-2013 331,468 74,546 19,812 3,219,213 54,070 3,699,109
2013-2014 434,169 124,597 22,151 3,595,474 61,291 4,237,682
Socio-Economic parameters
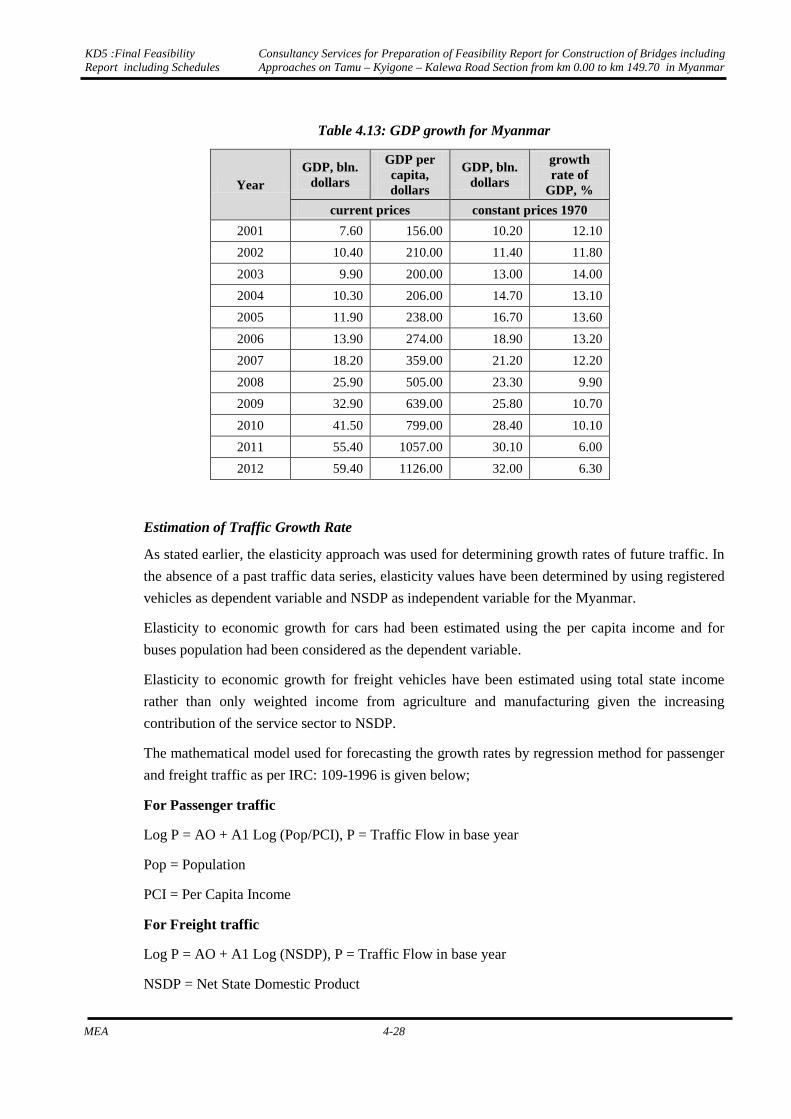
The Population and GDP data for Myanmar was collected from secondary source for the period from2008-2009 to 2013-2014 and is presented in Table 4.13
KD5 :Final Feasibility Report including Schedules
Consultancy Services for Preparation of Feasibility Report for Construction of Bridges including Approaches on Tamu – Kyigone – Kalewa Road Section from km 0.00 to km 149.70 in Myanmar
MEA 4-28
Table 4.13: GDP growth for Myanmar
Year GDP, bln.
dollars
GDP per capita, dollars
GDP, bln. dollars
growth rate of
GDP, %
current prices constant prices 1970
2001 7.60 156.00 10.20 12.10
2002 10.40 210.00 11.40 11.80
2003 9.90 200.00 13.00 14.00
2004 10.30 206.00 14.70 13.10
2005 11.90 238.00 16.70 13.60
2006 13.90 274.00 18.90 13.20
2007 18.20 359.00 21.20 12.20
2008 25.90 505.00 23.30 9.90
2009 32.90 639.00 25.80 10.70
2010 41.50 799.00 28.40 10.10
2011 55.40 1057.00 30.10 6.00
2012 59.40 1126.00 32.00 6.30
Estimation of Traffic Growth Rate
As stated earlier, the elasticity approach was used for determining growth rates of future traffic. In
the absence of a past traffic data series, elasticity values have been determined by using registered
vehicles as dependent variable and NSDP as independent variable for the Myanmar.
Elasticity to economic growth for cars had been estimated using the per capita income and for
buses population had been considered as the dependent variable.
Elasticity to economic growth for freight vehicles have been estimated using total state income
rather than only weighted income from agriculture and manufacturing given the increasing
contribution of the service sector to NSDP.
The mathematical model used for forecasting the growth rates by regression method for passenger
and freight traffic as per IRC: 109-1996 is given below;
For Passenger traffic
Log P = AO + A1 Log (Pop/PCI), P = Traffic Flow in base year
Pop = Population
PCI = Per Capita Income
For Freight traffic
Log P = AO + A1 Log (NSDP), P = Traffic Flow in base year
NSDP = Net State Domestic Product
KD5 :Final Feasibility Report including Schedules
Consultancy Services for Preparation of Feasibility Report for Construction of Bridges including Approaches on Tamu – Kyigone – Kalewa Road Section from km 0.00 to km 149.70 in Myanmar
MEA 4-29
Vehicle registration data is used as a proxy for traffic in the absence of past traffic data, however it
does not indicate actual number of vehicles plying on the road nor other economic trends which
may influence traffic elasticity to economic growth. Consequently, the elasticity values based on
registration data need to be adjusted in order to arrive at realistic future elasticity’s for the project
road. Various factors relating to vehicle technology changes, character of traffic and travel pattern
on the project road have to be considered.
Factors like growth of household incomes (particularly in urban areas), reduction in the prices of
entry-level cars, growth of the used car market, changes in life style, growing personal incomes,
desire to own a vehicle facilitated by availability of loans/financing schemes on easy terms, etc.
have all contributed to the rapid growth in ownership of cars. The elasticity derived from the
regression analysis has therefore been slightly increased to reflect this.
Over the years there is a change in passenger movement with an increasing number of people
shifting towards personalized modes given the low level of service provided by public transport
system. Elasticity values for buses from the regression analysis have been adjusted to reflect this.
Generally the spread of economic development induces changes in the spatial distribution of
activities and corresponding changes in transport demand elasticity. As regions become more and
more self-sufficient, the need for long-distance transport diminishes. Accordingly, it was assumed
that transport demand elasticity, for both freight and passenger traffic, would tend to decline over
time, despite growth in per capita income. Elasticity values duly adjusted after considering all
these factors and adopted for the future.
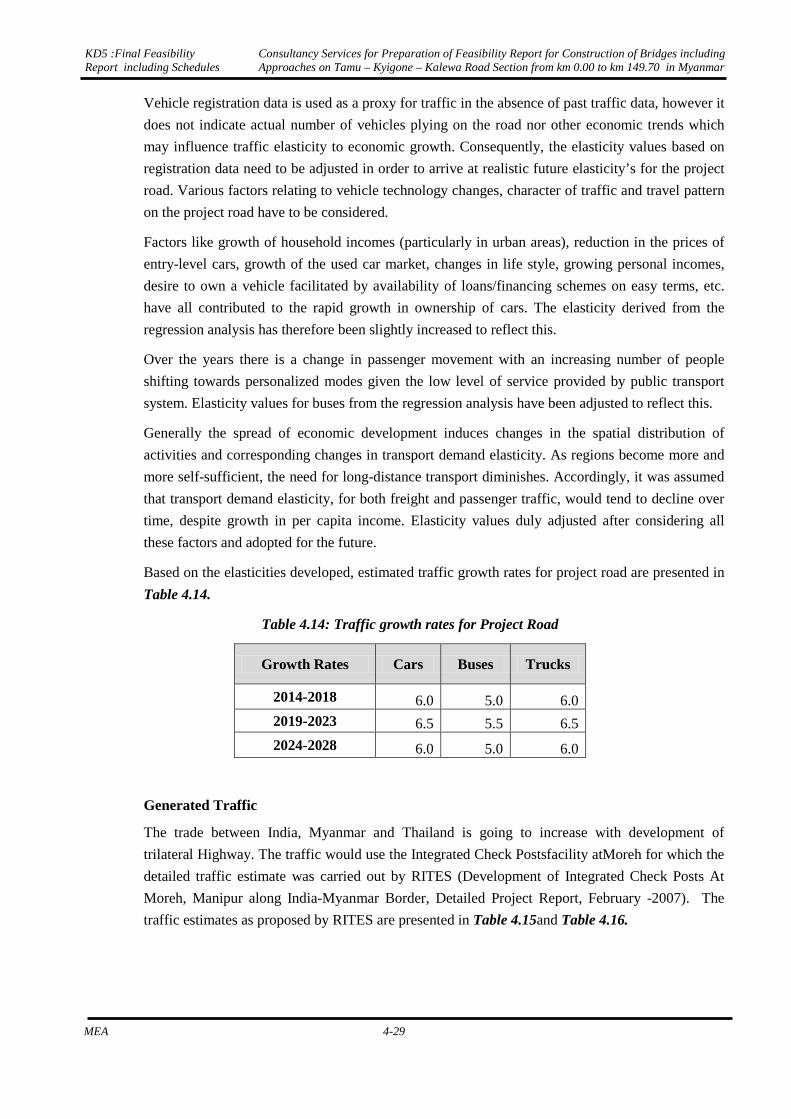
Based on the elasticities developed, estimated traffic growth rates for project road are presented in
Table 4.14.
Table 4.14: Traffic growth rates for Project Road
Growth Rates Cars Buses Trucks
2014-2018 6.0 5.0 6.0
2019-2023 6.5 5.5 6.5
2024-2028 6.0 5.0 6.0 Generated Traffic
The trade between India, Myanmar and Thailand is going to increase with development of
trilateral Highway. The traffic would use the Integrated Check Postsfacility atMoreh for which the
detailed traffic estimate was carried out by RITES (Development of Integrated Check Posts At
Moreh, Manipur along India-Myanmar Border, Detailed Project Report, February -2007). The
traffic estimates as proposed by RITES are presented in Table 4.15and Table 4.16.

KD5 :Final Feasibility Report including Schedules
Consultancy Services for Preparation of Feasibility Report for Construction of Bridges including Approaches on Tamu – Kyigone – Kalewa Road Section from km 0.00 to km 149.70 in Myanmar
MEA 4-30
Table 4.15.Traffic estimation for proposed Integrated Check Posts as estimated by RITES
Description 2010-11 2015-16 2020-21 2025-26 2030-31 Trucks (export from India) 141 180 213 253 253 Trucks (imports to India) 141 167 198 235 235 Bus 1 1 1 1 1
Table 4.16.Growth Rates for proposed Integrated Check Posts as estimated by RITES
Description Upto 2015-21 Upto 2021-30 (next 10 years)
Upto 2030-31(next 5 years)
Trucks (export from India) 5% 3.5% constant Trucks (imports to India) 3.5% 3.5% constant Bus 7.5% 5% constant
4.7.5 Traffic Volume Projections
Based on the adopted growth rates, the traffic volume has been estimated for period of twenty
years using compounded growth rates and presented Table 4.17and Table 4.18.

KD5 :Final Feasibility Report including Schedules
Consultancy Services for Preparation of Feasibility Report for Construction of Bridges including Approaches on Tamu – Kyigone – Kalewa Road Section from km 0.00 to km 149.70 in Myanmar
MEA 4-31
Table 4.17: Traffic Projection for Section I (HS -I) Km 0.000 to km 121.690
KD5 :Final Feasibility Report including Schedules
Consultancy Services for Preparation of Feasibility Report for Construction of Bridges including Approaches on Tamu – Kyigone – Kalewa Road Section from km 0.00 to km 149.70 in Myanmar
MEA 4-32
Table 4.18: Traffic Projection for Section II (HS -II) Km 121.690 to km 149.700
KD5 :Final Feasibility Report including Schedules
Consultancy Services for Preparation of Feasibility Report for Construction of Bridges including Approaches on Tamu – Kyigone – Kalewa Road Section from km 0.00 to km 149.70 in Myanmar
MEA 4-33
4.8 PAVEMENT INVESTIGATIONS
4.8.1 General
As part of the feasibility study, the Consultant conducted pavement investigations of the existing road, analysis of subgrade characteristics, assessing strength of existing sub-grade and pavement crust, material investigation and undertook pavement design for rehabilitation of the existing pavement and new construction as necessary along the project road.
4.8.2 Adopted Methodology for Feasibility Study
The methodology adopted for the feasibility study as per the Terms of Reference (TOR) included the following:
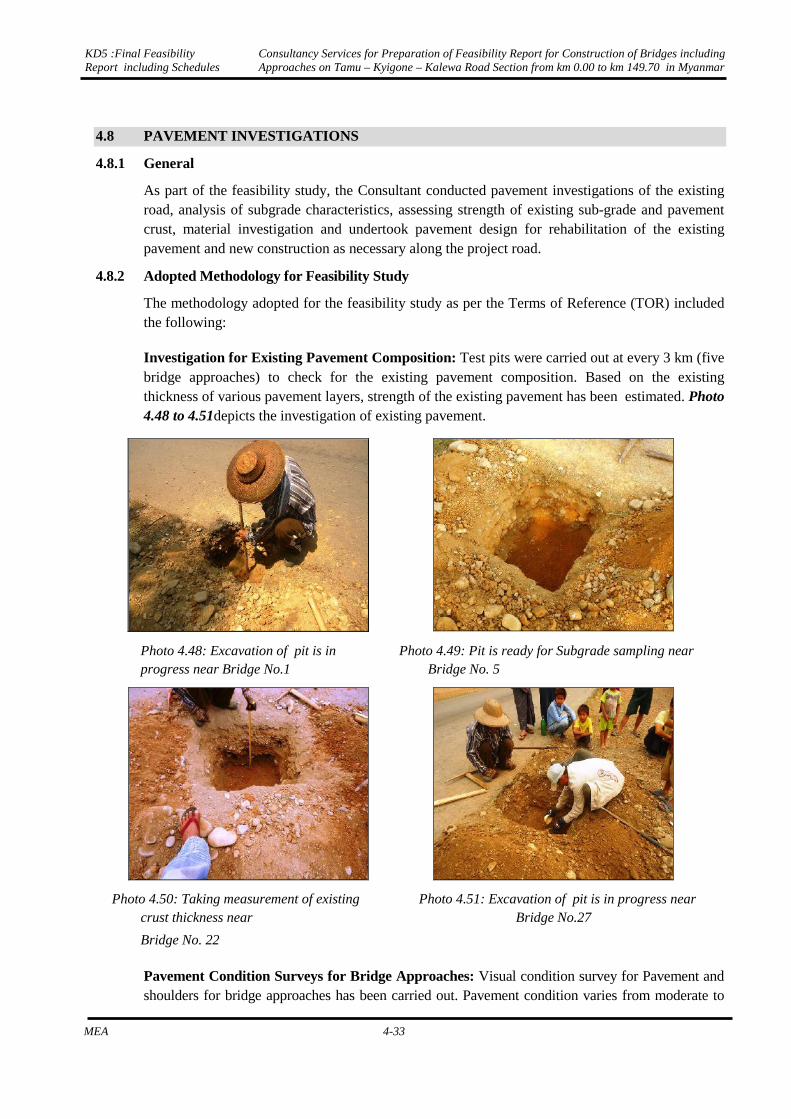
Investigation for Existing Pavement Composition: Test pits were carried out at every 3 km (five bridge approaches) to check for the existing pavement composition. Based on the existing thickness of various pavement layers, strength of the existing pavement has been estimated. Photo 4.48 to 4.51depicts the investigation of existing pavement.
Photo 4.48: Excavation of pit is in progress near Bridge No.1
Photo 4.49: Pit is ready for Subgrade sampling near Bridge No. 5
Photo 4.50: Taking measurement of existing crust thickness near
Bridge No. 22
Photo 4.51: Excavation of pit is in progress near Bridge No.27
Pavement Condition Surveys for Bridge Approaches: Visual condition survey for Pavement and shoulders for bridge approaches has been carried out. Pavement condition varies from moderate to
KD5 :Final Feasibility Report including Schedules
Consultancy Services for Preparation of Feasibility Report for Construction of Bridges including Approaches on Tamu – Kyigone – Kalewa Road Section from km 0.00 to km 149.70 in Myanmar
MEA 4-34
good but at many locations shoulders are in bad condition. The observations made during pavement survey is presented in tabular form furnished in Annexure 4.7.During the investigation, it was noticed that rehabilitation work of existing pavement is under progress at few stretches between Kyigone and Kalewa.
4.9 SOIL AND MATERIAL INVESTIGATION
4.9.1 General
The Survey and Investigations of subgrade soil and materials along highway were taken-up to
establish the condition of subgrade, and identify suitable materials for the construction of
embankment, subgrade, sub-base, base and other system of the road pavement. The other aim of
the survey is to determine the engineering properties of the materials, which are to be used during
the execution of the project.The consultants have carried out extensive surveys for both borrow
areas (fill/Sub grade), other material investigations (aggregates for civil and structural works) and
the sand. While carrying out the investigations the following aspects have been kept in mind:
• Suitability and good quality materials are available
• Economical Lead for the project both along the project road and off the project, type of access at
the sources
• Assessing quantum of material available at each source by means of engineering judgment and the
local practice in the source areas
4.9.2 Subgrade Soil
Subgrade sampling has been carried out in accordance with IRC requirements strictly adhering to
sampling requirements. From each source pits of 1m x1 m were dug and samples of 40 to 50 Kg
are collected to establish the suitability of the material for various layers namely embankment and
sub grade. The samples thus collected were subjected to following laboratory tests:
Grain size analysis : As per IS: 2720(part 4)
Atterberg limits : As per IS: 2720(part 5)
Moisture-Density test(Heavy Compaction) : As per IS: 2720(Part 8)
CBR (Unsoaked, and 4 days soaked) : As per IS: 2720(Part 16)
Grain Size
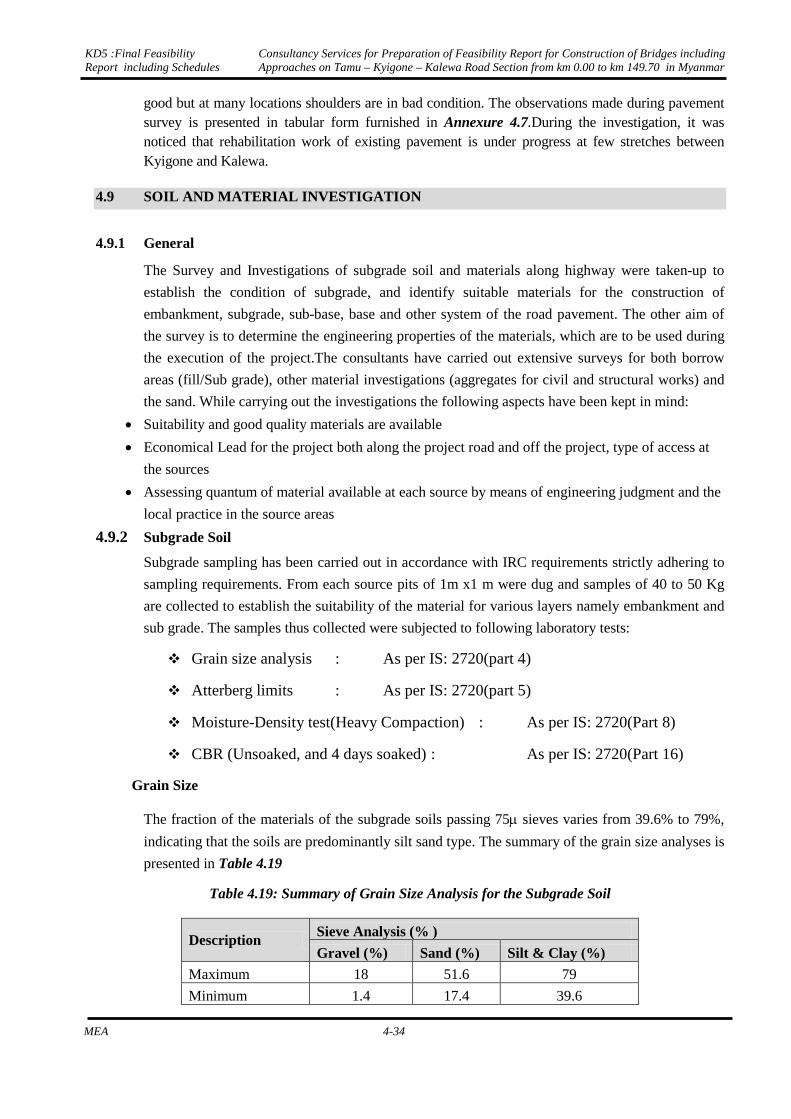
The fraction of the materials of the subgrade soils passing 75µ sieves varies from 39.6% to 79%,
indicating that the soils are predominantly silt sand type. The summary of the grain size analyses is
presented in Table 4.19
Table 4.19: Summary of Grain Size Analysis for the Subgrade Soil
Description Sieve Analysis (% )
Gravel (%) Sand (%) Silt & Clay (%)
Maximum 18 51.6 79
Minimum 1.4 17.4 39.6
KD5 :Final Feasibility Report including Schedules
Consultancy Services for Preparation of Feasibility Report for Construction of Bridges including Approaches on Tamu – Kyigone – Kalewa Road Section from km 0.00 to km 149.70 in Myanmar
MEA 4-35
Atterberg Limits
The liquid limit for the soil ranges from 30.11% to 37.16% along the project road alignment. The
plastic limit for samples vary from 11.81 % to 16.56% and plasticity index vary from 14.61% to
23.60%. The ranges of Atterberg’s limits of the existing subgrade soil are given in Table 4.20.
Table 4.20: Summary of Atterberg Limits for the Subgrade Soil
Description Atterberg Limits
Liquid Limit Plastic Limit Plasticity Index Maximum 37.16 16.56 23.60
Minimum 30.11 11.81 14.61
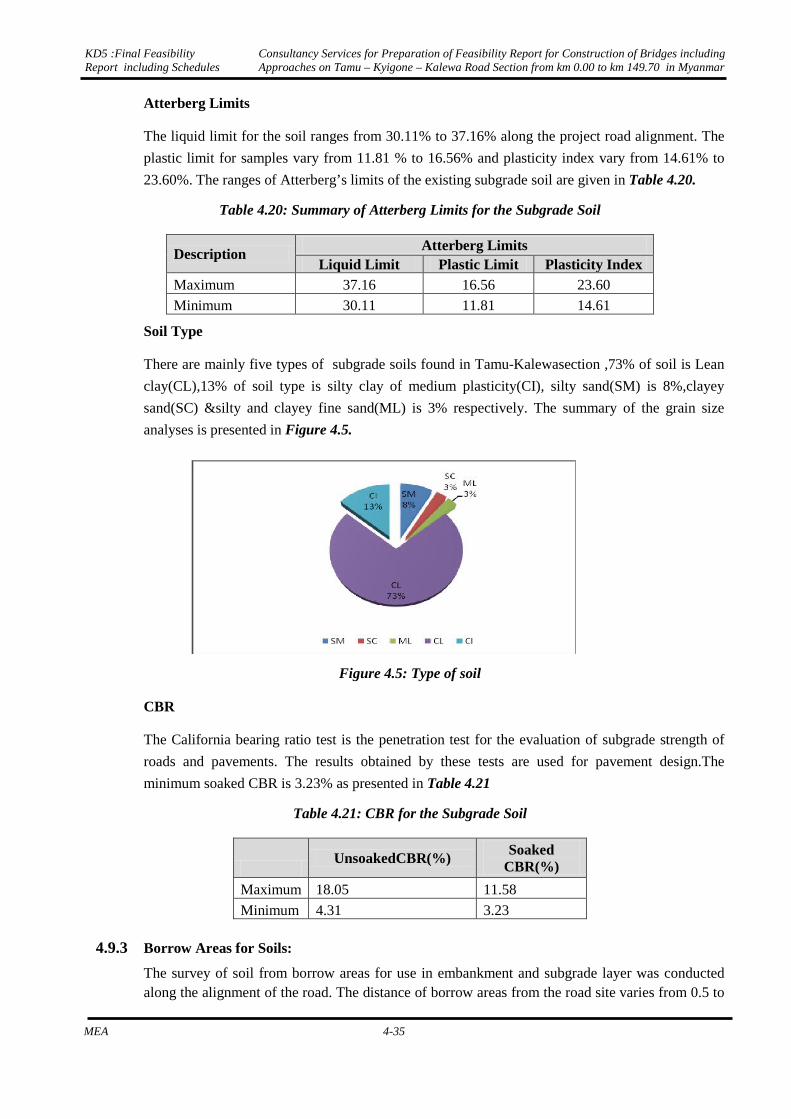
Soil Type
There are mainly five types of subgrade soils found in Tamu-Kalewasection ,73% of soil is Lean
clay(CL),13% of soil type is silty clay of medium plasticity(CI), silty sand(SM) is 8%,clayey
sand(SC) &silty and clayey fine sand(ML) is 3% respectively. The summary of the grain size
analyses is presented in Figure 4.5.
Figure 4.5: Type of soil
CBR
The California bearing ratio test is the penetration test for the evaluation of subgrade strength of
roads and pavements. The results obtained by these tests are used for pavement design.The
minimum soaked CBR is 3.23% as presented in Table 4.21
Table 4.21: CBR for the Subgrade Soil
UnsoakedCBR(%) Soaked
CBR(%)
Maximum 18.05 11.58
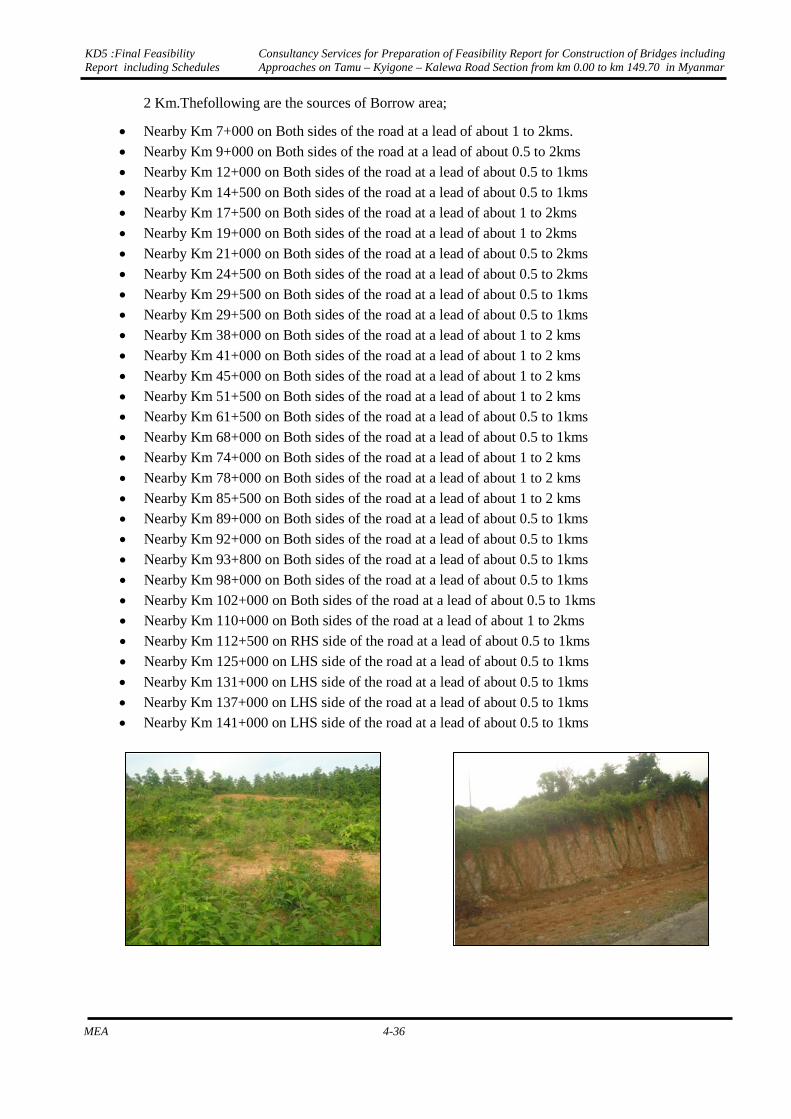
Minimum 4.31 3.23 4.9.3 Borrow Areas for Soils:
The survey of soil from borrow areas for use in embankment and subgrade layer was conducted along the alignment of the road. The distance of borrow areas from the road site varies from 0.5 to
KD5 :Final Feasibility Report including Schedules
Consultancy Services for Preparation of Feasibility Report for Construction of Bridges including Approaches on Tamu – Kyigone – Kalewa Road Section from km 0.00 to km 149.70 in Myanmar
MEA 4-36
2 Km.Thefollowing are the sources of Borrow area;
• Nearby Km 7+000 on Both sides of the road at a lead of about 1 to 2kms. • Nearby Km 9+000 on Both sides of the road at a lead of about 0.5 to 2kms • Nearby Km 12+000 on Both sides of the road at a lead of about 0.5 to 1kms • Nearby Km 14+500 on Both sides of the road at a lead of about 0.5 to 1kms • Nearby Km 17+500 on Both sides of the road at a lead of about 1 to 2kms • Nearby Km 19+000 on Both sides of the road at a lead of about 1 to 2kms • Nearby Km 21+000 on Both sides of the road at a lead of about 0.5 to 2kms • Nearby Km 24+500 on Both sides of the road at a lead of about 0.5 to 2kms • Nearby Km 29+500 on Both sides of the road at a lead of about 0.5 to 1kms • Nearby Km 29+500 on Both sides of the road at a lead of about 0.5 to 1kms • Nearby Km 38+000 on Both sides of the road at a lead of about 1 to 2 kms • Nearby Km 41+000 on Both sides of the road at a lead of about 1 to 2 kms • Nearby Km 45+000 on Both sides of the road at a lead of about 1 to 2 kms • Nearby Km 51+500 on Both sides of the road at a lead of about 1 to 2 kms • Nearby Km 61+500 on Both sides of the road at a lead of about 0.5 to 1kms • Nearby Km 68+000 on Both sides of the road at a lead of about 0.5 to 1kms • Nearby Km 74+000 on Both sides of the road at a lead of about 1 to 2 kms • Nearby Km 78+000 on Both sides of the road at a lead of about 1 to 2 kms • Nearby Km 85+500 on Both sides of the road at a lead of about 1 to 2 kms • Nearby Km 89+000 on Both sides of the road at a lead of about 0.5 to 1kms • Nearby Km 92+000 on Both sides of the road at a lead of about 0.5 to 1kms • Nearby Km 93+800 on Both sides of the road at a lead of about 0.5 to 1kms • Nearby Km 98+000 on Both sides of the road at a lead of about 0.5 to 1kms • Nearby Km 102+000 on Both sides of the road at a lead of about 0.5 to 1kms • Nearby Km 110+000 on Both sides of the road at a lead of about 1 to 2kms • Nearby Km 112+500 on RHS side of the road at a lead of about 0.5 to 1kms • Nearby Km 125+000 on LHS side of the road at a lead of about 0.5 to 1kms
• Nearby Km 131+000 on LHS side of the road at a lead of about 0.5 to 1kms • Nearby Km 137+000 on LHS side of the road at a lead of about 0.5 to 1kms • Nearby Km 141+000 on LHS side of the road at a lead of about 0.5 to 1kms

KD5 :Final Feasibility Report including Schedules
Consultancy Services for Preparation of Feasibility Report for Construction of Bridges including Approaches on Tamu – Kyigone – Kalewa Road Section from km 0.00 to km 149.70 in Myanmar
MEA 4-37
Few locations for Borrow Areas for soil
4.9.4 Stone Metal Quarries:
Extensive survey was conducted to locate the availability of stone metal near the project site. As a result of local enquiries and discussion with the officials of Ministry of Construction, Myanmar, stone metal quarries were identified in the vicinity of the project road. The availability of boulder or the river bed material is depend on the intensity of monsoon season, mainly boulders come in the natural streams with floods from high altitudes. The following are the sources of stone metal;
• Nearby Km 1+600 on LHS side of the road at a lead of about 22kms. • Nearby Km 31+040 on Both side sides of the road at a lead of about 1 to 2kms. • Nearby Km 34+260 on RHS side of the road at a lead of about 2 to 3kms • Nearby Km 49+850 on LHS side of the road at a lead of about 2 to 3kms • Nearby Km 54+150 on Both sides of the road at a lead of about 2 to 3kms • Nearby Km 120+000 on RHS side of the road at a lead of about 22 to 24kms • Nearby Km 132+300 on LHS side of the road at a lead of about 5 to 7kms • Nearby Km 143+500 on LHS side of the road at a lead of about 15 to 17kms
KD5 :Final Feasibility Report including Schedules
Consultancy Services for Preparation of Feasibility Report for Construction of Bridges including Approaches on Tamu – Kyigone – Kalewa Road Section from km 0.00 to km 149.70 in Myanmar
MEA 4-38
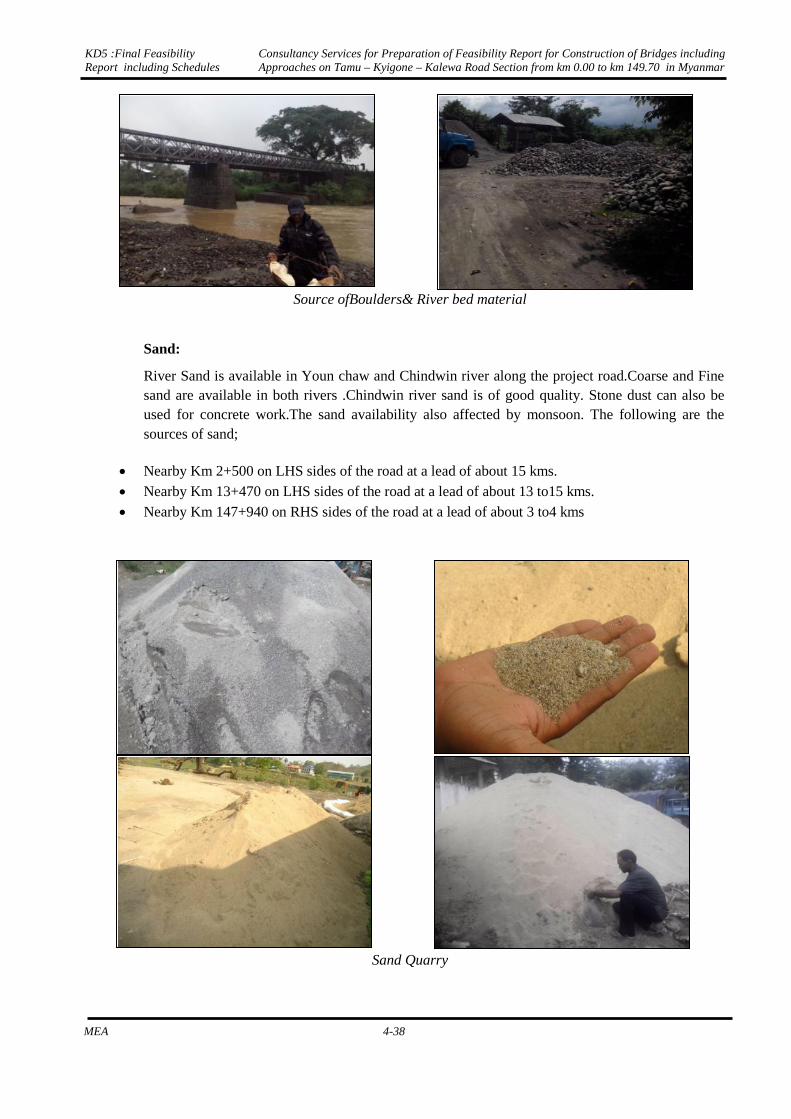
Source ofBoulders& River bed material
Sand:
River Sand is available in Youn chaw and Chindwin river along the project road.Coarse and Fine sand are available in both rivers .Chindwin river sand is of good quality. Stone dust can also be used for concrete work.The sand availability also affected by monsoon. The following are the sources of sand;
• Nearby Km 2+500 on LHS sides of the road at a lead of about 15 kms. • Nearby Km 13+470 on LHS sides of the road at a lead of about 13 to15 kms. • Nearby Km 147+940 on RHS sides of the road at a lead of about 3 to4 kms
Sand Quarry
KD5 :Final Feasibility Report including Schedules
Consultancy Services for Preparation of Feasibility Report for Construction of Bridges including Approaches on Tamu – Kyigone – Kalewa Road Section from km 0.00 to km 149.70 in Myanmar
MEA 4-39
4.10 GEO TECHNICAL INVESTIGATIONS
Detailed Geotechnical investigation reports of all bridges has been submitted separately in stage “KD3: Report on soil characteristics, sub-soil and hydraulic investigation, GAD for bridge and other structures”