chapter 4 - experimental techniquesmichael.lufaso/chem3610/inorganic_chapter4.pdfchapter 4 -...
TRANSCRIPT

1
Chapter 4 - Experimental Techniques
Compositional analysis and
formula determination
Structure
Bonding, connectivity,
oxidation states
Separation and purification techniques:
Gas Chromatography (GC)
• Separate volatile components of a mixture
• Depends on the different interactions of the components in a mobile phase
(carrier gas) with a stationary phase (alumina or silica)
• Characteristic retentions times

2
Separation and purification techniques:
Liquid Chromatography (LC)
Liquid chromatography is a separation technique in which the mobile phase is a liquid,
the stationary phase is either packed inside a column or adhered to a glass plate.
K =�����������
�����
Ratio of distance travelled by the
analyte to that of the solvent
front is the retention factor (Rf)
Equilibrium between the surface
bound and solution species,
preference for stationary or
mobile phase is given by the
equilibrium constant:
Monitor separation by eye or UV
absorption, under gravity flow or
pressure (flash chromatography)
Separation and purification techniques:
High-Performance Liquid Chromatography (HPLC)
HPLC is type of liquid chromatography in which
the mobile phase is introduced under pressure
(≈40 Mpa) and the stationary phase consists of
very small particles (d = 3-10 μm).

3
Recrystallization
morphology
-purification step involving the dissolution and crystallization of a solid
from a solvent or solvent mixture.
Elemental Analysis: CHN analysis by combustion

4
Atomic absorption spectroscopy (AAS)
-quantitative determination of a metal can be carried out using atomic absorption spectroscopy
(AAS) by observing the diagnostic absorption spectrum of gaseous atoms of the metal
• Specific wavelength
• Atomizer
• Standards and calibration curve
• Beer-Lambert Law• Sensitive, limit of detection near μg/L
Thermogravimetric analysis (TGA)
http://cnx.org/resources/d59f3768609ace896cf76b8a9fd3d215/TGA.jpg
The change in mass of a sample
is monitored as a sample is
heated at a constant rate.
Investigate: solvent of
crystallization, thermal
decomposition, gas uptake
5
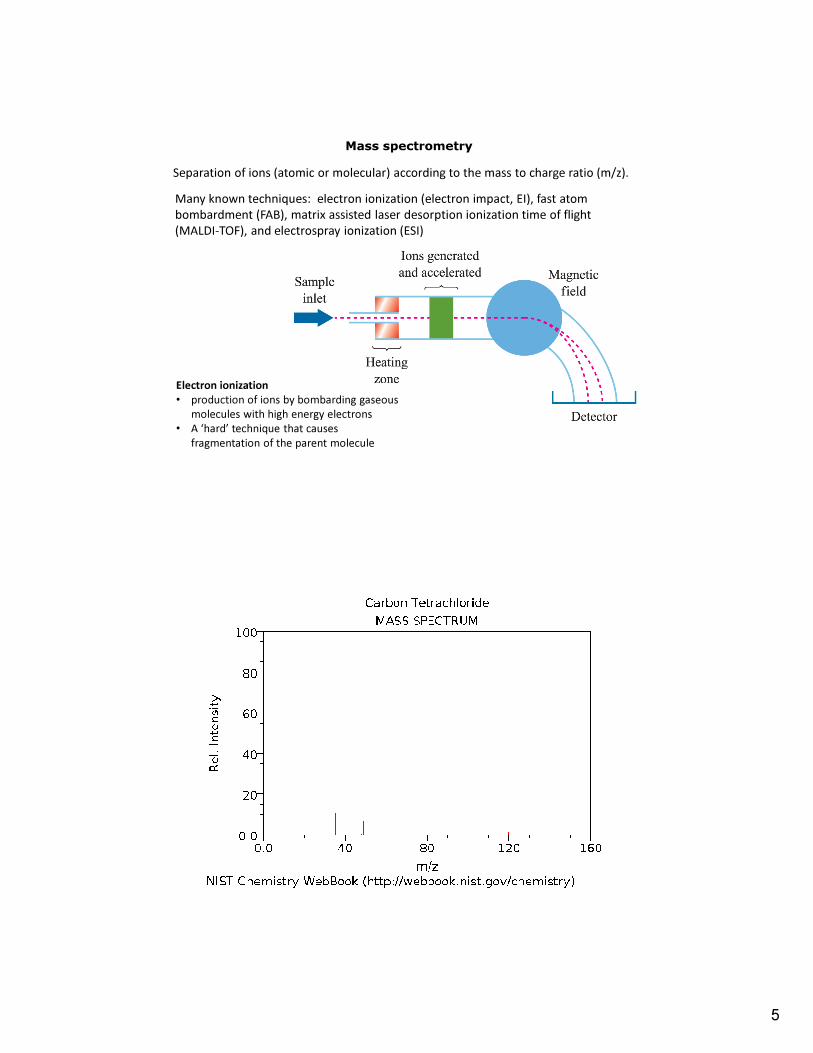
Mass spectrometry
Separation of ions (atomic or molecular) according to the mass to charge ratio (m/z).
Many known techniques: electron ionization (electron impact, EI), fast atom
bombardment (FAB), matrix assisted laser desorption ionization time of flight
(MALDI-TOF), and electrospray ionization (ESI)
Electron ionization
• production of ions by bombarding gaseous
molecules with high energy electrons
• A ‘hard’ technique that causes
fragmentation of the parent molecule

6
FAB mass spectrometer
Ions are produced by bombarding the sample (neutral molecules or ionic
salts) with high energy xenon or argon atoms. It is a soft technique and
usually causes little fragmentation.
MALDI-TOF mass spectrometer
Matrix assisted laser desorption ionization time-of-flight
mass spectrometry utilizes a UV laser
• A ‘soft’ method with little fragmentation.

7
ESI mass spectrometer
Electrospray ionization (ESI) mass spectrometry
• A ‘soft’ method for neutral molecules or ionic salts.
Infrared and Raman spectroscopies
• For a vibrational mode to be IR
active, it must give rise to a
change in dipole moment.
• For a vibrational mode to be
Raman active, it must give rise
to a change in polarizability.
Molecules undergo anharmonic
oscillations, but we can approximate
a transition from the ground state to
first vibrational state with a simple
harmonic oscillator.
Ev
= (v+1/2)hν
8
�
�=
�
��
+�
��
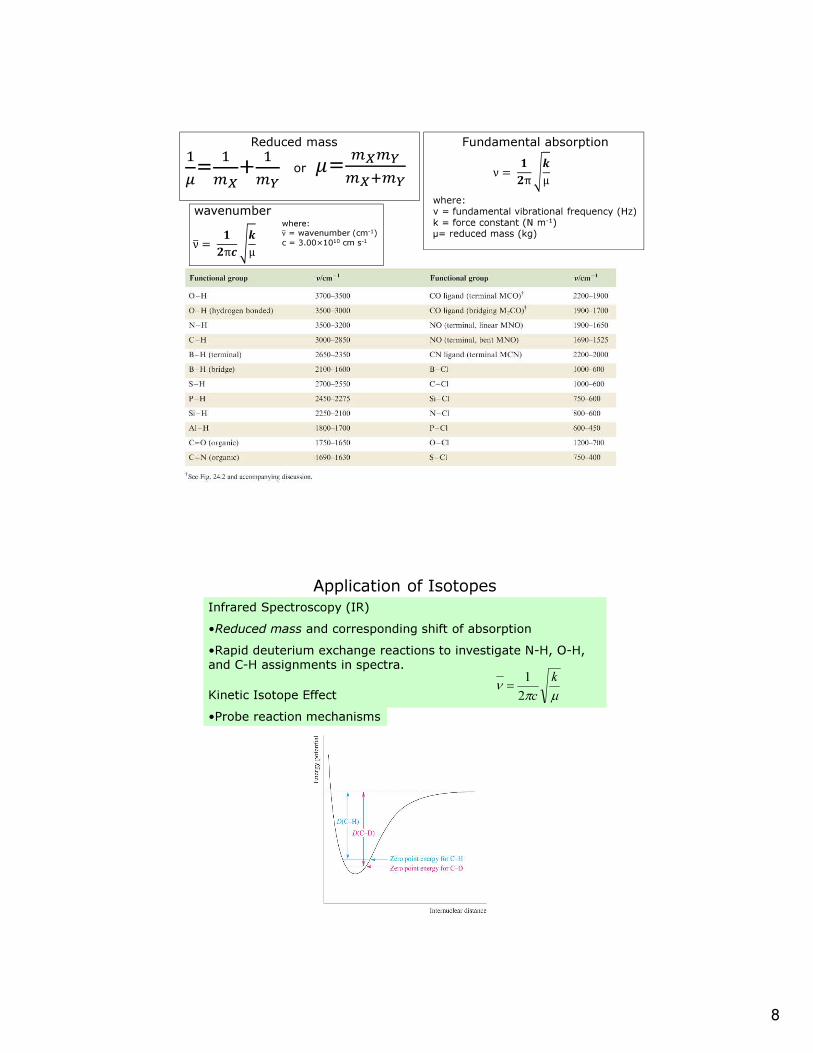
Reduced mass
�=����
�����
or
Fundamental absorption
ν = �
�π
�
μ
where:
ν = fundamental vibrational frequency (Hz)
k = force constant (N m-1)μ= reduced mass (kg)
wavenumber
ν� = �
�π�
�
μ
where: ν� = wavenumber (cm-1)
c = 3.00×1010 cm s-1
Application of Isotopes
Infrared Spectroscopy (IR)
•Reduced mass and corresponding shift of absorption
•Rapid deuterium exchange reactions to investigate N-H, O-H,
and C-H assignments in spectra.
µπν
k
c2
1=
Kinetic Isotope Effect
•Probe reaction mechanisms

9
IR spectra of [Co(NH3)6]2[SO4]3 • 5H2O (in red) and [Co(NH3)5(OSO3)]Br (in green)
K.Nakamoto et al. (1957) J. Am. Chem. Soc., vol. 79, p. 4904.

10
Raman spectroscopy
• Rayleigh scattering: most of light of frequency ν
0is
scattered by a molecule
with no change in
frequency.
• Some of the scattered light has frequency ν = ν
0 + ν,
where ν is the fundamental
frequency of the molecule
(Raman scattering).
• Raman scattering extends
to lower wavenumber than
routine lab IR spectroscopy,
so one may observe M-L
modes.
• Sensitivity may be
increased by resonance
Raman spectroscopy,
where the wavelength of
the laser corresponds to the
wavelength of absorptions
in the electronic spectrum of the compound.
11
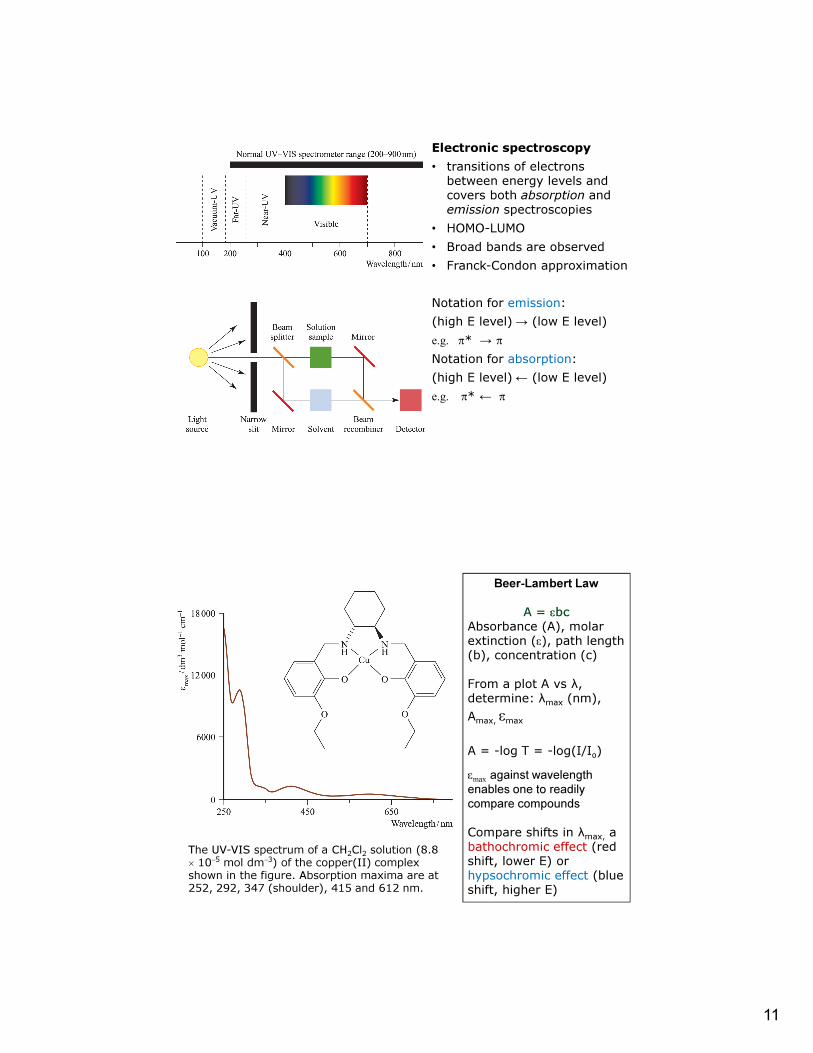
Electronic spectroscopy
• transitions of electrons
between energy levels and
covers both absorption and
emission spectroscopies
• HOMO-LUMO
• Broad bands are observed
• Franck-Condon approximation
Notation for emission:
(high E level) → (low E level)
e.g. π* → π
Notation for absorption:
(high E level) ← (low E level)
e.g. π* ← π
The UV-VIS spectrum of a CH2Cl2 solution (8.8
× 10−5 mol dm−3) of the copper(II) complex
shown in the figure. Absorption maxima are at
252, 292, 347 (shoulder), 415 and 612 nm.
Beer-Lambert Law
A = εbc
Absorbance (A), molar
extinction (ε), path length
(b), concentration (c)
From a plot A vs λ,
determine: λmax (nm),
Amax, εmax
A = -log T = -log(I/Io)
εmax
against wavelength
enables one to readily
compare compounds
Compare shifts in λmax, a
bathochromic effect (red
shift, lower E) or
hypsochromic effect (blue
shift, higher E)

12
Sources of 2H and 13C
−+
++⇔ eHOOH 44222
−−
+⇔+ OHHeOH 424422
At the anode
At the cathode
6_ ≈
=
solution
gas
D
H
D
H
FactorSeparation
)(][)()(][)( 12131312aqCNgCNHaqCNgCNH
−−
+⇔+
Isotopically enriched solvents needed for NMR experiments
K = 1.026
)(][)()(][)(3
13
2
12
3
12
2
13aqCOHgCOaqCOHgCO
−−
+⇔+ K = 1.012
Nuclear Spin
• A nucleus with an odd atomic number or an odd mass number has a nuclear spin.
• The spinning charged nucleus generates a magnetic field.
13
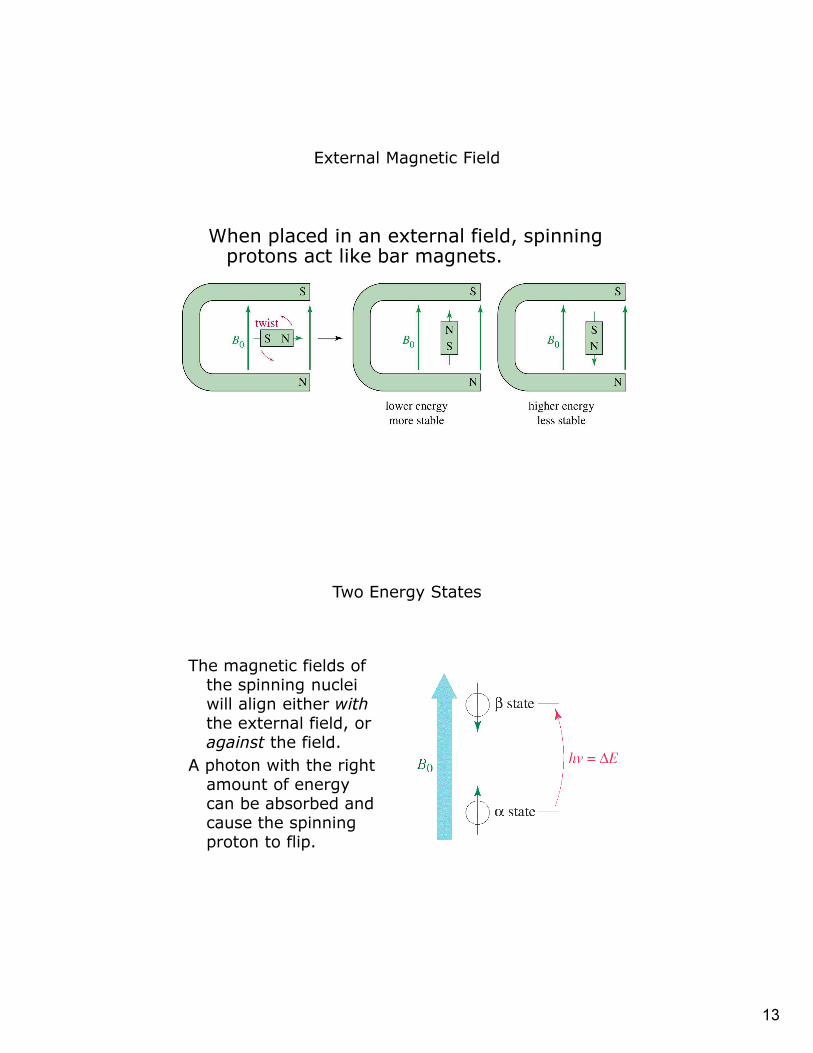
External Magnetic Field
When placed in an external field, spinning protons act like bar magnets.
Two Energy States
The magnetic fields of the spinning nuclei will align either withthe external field, or against the field.
A photon with the right amount of energy can be absorbed and cause the spinning proton to flip.

14
The NMR Spectrometer
15
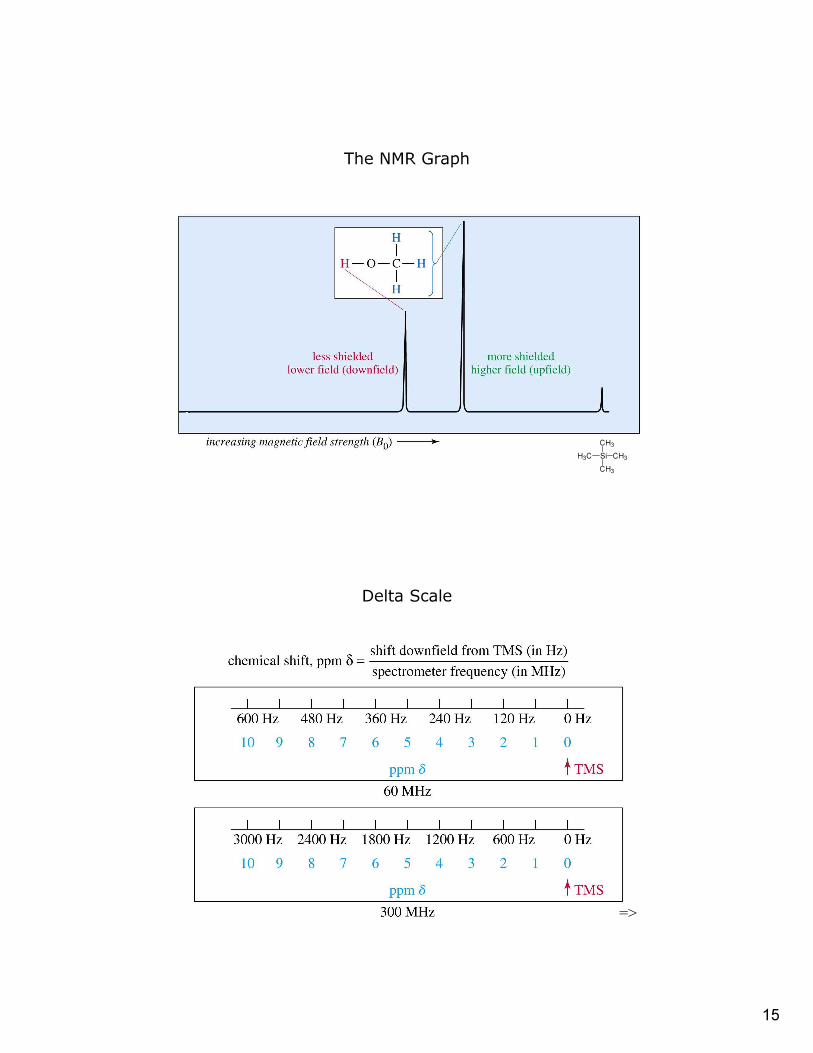
The NMR Graph
Si
CH3
CH3
CH3
H3C
Delta Scale
=>
16
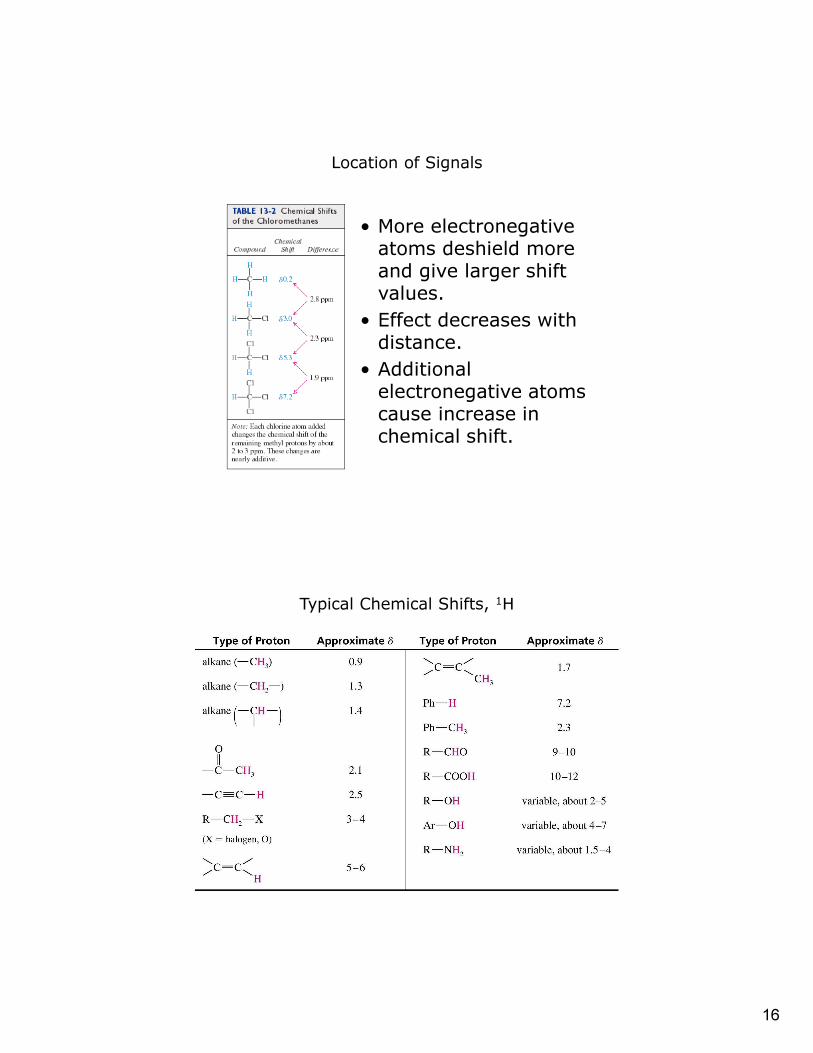
Location of Signals
• More electronegative atoms deshield more and give larger shift values.
• Effect decreases with distance.
• Additional electronegative atoms cause increase in chemical shift.
Typical Chemical Shifts, 1H

17
Chemical Shift (δ)
Intensity

18
Chemical Shift (δ)
Intensity
Chemical Shift (δ)
Intensity

19
Chemical Shift (δ)
Intensity
Chemical Shift (δ)
Intensity

20
Chemical Shift (δ)
Intensity
8
4 4
2 22 2
1 111 1111
Coupling to the first 1H
(2 * 1/2
+ 1 = 2)
Coupling to the second 1H
Coupling to the third 1H

21
Doublet: 1 Adjacent Proton

22
Triplet: 2 Adjacent Protons
Chemical Shift (δ)
Intensity

23
Proton-Coupled 13C Spectra

24
Proton-coupled 13C spectra for ethyl phenylacetate.
Proton-decoupled 13C NMR spectrum for ethyl phenylacetate.
The 162 MHz 31P NMR spectra of PPh3 and O=PPh3.

25
The 100 MHz NMR spectrum of butanone.

26
The 162 MHz 31P NMR spectrum of a salt of [PF6]− consists of a binomial septet.
The value of JPF can be measured between any pair of adjacent lines in the signal.
The 128 MHz 11B NMR spectrum of a solution of NaBH4 in CD3C(O)CD3. The
value of JBH can be measured between any pair of adjacent lines in the signal.

27
The 162 MHz 31P{1H} NMR spectrum of the adduct PhMe2P•BH3. The four-
line pattern is not a binomial quartet but an approximate 1:1:1:1 multiplet.
The 376 MHz 19F NMR spectrum of [XeF5]−

28
Timescales of experimental Techniques
Berry pseudo-rotation interconverts one trigonal bipyramidal
structure into another via a square-based pyramidal transition state.
The numbering scheme illustrates that axial and equatorial sites in
the trigonal bipyramid are interchanged.

29
Under an applied magnetic field, B0, the interaction between an
unpaired electron and the magnetic field results in a splitting of the
energy levels (the Zeeman electronic effect).
∆E = gµBB0, where g = Lande g-factor (g-value), B0=applied magnetic field (in Tesla, T), µB = Bohr magneton (1 µB =eh/4πme=9.2740×10
-24 J T-1)
The g-value is given by ratio 2µe/µB where µe is the electron magnetic moment (9.2848×10⁻²⁴ J T-1). g = 2.0023 for a free electron.
EPR - Electron Paramagnetic Resonance
The typical appearance of a simple EPR spectrum is shown by
the blue line. This is the first derivative of the absorption peak
(shown in red).

30
Typical line shapes for EPR spectra of an isotropic system (blue
line), an anisotropic system with axial symmetry (red line), and an
anisotropic system (green line).
(a) Coupling between an unpaired electron on a Co2+ ion with the 59Co
nucleus (100%, I = 7/2) gives rise to an 8-line hyperfine splitting pattern
for the EPR signal (microwave frequency = 9.785 GHz). (b) Coupling
between an unpaired electron on a Cu2+ ion with the 63Cu and 65Cu nuclei
(69.2% and 30.8%, respectively, both I = 3/2) produces two superimposed
4-line splitting patterns. A and A∗ are the hyperfine coupling constants.
31
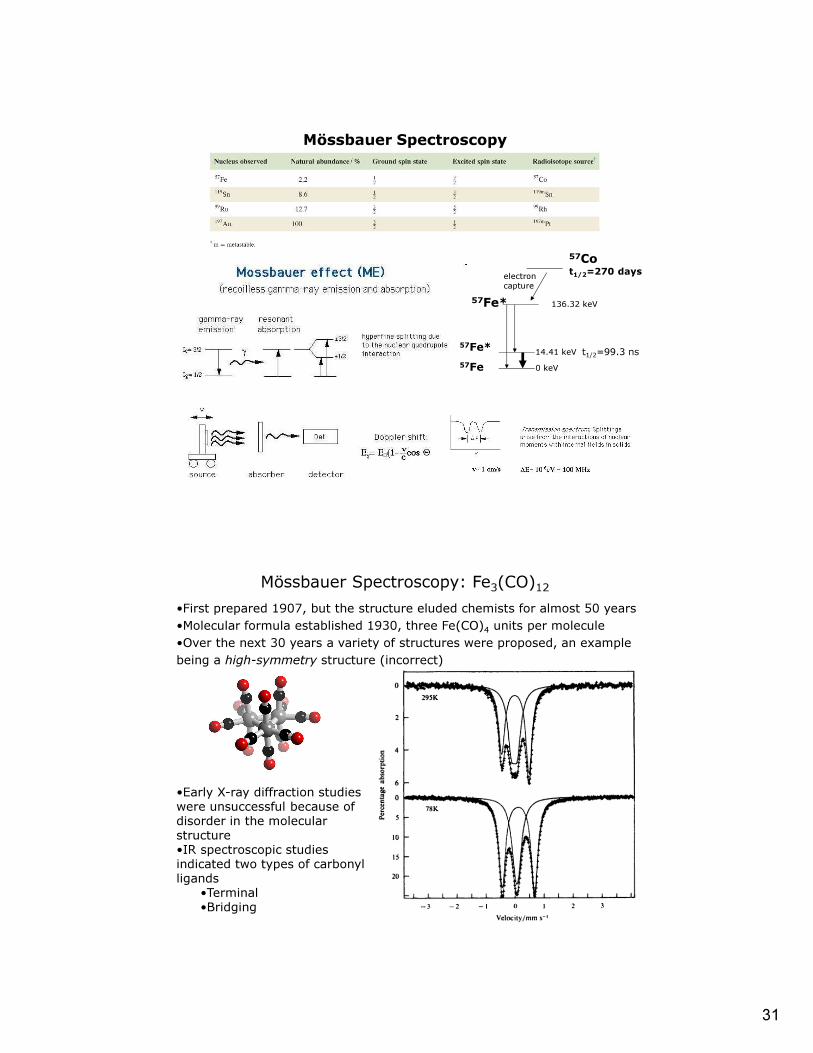
Mössbauer Spectroscopy
57Cot1/2=270 days
electron
capture
57Fe* 136.32 keV
57Fe*
57Fe
14.41 keV
0 keV
t1/2=99.3 ns
Mössbauer Spectroscopy: Fe3(CO)12
•First prepared 1907, but the structure eluded chemists for almost 50 years
•Molecular formula established 1930, three Fe(CO)4 units per molecule
•Over the next 30 years a variety of structures were proposed, an example
being a high-symmetry structure (incorrect)
•Early X-ray diffraction studies
were unsuccessful because of
disorder in the molecular
structure
•IR spectroscopic studies
indicated two types of carbonyl
ligands
•Terminal
•Bridging

32
The solid state structure of Fe3(CO)12 as determined by X-ray
diffraction methods. The molecule contains two Fe
environments by virtue of the arrangement of the CO groups.
Schematic representation of the interaction of X-rays with layers of
atoms in a crystal. This leads to the derivation of Bragg’s equation:
2d sinθ = nλ
Diffraction Methods

33
Crystal structure of organic ligand (b) 123 K and (c) 293 K with
ellipsoids plotted at a 50% probability level.
Single crystal X-ray diffraction
http://www.xtal.iqfr.csic.es/Cristalografia/parte_06-en.html
Single crystal growth - relies on lowering the solubility
of the compound in solution (via evaporation, cooling,
diffusing a solvent in which compound is insoluble into
a solution of the compound in a second solvent,
diffuse a vapor of volatile solvent into a solution of the
compound in a second solvent)

34
Calculated powder pattern for 4'-azido-2,2':6',2''-terpyridine
Powder X-ray diffraction
Polycrystalline Powder
A powder may be composed of many
small and finely ground crystals, known
as crystallites.
Identifying bulk sample, screening,
structure refinement, structure solution
• Crystal structure, coordination, bond
distances, bond angles

35
Electron diffraction
Gas phase electron diffraction: electrons scattered by electric fields of
atomic nuclei in gas phase molecules
• Electrons at 50 kV (λ = 5.5 pm) and obtain a diffraction pattern
• Obtain intramolecular bond parameters
Experimental (dots) and calculated (solid line) radial distributions for SiMe4.
Solids may also be examined using electron diffraction. Low-energy
electron diffraction (LEED) is useful for the study of surfaces on solids.
Computational Methods
Hartree-Fock Theory – Approximate solutions to Schrodinger
equation, converge to self-consistency. Considering only valence
electrons, a number of semi-empirical methods CNDO (complete
neglect of differential overlap, INDO (intermediate neglect of
differential overlap), MNDO (modified neglect of diatomic overlap),
AM1 (Austin model 1), and PM3 (parametric method 3).
Density Functional Theory (DFT) – Focus on the electron
density distribution in the system instead of many electron
wavefunctions. Several levels BLYP, B3LYP.
Huckel MO Theory – Works well for π-systems of unsaturated
organic molecules. Extended Huckel theory for most hydrocarbons.
Molecular mechanics (MM)– Uses strain energy (no quantum
mechanical basis). Conformation of a molecule changes until the
strain energy is minimized. AMBER and CHARMM methods.
Generally applied to small (discrete molecules) and large (nucleic
acids and proteins).