chapter 4 measures of dispersion - ca sri lanka 4 dispersion.pdf · measures of dispersion: summary...
TRANSCRIPT
Chapter 4
Measures of Dispersion
Range
Quartiles
Variance
Standard Deviation
Coefficient of Variation
Basic Business Statistics, 11e © 2009 Prentice-Hall, Inc.. Chap 3-2
Summary Definitions
The measure of dispersion shows how the
data is spread or scattered around the mean.
The measure of location or central tendency
is a central value that the data values group
around. It gives an average value.
The measure of skewness is how symmetrical
(or not) the distribution of data values is.
Basic Business Statistics, 11e © 2009 Prentice-Hall, Inc.. Chap 3-3
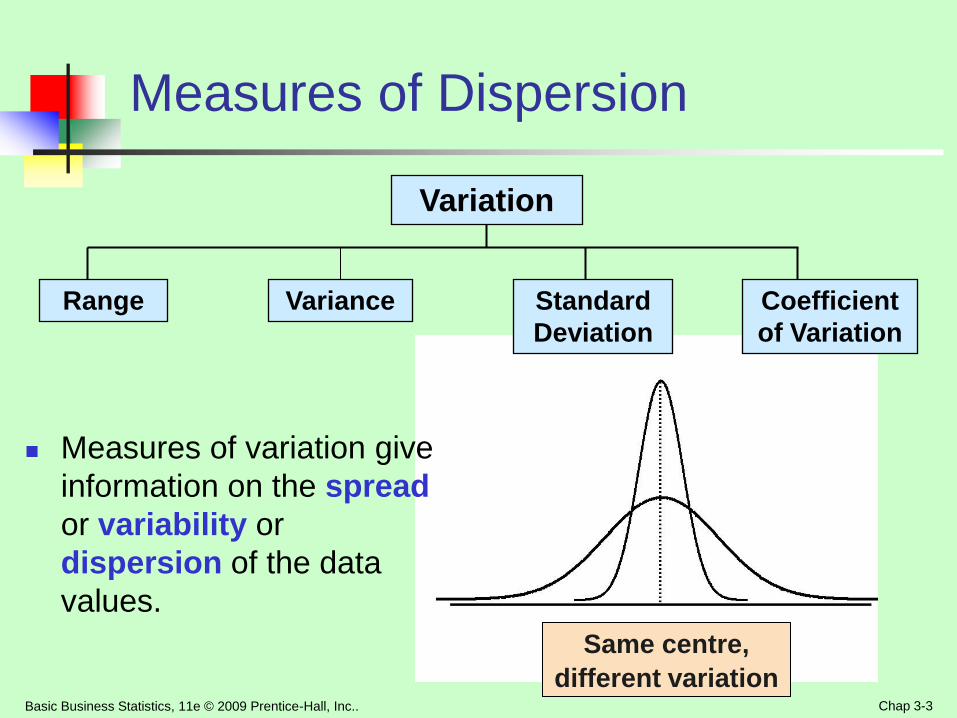
Same centre,
different variation
Measures of Dispersion
Measures of variation give
information on the spread
or variability or
dispersion of the data
values.
Variation
Standard
Deviation
Coefficient
of Variation
Range Variance
Basic Business Statistics, 11e © 2009 Prentice-Hall, Inc.. Chap 3-4
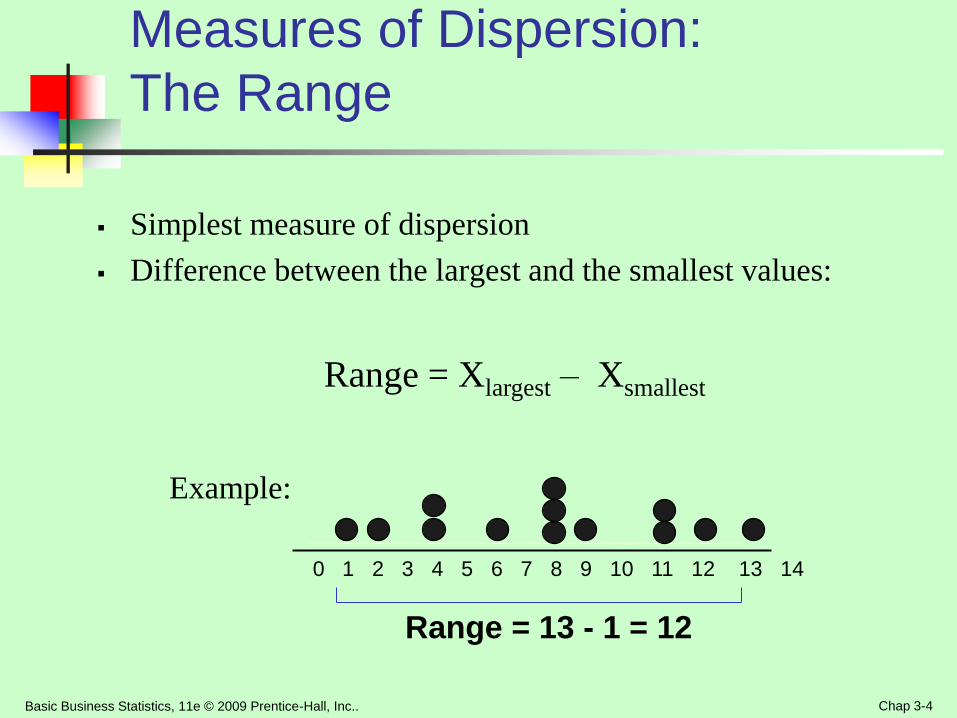
Measures of Dispersion:
The Range
Simplest measure of dispersion
Difference between the largest and the smallest values:
Range = Xlargest – Xsmallest
0 1 2 3 4 5 6 7 8 9 10 11 12 13 14
Range = 13 - 1 = 12
Example:
Basic Business Statistics, 11e © 2009 Prentice-Hall, Inc.. Chap 3-5
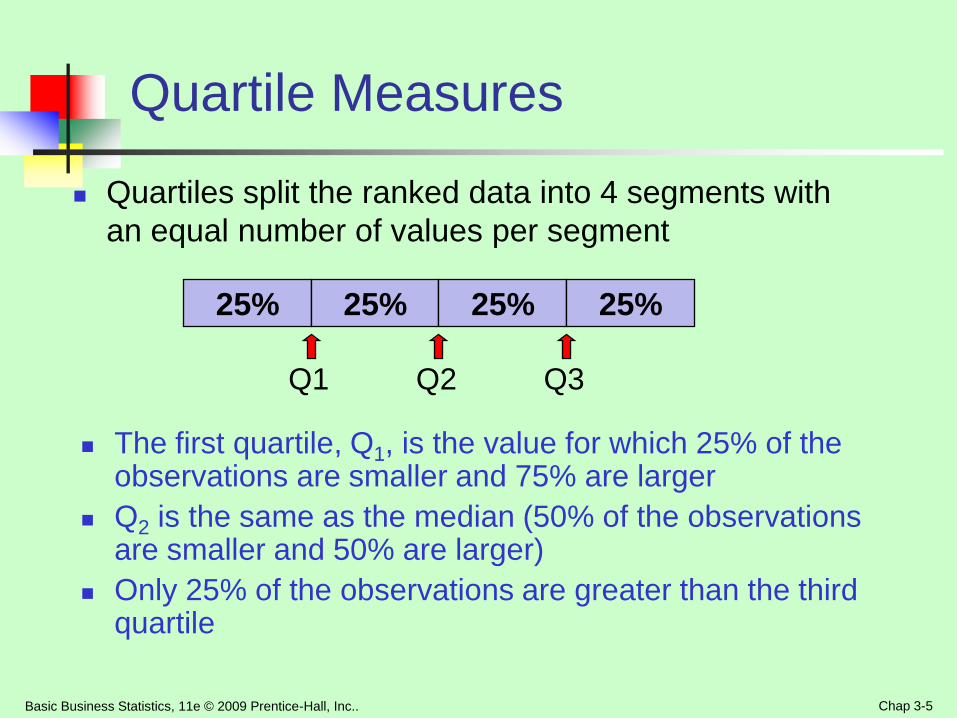
Quartile Measures
Quartiles split the ranked data into 4 segments with
an equal number of values per segment
25%
The first quartile, Q1, is the value for which 25% of the observations are smaller and 75% are larger
Q2 is the same as the median (50% of the observations are smaller and 50% are larger)
Only 25% of the observations are greater than the third quartile
Q1 Q2 Q3
25% 25% 25%
Basic Business Statistics, 11e © 2009 Prentice-Hall, Inc.. Chap 3-6
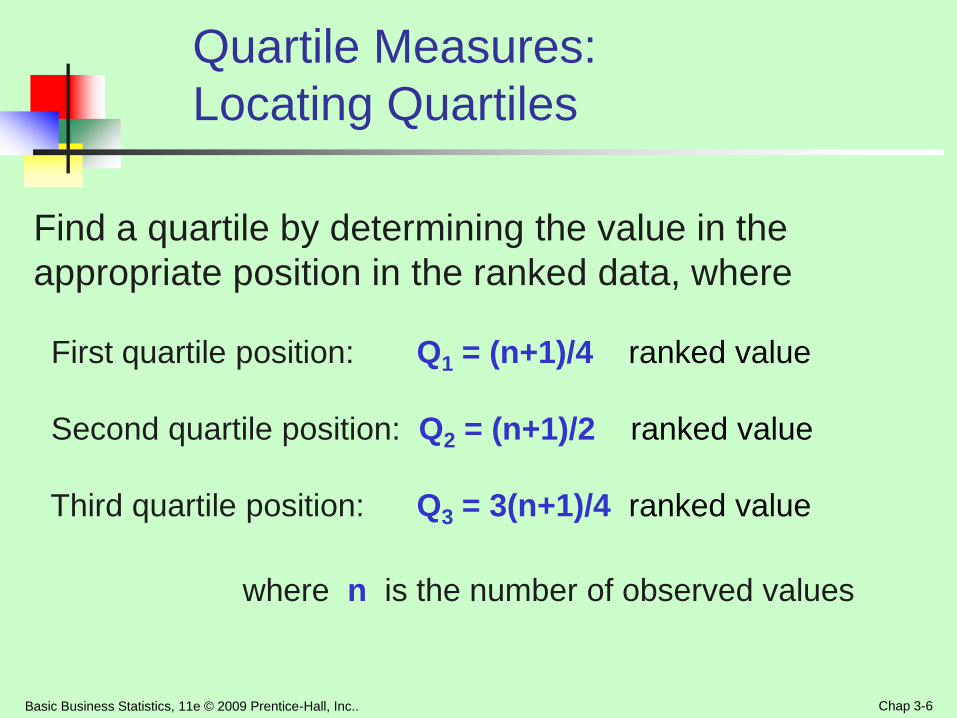
Quartile Measures:
Locating Quartiles
Find a quartile by determining the value in the
appropriate position in the ranked data, where
First quartile position: Q1 = (n+1)/4 ranked value
Second quartile position: Q2 = (n+1)/2 ranked value
Third quartile position: Q3 = 3(n+1)/4 ranked value
where n is the number of observed values
Basic Business Statistics, 11e © 2009 Prentice-Hall, Inc.. Chap 3-7
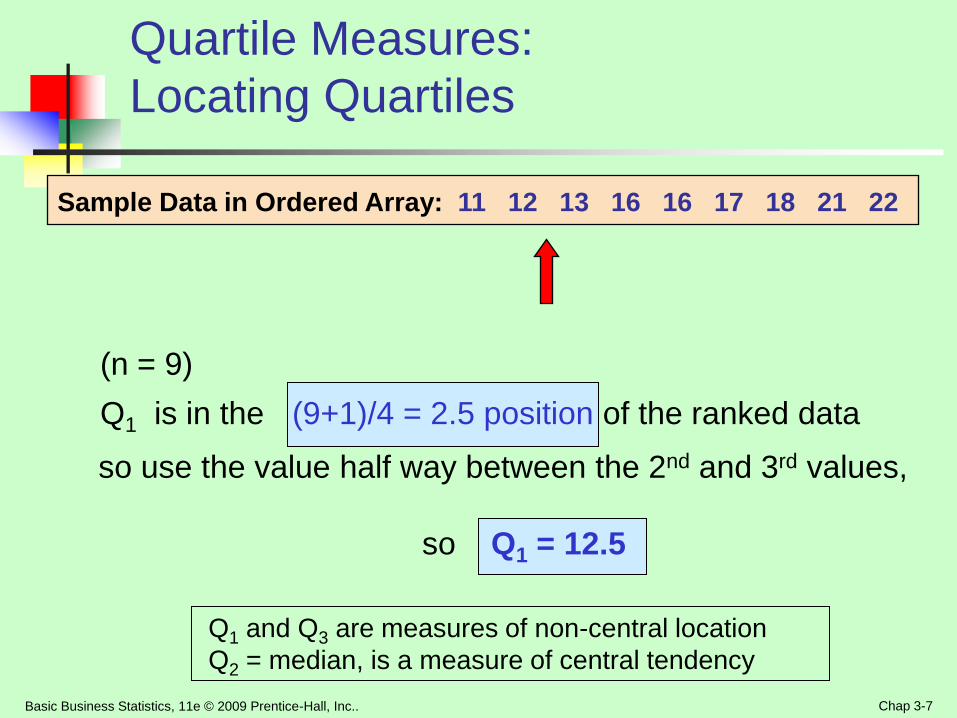
(n = 9)
Q1 is in the (9+1)/4 = 2.5 position of the ranked data
so use the value half way between the 2nd and 3rd values,
so Q1 = 12.5
Quartile Measures:
Locating Quartiles
Sample Data in Ordered Array: 11 12 13 16 16 17 18 21 22
Q1 and Q3 are measures of non-central location
Q2 = median, is a measure of central tendency
Basic Business Statistics, 11e © 2009 Prentice-Hall, Inc.. Chap 3-8
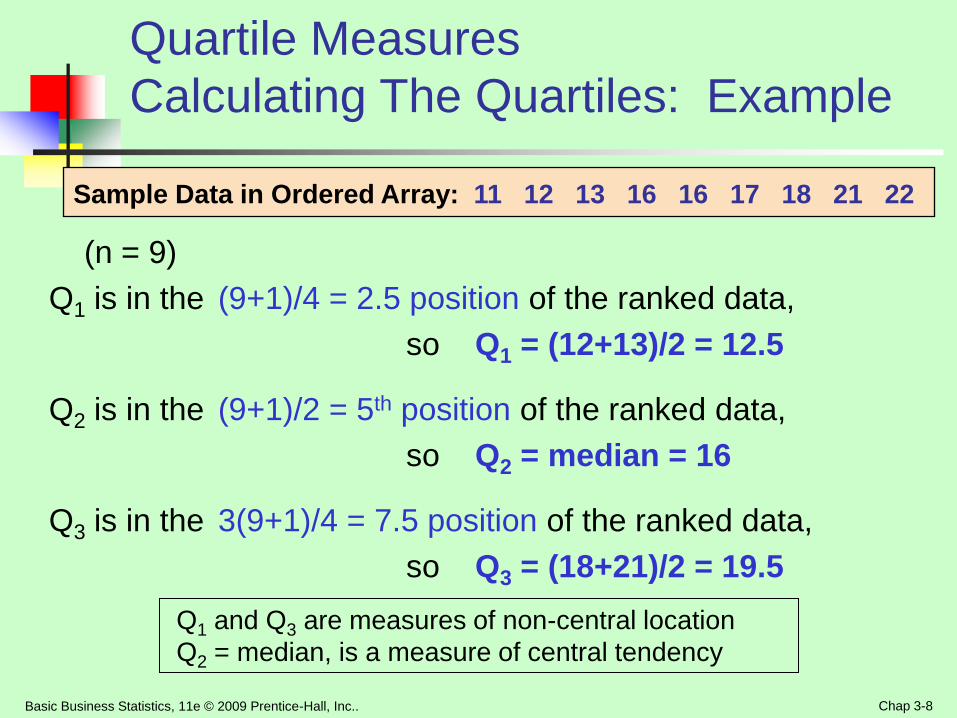
(n = 9)
Q1 is in the (9+1)/4 = 2.5 position of the ranked data,
so Q1 = (12+13)/2 = 12.5
Q2 is in the (9+1)/2 = 5th position of the ranked data,
so Q2 = median = 16
Q3 is in the 3(9+1)/4 = 7.5 position of the ranked data,
so Q3 = (18+21)/2 = 19.5
Quartile Measures
Calculating The Quartiles: Example
Sample Data in Ordered Array: 11 12 13 16 16 17 18 21 22
Q1 and Q3 are measures of non-central location
Q2 = median, is a measure of central tendency
Basic Business Statistics, 11e © 2009 Prentice-Hall, Inc.. Chap 3-9
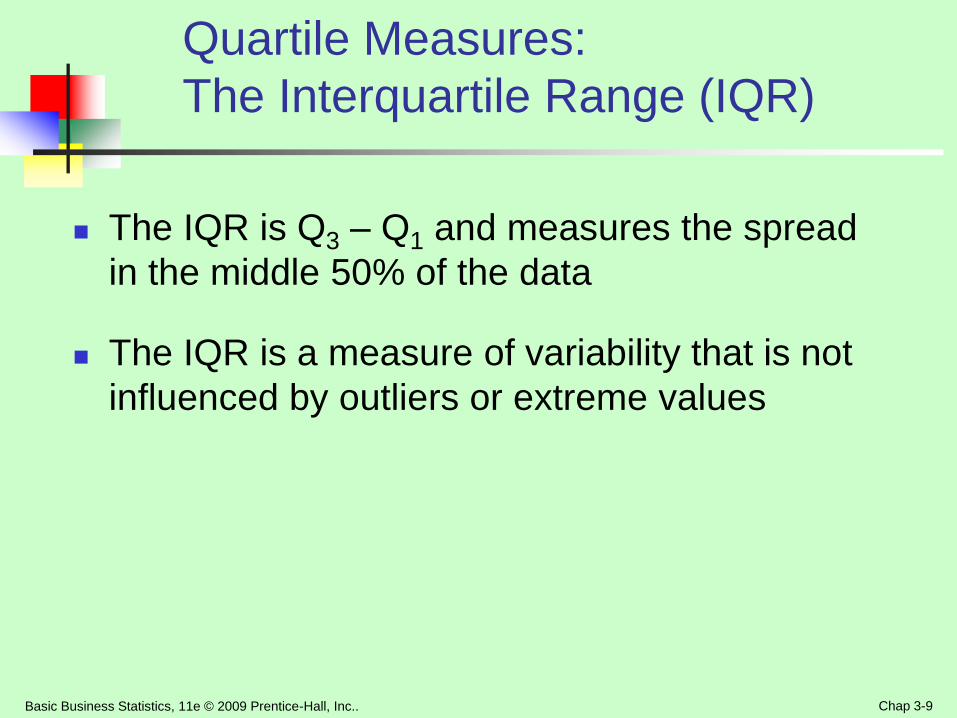
Quartile Measures:
The Interquartile Range (IQR)
The IQR is Q3 – Q1 and measures the spread
in the middle 50% of the data
The IQR is a measure of variability that is not
influenced by outliers or extreme values
Basic Business Statistics, 11e © 2009 Prentice-Hall, Inc.. Chap 3-10
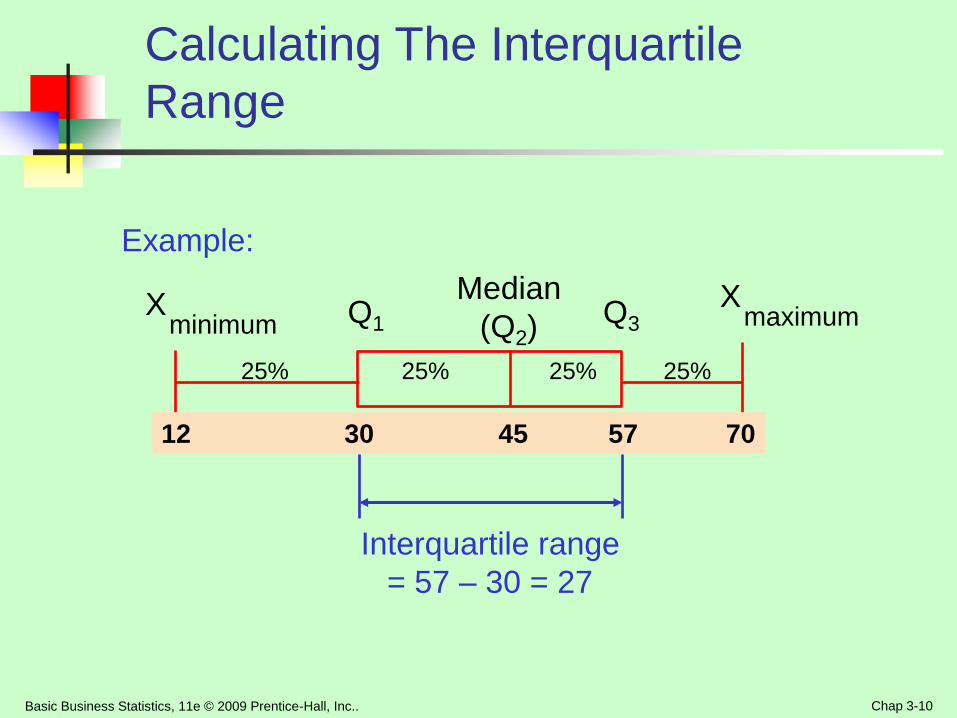
Calculating The Interquartile
Range
Median
(Q2) X
maximum X minimum Q1 Q3
Example:
25% 25% 25% 25%
12 30 45 57 70
Interquartile range
= 57 – 30 = 27
Basic Business Statistics, 11e © 2009 Prentice-Hall, Inc.. Chap 3-11
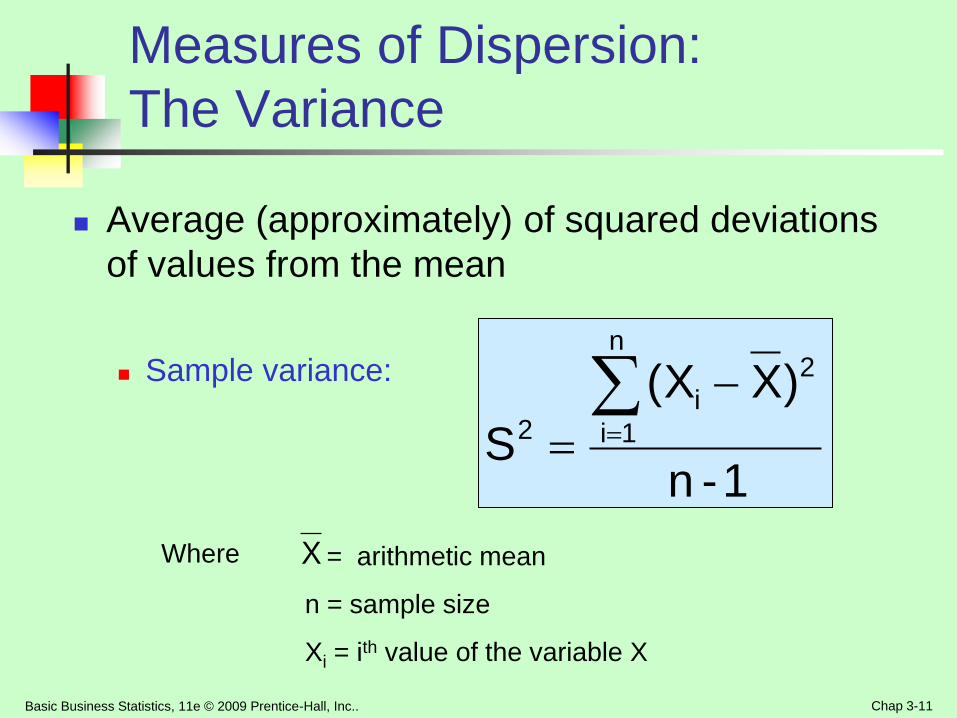
Average (approximately) of squared deviations
of values from the mean
Sample variance:
Measures of Dispersion:
The Variance
1-n
)X(X
S
n
1i
2
i2
Where = arithmetic mean
n = sample size
Xi = ith value of the variable X
X
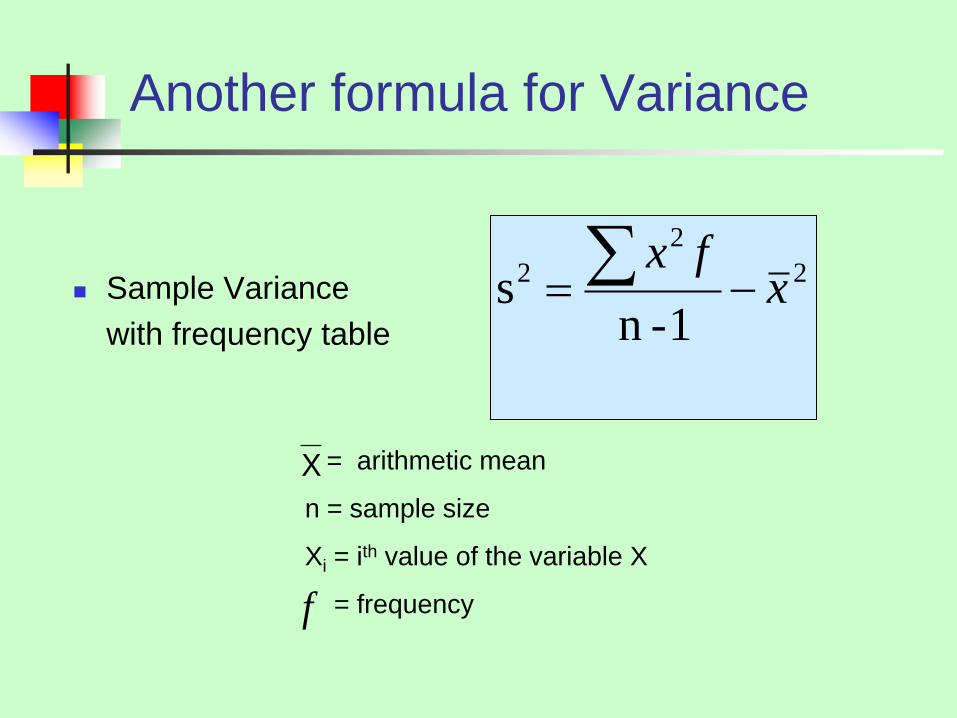
Another formula for Variance
Sample Variance
with frequency table
2
2
2
1-ns x
fx
= arithmetic mean
n = sample size
Xi = ith value of the variable X
= frequency
X
f
Basic Business Statistics, 11e © 2009 Prentice-Hall, Inc.. Chap 3-13
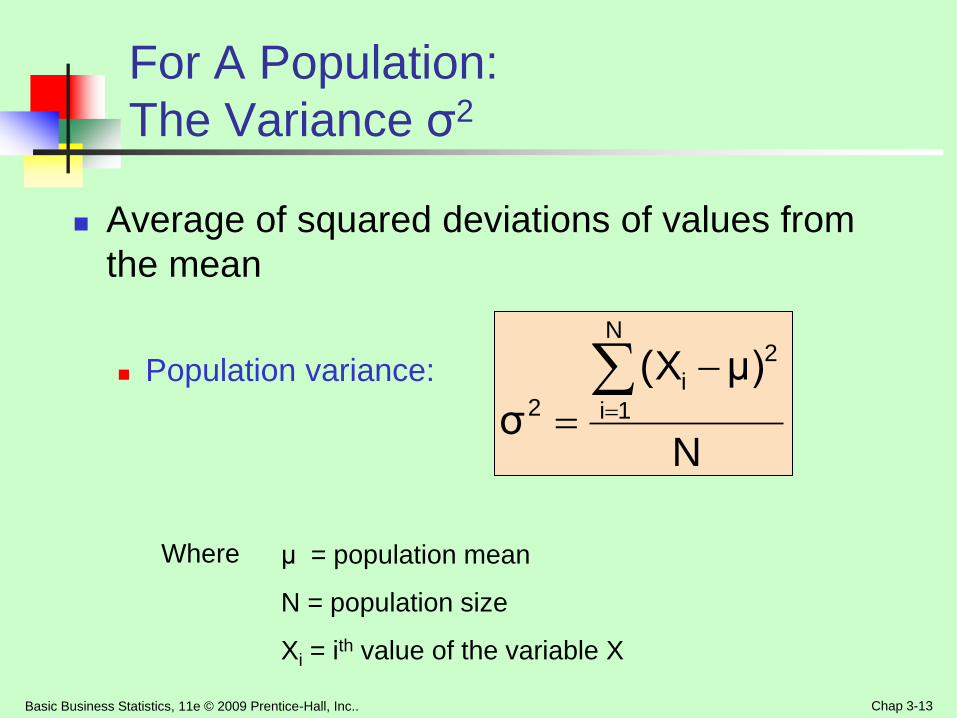
Average of squared deviations of values from
the mean
Population variance:
For A Population:
The Variance σ2
N
μ)(X
σ
N
1i
2
i2
Where μ = population mean
N = population size
Xi = ith value of the variable X
Basic Business Statistics, 11e © 2009 Prentice-Hall, Inc.. Chap 3-14
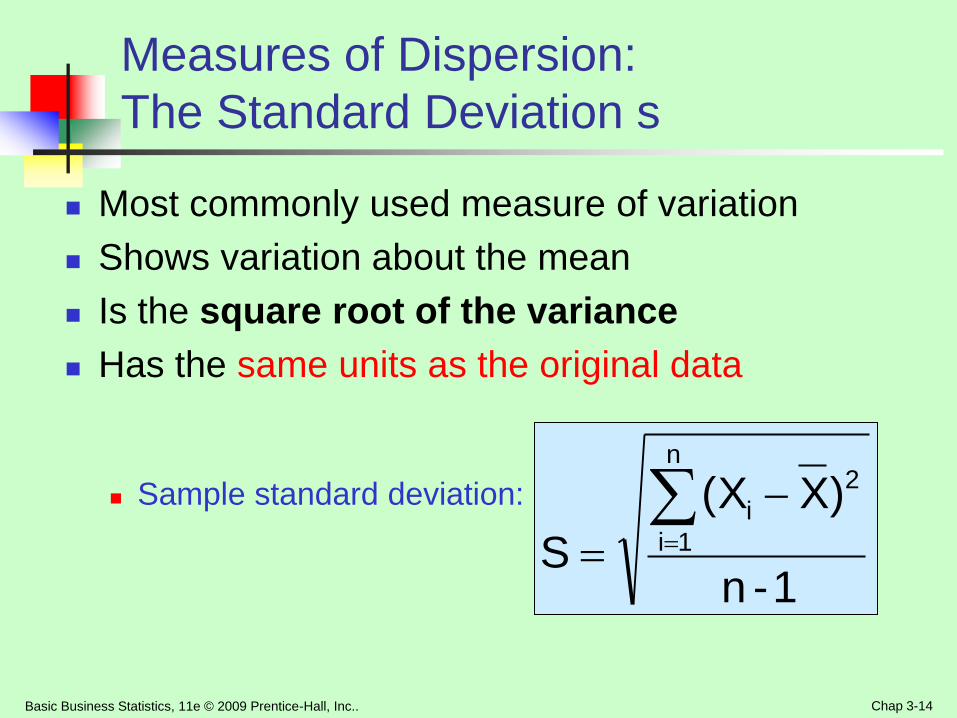
Measures of Dispersion:
The Standard Deviation s
Most commonly used measure of variation
Shows variation about the mean
Is the square root of the variance
Has the same units as the original data
Sample standard deviation:
1-n
)X(X
S
n
1i
2
i
Basic Business Statistics, 11e © 2009 Prentice-Hall, Inc.. Chap 3-15
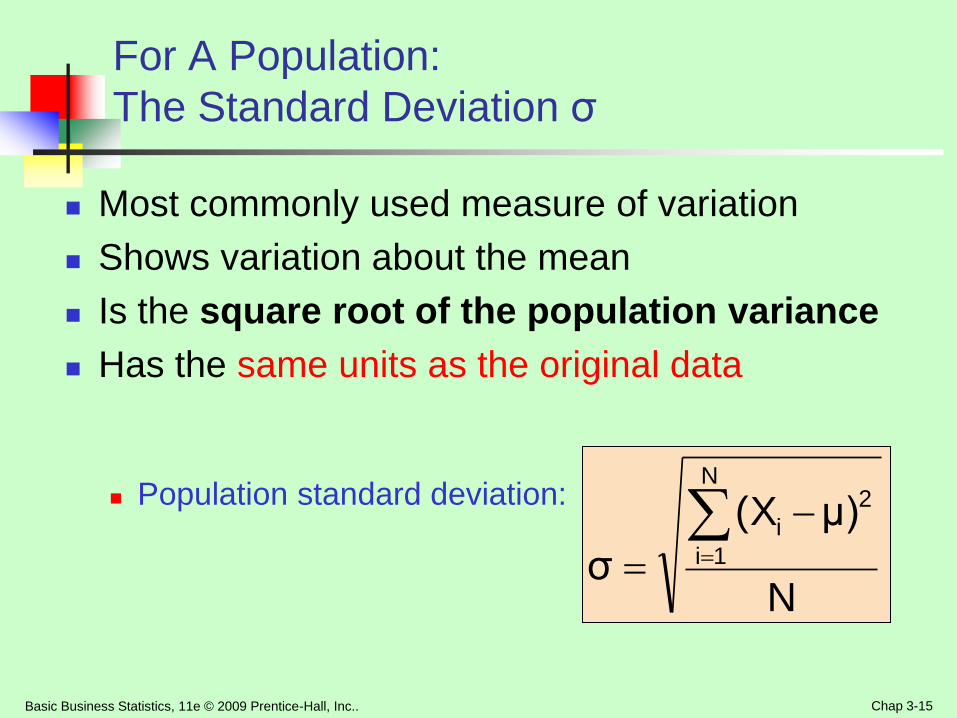
For A Population:
The Standard Deviation σ
Most commonly used measure of variation
Shows variation about the mean
Is the square root of the population variance
Has the same units as the original data
Population standard deviation:
N
μ)(X
σ
N
1i
2
i
Basic Business Statistics, 11e © 2009 Prentice-Hall, Inc.. Chap 3-16
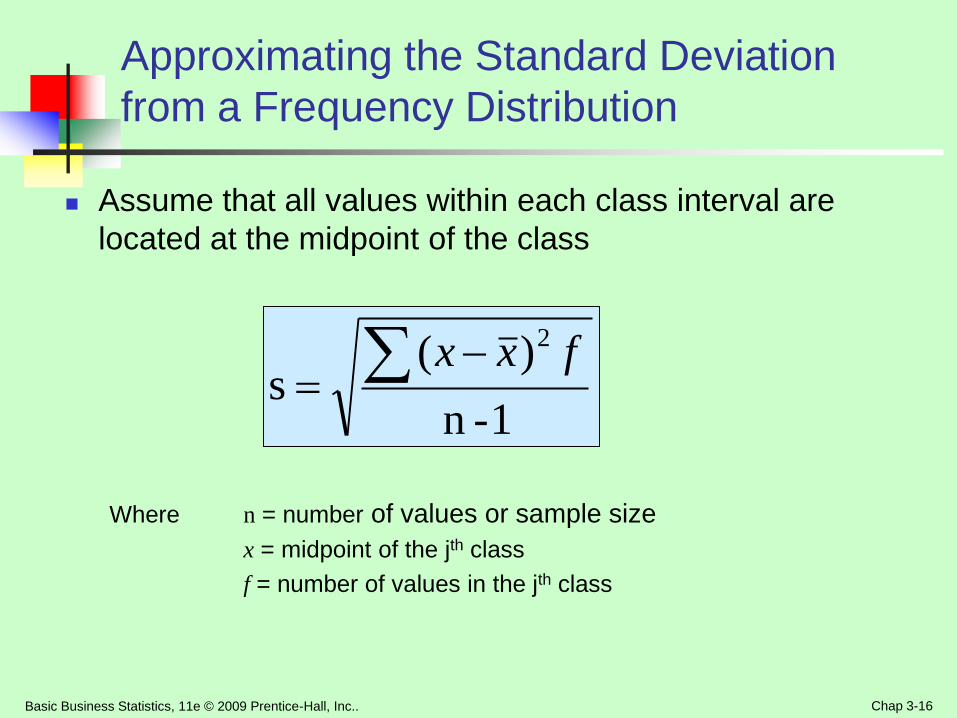
Approximating the Standard Deviation
from a Frequency Distribution
Assume that all values within each class interval are
located at the midpoint of the class
Where n = number of values or sample size
x = midpoint of the jth class
f = number of values in the jth class
1-n
)(s
2
fxx
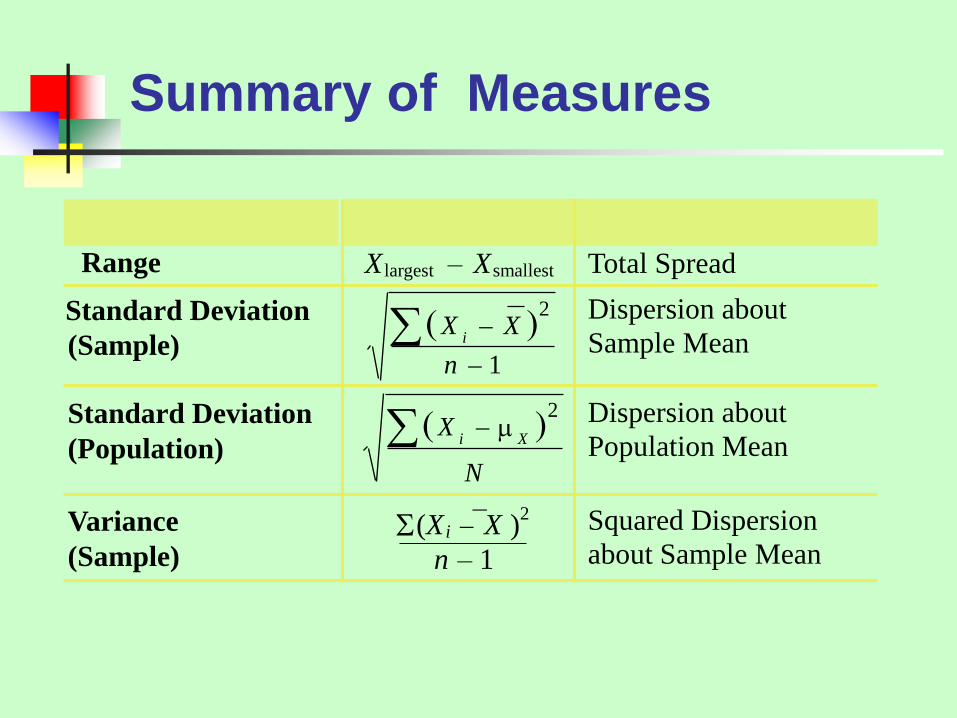
Summary of Measures
Range X largest – X smallest Total Spread
Standard Deviation
(Sample) X X
n
i
2
1
Dispersion about
Sample Mean
Standard Deviation
(Population) X
N
i X
2 Dispersion about
Population Mean
Variance
(Sample) ( X i X )
2
n – 1
Squared Dispersion
about Sample Mean
Basic Business Statistics, 11e © 2009 Prentice-Hall, Inc.. Chap 3-18
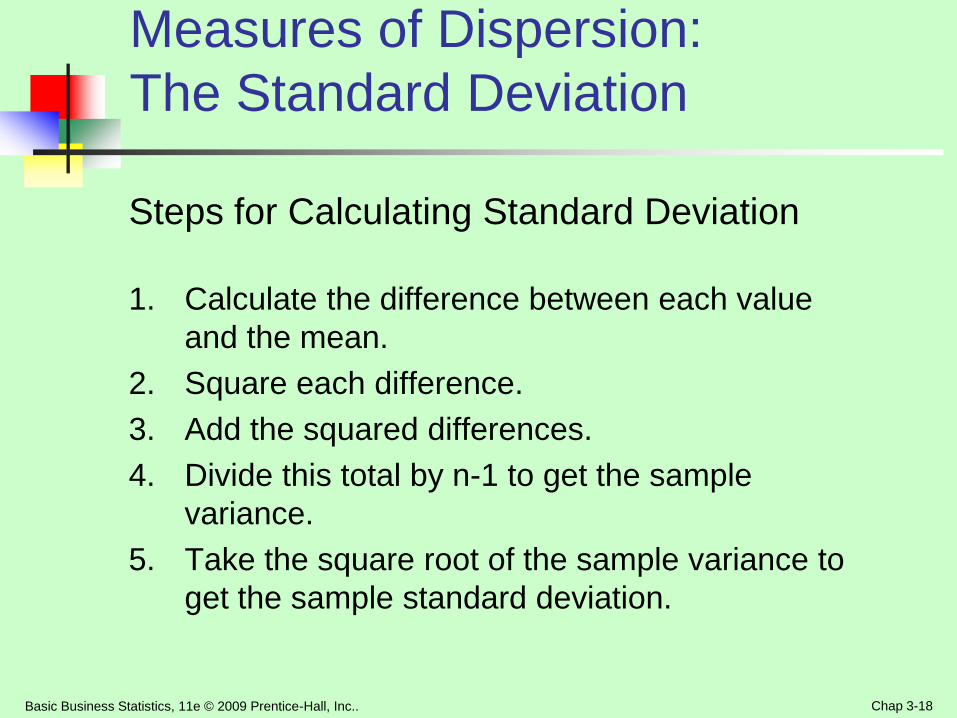
Measures of Dispersion:
The Standard Deviation
Steps for Calculating Standard Deviation
1. Calculate the difference between each value
and the mean.
2. Square each difference.
3. Add the squared differences.
4. Divide this total by n-1 to get the sample
variance.
5. Take the square root of the sample variance to
get the sample standard deviation.
Basic Business Statistics, 11e © 2009 Prentice-Hall, Inc.. Chap 3-19
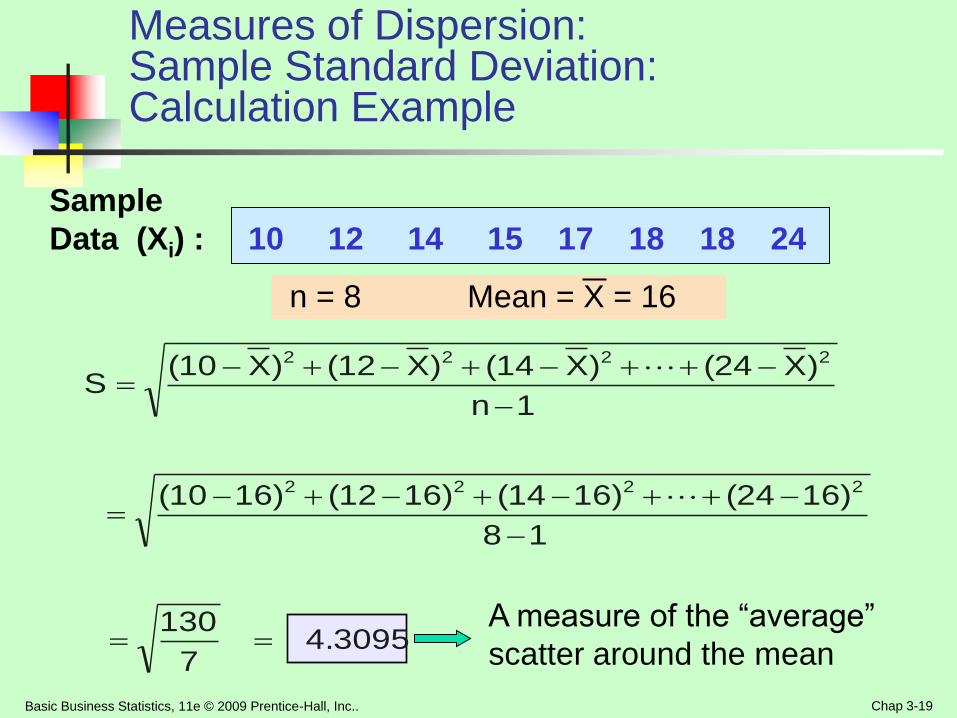
Measures of Dispersion: Sample Standard Deviation: Calculation Example
Sample
Data (Xi) : 10 12 14 15 17 18 18 24
n = 8 Mean = X = 16
4.30957
130
18
16)(2416)(1416)(1216)(10
1n
)X(24)X(14)X(12)X(10S
2222
2222
A measure of the “average”
scatter around the mean
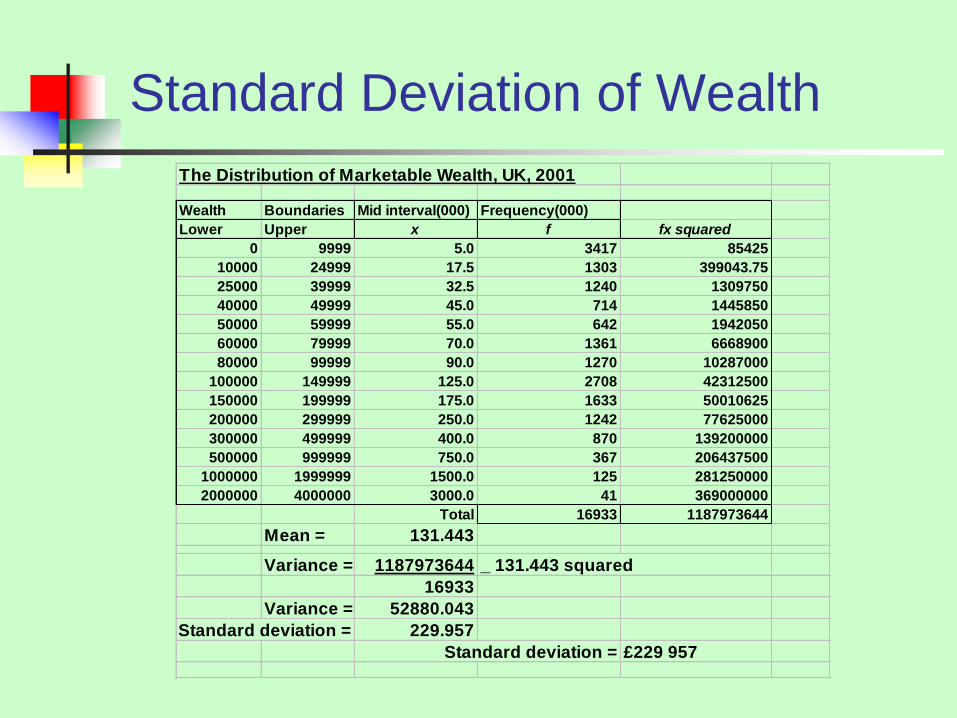
Standard Deviation of Wealth
The Distribution of Marketable Wealth, UK, 2001
Wealth Boundaries Mid interval(000) Frequency(000)
Lower Upper x f fx squared
0 9999 5.0 3417 85425
10000 24999 17.5 1303 399043.75
25000 39999 32.5 1240 1309750
40000 49999 45.0 714 1445850
50000 59999 55.0 642 1942050
60000 79999 70.0 1361 6668900
80000 99999 90.0 1270 10287000
100000 149999 125.0 2708 42312500
150000 199999 175.0 1633 50010625
200000 299999 250.0 1242 77625000
300000 499999 400.0 870 139200000
500000 999999 750.0 367 206437500
1000000 1999999 1500.0 125 281250000
2000000 4000000 3000.0 41 369000000
Total 16933 1187973644
Mean = 131.443
Variance = 1187973644 _ 131.443 squared
16933
Variance = 52880.043
Standard deviation = 229.957
Standard deviation = £229 957
Basic Business Statistics, 11e © 2009 Prentice-Hall, Inc.. Chap 3-21
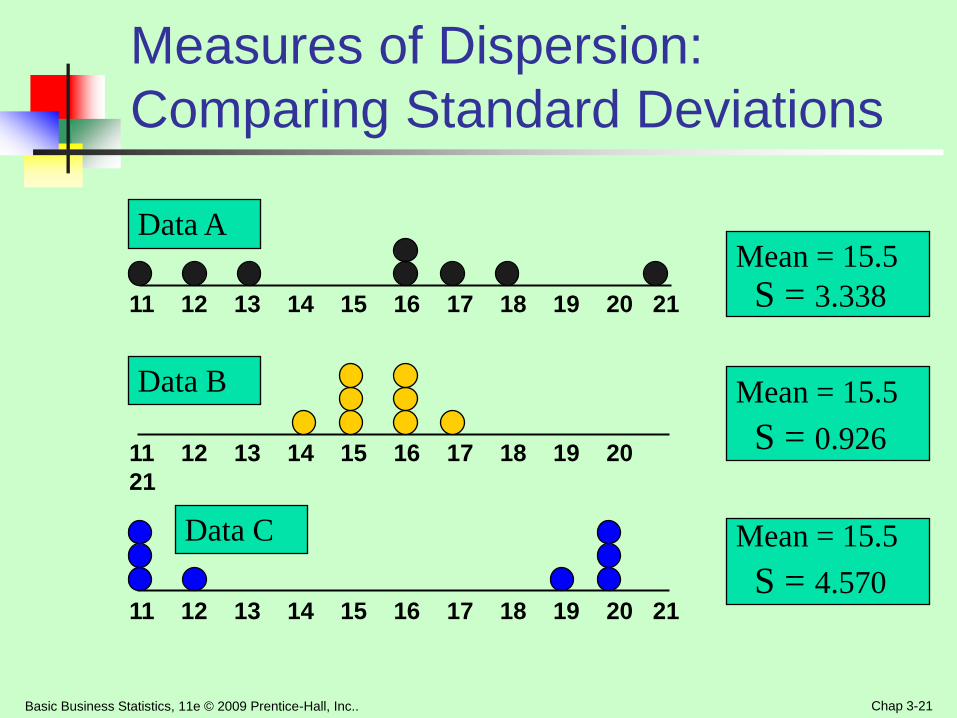
Measures of Dispersion:
Comparing Standard Deviations
Mean = 15.5
S = 3.338 11 12 13 14 15 16 17 18 19 20 21
11 12 13 14 15 16 17 18 19 20
21
Data B
Data A
Mean = 15.5
S = 0.926
11 12 13 14 15 16 17 18 19 20 21
Mean = 15.5
S = 4.570
Data C
Basic Business Statistics, 11e © 2009 Prentice-Hall, Inc.. Chap 3-22
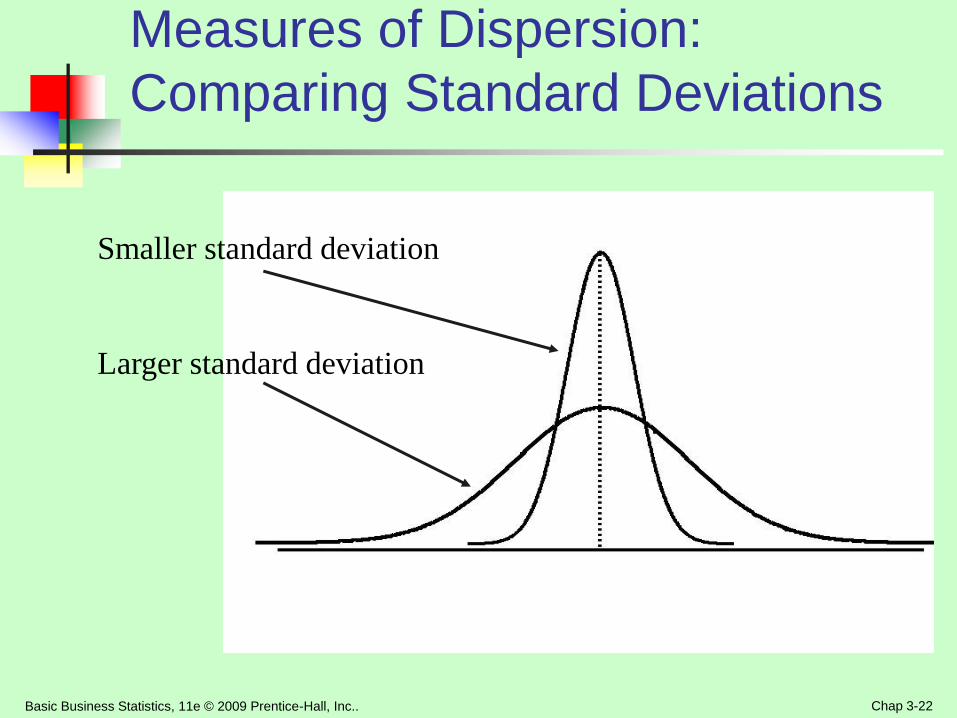
Measures of Dispersion:
Comparing Standard Deviations
Smaller standard deviation
Larger standard deviation
Basic Business Statistics, 11e © 2009 Prentice-Hall, Inc.. Chap 3-23
Measures of Dispersion:
Summary Characteristics
The more the data are spread out, the greater the
range, variance, and standard deviation.
The less the data are spread out, the smaller the
range, variance, and standard deviation.
If the values are all the same (no variation), all these
measures will be zero.
None of these measures are ever negative.
Basic Business Statistics, 11e © 2009 Prentice-Hall, Inc.. Chap 3-24
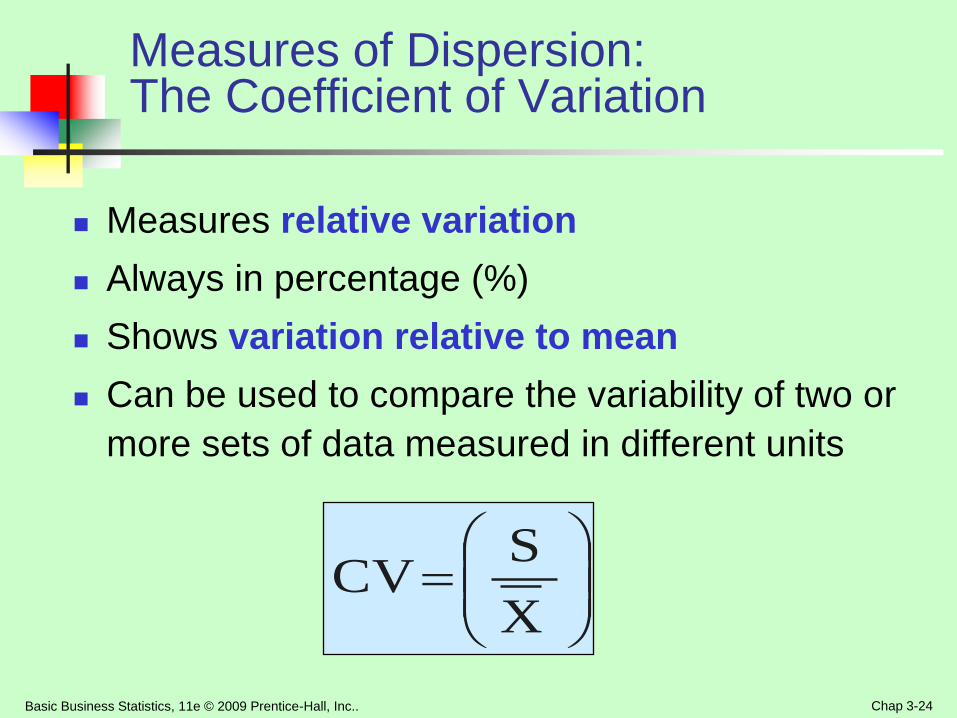
Measures of Dispersion: The Coefficient of Variation
Measures relative variation
Always in percentage (%)
Shows variation relative to mean
Can be used to compare the variability of two or
more sets of data measured in different units
X
SCV
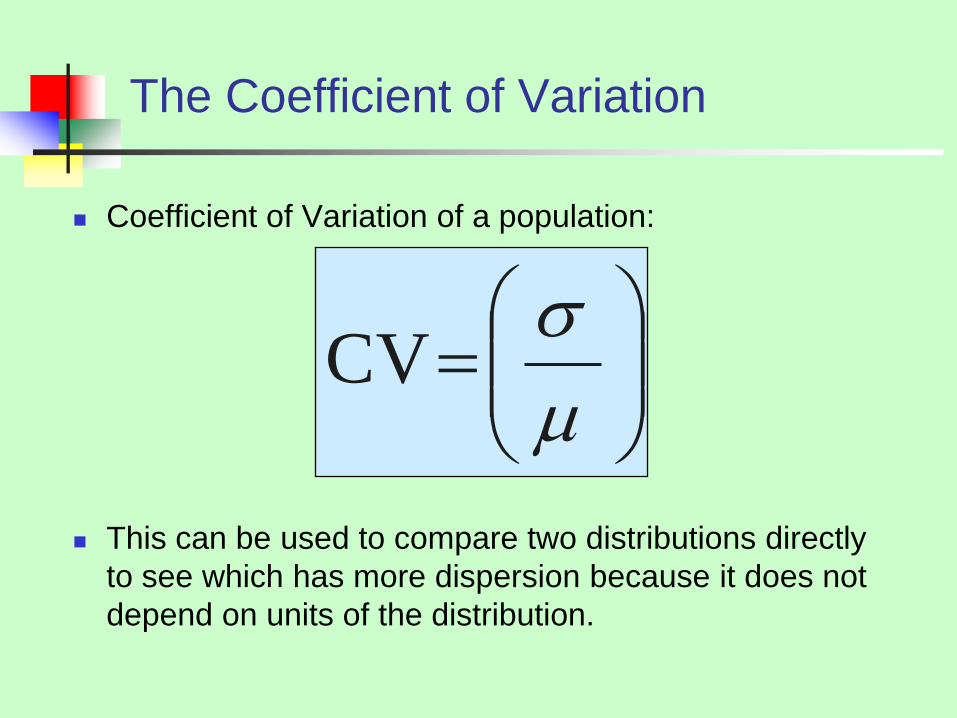
The Coefficient of Variation
Coefficient of Variation of a population:
This can be used to compare two distributions directly
to see which has more dispersion because it does not
depend on units of the distribution.
CV
Basic Business Statistics, 11e © 2009 Prentice-Hall, Inc.. Chap 3-26
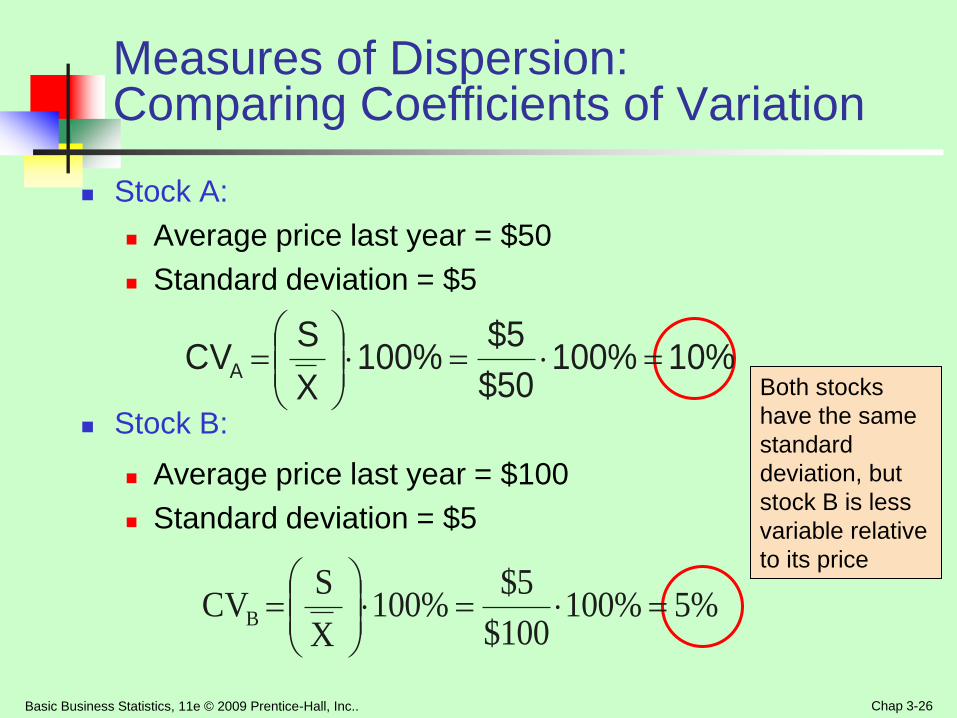
Measures of Dispersion: Comparing Coefficients of Variation
Stock A:
Average price last year = $50
Standard deviation = $5
Stock B:
Average price last year = $100
Standard deviation = $5
Both stocks
have the same
standard
deviation, but
stock B is less
variable relative
to its price
10%100%$50
$5100%
X
SCVA
5%100%$100
$5100%
X
SCVB
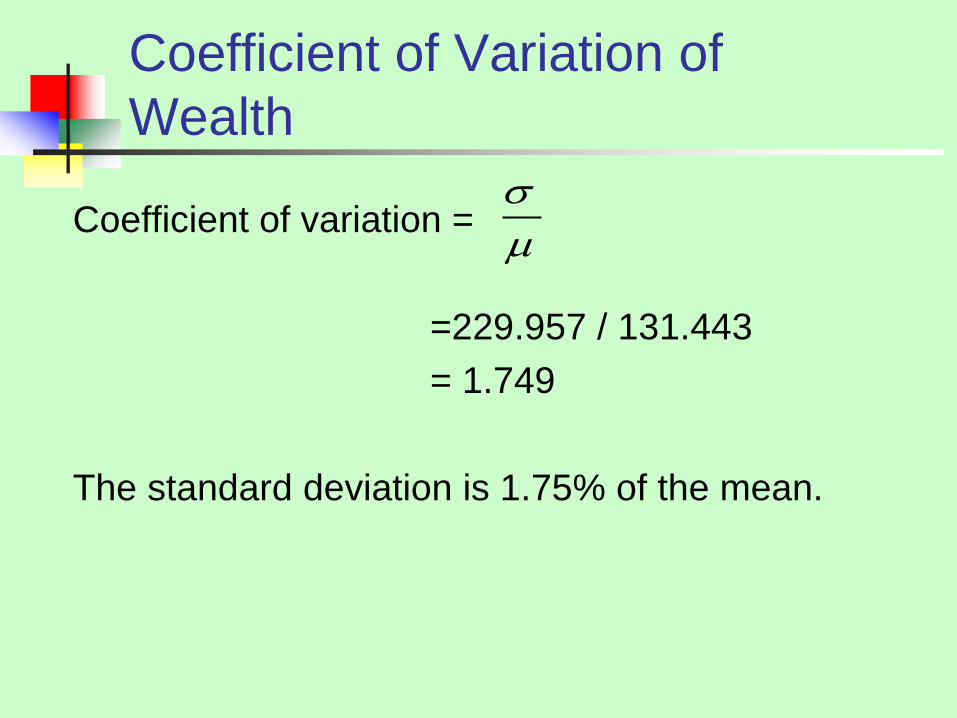
Coefficient of Variation of
Wealth
Coefficient of variation =
=229.957 / 131.443
= 1.749
The standard deviation is 1.75% of the mean.
Chap 3-28
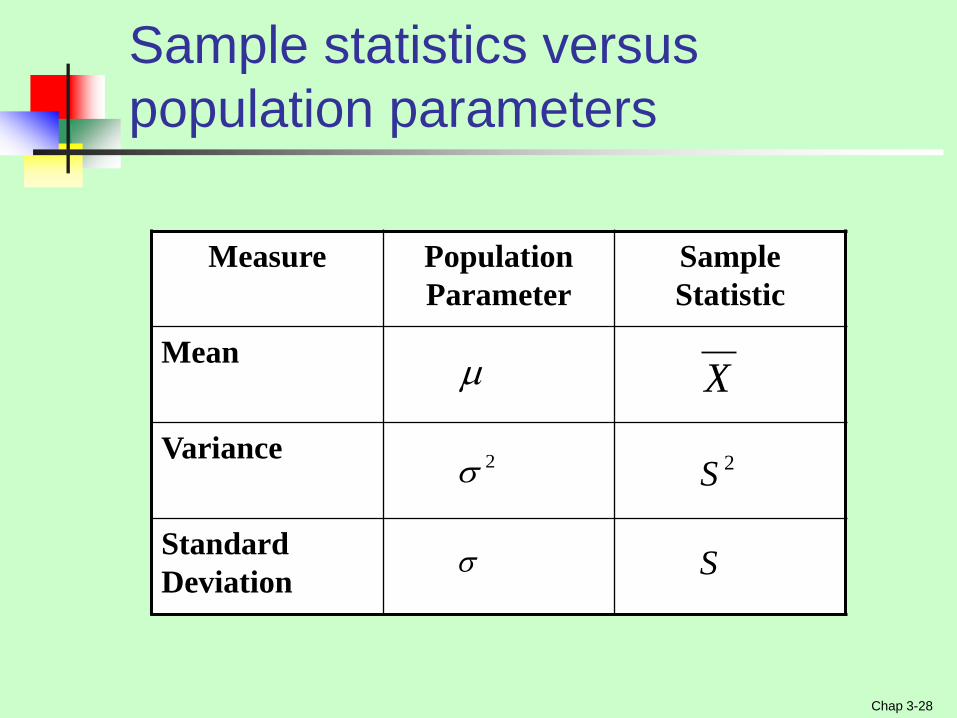
Sample statistics versus
population parameters
Measure Population
Parameter
Sample
Statistic
Mean
Variance
Standard
Deviation
X
2S
S
2

End of the Chapter
Basic Business Statistics, 11e © 2009 Prentice-Hall, Inc.. Chap 3-29