chapter 4 population and water demand projections
TRANSCRIPT

Chapter 4 Population and Water Demand Projections
Water for Texas 2007
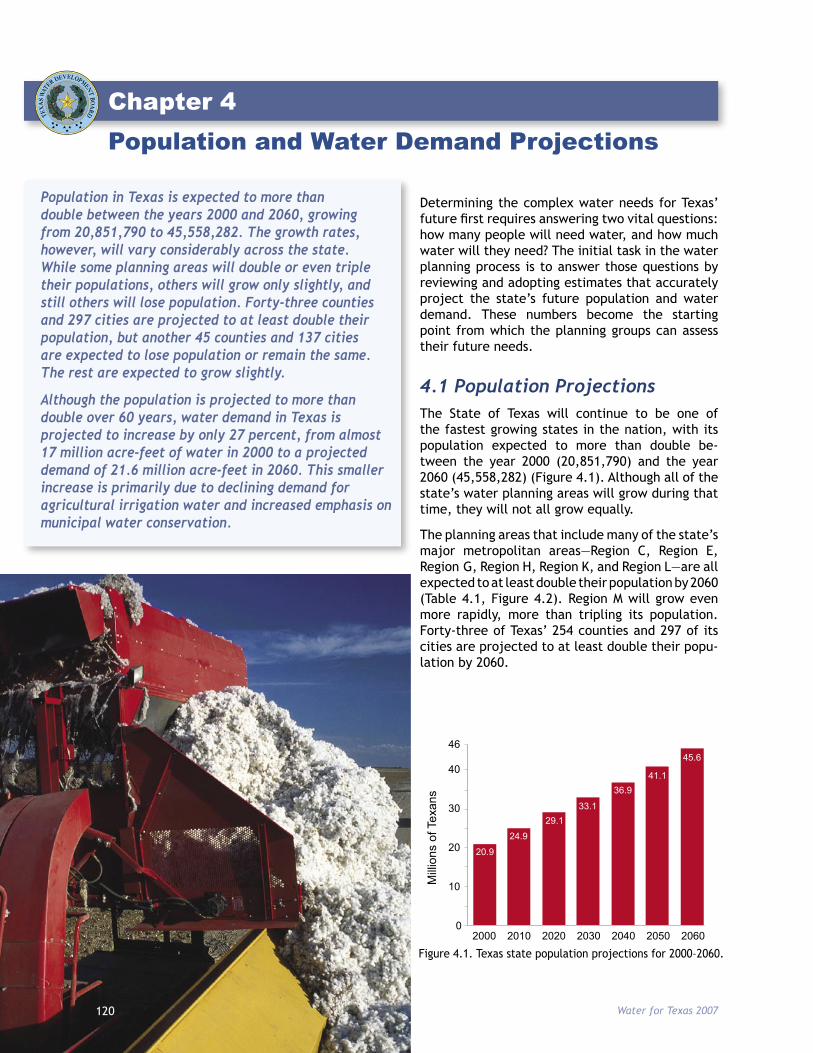
Population in Texas is expected to more than double between the years 2000 and 2060, growing from 20,851,790 to 45,558,282. The growth rates, however, will vary considerably across the state. While some planning areas will double or even triple their populations, others will grow only slightly, and still others will lose population. Forty-three counties and 297 cities are projected to at least double their population, but another 45 counties and 137 cities are expected to lose population or remain the same. The rest are expected to grow slightly.
Although the population is projected to more than double over 60 years, water demand in Texas is projected to increase by only 27 percent, from almost 17 million acre-feet of water in 2000 to a projected demand of 21.6 million acre-feet in 2060. This smaller increase is primarily due to declining demand for agricultural irrigation water and increased emphasis on municipal water conservation.
Chapter 4 Population and Water Demand Projections
0
10
20
30
40
46
2010 2020 20602050204020302000
Mill
ions
of T
exan
s
20.9
24.9
29.133.1
36.941.1
45.6
Figure 4.1. Texas state population projections for 2000–2060.
Determining the complex water needs for Texas’ future first requires answering two vital questions: how many people will need water, and how much water will they need? The initial task in the water planning process is to answer those questions by reviewing and adopting estimates that accurately project the state’s future population and water demand. These numbers become the starting point from which the planning groups can assess their future needs.
4.1 Population ProjectionsThe State of Texas will continue to be one of the fastest growing states in the nation, with its population expected to more than double be-tween the year 2000 (20,851,790) and the year 2060 (45,558,282) (Figure 4.1). Although all of the state’s water planning areas will grow during that time, they will not all grow equally.
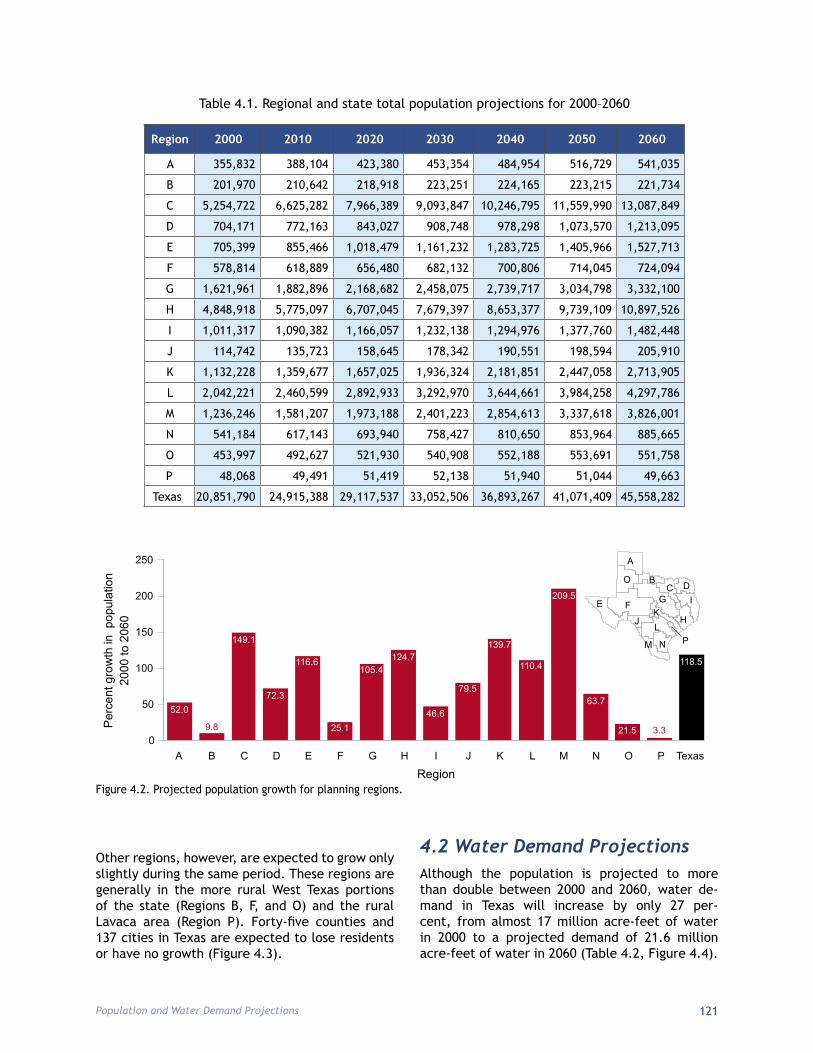
The planning areas that include many of the state’s major metropolitan areas—Region C, Region E, Region G, Region H, Region K, and Region L—are all expected to at least double their population by 2060 (Table 4.1, Figure 4.2). Region M will grow even more rapidly, more than tripling its population. Forty-three of Texas’ 254 counties and 297 of its cities are projected to at least double their popu-lation by 2060.
120
Population and Water Demand Projections 121
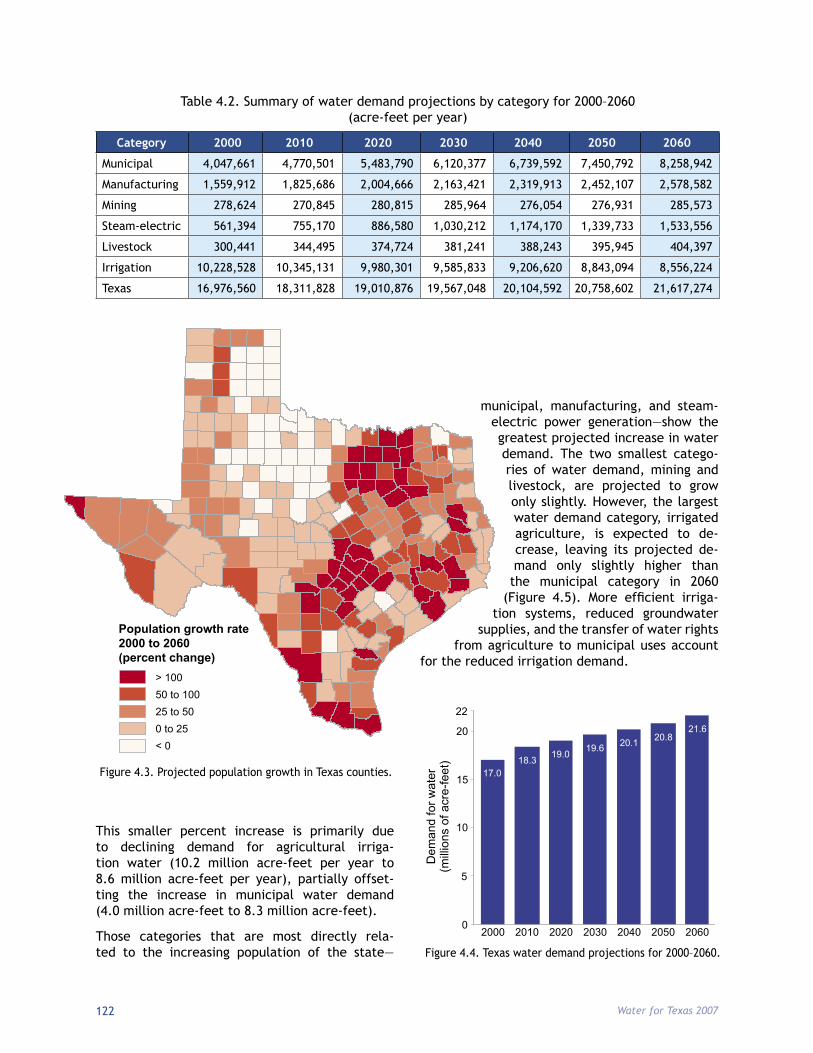
Other regions, however, are expected to grow only slightly during the same period. These regions are generally in the more rural West Texas portions of the state (Regions B, F, and O) and the rural Lavaca area (Region P). Forty-five counties and 137 cities in Texas are expected to lose residents or have no growth (Figure 4.3).
4.2 Water Demand ProjectionsAlthough the population is projected to more than double between 2000 and 2060, water de-mand in Texas will increase by only 27 per- cent, from almost 17 million acre-feet of water in 2000 to a projected demand of 21.6 million acre-feet of water in 2060 (Table 4.2, Figure 4.4).
Table 4.1. Regional and state total population projections for 2000–2060
Region 2000 2010 2020 2030 2040 2050 2060
A 355,832 388,104 423,380 453,354 484,954 516,729 541,035
B 201,970 210,642 218,918 223,251 224,165 223,215 221,734
C 5,254,722 6,625,282 7,966,389 9,093,847 10,246,795 11,559,990 13,087,849
D 704,171 772,163 843,027 908,748 978,298 1,073,570 1,213,095
E 705,399 855,466 1,018,479 1,161,232 1,283,725 1,405,966 1,527,713
F 578,814 618,889 656,480 682,132 700,806 714,045 724,094
G 1,621,961 1,882,896 2,168,682 2,458,075 2,739,717 3,034,798 3,332,100
H 4,848,918 5,775,097 6,707,045 7,679,397 8,653,377 9,739,109 10,897,526
I 1,011,317 1,090,382 1,166,057 1,232,138 1,294,976 1,377,760 1,482,448
J 114,742 135,723 158,645 178,342 190,551 198,594 205,910
K 1,132,228 1,359,677 1,657,025 1,936,324 2,181,851 2,447,058 2,713,905
L 2,042,221 2,460,599 2,892,933 3,292,970 3,644,661 3,984,258 4,297,786
M 1,236,246 1,581,207 1,973,188 2,401,223 2,854,613 3,337,618 3,826,001
N 541,184 617,143 693,940 758,427 810,650 853,964 885,665
O 453,997 492,627 521,930 540,908 552,188 553,691 551,758
P 48,068 49,491 51,419 52,138 51,940 51,044 49,663
Texas 20,851,790 24,915,388 29,117,537 33,052,506 36,893,267 41,071,409 45,558,282
52.0
9.8
149.1
72.3
116.6
25.1
105.4124.7
46.6
79.5
139.7
110.4
209.5
63.7
21.5 3.3
118.5
0
50
100
150
200
250
A B C D E F G H I J K L M N O P Texas
Per
cent
gro
wth
in p
opul
atio
n20
00 to
206
0
A
BC
E F
DG
H
I
JKL
N
O
PM
Region
21.5
Figure 4.2. Projected population growth for planning regions.
Water for Texas 2007122
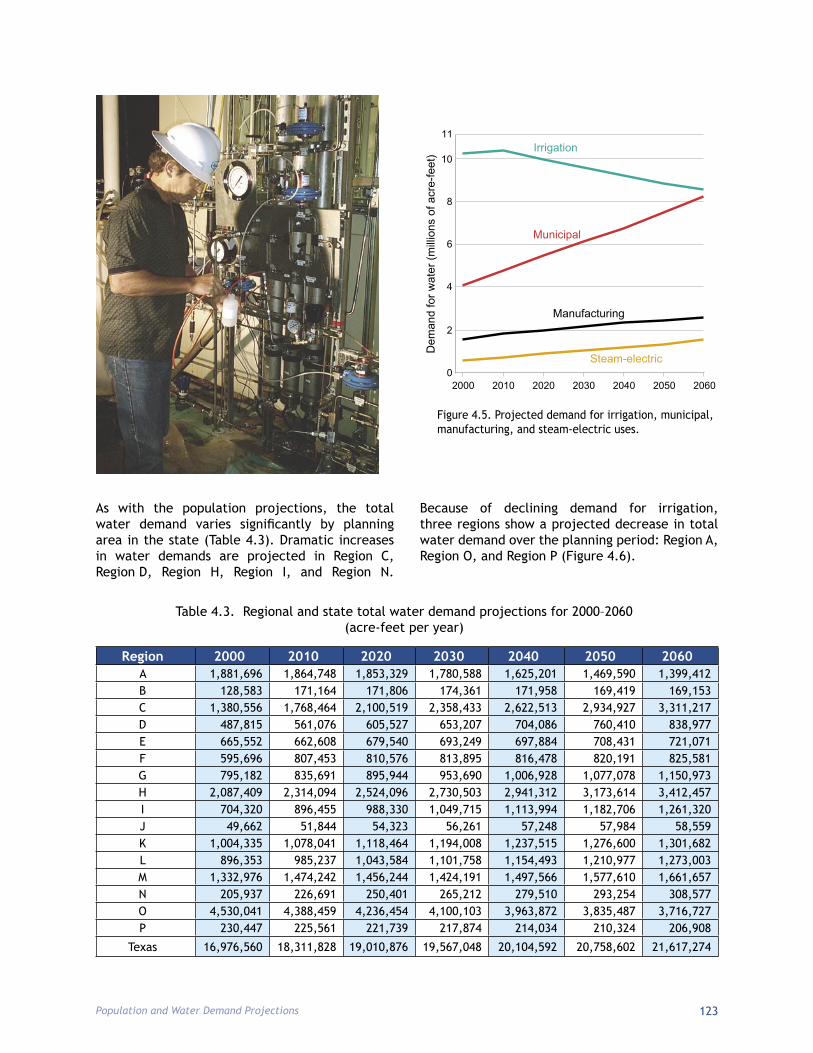
municipal, manufacturing, and steam- electric power generation—show the greatest projected increase in water demand. The two smallest catego-ries of water demand, mining and livestock, are projected to grow only slightly. However, the largest water demand category, irrigated agriculture, is expected to de- crease, leaving its projected de- mand only slightly higher than the municipal category in 2060
(Figure 4.5). More efficient irriga-tion systems, reduced groundwater
supplies, and the transfer of water rights from agriculture to municipal uses account
for the reduced irrigation demand.
Table 4.2. Summary of water demand projections by category for 2000–2060 (acre-feet per year)
Category 2000 2010 2020 2030 2040 2050 2060
Municipal 4,047,661 4,770,501 5,483,790 6,120,377 6,739,592 7,450,792 8,258,942
Manufacturing 1,559,912 1,825,686 2,004,666 2,163,421 2,319,913 2,452,107 2,578,582
Mining 278,624 270,845 280,815 285,964 276,054 276,931 285,573
Steam-electric 561,394 755,170 886,580 1,030,212 1,174,170 1,339,733 1,533,556
Livestock 300,441 344,495 374,724 381,241 388,243 395,945 404,397
Irrigation 10,228,528 10,345,131 9,980,301 9,585,833 9,206,620 8,843,094 8,556,224
Texas 16,976,560 18,311,828 19,010,876 19,567,048 20,104,592 20,758,602 21,617,274
Figure 4.3. Projected population growth in Texas counties.
This smaller percent increase is primarily due to declining demand for agricultural irriga-tion water (10.2 million acre-feet per year to 8.6 million acre-feet per year), partially offset-ting the increase in municipal water demand (4.0 million acre-feet to 8.3 million acre-feet).
Those categories that are most directly rela-ted to the increasing population of the state—
17.018.3 19.0 19.6 20.1 20.8
21.6
2010 2020 206020502040203020000
5
15
20
22
Dem
and
for w
ater
(mill
ions
of a
cre-
feet
)
10
Figure 4.4. Texas water demand projections for 2000–2060.
Population growth rate2000 to 2060(percent change)
< 0
50 to 10025 to 500 to 25
> 100
Population and Water Demand Projections 123
2000 2010 2020 2030 2040 2050 20600
2
4
6
8
10
Dem
and
for w
ater
(mill
ions
of a
cre-
feet
)
11Irrigation
Municipal
Manufacturing
Steam-electric
Figure 4.5. Projected demand for irrigation, municipal, manufacturing, and steam-electric uses.
Table 4.3. Regional and state total water demand projections for 2000–2060 (acre-feet per year)
Region 2000 2010 2020 2030 2040 2050 2060
A 1,881,696 1,864,748 1,853,329 1,780,588 1,625,201 1,469,590 1,399,412B 128,583 171,164 171,806 174,361 171,958 169,419 169,153C 1,380,556 1,768,464 2,100,519 2,358,433 2,622,513 2,934,927 3,311,217D 487,815 561,076 605,527 653,207 704,086 760,410 838,977E 665,552 662,608 679,540 693,249 697,884 708,431 721,071F 595,696 807,453 810,576 813,895 816,478 820,191 825,581G 795,182 835,691 895,944 953,690 1,006,928 1,077,078 1,150,973H 2,087,409 2,314,094 2,524,096 2,730,503 2,941,312 3,173,614 3,412,457I 704,320 896,455 988,330 1,049,715 1,113,994 1,182,706 1,261,320J 49,662 51,844 54,323 56,261 57,248 57,984 58,559K 1,004,335 1,078,041 1,118,464 1,194,008 1,237,515 1,276,600 1,301,682L 896,353 985,237 1,043,584 1,101,758 1,154,493 1,210,977 1,273,003M 1,332,976 1,474,242 1,456,244 1,424,191 1,497,566 1,577,610 1,661,657N 205,937 226,691 250,401 265,212 279,510 293,254 308,577O 4,530,041 4,388,459 4,236,454 4,100,103 3,963,872 3,835,487 3,716,727P 230,447 225,561 221,739 217,874 214,034 210,324 206,908
Texas 16,976,560 18,311,828 19,010,876 19,567,048 20,104,592 20,758,602 21,617,274
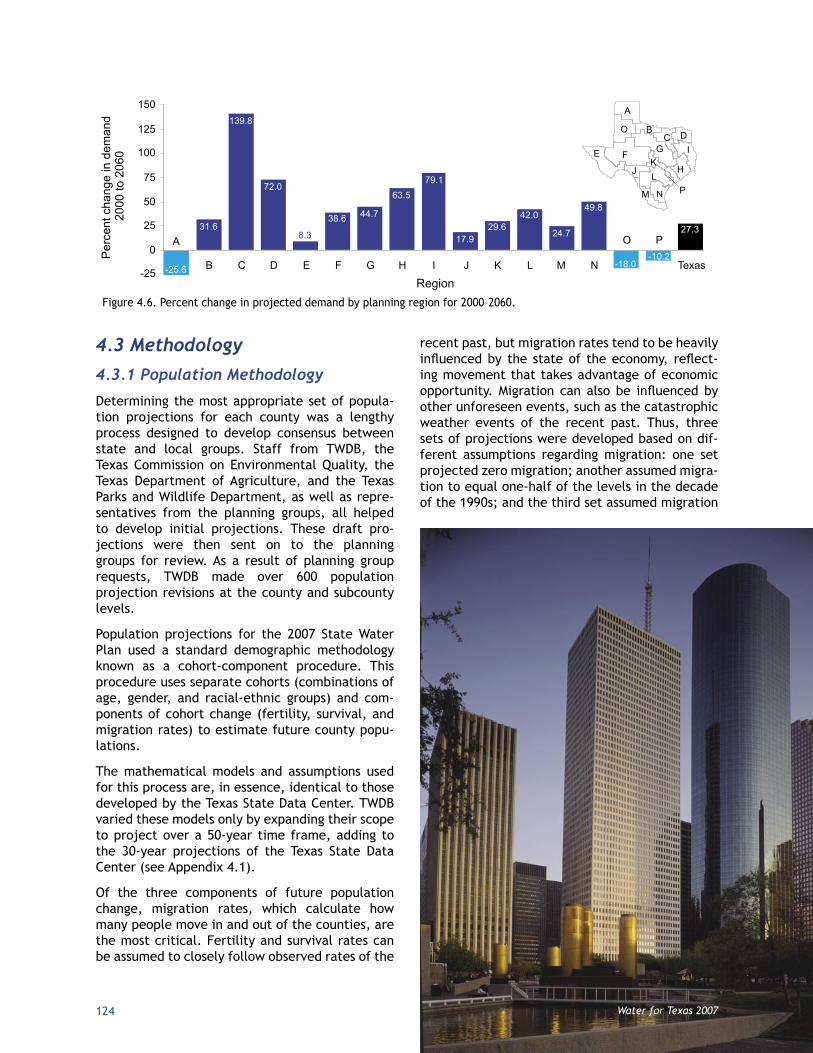
As with the population projections, the total water demand varies significantly by planning area in the state (Table 4.3). Dramatic increases in water demands are projected in Region C, Region D, Region H, Region I, and Region N.
Because of declining demand for irrigation, three regions show a projected decrease in total water demand over the planning period: Region A, Region O, and Region P (Figure 4.6).
4.3 Methodology4.3.1 Population Methodology
Determining the most appropriate set of popula-tion projections for each county was a lengthy process designed to develop consensus between state and local groups. Staff from TWDB, the Texas Commission on Environmental Quality, the Texas Department of Agriculture, and the Texas Parks and Wildlife Department, as well as repre-sentatives from the planning groups, all helped to develop initial projections. These draft pro-jections were then sent on to the planning groups for review. As a result of planning group requests, TWDB made over 600 population projection revisions at the county and subcounty levels.
Population projections for the 2007 State Water Plan used a standard demographic methodology known as a cohort-component procedure. This procedure uses separate cohorts (combinations of age, gender, and racial-ethnic groups) and com-ponents of cohort change (fertility, survival, and migration rates) to estimate future county popu-lations.
The mathematical models and assumptions used for this process are, in essence, identical to those developed by the Texas State Data Center. TWDB varied these models only by expanding their scope to project over a 50-year time frame, adding to the 30-year projections of the Texas State Data Center (see Appendix 4.1).
Of the three components of future population change, migration rates, which calculate how many people move in and out of the counties, are the most critical. Fertility and survival rates can be assumed to closely follow observed rates of the
recent past, but migration rates tend to be heavily influenced by the state of the economy, reflect-ing movement that takes advantage of economic opportunity. Migration can also be influenced by other unforeseen events, such as the catastrophic weather events of the recent past. Thus, three sets of projections were developed based on dif-ferent assumptions regarding migration: one set projected zero migration; another assumed migra-tion to equal one-half of the levels in the decade of the 1990s; and the third set assumed migration
-25.6
31.6
139.8
72.0
8.3
38.6 44.7
63.579.1
17.929.6
42.0
24.7
49.8
-18.0-10.2
27.3
-25
0
25
50
75
100
125
150
A
B C D E F G H I J K L M N
O P
Texas
Per
cent
cha
nge
in d
eman
d 20
00 to
206
0
Region
A
BC
E F
DG
H
I
JKL
N
O
PM
Figure 4.6. Percent change in projected demand by planning region for 2000–2060.
124 Water for Texas 2007
Population and Water Demand Projections 125
to equal that of the 1990-2000 rates. The plan-ning groups and state agency staff together deter-mined the most appropriate migration projection for each region.
Subcounty Population Projections
Because representatives from more of the state’s unincorporated areas were involved in this plan-ning process, the 2007 State Water Plan contains more detailed population projections than the 2002 State Water Plan. This plan projects popula-tion for 1,332 population centers, including cities with over 500 residents, utilities in unincorporated areas with water use in 2000 of 280 acre-feet or greater, and unincorporated population centers in sparsely populated counties. The 2002 State
Water Plan included projections for 971 popula-tion centers; it did not include statistics on other utilities.
Because detailed cohort-component data is avail-able only for county level population projections, TWDB used a different methodology to determine projections for cities, other utility service areas, and the remaining rural areas within each county. In general, the agency based initial projections on the estimated share each entity had of the 1990-2000 county growth. TWDB then applied that same percentage to the growth projections. However, when the growth trend for a county and a city went in opposite directions, other methods of pro-jections more specific to the situation were used. Because census populations were not available for utility service areas, TWDB used the number of water connections and the populations served that were reported in TWDB’s annual Water Use Survey to represent those baseline population figures.
4.3.2 Water Demand Methodology
In a process similar to determining the population projections, staff from the four state agencies (TWDB, the Texas Commission on Environmental Quality, the Texas Department of Agriculture, and the Texas Parks and Wildlife Department) devel-oped draft water demand projections. The plan-
Water for Texas 2007
ning groups then made more than 900 subsequent revisions, all of which were incorporated into the final projections. The draft water demand projec-tions were calculated using the historical water use from a base year and adjusting that figure for each future decade based on factors that influence the water demand for each water use category (popu-lation and economic growth, for instance). TWDB chose the year 2000 as the base year because it was very dry across nearly all the state, it matched with the availability of census population data, and it was recent enough to reflect current conservation and technological innovations. Water demand pro-jections for all categories other than the municipal category were calculated on a countywide basis.
Municipal Water DemandMunicipal water use is defined as residential and commercial water use. Residential use includes sin-gle and multifamily residential household water use. Commercial use includes water for business estab-lishments, public offices, and institutions but does not include industrial water use. Residential and commercial water uses are categorized together be-cause both use water similarly for drinking, clean-ing, sanitation, cooling, and landscape watering.
This category includes demand projections for all the subcounty groups mentioned in the popula-tion methodology section—cities, other utilities, and aggregated rural populations. To determine demand for each group, TWDB first calculated per capita water use (often described as gallons per capita per day) by dividing each group’s total water use in 2000 by its population. Those figures excluded sales to other utilities and industrial facili-ties. TWDB then multiplied the projected popula-tions by the projected per capita water use.
The municipal water demand projections in most regions incorporated the anticipated future water savings from installing more water-efficient plumb-ing fixtures, as detailed in the State Water Saving Performance Standards for Plumbing Fixtures Act of 1991. All other future water savings from municipal conservation programs were incorporated only as adopted water management strategies by the plan-ning groups.
Manufacturing and Mining Water Demands
Draft projections for these two categories were based upon water use in 2000, as reported in TWDB’s annual Water Use Survey. The base water use amount for each county was then projected into the future,
Comparison of Per Capita Water Use
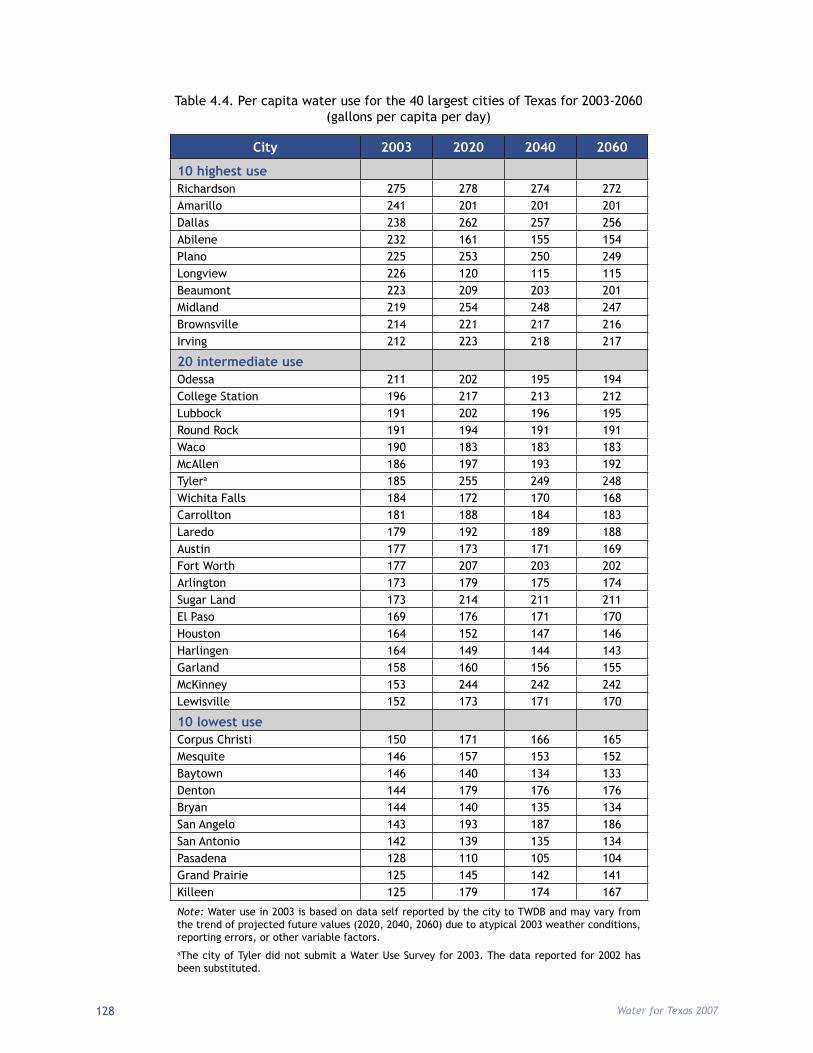
When people wish to compare the water use of different cities, the per capita water use figure is often used because it appears to be an objective figure that accounts for different city sizes. There is a wide range of per capita water use among all of the municipal water users in the state and even among the largest cities in the state (Table 4.4). Unfortunately, many people do not realize that there are various reasons why the per capita water use of one city may be higher or lower than that of another, including the
• average climatic conditions, such as rainfall and temperature;
• year-specific weather patterns;• amount of commercial and
institutional water use;• type of residential development;• income of customers; • number of seasonal residents; and• age of infrastructure.
In addition, although the per capita water use figures used in the regional and the state water plans are calculated in a consistent manner, the per capita figures calculated by other parties (utilities, cities, river authorities) may be calculated in a slightly different manner and produce a different per capita use for the same year and utility. For these reasons, it is important to be cautious when making per capita water use comparisons between municipal water users.
126126
Population and Water Demand Projections 127
which used mathematical optimization models. These models determined the most profitable crop combinations and overall rate of water use, also taking into account land availability, improved technology, and local acreage history. In rapidly urbanizing areas, projections also incorporated estimated figures on the amount of acreage and water rights being converted to municipal use.
Livestock Water Demands
Livestock water use for each county was based on the estimated livestock inventory in 2000 and on estimated water use per animal unit. In most cases, it was assumed that livestock use would re-main constant over the planning horizon.
4.3.3 Additional Information
More complete descriptions of these method-ologies, as well as those for population projec-tions, can be found in the Exhibit B Guidelines for Regional Water Plan Development (http://www.twdb.state.tx.us/data/popwaterdemand/2003Projections/Methodology.asp).
taking into consideration economic projections for the manufacturing and mining industries, as well as incorporated efficiency improvements from new technology. The projections also took into account the availability of accessible reserves and their effects on mining output.
Steam-Electric Power Generation Water Demands
Representatives of investor-owned Texas utilities, under contract with TWDB, prepared projections for this category. They based projections on the anticipated demand for electricity and the amount of water needed to produce each unit of electric-ity (kilowatt-hours). Demand for electricity was assumed to grow in direct proportion to the popu-lation and to commercial and manufacturing sec-tors. The projections also included savings in the first 20 years generated by more efficient produc-tion methods.
Irrigation Water Demands
The rate of future change in irrigation water de-mand was based on previous TWDB research,
Water for Texas 2007128
City 2003 2020 2040 2060
10 highest use Richardson 275 278 274 272Amarillo 241 201 201 201Dallas 238 262 257 256Abilene 232 161 155 154Plano 225 253 250 249Longview 226 120 115 115Beaumont 223 209 203 201Midland 219 254 248 247Brownsville 214 221 217 216Irving 212 223 218 217
20 intermediate use Odessa 211 202 195 194College Station 196 217 213 212Lubbock 191 202 196 195Round Rock 191 194 191 191Waco 190 183 183 183McAllen 186 197 193 192Tylera 185 255 249 248Wichita Falls 184 172 170 168Carrollton 181 188 184 183Laredo 179 192 189 188Austin 177 173 171 169Fort Worth 177 207 203 202Arlington 173 179 175 174Sugar Land 173 214 211 211El Paso 169 176 171 170Houston 164 152 147 146Harlingen 164 149 144 143Garland 158 160 156 155McKinney 153 244 242 242Lewisville 152 173 171 170
10 lowest use Corpus Christi 150 171 166 165Mesquite 146 157 153 152Baytown 146 140 134 133Denton 144 179 176 176Bryan 144 140 135 134San Angelo 143 193 187 186San Antonio 142 139 135 134Pasadena 128 110 105 104Grand Prairie 125 145 142 141Killeen 125 179 174 167
Note: Water use in 2003 is based on data self reported by the city to TWDB and may vary from the trend of projected future values (2020, 2040, 2060) due to atypical 2003 weather conditions, reporting errors, or other variable factors. aThe city of Tyler did not submit a Water Use Survey for 2003. The data reported for 2002 has been substituted.
Table 4.4. Per capita water use for the 40 largest cities of Texas for 2003-2060 (gallons per capita per day)