chapter 4 research methodology -...
TRANSCRIPT
111
CHAPTER 4
RESEARCH METHODOLOGY
Research involves all activities related to an investigation or
experimentation aimed at the discovery and interpretation of facts, revision of
accepted theories or laws in the light of new facts, or practical application of
such new or revised theories or laws. This chapter discusses the research
design and the methodology adopted to meet the various objectives of the
study mentioned below.
To Understand the structure of Service quality and to develop a
valid scale for its measurement
Identify the underlying key dimensions of banking service
quality as perceived by banking customers
To examine the linkage among perceived service quality with
other variables such as Customer expectations, Customer
satisfaction and behavioral intentions in banking context
To meet the first objective, psychometric soundness of alternate
structures for perceived service quality construct need to evaluated using
statistical tools. A scale development process as explained in sec 3.4 for
perceived service quality construct leads to the second objective. The
estimation of the theoretical model using appropriate statistical tools will
reveal the linkages among various constructs considered in the study. This
chapter will outline the development of tools while standardizing them
112
scientifically establishing validity and reliability for appropriate measurement
of the phenomenon under enquiry. Quantitative analysis of data was done
using statistical tools wherever applicable. This chapter further elaborates on
the research design used in the present study including details of sample,
development of research tools, and validation of instruments, data collection
procedure and the statistical techniques employed for data analysis. In
succeeding chapters, data analysis and results of the study are presented.
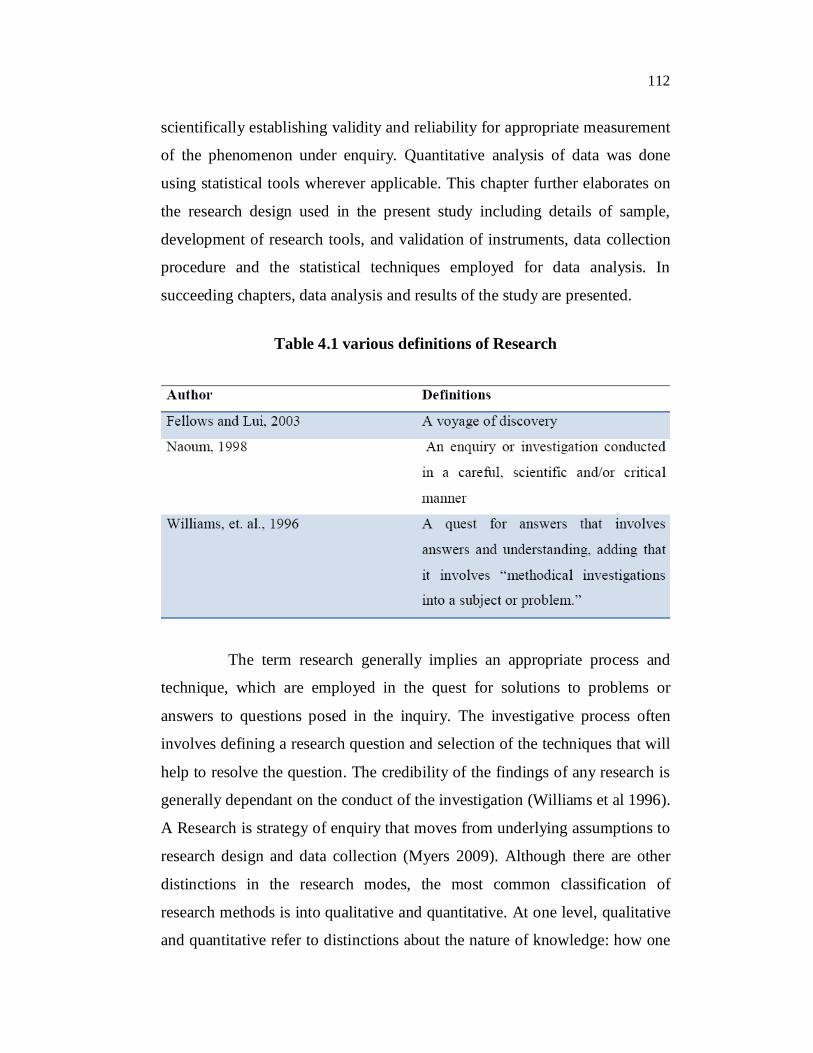
Table 4.1 various definitions of Research
The term research generally implies an appropriate process and
technique, which are employed in the quest for solutions to problems or
answers to questions posed in the inquiry. The investigative process often
involves defining a research question and selection of the techniques that will
help to resolve the question. The credibility of the findings of any research is
generally dependant on the conduct of the investigation (Williams et al 1996).
A Research is strategy of enquiry that moves from underlying assumptions to
research design and data collection (Myers 2009). Although there are other
distinctions in the research modes, the most common classification of
research methods is into qualitative and quantitative. At one level, qualitative
and quantitative refer to distinctions about the nature of knowledge: how one

113
understands the world and the ultimate purpose of the research. On another
level of discourse, the terms refer to research methods, that is, the way in
which data are collected and analysed. Researchers prefer to use both
quantitative and qualitative methods, depending on the kind of study and its
methodological foundation (Brysman and Burgess 1999). The qualitative
research adopted in this study was in the preliminary stage and basically of
exploratory nature.
4.1 QUALITATIVE VS QUANTITATIVE RESEARCH
Qualitative research involves analysis of data such as words
(e.g., from interviews), pictures (e.g., video), or objects (e.g., an artifact). It
attempts to get an in-depth opinion from participants. Qualitative Research is
collecting, analyzing, and interpreting data by observing what people do and
say. According to Domegan and Fleming (2007), “Qualitative research aims
to explore and to discover issues about the problem on hand, because very
little is known about the problem. Qualitative research is much more
subjective than quantitative research and uses very different methods of
collecting information, mainly individual, in-depth interviews and focus
groups (Myers, 2009). Maxwell,(1996) enumerates five research purposes for
which qualitative studies are particularly useful:
Understanding the meaning that participants in a study give to
the events, situations and actions that they are involved with;
and of the accounts they give of their lives and experiences;
Understanding the particular context within which the
participants act, and the influence this context has on their
actions;
Identifying unanticipated phenomena and influences, and
generating new, grounded theories about them;

114
Understanding the process by which events and actions take
place; and
Developing causal explanations.
Quantitative research generates statistics through the use of large-
scale survey research, using methods such as questionnaires or structured
interviews (Hittleman and Simon 1997). This type of research reaches many
more people, but the contact with those people is much quicker than
in qualitative research. Quantitative Research options have been
predetermined and a large number of respondents are involved. By definition,
measurement must be objective, quantitative and statistically valid. Simply
put, it’s about numbers, objective hard data. The sample size for a survey is
calculated by statisticians using formulas to determine how large a sample
size will be needed from a given population in order to achieve findings with
an acceptable degree of accuracy. Generally, researchers seek sample sizes
which yield findings with at least a 95% confidence interval. The distinction
between both approaches are more apparent than real (Robson (2002), and
that research stands to benefit from the use of mixed method approach
Creswell (2003). In fact, Robson (2002), points out that the use of
“qualitative/quantitative” terminology in labeling research designs invites risk
of miscommunication. In this study both qualitative and quantitative
approaches were adopted at different stages of research process.
The rationale for adopting both methods was justifiable on
following observations. The objective of the research was to identify certain
dimensions capable of capturing the domain of service quality in a localized
setting that was not explored in detail in prior studies. The first stage in the
study was therefore conducted in an elaborative manner to identify and
shortlist proper dimensions that are suitable and necessary in the endeavor.
Researcher found a qualitative analysis of views expressed by participants in
115
the preliminary study followed by inductive analysis as most appropriate for
the purpose of this research because all these procedures enhanced the
possibility of exploring the topics in detail to develop clear directions for next
stage.
The quantitative phase cannot be eliminated in this study for the
simple reason validation of the scale and estimation of the theoretical model
demands statistical procedures. Also generalisability of finding emerged from
the study can be analyzed only through checking the significant levels, that
presupposes sufficient sample size, randomness and related statistical
considerations.
There are three general research design strategies discussed by
theorists (Domegan and Fleming 2003; Malhotra and Birks 1999; Kotler et al
2001).They are Descriptive research, exploratory research and casual
research. The goal Descriptive research is usually concerned with describing
a population with respect to important variables and exploratory research is to
discover ideas and insights about variables. Causal research is used to
establish cause-and-effect relationships between variables Descriptive
research is always used when statistical data and numbers are needed:
for example research on customer demographics or purchase frequency. The
tool used to conduct descriptive research is almost always survey. If the
number of people asked to complete the survey is large enough compared to
the total of population, the answer can be even be said to have been proved.
Malhotra and Birks (1999) defined exploratory research as “research design
characterized by a flexible and evolving approach to understanding
phenomena that are inherently difficult to measure.” Malhotra and Birks
(1999) define causal research as “conclusive research where the major
objective is to obtain evidence regarding cause and effect relationships”
Causal research is very specific and conducted to discover whether the

116
change a company is planning to make will have a positive or negative effect
on customers.
4.3 RESEARCH PROCESS
The research process involved two phases in this study as
illustrated in Figure 4.1. Phase one included steps such as literature review,
finalization of objectives, and identification of variables and development of
Theory. Defining the goals and objectives of a research was one of the most
important steps in the research process. Clearly stated objectives provided
correct direction to the research process. The process of finalizing objectives
was done by an exploratory research (e.g., literature reviews, talking to
people, and focus groups) being the mostly adopted procedure. The literature
review provided an opportunity to build on other’s work and impart clarity to
the problem to be addressed in the study.
Figure 4.1 Research Process adopted for the study
117
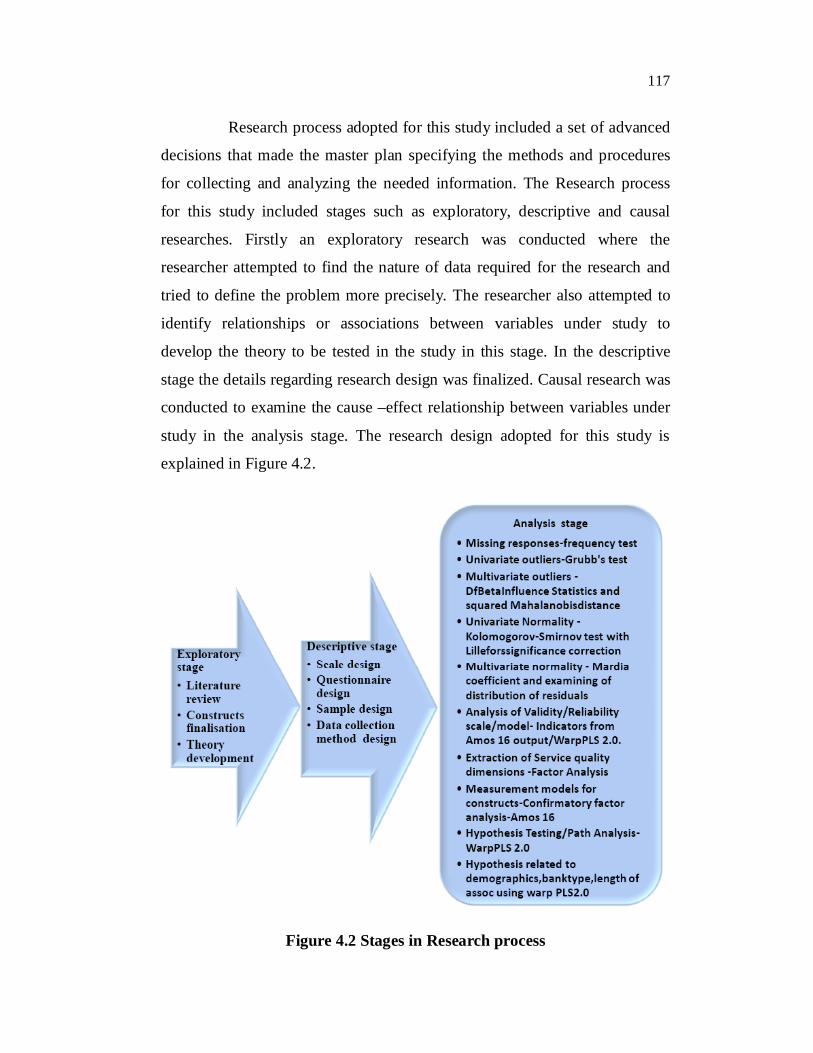
Research process adopted for this study included a set of advanced
decisions that made the master plan specifying the methods and procedures
for collecting and analyzing the needed information. The Research process
for this study included stages such as exploratory, descriptive and causal
researches. Firstly an exploratory research was conducted where the
researcher attempted to find the nature of data required for the research and
tried to define the problem more precisely. The researcher also attempted to
identify relationships or associations between variables under study to
develop the theory to be tested in the study in this stage. In the descriptive
stage the details regarding research design was finalized. Causal research was
conducted to examine the cause –effect relationship between variables under
study in the analysis stage. The research design adopted for this study is
explained in Figure 4.2.
Figure 4.2 Stages in Research process

118
4.2.1 Exploratory Research
Exploratory research forms the foundation of a good study
(Churchill and Iacobuci 2004) and it has to be normally flexible, unstructured
and qualitative (Aaker et al 2000, Burns and Bush 2002) and serves as an
input to further research (Malhotra et al 1999).Exploratory research provided
insights into and comprehension of an issue or situation. Exploratory research
helped to determine the best research design, data collection method and
selection of subjects. Exploratory research in this study was mostly by way
of reviewing available literature, qualitative approaches such as informal
discussions with consumers, employees, followed by more formal approaches
through in-depth interviews with experts followed by pilot studies for testing
the survey instrument.
4.2.1.1 The Preliminary Study
A preliminary study also known as key informant technique which
taps the knowledge of those familiar with the topic of research was conducted
by way of interviews with focus groups to identify the relevant dimensions to
be considered for measuring variables considered for the study. In this study,
Individual interviews with 20 banking professionals and 20 banking
customers with more than 20 years of banking experience was conducted by
the researcher to identify the exact nature of problem and dimensions to be
considered while developing an instrument to measure customer expectation,
service quality, customer satisfaction and behavior intentions in the banking
context in Kerala. The 20 banking professionals were senior managers in
different branches of various banks at Ernakulam, Kerala. Similarly 20
banking customers were selected across different professions including
businessman, professional, retired service personnel, small scale merchants
and house wives who have got more than 20yrs of banking experience. The
119
literature review produced an elaborative list of appropriate indicators from
bank customer’s points of view (Appendix 4). The list was given to the
experts and was requested to mark the indicators that they feel important in
contemporary banking context. The experts were also requested to note down
important dimensions they feel more sensible to capture the service quality
perceptions. The analysis of the results of exploratory stage gave insights
into the dimensions that should be highlighted in the study.
The expectation component of the study was divided into two parts.
The first part dealt with dimensions which form the reasons for customer
expectation about service quality. The various dimensions identified to
measure reasons for customer expectation were past experience of the
customer; word-of-mouth from other customers; personal needs of the
customer and various communications received by the customer from the
service provider such as service promises. The second part of expectation
component dealt with measuring the desired expectations of the customer.
The experts consisting of 20 banking customers marked their preferred
attributes among various attributes shown to them.
The variable “expectation” was assumed to have critical influence
in deciding perceived service quality and customer satisfaction. The following
two questions were asked to the individual respondents in the focus group
consisting of 20 experienced banking customers to streamline the dimensions
for measuring expectation.
1. Why do you have expectations about services offered by banks?
2. What are your desired expectations about services offered by
banks?

120
The results of the preliminary study (Appendix 4) helped to finalize
relevant constructs and their measurements specific to contextual setting used
in the study.
4.2.2 Descriptive Research
Having obtained some primary knowledge of the subject matter
from the exploratory study, descriptive research was conducted. Contrary to
an exploratory research, a descriptive study is more rigid, preplanned and
structured, and is typically based on a large sample (Churchill and Iacobucci
2004; Hair et al 2003; Malhotra et al 1999). Descriptive research designs are
basically quantitative in nature (Burns and Bush 2002; Churchill and
Iacobucci 2004; Hair et al 2003). There are two basic techniques of
descriptive research namely cross-sectional and longitudinal. Cross-sectional
studies collect information from a given sample of the population at only one
point in time, while the latter deals with the same sample units of population
over a period of time (Burns and Bush 2002; Malhotra et al 1999). The cross-
sectional study is also referred to as a sample survey in which selected
individuals are asked to respond to a set of standardized and structured
questions about what they think, feel and do (Hair et al 2003). For the purpose
of this study, a cross-sectional study was the appropriate technique as
opposed to a longitudinal study for the reason the data from different sample
unit were needed to verify the relations between variables of interest in the
study.
This study also opted for survey method rather than case study
method or action research. The case study approach refers to a group of
methods which emphasize qualitative analysis (Yin 2009), whereas an action
research aims at finding a solution for an immediate problem facing a society
or an industrial/business organization. A case study research is useful when a

121
‘how’ or ‘why’ question is being asked about a contemporary set of events
over which the investigator has little or no control(Yin 2009).Data are
collected from a small number of respondents through methods such as
participant-observation, in-depth interviews, and longitudinal studies. The
case study approach seeks to understand the problem being investigated. It
provides the opportunity to ask penetrating questions and to capture the
richness of concept, but the conclusions drawn may be specific and may not
be generalizable. Lee (1989) identifies four corresponding problems with case
study research - a lack of: Controllability, Deductibility, Repeatability and
Generalizability. Jick (1983) suggests that survey research may also
contribute to greater confidence in the generalizability of the results an
essential purpose of this study.
The next stage in the research process was finalization of
questionnaire, scale for marking responses, sampling design and data
collection strategy. The procedures adopted are narrated in the following
sections. .
4.2.2.1 Questionnaire Design
This step involved selecting appropriate measurement scales,
question wording and content, response format and finally the sequence of
questions. The literature review and preliminary study in the form of in- depth
interviews with the focus group have given a clear idea of the contents to be
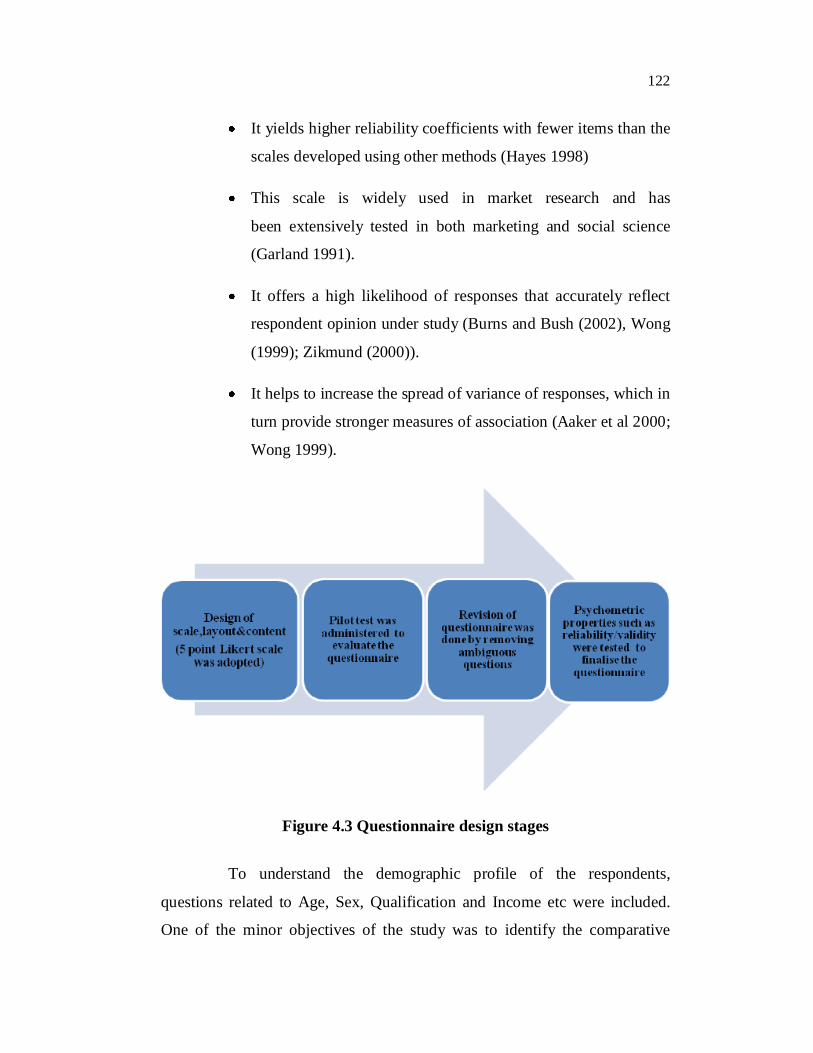
included in the questionnaire. The stages involved in questionnaire design
process are shown in Figure 4.3.
The questionnaire in this study was designed as closed – end
questions where the respondents have to make their response in a 5 point
Likert scale varying from “Strongly disagree” to “Strongly agree”. This scale
was adopted based on the following reasons (Kassim 2001):
122
It yields higher reliability coefficients with fewer items than the
scales developed using other methods (Hayes 1998)
This scale is widely used in market research and has
been extensively tested in both marketing and social science
(Garland 1991).
It offers a high likelihood of responses that accurately reflect
respondent opinion under study (Burns and Bush (2002), Wong
(1999); Zikmund (2000)).
It helps to increase the spread of variance of responses, which in
turn provide stronger measures of association (Aaker et al 2000;
Wong 1999).
Figure 4.3 Questionnaire design stages
To understand the demographic profile of the respondents,
questions related to Age, Sex, Qualification and Income etc were included.
One of the minor objectives of the study was to identify the comparative
123
perception of service quality among customers of private Sector, Public
Sector and new Generation banks. Hence a question to mention the name of
the bank was included in the questionnaire. The respondents were asked to
name only one bank with which they are having more interactions. A question
to understand the respondent’s length of association with the bank was also
included.
In relation to question content and wording, the questions were
designed to be short, simple and comprehensible, avoiding ambiguous, vague,
estimation, generalization, leading, double barreled and presumptuous
questions (Kassim 2001).Use of negative worded questions are avoided to
prevent confusion to respondents in answering the questions. The
questionnaire contained questions related to all the indicator variables related
to the constructs used for the study (Appendix 1).
The layout of the questionnaire was designed into five sections
namely A, B, C, D and E. Part-A consists of general information and
demographic profile of the respondent. Part-B contained 13 scale items for
measurement of “Expectation” constructs. Part-C consisted of 28scale items
to measure Service Quality. The items related to each of the identified
dimensions of the service quality construct were arranged together without
mentioning the name of the assumed latent dimension. Part-D contained 12
scale items to measure constructs related to Satisfaction, Part-E contained 4
scale items to measure various Behavioral Intentions of the customer.
A pilot study was conducted by collecting responses from 50
respondents, who were banking customers in Ernakulam, Kerala. The 50
respondents were randomly selected from public sector, private sector and
new generation banks in the area. The pilot study provided an opportunity to
124
detect and rectify a wide range of potential problems with an instrument.
These problems may include:
Questions that respondents don't understand
Ambiguous questions
Questions that combine two or more issues in a single question
(double-barreled questions)
Questions that make respondents uncomfortable
In this study 4 questions were deleted from total of 61 scale items
short listed by the expert panel after the pilot study as these questions were
found confusing by respondents. One question from part B, three questions
from part- C were removed to finalize the questionnaire (Appendix 1)
ultimately used in the study.
4.2.2.2 Sampling Design
The sampling design explains the definite plan for obtaining a
sample from the population i.e the entire group of people whom the
researcher is interested to know about. In this study all the customers who
utilize the service offered by the various types of banks in Cochin, kerala was
considered as population for the study. The geographical territory considered
for the study covered the entire district of Cochin in kerala state that has a
population of approximately six lakh as per 2011 census. Even though the
bank customers in the area considered as finite, due to lack of exact statistics
on the actual number population size and considering the extant of banking
penetration in the area, it was assumed that population for the study matches
with population of the area. The major steps involved in sampling design was
125
Deciding the sample unit
Determining Sample size
Deciding the sampling Technique
The sampling unit is an element in the sample and in this study
bank customer in Cochin is considered as the sampling unit. A sample
represents any number of persons, units or objects selected to represent the
population according to some rule or plan. The key to research lies in
generating sufficient data so that the illuminate patterns, concepts, categories,
properties, and dimensions of the given phenomena can emerge (Strauss and
Corbin 1998). Therefore, it is essential to obtain an appropriate sample size
that will generate sufficient data (Auerbach and Silverstein 2003). There has
been considerable debate over what constitutes an acceptable sample size for
the results to be statistically valid (Hinkin et al 1997), with there being no
accepted rule to define an appropriate sample size (Flynn and Pearcy 2001).
Different authors have suggested different sample sizes as appropriate,
including an absolute sample from one hundred to two hundred (Flynn and
Pearcy 2001), one hundred or larger (Hair et al 1998), and ratios of items to
respondents from 1:4 to 1:10 (Hinkin 1995 ; Flynn and Pearcy 2001) To
determine the sample size, Sample Size Calculator developed by M/S
Creative Research Systems, available at www.surveysystem.com was used.
At the confidence level of 95% and confidence interval of 5 being generally
accepted for social sciences (Cohen 1988), the sample size was calculated as
384. Hence a sample size of 500 was selected considering after rejection of
invalid responses the final sample size should be more than 384.
Among sampling methods, probability sample are of much
importance since most statistical tests fit on to this type of sampling method
and also representativeness and generalizability will be achieved well with

126
probable samples from a population (Thompson 1997). Simple random
sampling method was adopted to collect primary data using the structured
questionnaire. The samples are selected on a random basis after visiting
different branches of various banks in the city without any prejudice on
considering or rejecting a particular respondent. The randomness was
achieved as selection from all the customers present in the banks at the time
of visit was purely by chance and not by prior decision.
4.2.2.3 Data Collection
The data collection was done personally by meeting the
respondents individually. The structured questionnaire was distributed to
respondents after meeting them and explaining them the purpose of the study.
The respondents were met in the premises of banks and only those who
offered willingness to participate in the survey are considered. The survey
was conducted during the period January2011 to March 2011. Completed
responses from500 respondents were scrutinized and incomplete responses
were eliminated to get 385 full responses.
4.3 DATA ANALYSIS STRATEGY
Subsequent to the descriptive study, causal research was conducted.
Descriptive studies may show that two variables are related but are
insufficient for examining cause and effect relationships (Malhotra et al
1999). Causal research is most appropriate when the functional relationship
between the causal factors and the effect predicted on the performance
variable is under investigation (Hair et al 2003). This study was concerned the
causal relationships between customer expectation, perceived service quality,
customer satisfaction and behavior intentions. Hence, a causal experiment
was appropriate to generate the type of evidences necessary to make causal

127
inferences about relationships between research variables (Parasuraman
1991).
A three level approach was adopted to analyze the data after
screening the data for missing values, outliers, normality etc. The first attempt
was to identify the existence of five distinct factors with regard to service
quality construct by performing an exploratory factor analysis of 28 indicators
used for measurement. The analysis confirmed existence of five factors and in
the process one indicator variable was eliminated for poor loading.
The second attempt was to develop measurement models for all
latent constructs considered for the study. Using Confirmatory factor analysis
and by testing the goodness of fit measurement models were developed and
final indicators capable of measuring the constructs were finalized. The
structural model for Service quality construct was found to represent the data
with 21 indicators belonging to five distinct dimensions based on goodness of
fit criteria as shown in Figure 4.4.
Figure 4.4 Model Evaluation stages
128
Scale so confirmed was then tested for common methods Variance,
Convergent validity, Discriminant validity and multiple group comparison for
checking applicability to all group of assumed population. Also based on
goodness of fit it was confirmed that service quality construct is a
multidimensional second order formative construct with five first order
reflective constructs.
Thirdly, the structural model with all the constructs which are
measured either as reflective or formative were tested for its ability to
represent the data as per guidelines for testing using Warp PLS 2.0. To assess
the model fit with the data, it is recommended that the p-values for both the
average path coefficient (APC) and the average r-squared (ARS) be both
lower than .05. In addition, it is recommended that the average variance
inflation factor (AVIF) be lower than 5 (Ned Kock 2009). The significant
paths in the model are utilized for drawing various conclusions in the study.
4.4 STRUCTURAL EQUATION MODELLING
The purpose of many research projects is to analyze causal
relationships between variables. SEM is a statistical technique for testing and
estimating those causal relationships based on statistical data and qualitative
causal assumptions. SEM is a confirmatory technique used to determine
whether the model developed for the research is valid for data. SEM is a
combination of factor analysis and multiple regression. The variables in SEM
are measured (observed, manifest) variables (indicators) and factors (latent
variables). The SEM can be divided into two parts. The measurement model
is the part which relates measured variables to latent variables. The structural
model is the part that relates latent variables to one another. Since this study
required the hypothesized model to be tested for the best-fit of the data, SEM

129
seemed to be the appropriate analysis method as it produces more
comprehensive overall goodness-of-fit.
Two complementary schools have come to the fore in the field of
Structural Equation Modelling namely covariance-based SEM and
component-based SEM.
The first school developed around Karl Jöreskog which is
considered as Covariance-based and is usually used with an
objective of model validation and needs a large sample (what is
large varies from one author to another: more than 100 subjects
and preferably more than 200 subjects are often mentioned).
The various methods of estimation used for covariance-based
SEM, like Maximum Likelihood (ML) or Unweighted Least
Squares (ULS), are full information methods. There are various
software developed for performing this type of SEM like
AMOS,LISREL,EQS etc
The second school developed around Herman Wold under the
name "PLS" (Partial Least Squares). It is a partial information
method. It is a two-step method: (1) latent variables scores are
computed using the PLS algorithm and (2) OLS regressions are
carried out on the LV scores for estimating the structural
equations. There are various software developed for performing
this type of SEM like PLS-Graph, SmartPLS, WarpPLS etc
Recently Hwang and Takane (2004), have proposed a new full
information method optimizing a global criterion and named Generalized
Structured Component Analysis (GSCA). This new school can be considered
as a generalisation of principal component analysis to the case of several data

130
tables connected by causal links. The method was implemented into a
software program. Visual GSCA 1.0
PLS was considered ideal, if the conditions relating to sample size,
independence, or normal distribution are not met, and if prediction is more
important than parameter estimation. In this study both approaches are used in
different stages of analysis.
In this study, for confirmatory factor analysis of the service quality
construct, CBSEM based software Amos.16 was used and for the analysis
related to conceptual model representing all the constructs, PLS based
software WarpPLS2.0 was used . The choice of PLS was justified from two
aspects. The first aspect was that PLS can accommodate both reflective and
formative scales easily compared to covariance structure analysis. Although
the inclusion of formative measures in CBSEM has been well documented
(Joreskog and Sorbom 1996), analysts usually encounter identification
problems. The second aspect was that PLS does not require any priori
distributional assumptions and relatively small sample size is acceptable
(Chin et al 2003).
4.4.1 Covariance Based Structural Equation Modeling
There are five distinct steps involved in analyzing a dataset using
Covariance based SEM. They are:
Model specification;
Model identification;
Measure selection, data cleaning and preparation;
Model analysis and evaluation; and
Model re-specification (Kline 2005).

131
Model specification involves mathematically or diagrammatically
expressing hypothesized relationships amongst a set of variables
(Kline 2005). A model is theoretically identifiable if there is a unique solution
possible for it and each of its parameters. If a model is not identifiable, then it
has no unique solution and SEM software will fail to converge. Such models
need to be re-specified to be identifiable (Kline 2005)
The third step involves sub steps such as measure selection, data
cleaning and data preparation. To measure each latent construct at least two
observed variables (Joreskog 1977) are needed. In this stage it is examined
whether sufficient observed variables are there to measure all the latent
variables under study. Maximum Likelihood (ML) estimation is the preferred
estimation procedure for SEM. The outliers, normality, missing variables etc
should be identified and properly treated in this stage.
In Model evaluation using AMOS software involves the use of
significance tests to assess the adequacy of model fit. Fit refers to the ability
of a model to reproduce the data (i.e., usually the variance-covariance
matrix). The fit measures generated by Amos output can be classified as
shown in the following Table 4.2. There is wide disagreement among
researches as to which fit indexes to report. Jaccard and Wan (1996),
recommend use of at least three fit tests, one from each of the first three
categories above, so as to reflect diverse criteria. Kline (2005) recommended
the use of least four tests, such as chi-square; GFI, NFI, or CFI; NNFI; and
SRMR
Many indices are affected by sample size and for this reason
CMIN, GFI and AGFI is no longer a preferred measure of goodness of fit.
The Parsimonious Fit Measures are used primarily to compare models on the
basis of some criteria that take parsimony (in the sense of number of
132
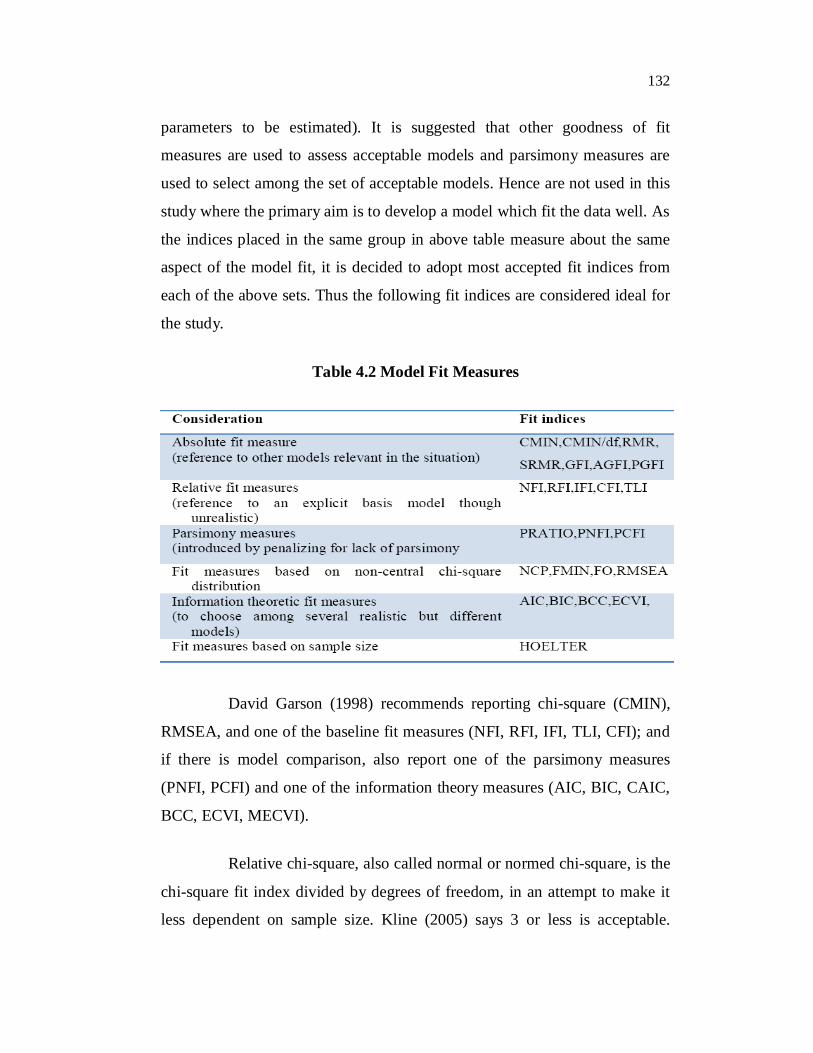
parameters to be estimated). It is suggested that other goodness of fit
measures are used to assess acceptable models and parsimony measures are
used to select among the set of acceptable models. Hence are not used in this
study where the primary aim is to develop a model which fit the data well. As
the indices placed in the same group in above table measure about the same
aspect of the model fit, it is decided to adopt most accepted fit indices from
each of the above sets. Thus the following fit indices are considered ideal for
the study.
Table 4.2 Model Fit Measures
David Garson (1998) recommends reporting chi-square (CMIN),
RMSEA, and one of the baseline fit measures (NFI, RFI, IFI, TLI, CFI); and
if there is model comparison, also report one of the parsimony measures
(PNFI, PCFI) and one of the information theory measures (AIC, BIC, CAIC,
BCC, ECVI, MECVI).
Relative chi-square, also called normal or normed chi-square, is the
chi-square fit index divided by degrees of freedom, in an attempt to make it
less dependent on sample size. Kline (2005) says 3 or less is acceptable.

133
Some researchers allow values as high as 5 to consider a model adequate fit
(Schumacker and Lomax 2004), while others insist relative chi-square be 2 or
less. Less than 1.0 is poor model fit. AMOS lists relative chi-square as
CMIN/DF.
Standardized root mean square residual, Standardized RMR
(SRMR): SRMR is the average difference between the predicted and
observed variances and covariance in the model, based on standardized
residuals. Standardized residuals are fitted residuals (see above) divided by
the standard error of the residual (this assumes a large enough sample to
assume stability of the standard error). The smaller the SRMR, the better the
model fit. SRMR = 0 indicates perfect fit. A value less than .05 is widely
considered good fit and below .08 adequate fit.
The comparative fit index, CFI: Also known as the Bentler
Comparative Fit Index. CFI compares the existing model fit with a null model
which assumes the indicator variables (and hence also the latent variables) in
the model are uncorrelated (the "independence model"). CFI and RMSEA are
among the measures least affected by sample size (Fan et al.. 1999). CFI
varies from 0 to 1 (if outside this range it is reset to 0 or 1). CFI close to 1
indicates a very good fit. By convention, CFI should be equal to or greater
than .90 to accept the model.
Root mean square error of approximation, RMSEA, is also called
RMS or RMSE or discrepancy per degree of freedom. By convention
(Schumacker and Lomax 2004) there is good model fit if RMSEA less than or
equal to .05. There is adequate fit if RMSEA is less than or equal to .08. More
recently, Hu and Bentler (1999) have suggested RMSEA
for a good model fit. RMSEA is a popular measure of fit, partly because it
does not require comparison with a null model and thus does not require the

134
author posit as plausible a model in which there is complete independence of
the latent variables as does, for instance, CFI. In a well-fitting model, the
lower 90% confidence limit is very close to 0, while the upper limit is less
than .08.
PCLOSE tests the null hypothesis that RMSEA is not greater than
.05. If PCLOSE is less than .05, we reject the null hypothesis and conclude
that the computed RMSEA is greater than .05, indicating lack of a close fit.
Hoelter's critical N issued to judge if sample size is adequate. By
convention, sample size is adequate if Hoelter's N > 200.
The following Table 4.3 gives the accepted values for each of the
above indices as considered for the study.
Table 4.3 Accepted values for each of indices considered in the study
The model re-specification is required when goodness of fit is not
achieved in the initial evaluation. Re-specification is done on the basis of
modification indices to finalize a good-fitting model. The re-specification of
bad-fitting models was done by (Saurina and Carme Germà Coenders 2002):

135
Dropping loadings which are not substantively interpretable.
Adding loadings which are both interpretable and statistically
significant.
Splitting dimensions for which interpretable clusters of positive
residual Correlations appear.
Adding error correlations which are both interpretable and
statistically significant.
Dropping items which would load on nearly all dimensions.
Merging dimensions whose correlation is close to unity.
Dropping non-significant regression coefficients among latent
variables.
4.4.2 PLS Based SEM
A structural equation model with all constructs used in the study
was analyzed using Warp PLS 2.0 for identifying significant relations
between variables of interest in the study .The term structural equation
model is used to refer to both the structural and measurement model together.
In a structural equation modeling (SEM) analysis, the inner model is the part
of the model that describes the relationships between the latent variables
considered in the model. The outer model is the part of the model that
describes the relationships between the latent variables and their indicators.
The inner and outer models are also frequently referred to as the structural
and measurement models, respectively. Therefore the path coefficients are
inner model parameter estimates whereas weights and loading are
measurement model parameter estimates depending on whether the
measurement model is formative or reflective. Warp PLS 2.0 estimates
enables evaluation of measurement model as well as structural model

136
simultaneously. However when second order constructs is used, measurement
model for first order constructs are to be evaluated separately
In this study two constructs namely perceived service quality and
satisfaction are conceptualized as second order constructs. For analysis of
second order constructs using Warp PLS 2.0, it is required to calculate the LV
scores (factor scores) at first by creating models with latent variables and
indicators without linking. These LV scores are used to define the second
order construct in the final model.
The most important feature of Warp PLS 2.0 as found different
from other PLS based software is the inclusion of model fit indices. For
assessing the model fit with the data, it is recommended that the P values for
both the APC and ARS be both lower than .05; that is, significant at the .05
level. Also it is recommended that the AVIF < 5.Validity Criterion for various
constructs in Warp PLS are explained in Table 4.4.
Table 4.4 Validity / Reliability guidelines in WarpPLS2.0

137
As the correlations between formative indicators may be positive,
negative or zero (Bollen 1984; Diamantopoulos and Winklhofer 2001),
reliability as a measure of internal consistency sense is not meaningful for
formative indicators (Bagozzi 1994; Hulland 1996).
4.5 VALIDITY AND RELIABILITY
The two most important and fundamental characteristics of any
measurement procedure are reliability and validity. Patton (2001) opined that
validity and reliability are two factors which any qualitative researcher should
be concerned about while designing, analysing results and judging the quality
of the study.
4.5.1 Validity
According to Davis et al (1993), “A measurement scale is valid if it
does what it is supposed to do and measures what it is supposed to measure”.
According to Hardy and Byrman (2004), there are different types of validity:
• Face/Content validity – requires a thorough examination of the
wording of the items included in the instrument and their
connection to the relevant frame of reference used in the
particular study. Face validity can also be examined through
the use of the opinion and judgment of experts concerning the
items and wording used
• Criterion-related validity – evaluates a scale in terms of a
criterion on which people tend to differ. This includes
concurrent and predictive validity
• Construct validity – requires “an examination of the theoretical
inferences that might be made about the underlying construct”.

138
Content validity ensures that the measures include an adequate and
representative set of items and the clarity of the definition and concept used.
A major threat to content validity is ill-defined terms and concepts. The
variable measurements in the study were consistent with prior studies and
hence there did not seem to have any threat to content validity. In this study a
pilot study of the questionnaire was conducted to determine whether any
alterations or rewording of questionnaires was necessary due to any jargon,
inconsistencies or leading questions. The pilot test concluded elimination of
four indicators whereby avoiding the possible threat to content validity.
Criterion-related validity deals with the instrument’s ability to
measure an item accurately and analyze it. Scale used in the study was mainly
five-point Likert-type scale. This is a popular scaling technique and is used
widely in management research. To ensure criterion validity throughout the
questionnaire a common scale is used for measurement. Construct validity
explains how well the results obtained from the use of the measure fit in the
theories around which the test was designed. This was assessed through
convergent and discriminant validity. Convergent validity is established when
the scores obtained with two different instruments measuring the same
concept are highly correlated. Discriminant validity is established when based
on theory two variables are predicted to be uncorrelated and the scores
obtained by measuring them are indeed empirically found to be so.
4.5.2 Reliability
Reliability is the extent to which measurements of the particular
test are repeatable. In other words, the measuring procedure should yield
consistent results on repeated tests. The more consistent the results given by
repeated measurements, the higher the reliability of measurement procedures.
Kirk and Miller (1986) identify three types of reliability referred to in

139
quantitative research, which relate to: (1) the degree to which a measurement,
given repeatedly, remains the same (2) the stability of a measurement over
time; and (3) the similarity of measurements within a given time period In
order to test reliability. There are two aspects of the reliability issue: external
and internal reliability. According to Hardy and Bryman (2004), external
reliability means that the studied variable does not fluctuate greatly over time
which means that it is stable. This kind of reliability can be tested through
test-retest reliability, which means measuring the same scale twice in
different time frames and see to what extent the two sets of data have yielded
the same replies of the respondents. This method of measuring the reliability
is time-consuming and tedious and will not be applied in the underlying
study. Furthermore, according to Hardy and Bryman (2004), internal
reliability means that all the constituent indicators of a variable are measuring
the same thing which means that the variable is coherent. One of the most
popular methods for estimating internal reliability, also applied in this thesis,
is Cronbach’s Alpha (R) Test of Reliability. In this study, Cronbach
coefficient alpha value was above 0.7 showing scale reliability for all
reflective constructs but for formative constructs reliability may not be a
correct criterion as the indicators are not correlated each other.
4.5.3 Various Validity/Reliability Considerations
The various considerations used for testing the soundness of the
measures are explained in Table 4.5. This study has adopted Confirmatory
factor analysis using AMOS16 for validating the scales developed for
measuring perceived service quality construct. Also to evaluate the research
model structural equation modeling analysis using Warp PLS 2.0 was
adopted. The verification of the results obtained after above procedures with
regard to certain parameters indicated various validity and reliability
considerations.

140
Table 4.5 various validity/Reliability considerations

141
4.6 SUMMARY
The chapter narrated the various methods adopted to conduct the
study. The rationale for each decision regarding data collection strategy,
sample size, questionnaire design and analysis methods were explained in
detail. This study used qualitative approach in the initial stage to properly
define the domain of the study and to develop a sensible theory that can lead
fulfillment of the objectives. In the qualitative phase interview were
conducted by the researcher with experts in the banking profession as well as
experienced customers, who can offer valid suggestions to bring more clarity
to the study. This procedure helped in finalizing the theory and items for
measurement of the constructs of interest in the study. The second phase
concluded on questionnaire design, data collection methods and decisions on
sample size. The proposed analysis strategy was finalized and rationale for
using each procedure was elaborated. The next chapter presents the report of
analysis done with the data collected.