chapter 4 simulation and performance analysis of data … · 2013-11-17 · simulation and...
TRANSCRIPT
Chapter 4Simulation and Performance Analysis of DataIntensive and Workload Intensive CloudComputing Data Centers
Dzmitry Kliazovich, Pascal Bouvry, and Samee Ullah Khan
4.1 Introduction
Data centers are becoming increasingly popular for the provisioning of computingresources. The cost and operational expenses of data centers have skyrocketedwith the increase in computing capacity [1]. Energy consumption is a growingconcern for data center operators. It is becoming one of the main entries on a datacenter operational expenses (OPEX) bill [2,3]. The Gartner Group estimates energyconsumptions to account for up to 10% of the current OPEX, and this estimate isprojected to rise to 50% in the next few years [4]. However, computing-based energyconsumption is not the only power-related portion of the OPEX bill. High powerconsumption generates heat and requires an accompanying cooling system that costsin a range of $2–$5 million per year for classical data centers [5]. Failure to keepdata center temperatures within operational ranges drastically decreases hardwarereliability and may potentially violate the service level agreement (SLA) with thecustomers.
From the perspective of energy efficiency, a cloud computing data center canbe defined as a pool of computing and communication resources organized inthe way to transform the received power into computing or data transfer work tosatisfy user demands. The first power saving solutions focused on making the datacenter hardware components power efficient. Technologies, such as dynamic voltageand frequency scaling (DVFS), and dynamic power management (DPM) [6], were
D. Kliazovich (�) • P. BouvryUniversity of Luxembourg, 6 rue Coudenhove Kalergi, Luxembourge-mail: [email protected]; [email protected].
S.U. KhanNorth Dakota State University, Fargo, ND 58108-6050, USAe-mail: [email protected]
C. Kachris et al. (eds.), Optical Interconnects for Future Data Center Networks,Optical Networks, DOI 10.1007/978-1-4614-4630-9 4,© Springer Science+Business Media New York 2013
47
48 D. Kliazovich et al.
extensively studied and widely deployed. Because the aforementioned techniquesrely on power-down and power-off methodologies, the efficiency of these techniquesis at best limited. In fact, an idle server may consume about two-thirds of its peakload [7].
Because the workload of a data center fluctuates on a weekly (and in somecase on hourly) basis, it is a common practice to overprovision computing andcommunicational resources to accommodate the peak load. In fact, the average loadaccounts only for 30% of data center resources [8]. This allows putting the rest ofthe 70% of the resources into a sleep mode for most of the time. However, achievingthe above requires central coordination and energy-aware workload schedulingtechniques. Typical energy-aware scheduling solutions attempt to: (a) concentratethe workload in a minimum set of the computing resources and (b) maximize theamount of resource can be put into sleep mode [9].
Most of the current state-of-the-art research on energy efficiency has pre-dominantly focused on the optimization of the processing elements. However, asrecorded in earlier research, more than 30% of the total computing energy isconsumed by the communication links, switching and aggregation elements. Similarto the case of processing components, energy consumption of the communicationfabric can be reduced by scaling down the communication speeds and cuttingoperational frequency along with the input voltage for the transceivers and switchingelements [10]. However, slowing the communicational fabric down should beperformed carefully and based on the demands of user applications. Otherwise,such a procedure may result in a bottleneck, thereby limiting the overall systemperformance. A number of studies demonstrate that often a simple optimizationof the data center architecture and energy-aware scheduling of the workloads maylead to significant energy savings. Reference [11] demonstrates energy savings ofup to 75% that can be achieved by traffic management and workload consolidationtechniques.
In this chapter, we survey power-saving techniques implemented at both com-ponent and system levels. In energy efficiency optimization we focus on both com-puting and communication fabrics. As the system level, energy-efficient network-aware scheduling solutions are presented. Finally a simulation environment, namedGreenCloud, for advanced energy-aware studies of cloud computing data centers inrealistic setups is presented. GreenCloud is developed as an extension of a packet-level network simulator ns-2 [12]. Unlike few existing cloud computing simulatorssuch as CloudSim [13] or MDCSim [14], GreenCloud extracts, aggregates, andmakes information about the energy consumed by computing and communicationelements of the data center available in an unprecedented fashion. In particular, aspecial focus is devoted to accurately capture communication patterns of currentlydeployed and future data center architectures.
4 Simulation and Performance Analysis of Data Intensive and Workload . . . 49
4.2 Simulating Energy-Efficient Data Centers
In this section, we present the main aspects of design of energy-efficient data cen-ters, survey the most prominent architectures, and describe power-saving techniquesimplemented by individual data center components.
4.2.1 Energy Efficiency
Only a part of the energy consumed by the data center gets delivered to thecomputing servers directly. A major portion of the energy is utilized to maintaininterconnection links and network equipment operations. The rest of the electricityis wasted in the power distribution system, dissipates as heat energy, and usedup by air-conditioning systems. In light of the above discussion, we distinguishthree energy consumption components: (a) computing energy, (b) communicationalenergy, and (c) the energy component related to the physical infrastructure of a datacenter.
The efficiency of a data center can be defined in terms of the performancedelivered per watt, which may be quantified by the following two metrics: (a) PowerUsage Effectiveness (PUE) and (b) Data Center Infrastructure Efficiency (DCiE)[15,16]. Both PUE and DCiE describe which portion of the totally consumed energygets delivered to the computing servers.
4.2.2 Data Center Architectures
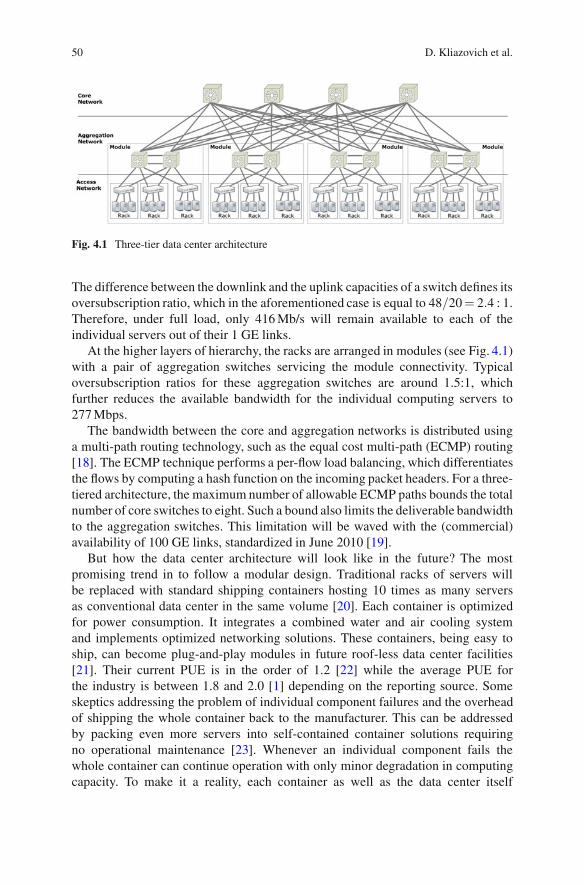
Three-tier trees of hosts and switches form the most widely used data centerarchitecture [17]. It (see Fig. 4.1) consists of the core tier at the root of the tree, theaggregation tier that is responsible for routing, and the access tier that holds the poolof computing servers (or hosts). Earlier data centers used two-tier architectures withno aggregation tier. However, such data centers, depending on the type of switchesused and per-host bandwidth requirements, could typically support not more than5,000 hosts. Given the pool of servers in today’s data centers that are of the orderof 100,000 hosts [11] and the requirement to keep layer-2 switches in the accessnetwork, a three-tiered design becomes the most appropriate option.
Although 10 Gigabit Ethernet (GE) transceivers are commercially available, ina three-tiered architecture the computing servers (grouped in racks) are intercon-nected using 1 GE links. This is due to the fact that the 10 GE transceivers: (a)are too expensive and (b) probably offer more capacity than needed for connectingcomputing servers. In current data centers, rack connectivity is achieved withinexpensive Top-of-Rack (ToR) switches. A typical ToR switch shares two 10GE uplinks with 48 GE links that interconnect computing servers within a rack.
50 D. Kliazovich et al.
Fig. 4.1 Three-tier data center architecture
The difference between the downlink and the uplink capacities of a switch defines itsoversubscription ratio, which in the aforementioned case is equal to 48/20= 2.4 : 1.Therefore, under full load, only 416 Mb/s will remain available to each of theindividual servers out of their 1 GE links.
At the higher layers of hierarchy, the racks are arranged in modules (see Fig. 4.1)with a pair of aggregation switches servicing the module connectivity. Typicaloversubscription ratios for these aggregation switches are around 1.5:1, whichfurther reduces the available bandwidth for the individual computing servers to277 Mbps.
The bandwidth between the core and aggregation networks is distributed usinga multi-path routing technology, such as the equal cost multi-path (ECMP) routing[18]. The ECMP technique performs a per-flow load balancing, which differentiatesthe flows by computing a hash function on the incoming packet headers. For a three-tiered architecture, the maximum number of allowable ECMP paths bounds the totalnumber of core switches to eight. Such a bound also limits the deliverable bandwidthto the aggregation switches. This limitation will be waved with the (commercial)availability of 100 GE links, standardized in June 2010 [19].
But how the data center architecture will look like in the future? The mostpromising trend in to follow a modular design. Traditional racks of servers willbe replaced with standard shipping containers hosting 10 times as many serversas conventional data center in the same volume [20]. Each container is optimizedfor power consumption. It integrates a combined water and air cooling systemand implements optimized networking solutions. These containers, being easy toship, can become plug-and-play modules in future roof-less data center facilities[21]. Their current PUE is in the order of 1.2 [22] while the average PUE forthe industry is between 1.8 and 2.0 [1] depending on the reporting source. Someskeptics addressing the problem of individual component failures and the overheadof shipping the whole container back to the manufacturer. This can be addressedby packing even more servers into self-contained container solutions requiringno operational maintenance [23]. Whenever an individual component fails thewhole container can continue operation with only minor degradation in computingcapacity. To make it a reality, each container as well as the data center itself
4 Simulation and Performance Analysis of Data Intensive and Workload . . . 51
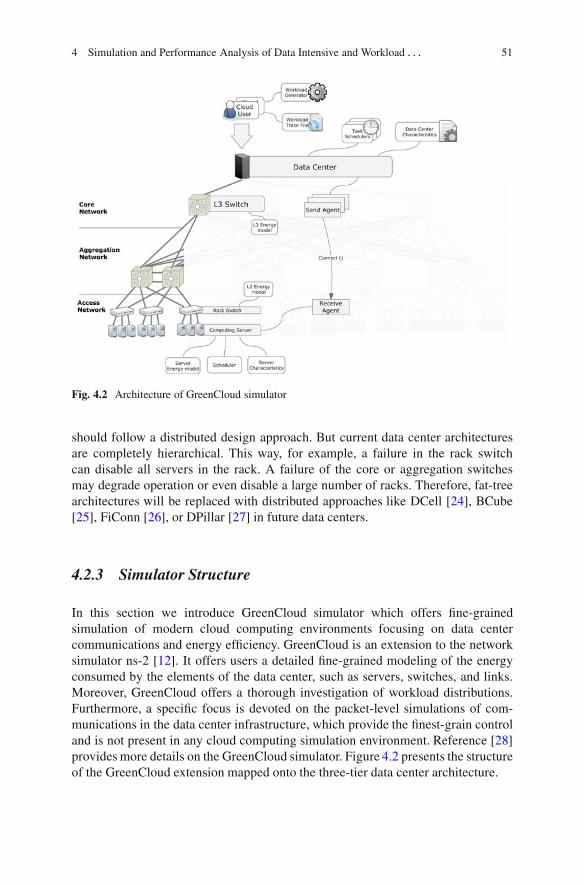
Fig. 4.2 Architecture of GreenCloud simulator
should follow a distributed design approach. But current data center architecturesare completely hierarchical. This way, for example, a failure in the rack switchcan disable all servers in the rack. A failure of the core or aggregation switchesmay degrade operation or even disable a large number of racks. Therefore, fat-treearchitectures will be replaced with distributed approaches like DCell [24], BCube[25], FiConn [26], or DPillar [27] in future data centers.
4.2.3 Simulator Structure
In this section we introduce GreenCloud simulator which offers fine-grainedsimulation of modern cloud computing environments focusing on data centercommunications and energy efficiency. GreenCloud is an extension to the networksimulator ns-2 [12]. It offers users a detailed fine-grained modeling of the energyconsumed by the elements of the data center, such as servers, switches, and links.Moreover, GreenCloud offers a thorough investigation of workload distributions.Furthermore, a specific focus is devoted on the packet-level simulations of com-munications in the data center infrastructure, which provide the finest-grain controland is not present in any cloud computing simulation environment. Reference [28]provides more details on the GreenCloud simulator. Figure 4.2 presents the structureof the GreenCloud extension mapped onto the three-tier data center architecture.
52 D. Kliazovich et al.
4.2.4 Hardware Components and Energy Models
Computing servers are the staple of a data center that are responsible for taskexecution. In GreenCloud, the server components implement single core nodesthat have a preset on a processing power limit in MIPS (million instructions persecond) or FLOPS (floating point operations per second), associated size of thememory/storage resources, and contain different task scheduling mechanisms rang-ing from the simple round-robin to the sophisticated DVFS and DNS approaches.
The servers are arranged into racks with a ToR switch connecting it to the accesspart of the network. The power model followed by server components depends onCPU utilization. As reported in [2] and [7] an idle server consumes about two-thirdsof its peak load consumption. This is due to the fact that servers must constantlymanage memory modules, disks, I/O resources, and other peripherals. Moreover,the power consumption increases with the level of CPU load linearly. As a result,the aforementioned model allows implementation of power saving in a centralizedscheduler that can provision consolidation of workloads in a minimum possibleamount of the computing servers.
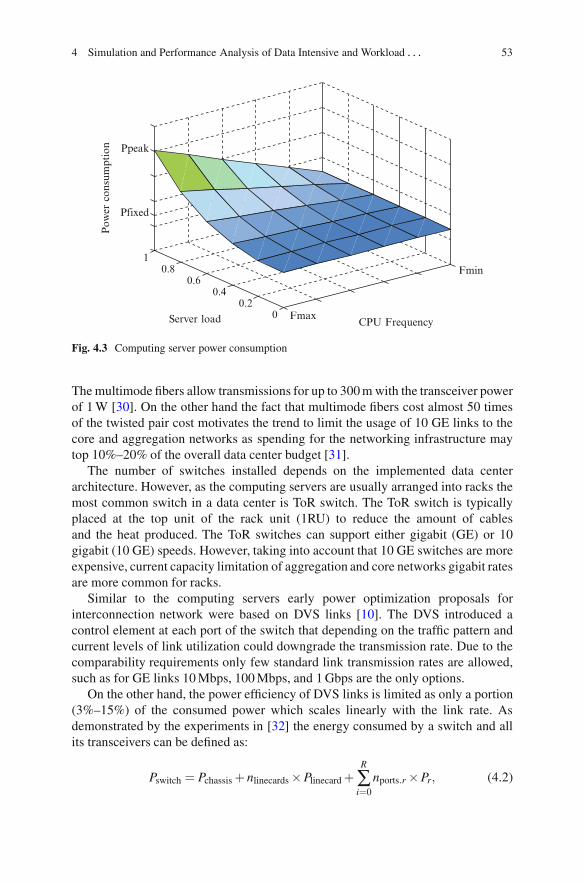
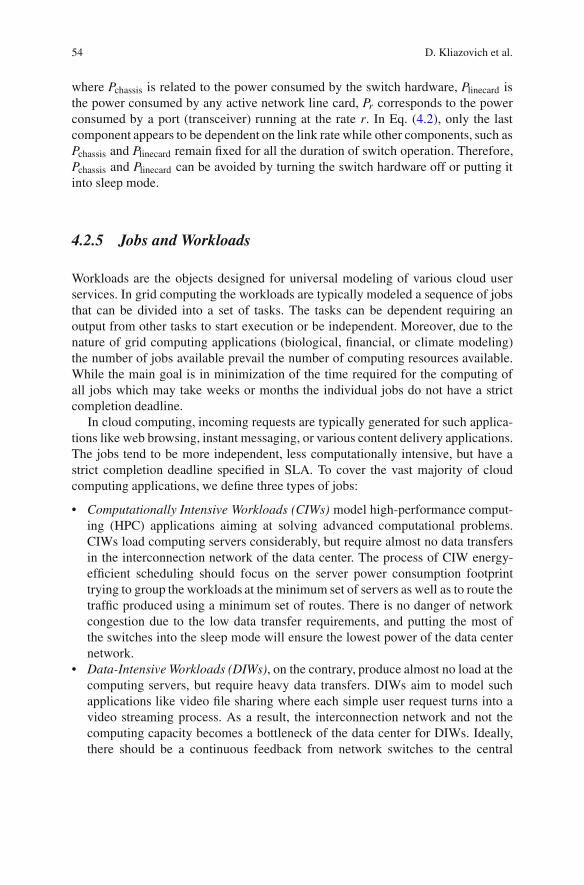
1. Another option for power management is dynamic voltage/frequency scaling(DVFS) [10], which introduces a trade-off between computing performanceand the energy consumed by the server. The DVFS is based on the fact thatswitching power in a chip decreases proportionally to V 2 × f , where V is thevoltage and f is the switching frequency. Moreover, voltage reduction requiresfrequency downshift. This implies a cubic relationship from f in the CPU powerconsumption. Note that server components, such as bus, memory, and disks donot depend on the CPU frequency. Therefore, the power consumption of anaverage server (see Fig. 4.3) can be expressed as follows [29]:
P = Pfixed +Pf × f 3, (4.1)
where Pfixed accounts for the portion of the consumed power which does not scalewith the operating frequency f , while Pf is a frequency-dependent CPU powerconsumption.
Network switches and links form the interconnection fabric that delivers work-loads to any of the computing servers for execution in a timely manner. Theinterconnection of switches and servers requires different cabling solutions depend-ing on the supported bandwidth, physical and quality characteristics of the link. Thequality of signal transmission in a given cable determines a trade-off between thetransmission rate and the link distance, which are the factors defining the cost andenergy consumption of the transceivers.
The twisted pair is the most commonly used medium for Ethernet networks thatallows organizing Gigabit Ethernet (GE) transmissions for up to 100 m with thetransceiver power consumed of around 0.4 W or 10 GE links for up to 30 m with thetransceiver power of 6 W. The twisted pair cabling is a low cost solution. However,for the organization of 10 GE links it is common to use optical multimode fibers.
4 Simulation and Performance Analysis of Data Intensive and Workload . . . 53
Fmax
Fmin
00.2
0.40.6
0.81
Pfixed
Ppeak
CPU FrequencyServer load
Pow
er c
onsu
mpt
ion
Fig. 4.3 Computing server power consumption
The multimode fibers allow transmissions for up to 300 m with the transceiver powerof 1 W [30]. On the other hand the fact that multimode fibers cost almost 50 timesof the twisted pair cost motivates the trend to limit the usage of 10 GE links to thecore and aggregation networks as spending for the networking infrastructure maytop 10%–20% of the overall data center budget [31].
The number of switches installed depends on the implemented data centerarchitecture. However, as the computing servers are usually arranged into racks themost common switch in a data center is ToR switch. The ToR switch is typicallyplaced at the top unit of the rack unit (1RU) to reduce the amount of cablesand the heat produced. The ToR switches can support either gigabit (GE) or 10gigabit (10 GE) speeds. However, taking into account that 10 GE switches are moreexpensive, current capacity limitation of aggregation and core networks gigabit ratesare more common for racks.
Similar to the computing servers early power optimization proposals forinterconnection network were based on DVS links [10]. The DVS introduced acontrol element at each port of the switch that depending on the traffic pattern andcurrent levels of link utilization could downgrade the transmission rate. Due to thecomparability requirements only few standard link transmission rates are allowed,such as for GE links 10 Mbps, 100 Mbps, and 1 Gbps are the only options.
On the other hand, the power efficiency of DVS links is limited as only a portion(3%–15%) of the consumed power which scales linearly with the link rate. Asdemonstrated by the experiments in [32] the energy consumed by a switch and allits transceivers can be defined as:
Pswitch = Pchassis + nlinecards ×Plinecard +R
∑i=0
nports.r ×Pr, (4.2)
54 D. Kliazovich et al.
where Pchassis is related to the power consumed by the switch hardware, Plinecard isthe power consumed by any active network line card, Pr corresponds to the powerconsumed by a port (transceiver) running at the rate r. In Eq. (4.2), only the lastcomponent appears to be dependent on the link rate while other components, such asPchassis and Plinecard remain fixed for all the duration of switch operation. Therefore,Pchassis and Plinecard can be avoided by turning the switch hardware off or putting itinto sleep mode.
4.2.5 Jobs and Workloads
Workloads are the objects designed for universal modeling of various cloud userservices. In grid computing the workloads are typically modeled a sequence of jobsthat can be divided into a set of tasks. The tasks can be dependent requiring anoutput from other tasks to start execution or be independent. Moreover, due to thenature of grid computing applications (biological, financial, or climate modeling)the number of jobs available prevail the number of computing resources available.While the main goal is in minimization of the time required for the computing ofall jobs which may take weeks or months the individual jobs do not have a strictcompletion deadline.
In cloud computing, incoming requests are typically generated for such applica-tions like web browsing, instant messaging, or various content delivery applications.The jobs tend to be more independent, less computationally intensive, but have astrict completion deadline specified in SLA. To cover the vast majority of cloudcomputing applications, we define three types of jobs:
• Computationally Intensive Workloads (CIWs) model high-performance comput-ing (HPC) applications aiming at solving advanced computational problems.CIWs load computing servers considerably, but require almost no data transfersin the interconnection network of the data center. The process of CIW energy-efficient scheduling should focus on the server power consumption footprinttrying to group the workloads at the minimum set of servers as well as to route thetraffic produced using a minimum set of routes. There is no danger of networkcongestion due to the low data transfer requirements, and putting the most ofthe switches into the sleep mode will ensure the lowest power of the data centernetwork.
• Data-Intensive Workloads (DIWs), on the contrary, produce almost no load at thecomputing servers, but require heavy data transfers. DIWs aim to model suchapplications like video file sharing where each simple user request turns into avideo streaming process. As a result, the interconnection network and not thecomputing capacity becomes a bottleneck of the data center for DIWs. Ideally,there should be a continuous feedback from network switches to the central
4 Simulation and Performance Analysis of Data Intensive and Workload . . . 55
workload scheduler. Based on such a feedback, the scheduler will distribute theworkloads taking current congestion levels of the communication links. It willavoid sending workloads over congested links even if certain server’s computingcapacity will allow accommodating the workload. Such scheduling policy willbalance the traffic in the data center network and reduce average time requiredfor a task delivery from the core switches to the computing servers.
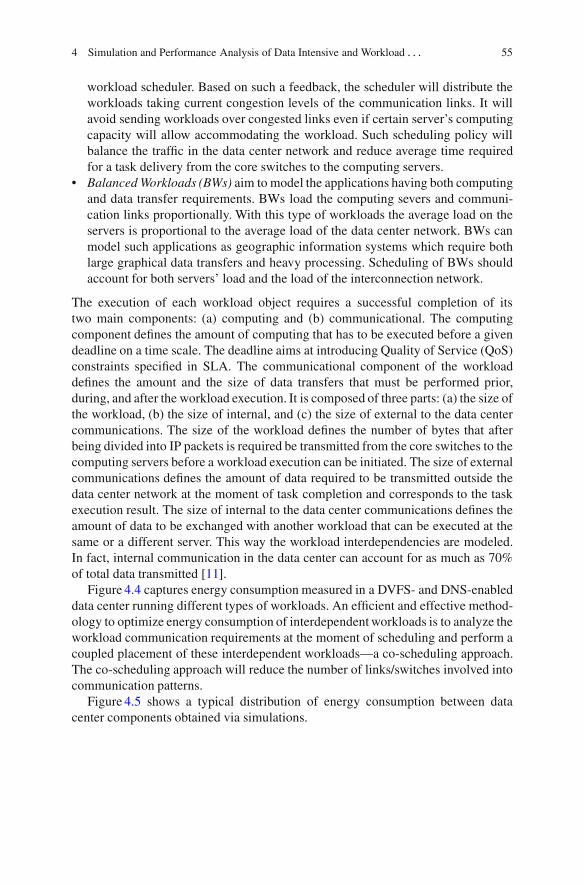
• Balanced Workloads (BWs) aim to model the applications having both computingand data transfer requirements. BWs load the computing severs and communi-cation links proportionally. With this type of workloads the average load on theservers is proportional to the average load of the data center network. BWs canmodel such applications as geographic information systems which require bothlarge graphical data transfers and heavy processing. Scheduling of BWs shouldaccount for both servers’ load and the load of the interconnection network.
The execution of each workload object requires a successful completion of itstwo main components: (a) computing and (b) communicational. The computingcomponent defines the amount of computing that has to be executed before a givendeadline on a time scale. The deadline aims at introducing Quality of Service (QoS)constraints specified in SLA. The communicational component of the workloaddefines the amount and the size of data transfers that must be performed prior,during, and after the workload execution. It is composed of three parts: (a) the size ofthe workload, (b) the size of internal, and (c) the size of external to the data centercommunications. The size of the workload defines the number of bytes that afterbeing divided into IP packets is required be transmitted from the core switches to thecomputing servers before a workload execution can be initiated. The size of externalcommunications defines the amount of data required to be transmitted outside thedata center network at the moment of task completion and corresponds to the taskexecution result. The size of internal to the data center communications defines theamount of data to be exchanged with another workload that can be executed at thesame or a different server. This way the workload interdependencies are modeled.In fact, internal communication in the data center can account for as much as 70%of total data transmitted [11].
Figure 4.4 captures energy consumption measured in a DVFS- and DNS-enableddata center running different types of workloads. An efficient and effective method-ology to optimize energy consumption of interdependent workloads is to analyze theworkload communication requirements at the moment of scheduling and perform acoupled placement of these interdependent workloads—a co-scheduling approach.The co-scheduling approach will reduce the number of links/switches involved intocommunication patterns.
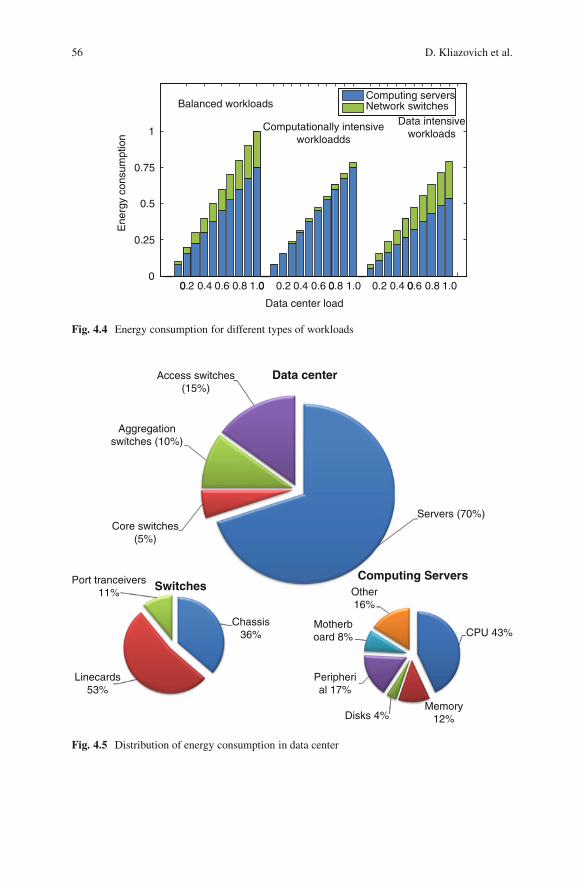
Figure 4.5 shows a typical distribution of energy consumption between datacenter components obtained via simulations.
56 D. Kliazovich et al.
00
0.25
0.5
0.75
1E
nerg
y co
nsum
ptio
n
Balanced workloads
0.2 0.4 0.6 0.8 1.00 0.2 0.4 0.6 0
Data center load
Computationally intensiveworkloadds
0.8 1.0 0.2 0.4 0
Computing servers Network switches
Data intensiveworkloads
0.6 0.8 1.0
Fig. 4.4 Energy consumption for different types of workloads
Access switches(15%)
Aggregationswitches (10%)
Core switches(5%)
Port tranceivers11%
Chassis36%
Linecards53%
Disks 4%Memory
12%
Peripherial 17%
Motherboard 8%
Other16%
CPU 43%
Servers (70%)
Data center
Computing ServersSwitches
Fig. 4.5 Distribution of energy consumption in data center
4 Simulation and Performance Analysis of Data Intensive and Workload . . . 57
4.3 Energy-Efficient Scheduling
4.3.1 Network Congestion
Utilizing a communication fabric in data centers entails the concept of runningmultiple types of traffic (LAN, SAN, or IPC) on a single Ethernet-based medium[33]. On one side, the Ethernet technology is cheap, easy to deploy, and relativelysimple to manage, on the other side, the Ethernet hardware is less powerful andprovisions for small buffering capacity. A typical buffer size in an Ethernet networkis in the order of 100s of KB. However, a typical buffer size of an Internet router isin the order of 100s of MB [34]. Small buffers and the mix of high-bandwidth trafficare the main reasons for network congestion.
Any of the data center switches may become congested either in the uplinkdirection or in the downlink direction or both. In the downlink direction, thecongestion occurs when individual ingress link capacities overcome individualegress link capacities. In the uplink direction, the mismatch in bandwidth isprimarily due to the bandwidth oversubscription ratio, which occurs when thecombined capacity of server ports overcomes a switch’s aggregate uplink capacity.
Congestion (or hotspots) may severely affect the ability of a data centernetwork to transport data. Currently, the Data Center Bridging Task Group (IEEE802.1) [35] is specifying layer-2 solutions for congestion control, termed IEEE802.1Qau specifications. The IEEE 802.1Qau specifications introduce a feedbackloop between data center switches for signaling congestion. Such a feedback allowsoverloaded switches to hold off heavy senders from sending with the congestionnotification signal. Such a technique may avoid congestion-related losses and keepthe data center network utilization high. However, it does not address the root ofthe problem as it is much more efficient to assign data-intensive jobs to differentcomputing servers in the way that jobs avoid sharing common communicationpaths. To benefit from such spatial separation in the three-tiered architecture (seeFig. 4.1), the jobs must be distributed among the computing servers in proportionto their communication requirements. Data-intensive jobs, like ones generated byvideo sharing applications, produce a constant bit-stream directed to the end-useras well as communicate with other jobs running in the data center. However, sucha methodology contradicts the objectives of energy-efficient scheduling, which triesto concentrate all of the active workloads on a minimum set of servers and involveminimum number of communication resources. This trade-off between energyefficiency, data center network congestion, and performance of individual jobs isresolved using a unified scheduling metric presented in the subsequent section.
4.3.2 The DENS Methodology
The DENS methodology minimizes the total energy consumption of a data center byselecting the best-fit computing resources for job execution based on the load level
58 D. Kliazovich et al.
and communication potential of data center components. The communicationalpotential is defined as the amount of end-to-end bandwidth provided to individualservers or group of servers by the data center architecture. Contrary to traditionalscheduling solutions [36] that model data centers as a homogeneous pool of com-puting servers, the DENS methodology develops a hierarchical model consistentwith the state-of-the-art data center topologies. For a three-tier data center, DENSmetric M is defined as a weighted combination of server-level fs, rack-level fr, andmodule-level fm functions:
M = α× fs +β× fr + γ× fm, (4.3)
where α, β, and γ are weighted coefficients that define the impact of the correspond-ing components (servers, racks, and/or modules) on the metric behavior. Highervalues of α favor the selection of highly loaded servers in lightly loaded racks.Higher values of β will prioritize computationally loaded racks with low networktraffic activity. Higher values of γ favor selection of lightly loaded modules. Theγ parameter is an important design variable for job consolidation in data centers.Taking into account that α+β+ γ must equal unity, the values of α = 0.7, β = 0.2,and γ = 0.1 are selected experimentally to provide a good balance in the evaluatedthree-tier data center topology. The details of the selection process are presentedin [37].
The factor related to the choice of computing servers combines the server loadLs(l) and its communication potential Qr(q) that corresponds to the fair share of theuplink resources on the ToR switch. This relationship is given as:
fs(l,q) = Ls(l)× Qr(q)φ
δr, (4.4)
where Ls(l) is a factor depending on the load of the individual servers l, Qr(q)defines the load at the rack uplink by analyzing the congestion level in the switch’soutgoing queue q, δr is a bandwidth over provisioning factor at the rack switch, andφ is a coefficient defining the proportion between Ls(l) and Qr(q) in the metric.Given that both Ls(l) and Qr(q) must be within the range [0,1] higher φ values willdecrease the importance of the traffic-related component Qr(q). Similar to the caseof computing servers, which was encapsulated in Eq. (4.4), the factors affectingracks and modules can be formulated as:
fr(l,q) = Lr(l)× Qm(q)φ
δm= Qm(q)φ
δm× 1
n
n∑
i=1Ls(l), (4.5)
fm(l) = Lm(l) = 1k
k∑j=0
Lr(l), (4.6)
where Lr(l) is a rack load obtained as a normalized sum of all individual serverloads in the rack, Lm(l) is a module load obtained as a normalized sum of all of
4 Simulation and Performance Analysis of Data Intensive and Workload . . . 59
0 0.2 0.4 0.6 0.8 10
0.2
0.4
0.6
0.8
1
1.2
L s(l)
Server load, l
Penalize underloadedservers
Favor high serverutilization
ε
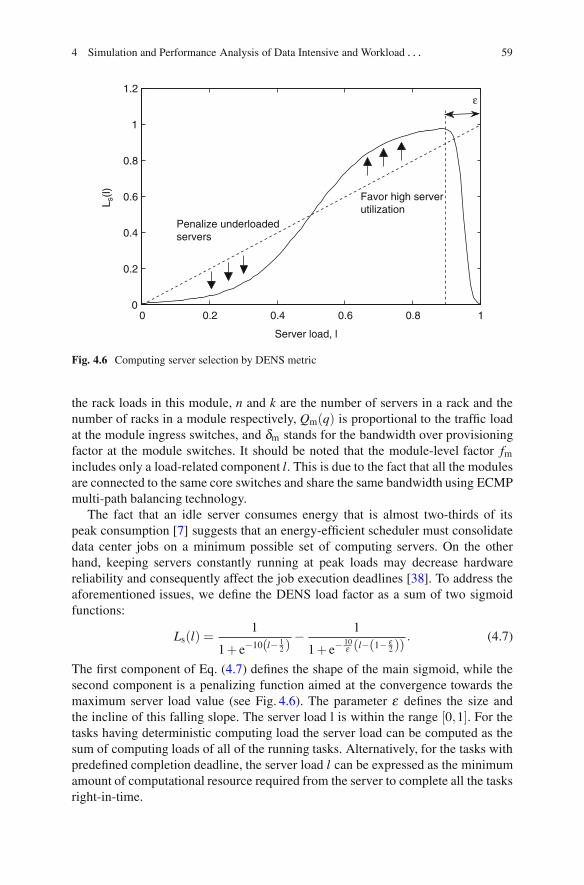
Fig. 4.6 Computing server selection by DENS metric
the rack loads in this module, n and k are the number of servers in a rack and thenumber of racks in a module respectively, Qm(q) is proportional to the traffic loadat the module ingress switches, and δm stands for the bandwidth over provisioningfactor at the module switches. It should be noted that the module-level factor fm
includes only a load-related component l. This is due to the fact that all the modulesare connected to the same core switches and share the same bandwidth using ECMPmulti-path balancing technology.
The fact that an idle server consumes energy that is almost two-thirds of itspeak consumption [7] suggests that an energy-efficient scheduler must consolidatedata center jobs on a minimum possible set of computing servers. On the otherhand, keeping servers constantly running at peak loads may decrease hardwarereliability and consequently affect the job execution deadlines [38]. To address theaforementioned issues, we define the DENS load factor as a sum of two sigmoidfunctions:
Ls(l) =1
1+ e−10(l− 12 )
− 1
1+ e−10ε (l−(1− ε
2 )). (4.7)
The first component of Eq. (4.7) defines the shape of the main sigmoid, while thesecond component is a penalizing function aimed at the convergence towards themaximum server load value (see Fig. 4.6). The parameter ε defines the size andthe incline of this falling slope. The server load l is within the range [0,1]. For thetasks having deterministic computing load the server load can be computed as thesum of computing loads of all of the running tasks. Alternatively, for the tasks withpredefined completion deadline, the server load l can be expressed as the minimumamount of computational resource required from the server to complete all the tasksright-in-time.
60 D. Kliazovich et al.
0 0.2 0.4 0.6 0.8 10
0.2
0.4
0.6
0.8
1
Q(q
)
Queue size, q/Qmax
Fig. 4.7 Queue selection by DENS metric
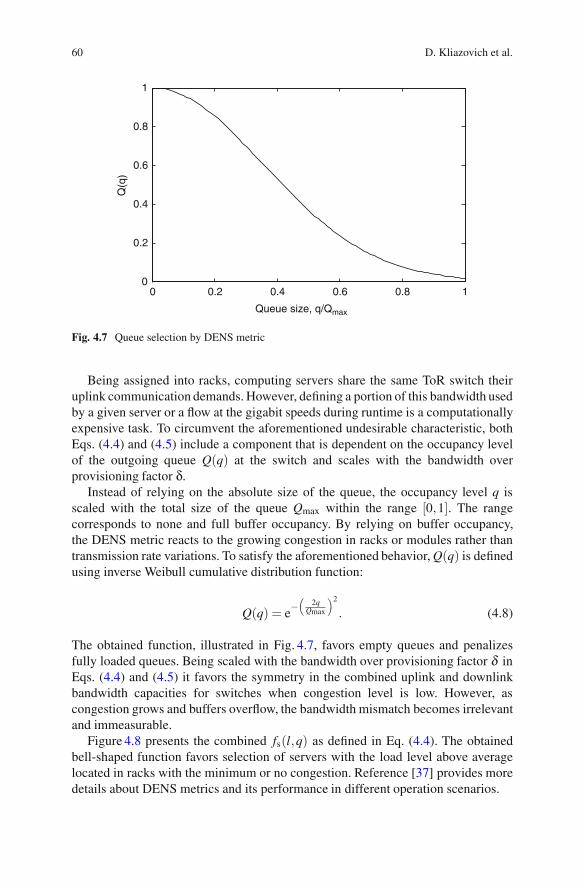
Being assigned into racks, computing servers share the same ToR switch theiruplink communication demands. However, defining a portion of this bandwidth usedby a given server or a flow at the gigabit speeds during runtime is a computationallyexpensive task. To circumvent the aforementioned undesirable characteristic, bothEqs. (4.4) and (4.5) include a component that is dependent on the occupancy levelof the outgoing queue Q(q) at the switch and scales with the bandwidth overprovisioning factor δ.
Instead of relying on the absolute size of the queue, the occupancy level q isscaled with the total size of the queue Qmax within the range [0,1]. The rangecorresponds to none and full buffer occupancy. By relying on buffer occupancy,the DENS metric reacts to the growing congestion in racks or modules rather thantransmission rate variations. To satisfy the aforementioned behavior, Q(q) is definedusing inverse Weibull cumulative distribution function:
Q(q) = e−(
2qQmax
)2
. (4.8)
The obtained function, illustrated in Fig. 4.7, favors empty queues and penalizesfully loaded queues. Being scaled with the bandwidth over provisioning factor δ inEqs. (4.4) and (4.5) it favors the symmetry in the combined uplink and downlinkbandwidth capacities for switches when congestion level is low. However, ascongestion grows and buffers overflow, the bandwidth mismatch becomes irrelevantand immeasurable.
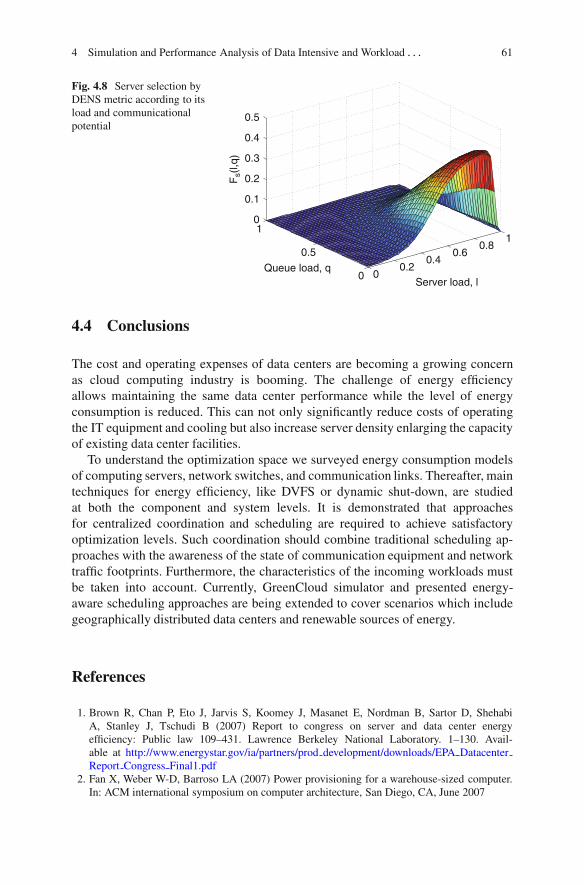
Figure 4.8 presents the combined fs(l,q) as defined in Eq. (4.4). The obtainedbell-shaped function favors selection of servers with the load level above averagelocated in racks with the minimum or no congestion. Reference [37] provides moredetails about DENS metrics and its performance in different operation scenarios.
4 Simulation and Performance Analysis of Data Intensive and Workload . . . 61
00.2
0.40.6
0.81
0
0.5
10
0.1
0.2
0.3
0.4
0.5
Server load, lQueue load, q
Fs(
l,q)
Fig. 4.8 Server selection byDENS metric according to itsload and communicationalpotential
4.4 Conclusions
The cost and operating expenses of data centers are becoming a growing concernas cloud computing industry is booming. The challenge of energy efficiencyallows maintaining the same data center performance while the level of energyconsumption is reduced. This can not only significantly reduce costs of operatingthe IT equipment and cooling but also increase server density enlarging the capacityof existing data center facilities.
To understand the optimization space we surveyed energy consumption modelsof computing servers, network switches, and communication links. Thereafter, maintechniques for energy efficiency, like DVFS or dynamic shut-down, are studiedat both the component and system levels. It is demonstrated that approachesfor centralized coordination and scheduling are required to achieve satisfactoryoptimization levels. Such coordination should combine traditional scheduling ap-proaches with the awareness of the state of communication equipment and networktraffic footprints. Furthermore, the characteristics of the incoming workloads mustbe taken into account. Currently, GreenCloud simulator and presented energy-aware scheduling approaches are being extended to cover scenarios which includegeographically distributed data centers and renewable sources of energy.
References
1. Brown R, Chan P, Eto J, Jarvis S, Koomey J, Masanet E, Nordman B, Sartor D, ShehabiA, Stanley J, Tschudi B (2007) Report to congress on server and data center energyefficiency: Public law 109–431. Lawrence Berkeley National Laboratory. 1–130. Avail-able at http://www.energystar.gov/ia/partners/prod development/downloads/EPA DatacenterReport Congress Final1.pdf
2. Fan X, Weber W-D, Barroso LA (2007) Power provisioning for a warehouse-sized computer.In: ACM international symposium on computer architecture, San Diego, CA, June 2007
62 D. Kliazovich et al.
3. Raghavendra R, Ranganathan P, Talwar V, Wang Z, Zhu X (2008) No “Power” struggles:coordinated multi-level power management for the data center. In: SIGOPS Oper. Syst. Rev.42(2): 48–59
4. Gartner Group. Available at: http://www.gartner.com/, Accessed Aug 20125. Moore J, Chase J, Ranganathan P, Sharma R (2005) Making scheduling “Cool”: temperature-
aware workload placement in data centers. In: USENIX annual technical conference (ATEC’05). USENIX Association, Berkeley, CA, USA, pp 5–5
6. Horvath T, Abdelzaher T, Skadron K, Liu X (2007) Dynamic voltage scaling in multitier webservers with end-to-end delay control. IEEE Trans Comp 56(4):444–458
7. Chen G, He W, Liu J, Nath S, Rigas L, Xiao L, Zhao F (2008) Energy-aware serverprovisioning and load dispatching for connection-intensive internet services. In: The 5thUSENIX symposium on networked systems design and implementation, Berkeley, CA, USA
8. Liu J, Zhao F, Liu X, He W (2009) Challenges towards elastic power management in internetdata centers. In: Proceedings of the 2nd international workshop on cyber-physical systems(WCPS 2009), in conjunction with ICDCS 2009, Montreal, QC, Canada, June 2009
9. Li B, Li J, Huai J, Wo T, Li Q, Zhong L (2009) EnaCloud: An energy-saving application liveplacement approach for cloud computing environments. In: IEEE international conference oncloud computing, Bangalore, India
10. Shang L, Peh L-S, Jha NK (2003) Dynamic voltage scaling with links for power optimizationof interconnection networks. In: Proceedings of the 9th international symposium on high-performance computer architecture (HPCA ’03). IEEE Computer Society, Washington, DC,USA, pp 91–102.
11. Mahadevan P, Sharma P, Banerjee S, Ranganathan P (2009) Energy aware network operations.In: Proceedings of the 28th IEEE international conference on Computer CommunicationsWorkshops (INFOCOM’09). IEEE Press, Piscataway, NJ, USA, pp 25–30.
12. The Network Simulator ns-2. Available at: http://www.isi.edu/nsnam/ns/, Accessed Aug 201213. Buyya R, Ranjan R, Calheiros RN (2009) Modeling and simulation of scalable cloud comput-
ing environments and the CloudSim toolkit: challenges and opportunities. In: Proceedings ofthe 7th high performance computing and simulation conference, Leipzig, Germany
14. Lim S-H, Sharma B, Nam G, Kim EK, Das CR (2009) MDCSim: a multi-tier data centersimulation, platform. In: IEEE international conference on cluster computing and workshops(CLUSTER). pp 1–9
15. Rawson A, Pfleuger J, Cader T (2008) Green grid data center power efficiency metrics: PUEand DCIE. The Green Grid White Paper #6
16. Wang L, Khan SU (2011) Review of performance metrics for green data centers: a taxonomystudy. The Journal of Supercomputing. Springer US, pp 1–18
17. Cisco Data Center Infrastructure 2.5 Design Guide (2010) Cisco press, March 201018. Thaler D, Hopps C (2000) Multipath issues in unicast and multicast nexthop selection. Internet
Engineering Task Force. Request for Comments 2991, November 2000. Available at http://tools.ietf.org/html/rfc2991
19. IEEE Standard for Information technology-Telecommunications and information exchangebetween systems-Local and metropolitan area networks-Specific requirements Part 3: CarrierSense Multiple Access with Collision Detection (CSMA/CD) Access Method and PhysicalLayer Specifications Amendment 4: Media Access Control Parameters, Physical Layers andManagement Parameters for 40 Gb/s and 100 Gb/s Operation,” IEEE Std 802.3ba-2010 (2010)(Amendment to IEEE Standard 802.3-2008), pp 1–457
20. Christesen S Data center containers. Available at http://www.datacentermap.com/blog/datacenter-container-55.html., Accessed Aug 2012
21. Katz RH (2009) Tech Titans building boom. IEEE Spectrum 46(2):40–5422. Worthen B (2011) Data centers boom. Wall Street Journal. Available at http://online.wsj.com/
article/SB10001424052748704336504576259180354987332.html23. Next generation data center infrastructure. CGI White Paper, 201024. Guo C, Wu H, Tan K, Shiy L, Zhang Y, Luz S (2008) DCell: a scalable and fault-tolerant
network structure for data centers. In: ACM SIGCOMM, Seattle, Washington, DC, USA
4 Simulation and Performance Analysis of Data Intensive and Workload . . . 63
25. Guo C, Lu G, Li D, Wu H, Zhang X, Shi1 Y, Tian C, Zhang1 Y, Lu S (2009) BCube:a high performance, server-centric network architecture for modular data centers. In: ACMSIGCOMM, Barcelona, Spain, 2009
26. Li D, Guo C, Wu H, Tan K, Zhang Y, Lu S (2009) FiConn: using backup port for serverinterconnection in data centers. In: IEEE INFOCOM 2009, pp 2276–2285
27. Liao Y, Yin D, Gao L (2010) DPillar: scalable dual-port server interconnection for data centernetworks. In: 2010 Proceedings of 19th International Conference on computer communicationsand networks (ICCCN), pp 1–6
28. Kliazovich D, Bouvry P, Khan SU (2010) GreenCloud: a packet-level simulator of energy-aware cloud computing data centers. The Journal of Supercomputing. pp 1–21
29. Chen Y, Das A, Qin W, Sivasubramaniam A, Wang Q, Gautam N (2005) Managing serverenergy and operational costs in hosting centers. In: Proceedings of the ACM SIGMETRICSinternational conference on Measurement and modeling of computer systems. ACM, NewYork, pp 303–314
30. Farrington N, Rubow E, Vahdat A (2009) Data center switch architecture in the age of merchantsilicon. In Proceedings of the 17th IEEE symposium on high performance interconnects(HOTI ‘09). IEEE Computer Society, Washington, DC, USA, pp 93–102
31. Greenberg A, Lahiri P, Maltz DA, Patel P, Sengupta S (2008) Towards a next generation datacenter architecture: scalability and commoditization. In: Proceedings of the ACM workshop onprogrammable routers for extensible services of tomorrow, Seattle, WA, USA
32. Mahadevan P, Sharma P, Banerjee S, Ranganathan P (2009) A power benchmarking frameworkfor network devices. In: Proceedings of the 8th international IFIP-TC 6 networking conference,Aachen, Germany 2009
33. Garrison S, Oliva V, Lee G, Hays R (2008) Data center bridging, Ethernet Alliance. Availableat http://www.ethernetalliance.org/wp-content/uploads/2011/10/Data-Center-Bridging1.pdf
34. AlizadehM, Atikoglu B, Kabbani A, Lakshmikantha A, Pan R, Prabhakar B, Seaman M (2008)Data center transport mechanisms: Congestion control theory and IEEE standardization. In:Annual Allerton conference on communication, control, and computing, pp 1270–1277.
35. IEEE 802.1 Data Center Bridging Task Group. Available at: http://www.ieee802.org/1/pages/dcbridges.html, Accessed Aug 2012
36. Song Y, Wang H, Li Y, Feng B, Sun Y (2009) Multi-tiered on-demand resource scheduling forVM-based data center. In: IEEE/ACM international symposium on cluster computing and thegrid (CCGRID), pp 148–155
37. Kliazovich D, Bouvry P, Khan SU (2011) DENS: Data center energy-efficient network-awarescheduling. Cluster Computing, Springer US, pp 1–11.
38. Kopparapu C (2002) Load balancing servers, firewalls, and caches. Wiley, New York