chapter 4 study area, field investigations and results
TRANSCRIPT
Chapter 4
STUDY AREA, FIELD INVESTIGATIONS AND RESULTS
4.1 STUDY AREA
The present research study is divided into two parts. 44 in-service urban roads
distributed in the five Corporations of the State were selected for the first part of the
study. The data on the sub grade soil properties and deflection characteristics of 68
stretches in these urban settings were collected for analysis and development of
relationships with pavement condition, soil properties and deflection. The findings
based on the analysis of the results and plots are discussed in Chapter 5.
The second part of the study focuses on to develop pavement deterioration models
applicable to Kerala conditions using time series data. Eight road sections representing
NH, SH and MDR with variation in traffic composition, soil properties, climate,
drainage characteristics and land use were selected. Periodic data were collected from
the field. The plots and developed models are described in Chapter 6.
4.1.1 Urban Roads selected for the study
From a preliminary study of the traffic and condition of the roads, 44 road sections were
selected from five corporations namely Thiruvananthapuram, Kollam, Kochi, Thrissur
and Kozhikkode. The roads were selected based on a preliminary assessment of the road
condition, traffic, importance of the road, variations in soil type, climatic conditions and
terrain. These roads were again divided into 68 homogeneous sections for further
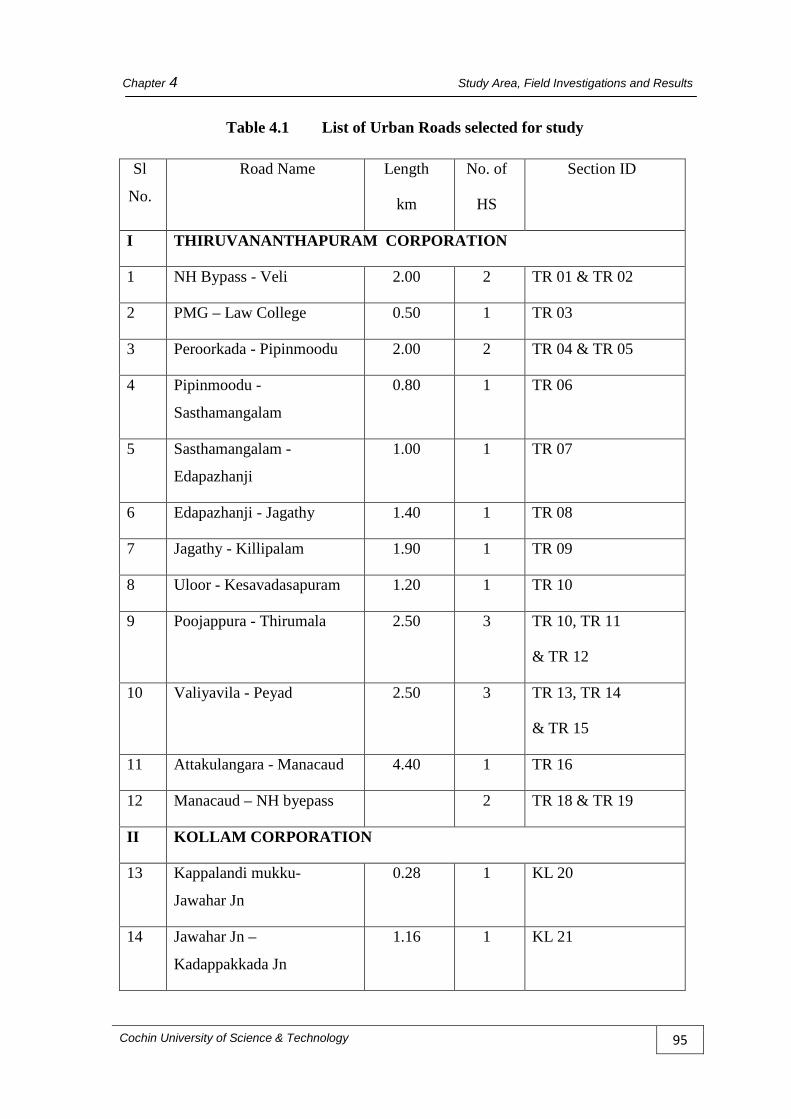
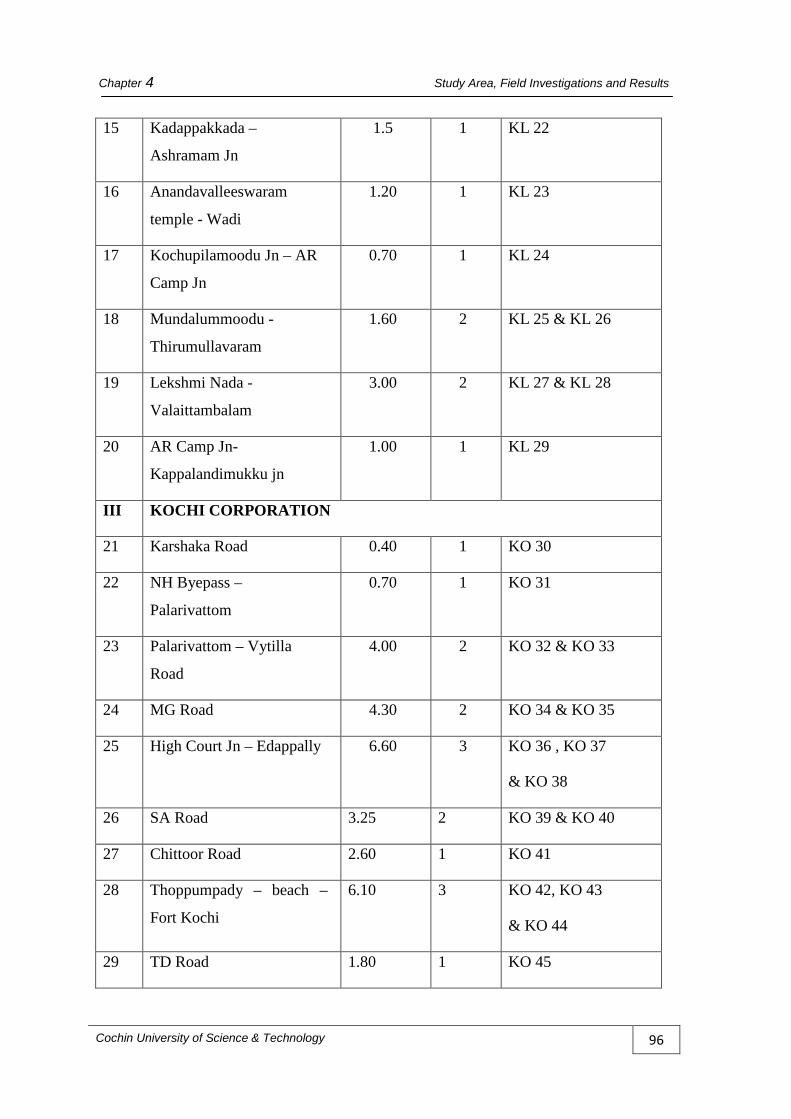
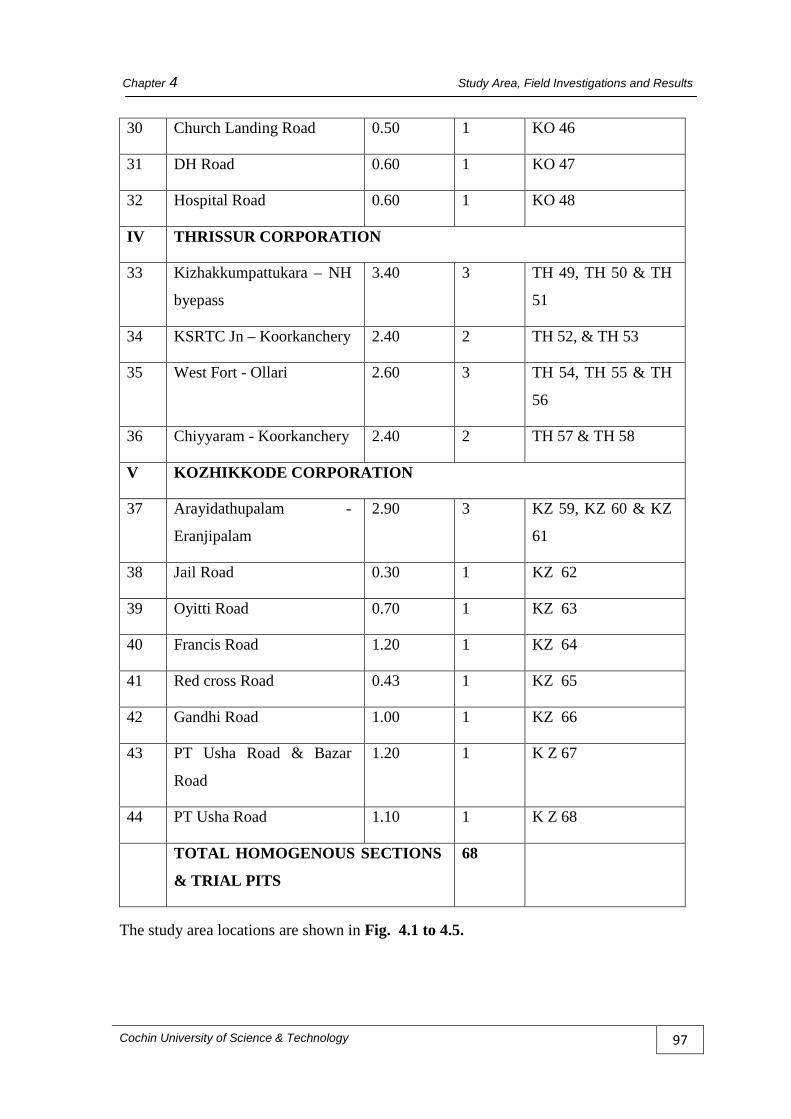
studies. The list of roads is given in Table 4.1.
Cochin University of Science & Technology 94
Chapter 4 Study Area, Field Investigations and Results
Table 4.1 List of Urban Roads selected for study
Sl
No.
Road Name Length
km
No. of
HS
Section ID
I THIRUVANANTHAPURAM CORPORATION
1 NH Bypass - Veli 2.00 2 TR 01 & TR 02
2 PMG – Law College 0.50 1 TR 03
3 Peroorkada - Pipinmoodu 2.00 2 TR 04 & TR 05
4 Pipinmoodu -
Sasthamangalam
0.80 1 TR 06
5 Sasthamangalam -
Edapazhanji
1.00 1 TR 07
6 Edapazhanji - Jagathy 1.40 1 TR 08
7 Jagathy - Killipalam 1.90 1 TR 09
8 Uloor - Kesavadasapuram 1.20 1 TR 10
9 Poojappura - Thirumala 2.50 3 TR 10, TR 11
& TR 12
10 Valiyavila - Peyad 2.50 3 TR 13, TR 14
& TR 15
11 Attakulangara - Manacaud 4.40 1 TR 16
12 Manacaud – NH byepass 2 TR 18 & TR 19
II KOLLAM CORPORATION
13 Kappalandi mukku-
Jawahar Jn
0.28 1 KL 20
14 Jawahar Jn –
Kadappakkada Jn
1.16 1 KL 21
Cochin University of Science & Technology 95
Chapter 4 Study Area, Field Investigations and Results
15 Kadappakkada –
Ashramam Jn
1.5 1 KL 22
16 Anandavalleeswaram
temple - Wadi
1.20 1 KL 23
17 Kochupilamoodu Jn – AR
Camp Jn
0.70 1 KL 24
18 Mundalummoodu -
Thirumullavaram
1.60 2 KL 25 & KL 26
19 Lekshmi Nada -
Valaittambalam
3.00 2 KL 27 & KL 28
20 AR Camp Jn-
Kappalandimukku jn
1.00 1 KL 29
III KOCHI CORPORATION
21 Karshaka Road 0.40 1 KO 30
22 NH Byepass –
Palarivattom
0.70 1 KO 31
23 Palarivattom – Vytilla
Road
4.00 2 KO 32 & KO 33
24 MG Road 4.30 2 KO 34 & KO 35
25 High Court Jn – Edappally 6.60 3 KO 36 , KO 37
& KO 38
26 SA Road 3.25 2 KO 39 & KO 40
27 Chittoor Road 2.60 1 KO 41
28 Thoppumpady – beach –
Fort Kochi
6.10 3 KO 42, KO 43
& KO 44
29 TD Road 1.80 1 KO 45
Cochin University of Science & Technology 96
Chapter 4 Study Area, Field Investigations and Results
30 Church Landing Road 0.50 1 KO 46
31 DH Road 0.60 1 KO 47
32 Hospital Road 0.60 1 KO 48
IV THRISSUR CORPORATION
33 Kizhakkumpattukara – NH
byepass
3.40 3 TH 49, TH 50 & TH
51
34 KSRTC Jn – Koorkanchery 2.40 2 TH 52, & TH 53
35 West Fort - Ollari 2.60 3 TH 54, TH 55 & TH
56
36 Chiyyaram - Koorkanchery 2.40 2 TH 57 & TH 58
V KOZHIKKODE CORPORATION
37 Arayidathupalam -
Eranjipalam
2.90 3 KZ 59, KZ 60 & KZ
61
38 Jail Road 0.30 1 KZ 62
39 Oyitti Road 0.70 1 KZ 63
40 Francis Road 1.20 1 KZ 64
41 Red cross Road 0.43 1 KZ 65
42 Gandhi Road 1.00 1 KZ 66
43 PT Usha Road & Bazar
Road
1.20 1 K Z 67
44 PT Usha Road 1.10 1 K Z 68
TOTAL HOMOGENOUS SECTIONS
& TRIAL PITS
68
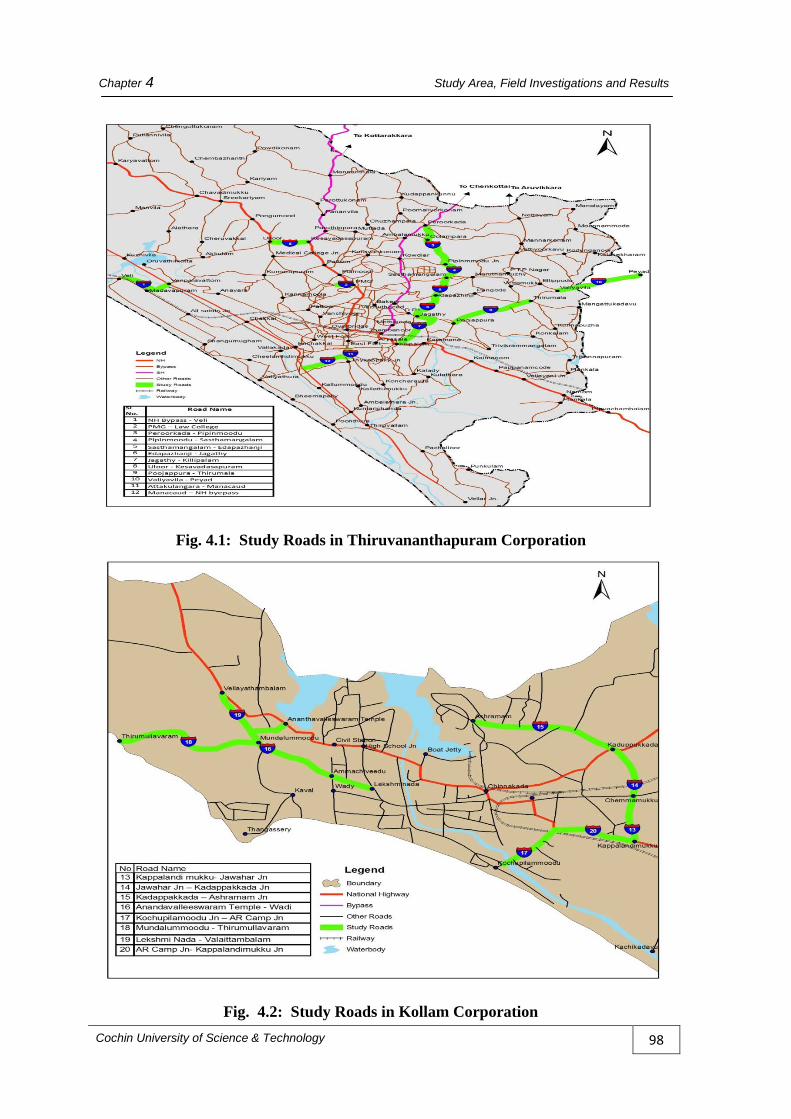
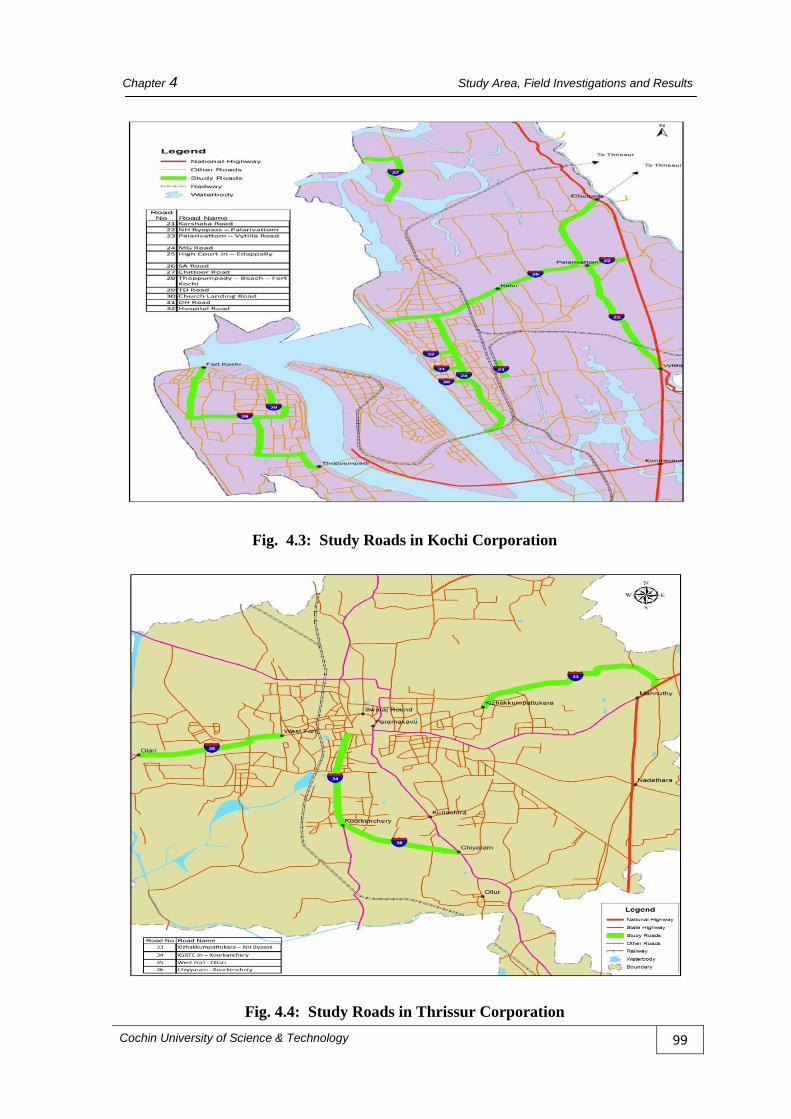
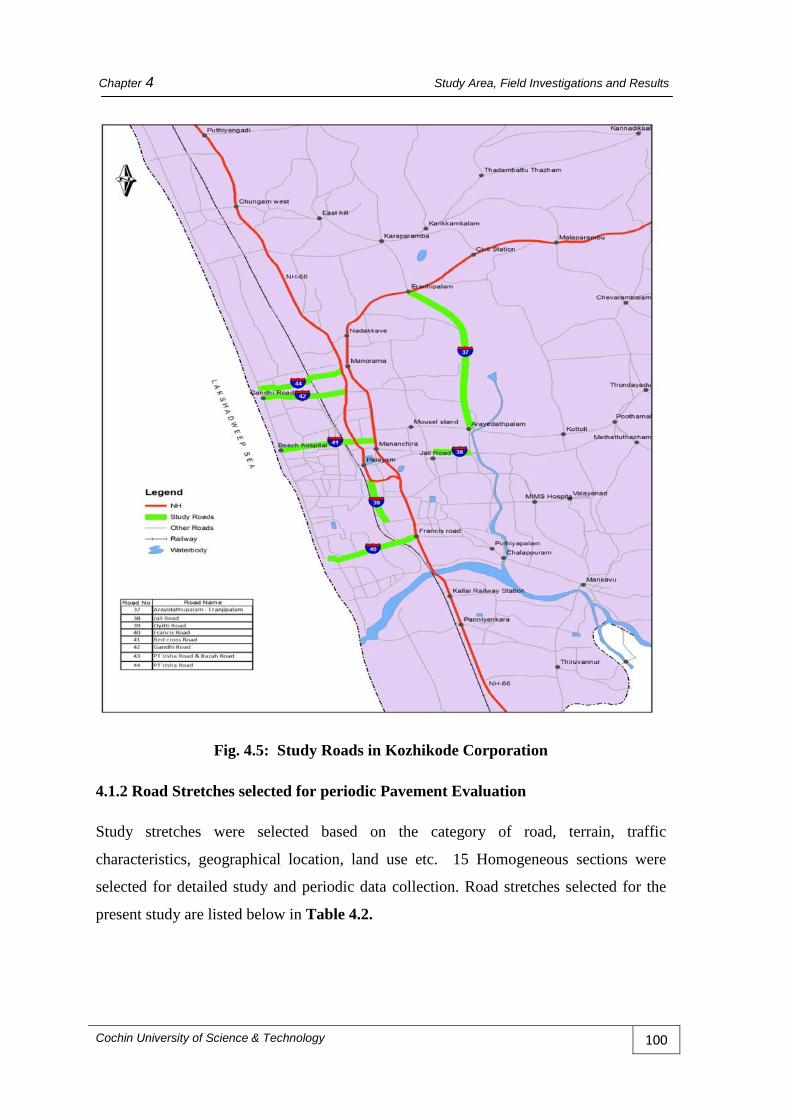
The study area locations are shown in Fig. 4.1 to 4.5.
Cochin University of Science & Technology 97
Chapter 4 Study Area, Field Investigations and Results
Fig. 4.1: Study Roads in Thiruvananthapuram Corporation
Fig. 4.2: Study Roads in Kollam Corporation Cochin University of Science & Technology 98
Chapter 4 Study Area, Field Investigations and Results
Fig. 4.3: Study Roads in Kochi Corporation
Fig. 4.4: Study Roads in Thrissur Corporation Cochin University of Science & Technology 99
Chapter 4 Study Area, Field Investigations and Results
Fig. 4.5: Study Roads in Kozhikode Corporation
4.1.2 Road Stretches selected for periodic Pavement Evaluation
Study stretches were selected based on the category of road, terrain, traffic
characteristics, geographical location, land use etc. 15 Homogeneous sections were
selected for detailed study and periodic data collection. Road stretches selected for the
present study are listed below in Table 4.2.
Cochin University of Science & Technology 100
Chapter 4 Study Area, Field Investigations and Results
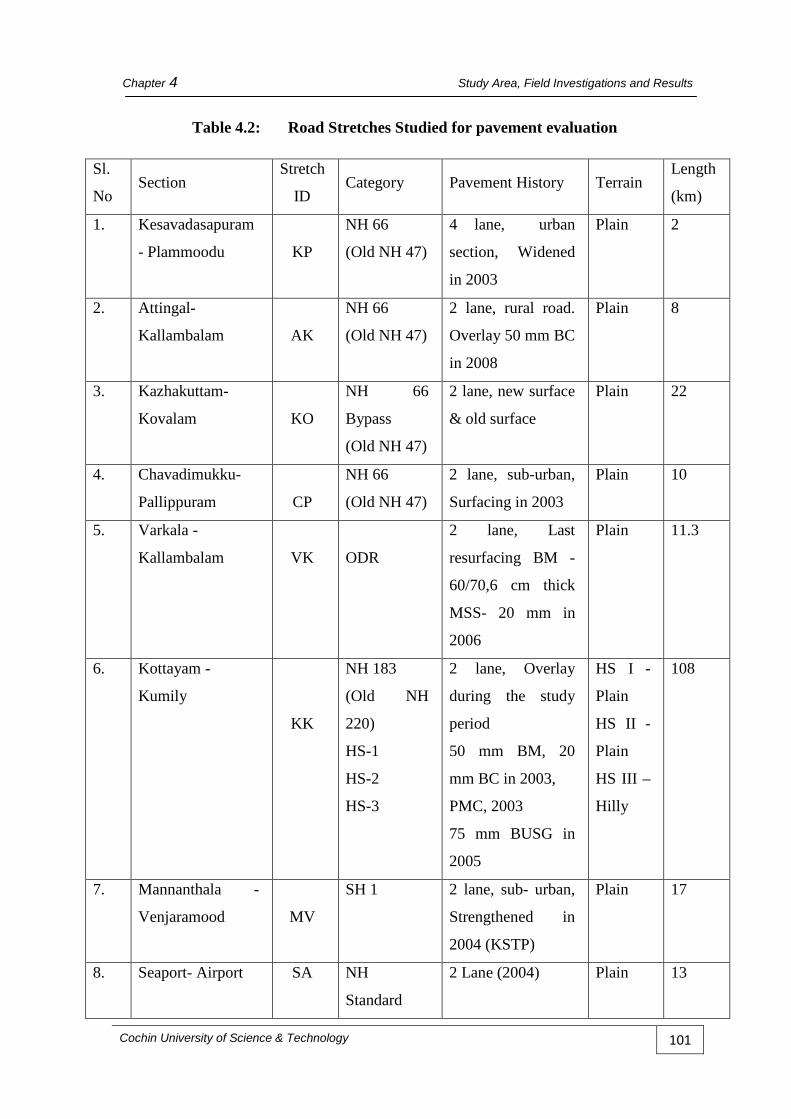
Table 4.2: Road Stretches Studied for pavement evaluation
Sl.
No Section
Stretch
ID Category Pavement History Terrain
Length
(km)
1. Kesavadasapuram
- Plammoodu
KP
NH 66
(Old NH 47)
4 lane, urban
section, Widened
in 2003
Plain 2
2. Attingal-
Kallambalam
AK
NH 66
(Old NH 47)
2 lane, rural road.
Overlay 50 mm BC
in 2008
Plain 8
3. Kazhakuttam-
Kovalam
KO
NH 66
Bypass
(Old NH 47)
2 lane, new surface
& old surface
Plain 22
4. Chavadimukku-
Pallippuram
CP
NH 66
(Old NH 47)
2 lane, sub-urban,
Surfacing in 2003
Plain 10
5. Varkala -
Kallambalam
VK
ODR
2 lane, Last
resurfacing BM -
60/70,6 cm thick
MSS- 20 mm in
2006
Plain 11.3
6. Kottayam -
Kumily
KK
NH 183
(Old NH
220)
HS-1
HS-2
HS-3
2 lane, Overlay
during the study
period
50 mm BM, 20
mm BC in 2003,
PMC, 2003
75 mm BUSG in
2005
HS I -
Plain
HS II -
Plain
HS III –
Hilly
108
7. Mannanthala -
Venjaramood
MV
SH 1 2 lane, sub- urban,
Strengthened in
2004 (KSTP)
Plain 17
8. Seaport- Airport SA NH
Standard
2 Lane (2004) Plain 13
Cochin University of Science & Technology 101
Chapter 4 Study Area, Field Investigations and Results
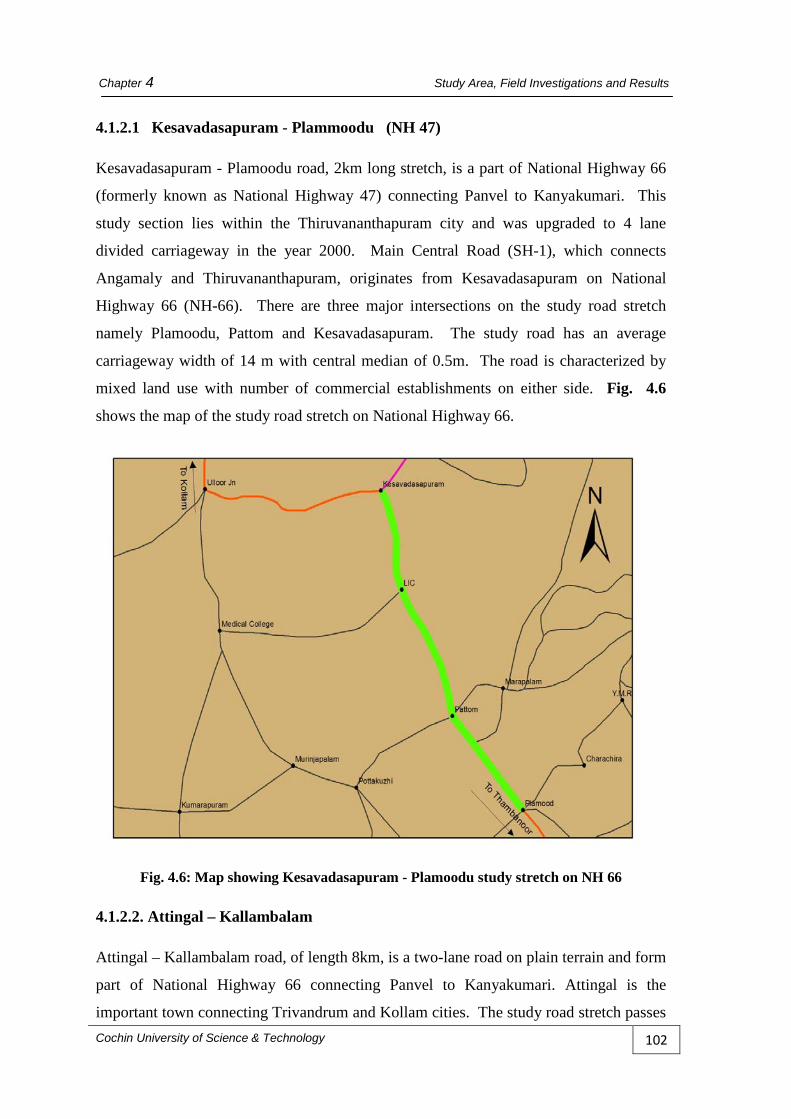
4.1.2.1 Kesavadasapuram - Plammoodu (NH 47)
Kesavadasapuram - Plamoodu road, 2km long stretch, is a part of National Highway 66
(formerly known as National Highway 47) connecting Panvel to Kanyakumari. This
study section lies within the Thiruvananthapuram city and was upgraded to 4 lane
divided carriageway in the year 2000. Main Central Road (SH-1), which connects
Angamaly and Thiruvananthapuram, originates from Kesavadasapuram on National
Highway 66 (NH-66). There are three major intersections on the study road stretch
namely Plamoodu, Pattom and Kesavadasapuram. The study road has an average
carriageway width of 14 m with central median of 0.5m. The road is characterized by
mixed land use with number of commercial establishments on either side. Fig. 4.6
shows the map of the study road stretch on National Highway 66.
Fig. 4.6: Map showing Kesavadasapuram - Plamoodu study stretch on NH 66
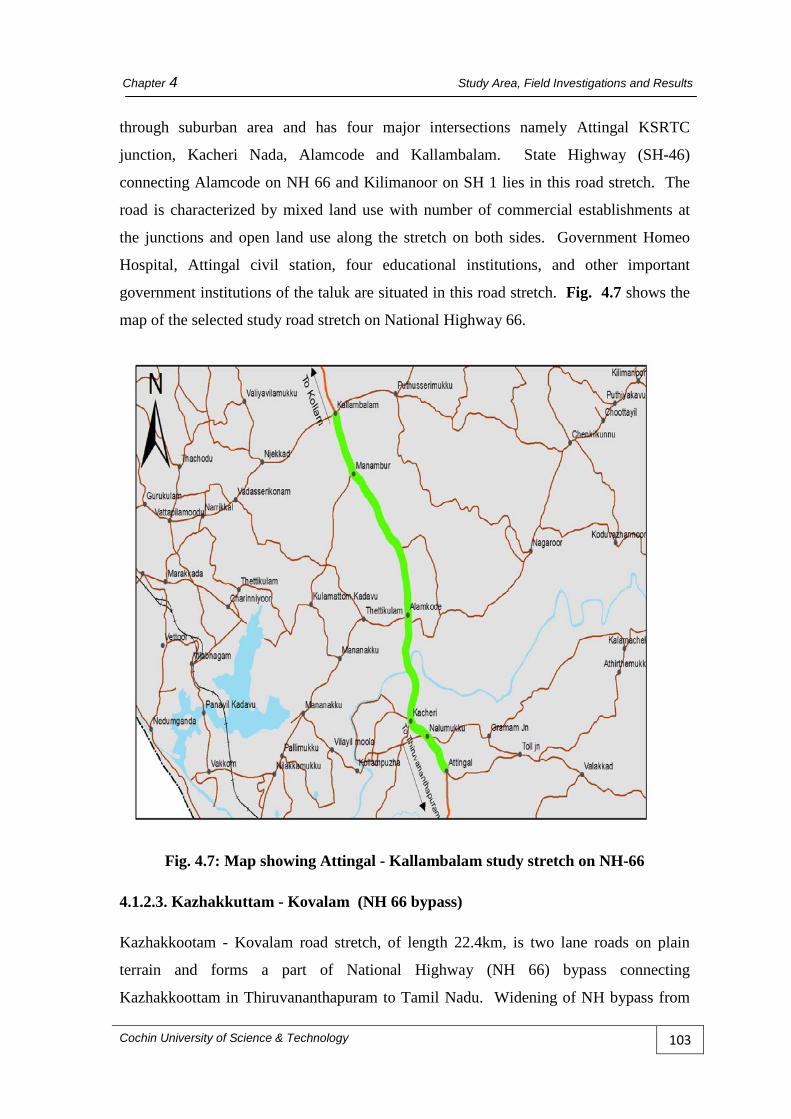
4.1.2.2. Attingal – Kallambalam
Attingal – Kallambalam road, of length 8km, is a two-lane road on plain terrain and form
part of National Highway 66 connecting Panvel to Kanyakumari. Attingal is the
important town connecting Trivandrum and Kollam cities. The study road stretch passes Cochin University of Science & Technology 102
Chapter 4 Study Area, Field Investigations and Results
through suburban area and has four major intersections namely Attingal KSRTC
junction, Kacheri Nada, Alamcode and Kallambalam. State Highway (SH-46)
connecting Alamcode on NH 66 and Kilimanoor on SH 1 lies in this road stretch. The
road is characterized by mixed land use with number of commercial establishments at
the junctions and open land use along the stretch on both sides. Government Homeo
Hospital, Attingal civil station, four educational institutions, and other important
government institutions of the taluk are situated in this road stretch. Fig. 4.7 shows the
map of the selected study road stretch on National Highway 66.
Fig. 4.7: Map showing Attingal - Kallambalam study stretch on NH-66
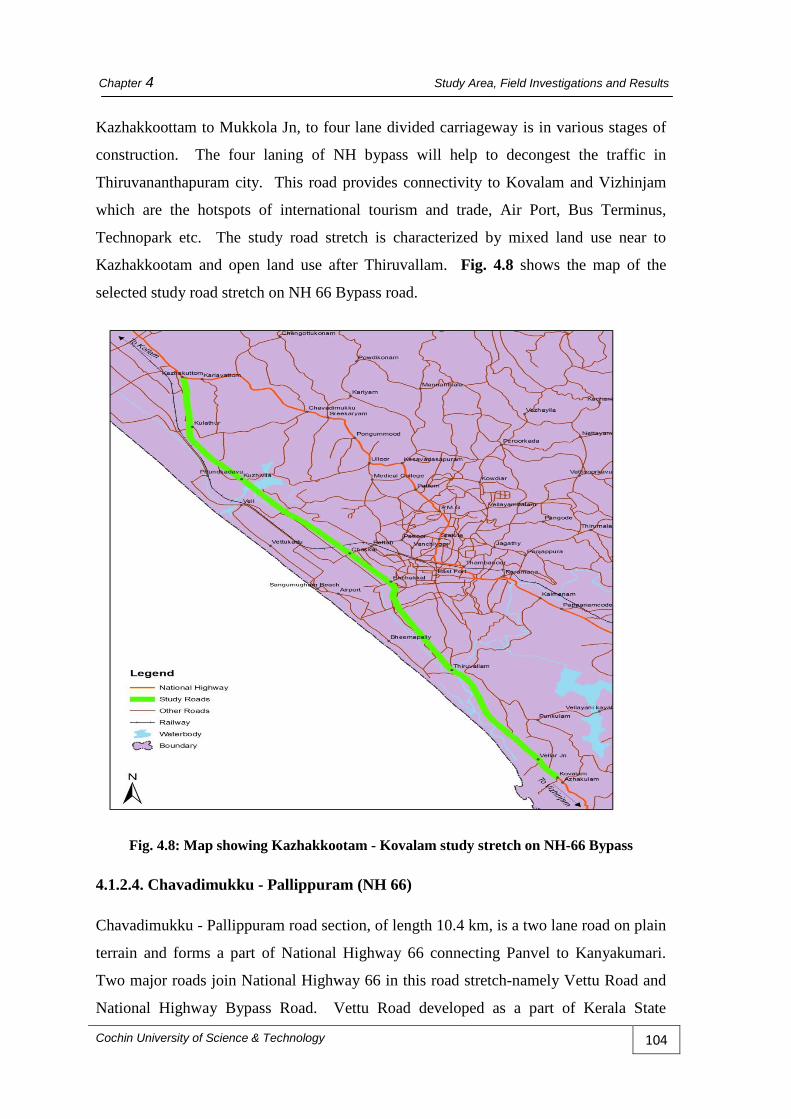
4.1.2.3. Kazhakkuttam - Kovalam (NH 66 bypass)
Kazhakkootam - Kovalam road stretch, of length 22.4km, is two lane roads on plain
terrain and forms a part of National Highway (NH 66) bypass connecting
Kazhakkoottam in Thiruvananthapuram to Tamil Nadu. Widening of NH bypass from
Cochin University of Science & Technology 103
Chapter 4 Study Area, Field Investigations and Results
Kazhakkoottam to Mukkola Jn, to four lane divided carriageway is in various stages of
construction. The four laning of NH bypass will help to decongest the traffic in
Thiruvananthapuram city. This road provides connectivity to Kovalam and Vizhinjam
which are the hotspots of international tourism and trade, Air Port, Bus Terminus,
Technopark etc. The study road stretch is characterized by mixed land use near to
Kazhakkootam and open land use after Thiruvallam. Fig. 4.8 shows the map of the
selected study road stretch on NH 66 Bypass road.
Fig. 4.8: Map showing Kazhakkootam - Kovalam study stretch on NH-66 Bypass
4.1.2.4. Chavadimukku - Pallippuram (NH 66)
Chavadimukku - Pallippuram road section, of length 10.4 km, is a two lane road on plain
terrain and forms a part of National Highway 66 connecting Panvel to Kanyakumari.
Two major roads join National Highway 66 in this road stretch-namely Vettu Road and
National Highway Bypass Road. Vettu Road developed as a part of Kerala State
Cochin University of Science & Technology 104

Chapter 4 Study Area, Field Investigations and Results
Transport Project (KSTP) connects Main central road (SH-1) with National Highway-66.
National Highway Bypass road starts from Kazhakootam in Thiruvananthapuram and
terminates at Kovalam. Major intersections in this road stretch are Chavadimukku,
Kariyavattom, Kazhakkootam, Vettu Road Junction, and Pallippuram. The proposed
alignment for monorail for Thiruvananthapuram city passes through this study road
stretch and terminates at Pallippuram. In addition to Kariavattom University campus and
Technopark, the International Multi-Purpose Greenfield Stadium at Kariyavattom and
Technocity at Pallippuram are the two major projects under construction in this road
stretch. The land use is characterized by mixed land use on either sides of the road
throughout the study stretch. Fig. 4.9 shows the map of the selected study road stretch
on National Highway 66.
Fig. 4.9: Map showing Chavadimukku - Pallippuram study stretch on NH-66
4.1.2.5. Kallambalam - Varkala
Kallambalam - Varkala road, of length 11.3 km, is a two lane road comes under the
category of Other District Road (ODR). This road stretch provides connectivity to
popular tourist spots, Varkala beach and Sivagiri Maddam with National Highway 66.
Varkala - Madathara road (SH-64) crosses National Highway 66 at Parippally and Cochin University of Science & Technology 105

Chapter 4 Study Area, Field Investigations and Results
terminates in the study road stretch. Varkala railway station is located near to
Kallambalam-Varkala road. Major intersections in this road stretch are Kallambalam,
Njekkad, Narikkal, Naalumukku and Railway station road junction. Map of the selected
study road stretch is shown in Fig. 4.10.
Fig. 4.10: Map showing Kallambalam - Varkala study stretch
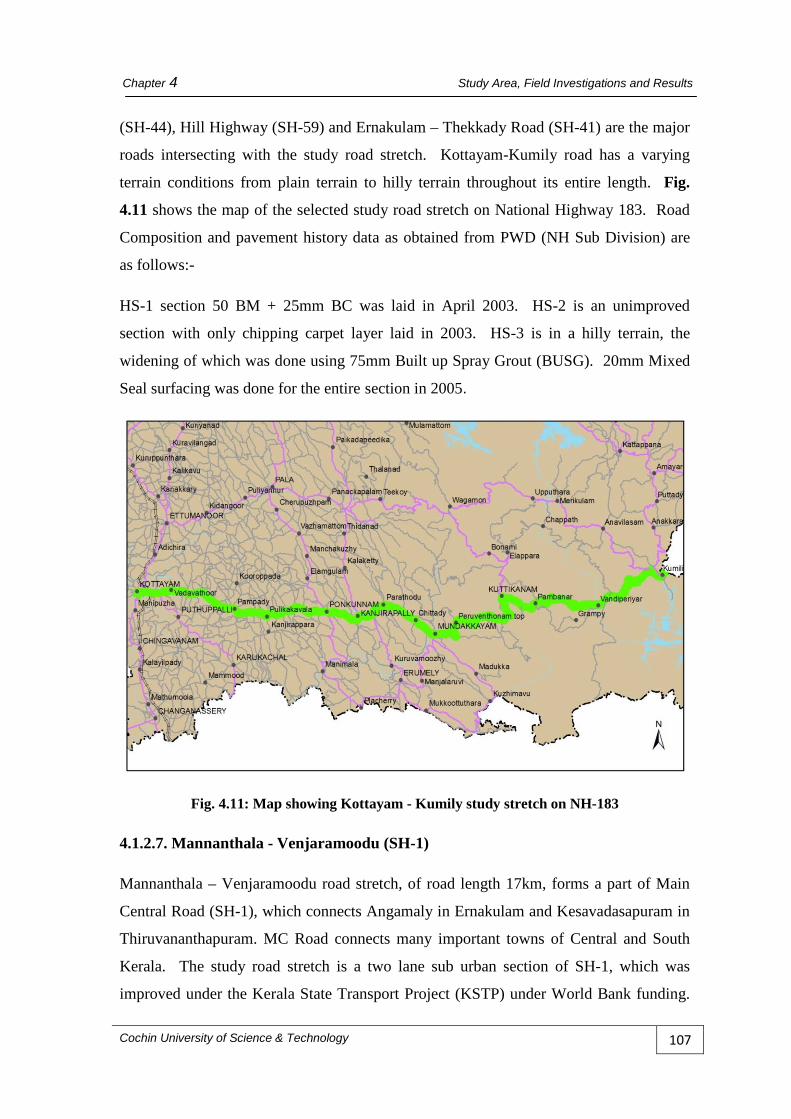
4.1.2.6. Kottayam-Kumily Road (NH 183)
Kottayam-Kumily road (108km) is a two lane road and forms a part of National
Highway 183 (formerly known as NH 220), which connects Kollam in Kerala with
Dindigul in Tamil Nadu. The study road stretch starts from Kottayam and runs along the
northern border of Periyar Wildlife Sanctuary connecting Kanjirappally, Peerumade,
Vandiperiyar and terminates at Kumily. Kottayam-Kozhencherry road (SH-9), Main
Eastern Highway (Punalur Muvattupuzha Road – SH8), Sabarimala – Kodaikkanal Road
Cochin University of Science & Technology 106
Chapter 4 Study Area, Field Investigations and Results
(SH-44), Hill Highway (SH-59) and Ernakulam – Thekkady Road (SH-41) are the major
roads intersecting with the study road stretch. Kottayam-Kumily road has a varying
terrain conditions from plain terrain to hilly terrain throughout its entire length. Fig.
4.11 shows the map of the selected study road stretch on National Highway 183. Road
Composition and pavement history data as obtained from PWD (NH Sub Division) are
as follows:-
HS-1 section 50 BM + 25mm BC was laid in April 2003. HS-2 is an unimproved
section with only chipping carpet layer laid in 2003. HS-3 is in a hilly terrain, the
widening of which was done using 75mm Built up Spray Grout (BUSG). 20mm Mixed
Seal surfacing was done for the entire section in 2005.
Fig. 4.11: Map showing Kottayam - Kumily study stretch on NH-183
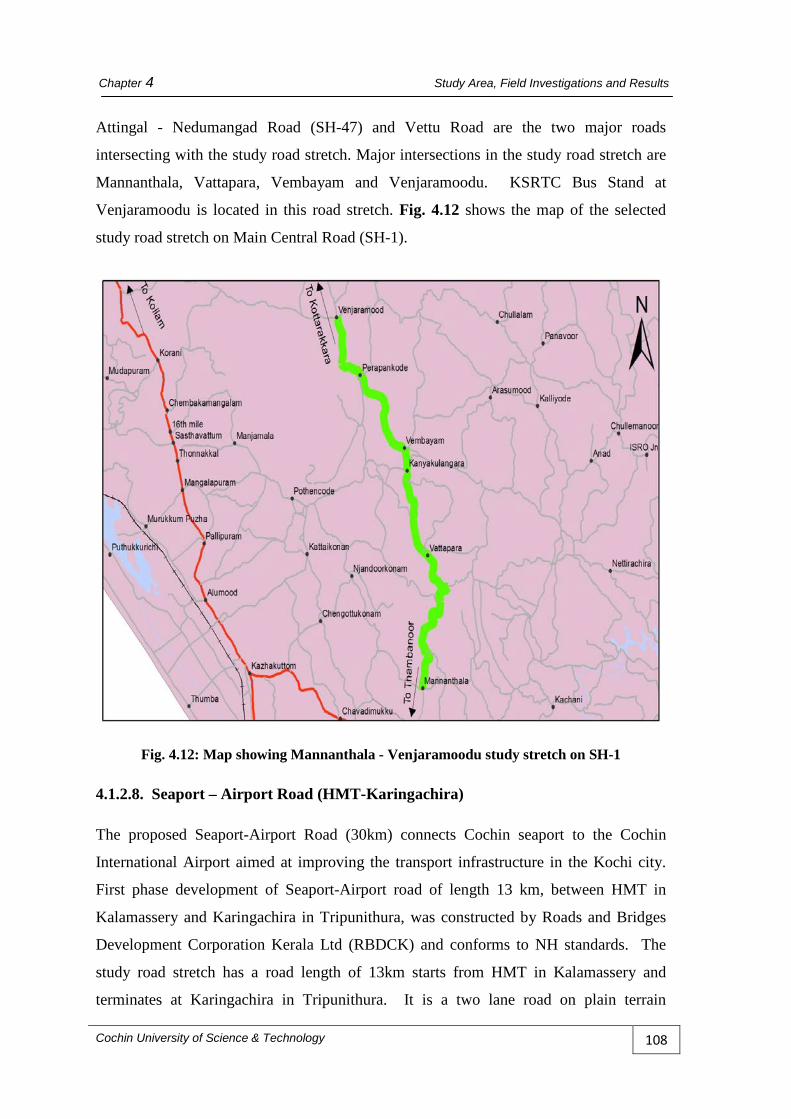
4.1.2.7. Mannanthala - Venjaramoodu (SH-1)
Mannanthala – Venjaramoodu road stretch, of road length 17km, forms a part of Main
Central Road (SH-1), which connects Angamaly in Ernakulam and Kesavadasapuram in
Thiruvananthapuram. MC Road connects many important towns of Central and South
Kerala. The study road stretch is a two lane sub urban section of SH-1, which was
improved under the Kerala State Transport Project (KSTP) under World Bank funding.
Cochin University of Science & Technology 107
Chapter 4 Study Area, Field Investigations and Results
Attingal - Nedumangad Road (SH-47) and Vettu Road are the two major roads
intersecting with the study road stretch. Major intersections in the study road stretch are
Mannanthala, Vattapara, Vembayam and Venjaramoodu. KSRTC Bus Stand at
Venjaramoodu is located in this road stretch. Fig. 4.12 shows the map of the selected
study road stretch on Main Central Road (SH-1).
Fig. 4.12: Map showing Mannanthala - Venjaramoodu study stretch on SH-1
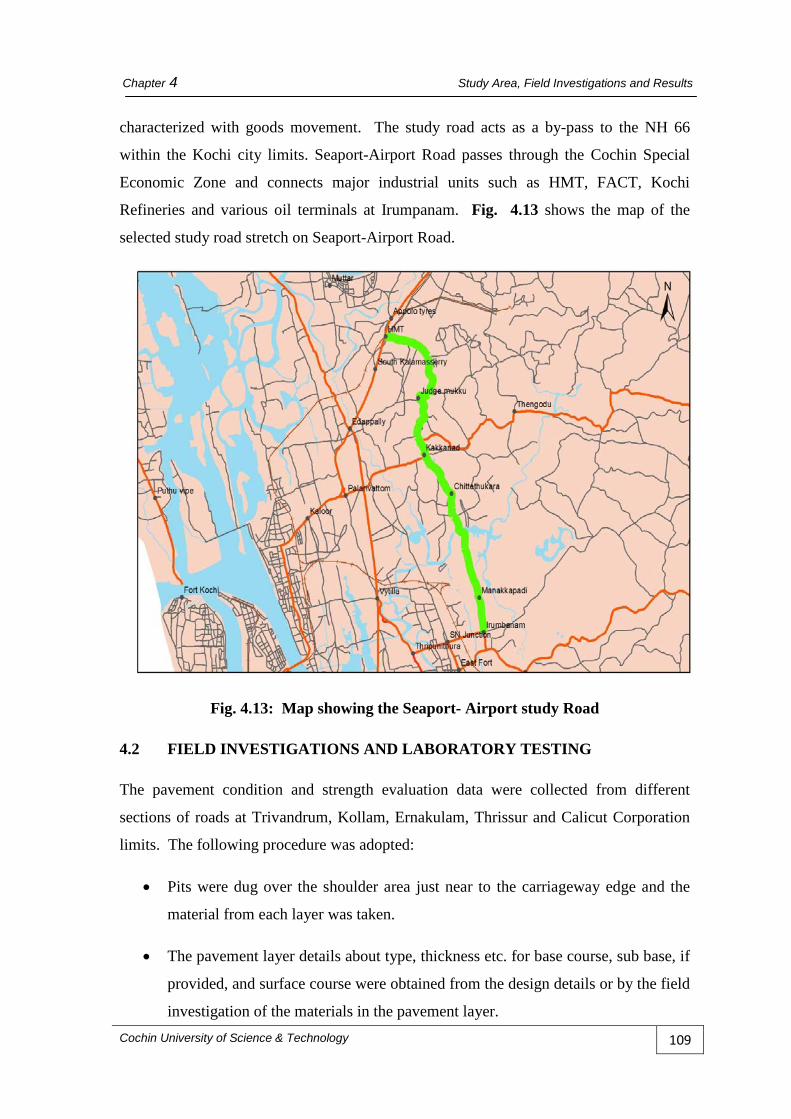
4.1.2.8. Seaport – Airport Road (HMT-Karingachira)
The proposed Seaport-Airport Road (30km) connects Cochin seaport to the Cochin
International Airport aimed at improving the transport infrastructure in the Kochi city.
First phase development of Seaport-Airport road of length 13 km, between HMT in
Kalamassery and Karingachira in Tripunithura, was constructed by Roads and Bridges
Development Corporation Kerala Ltd (RBDCK) and conforms to NH standards. The
study road stretch has a road length of 13km starts from HMT in Kalamassery and
terminates at Karingachira in Tripunithura. It is a two lane road on plain terrain
Cochin University of Science & Technology 108
Chapter 4 Study Area, Field Investigations and Results
characterized with goods movement. The study road acts as a by-pass to the NH 66
within the Kochi city limits. Seaport-Airport Road passes through the Cochin Special
Economic Zone and connects major industrial units such as HMT, FACT, Kochi
Refineries and various oil terminals at Irumpanam. Fig. 4.13 shows the map of the
selected study road stretch on Seaport-Airport Road.
Fig. 4.13: Map showing the Seaport- Airport study Road
4.2 FIELD INVESTIGATIONS AND LABORATORY TESTING
The pavement condition and strength evaluation data were collected from different
sections of roads at Trivandrum, Kollam, Ernakulam, Thrissur and Calicut Corporation
limits. The following procedure was adopted:
• Pits were dug over the shoulder area just near to the carriageway edge and the
material from each layer was taken.
• The pavement layer details about type, thickness etc. for base course, sub base, if
provided, and surface course were obtained from the design details or by the field
investigation of the materials in the pavement layer. Cochin University of Science & Technology 109
Chapter 4 Study Area, Field Investigations and Results
• The soil material from the sub grade layer was subjected to sieve analysis and
tests for determining Atterberg limits to determine the plasticity indices. The soil
types were assigned depending upon the percentage of particle size in the
material and the liquid limits. The material was then subjected to compaction
test for determining the Optimum Moisture Content (OMC) and maximum dry
density.
• The field dry density and field moisture content of the soil material were
determined by Sand Replacement Method and calcium carbide method.
• CBR values were also determined in the laboratory.
• The deflection of the pavements was measured using Benkelman Beam
Deflection (BBD) method.
• Condition Survey of the pavements were done to collect the details of cracks,
potholes, patching and other defects and represented as per IRC guidelines.
4.3 RESULTS
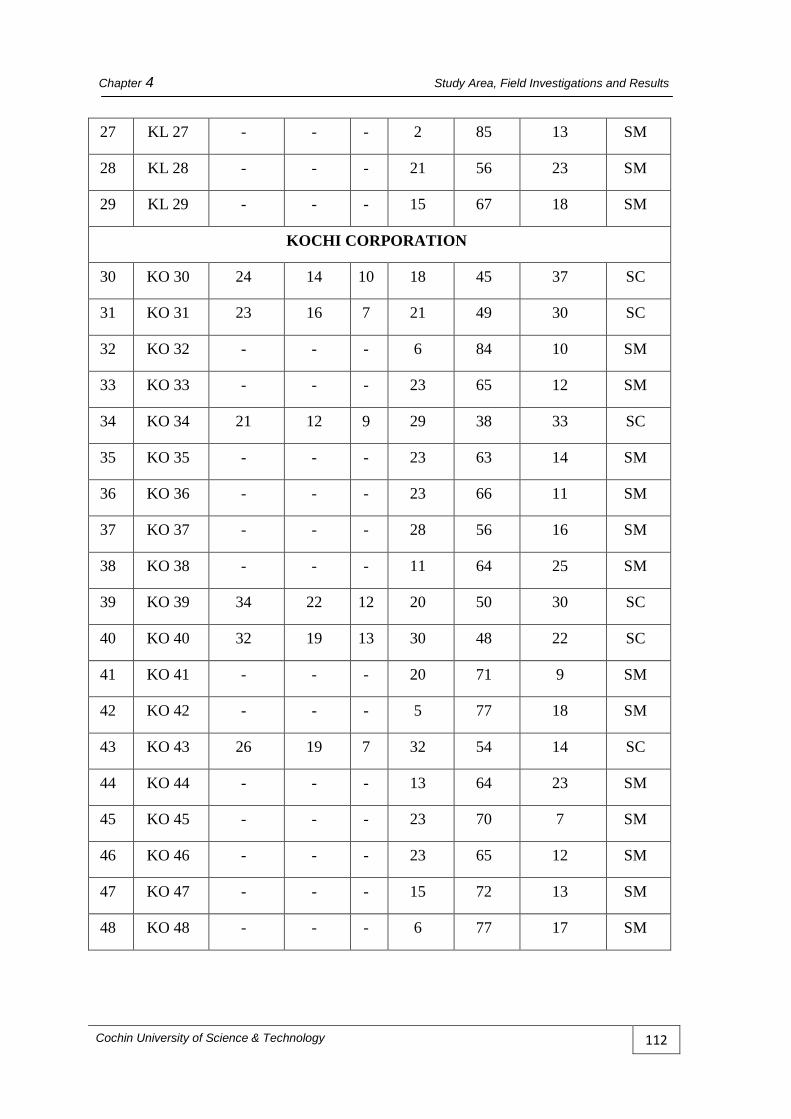
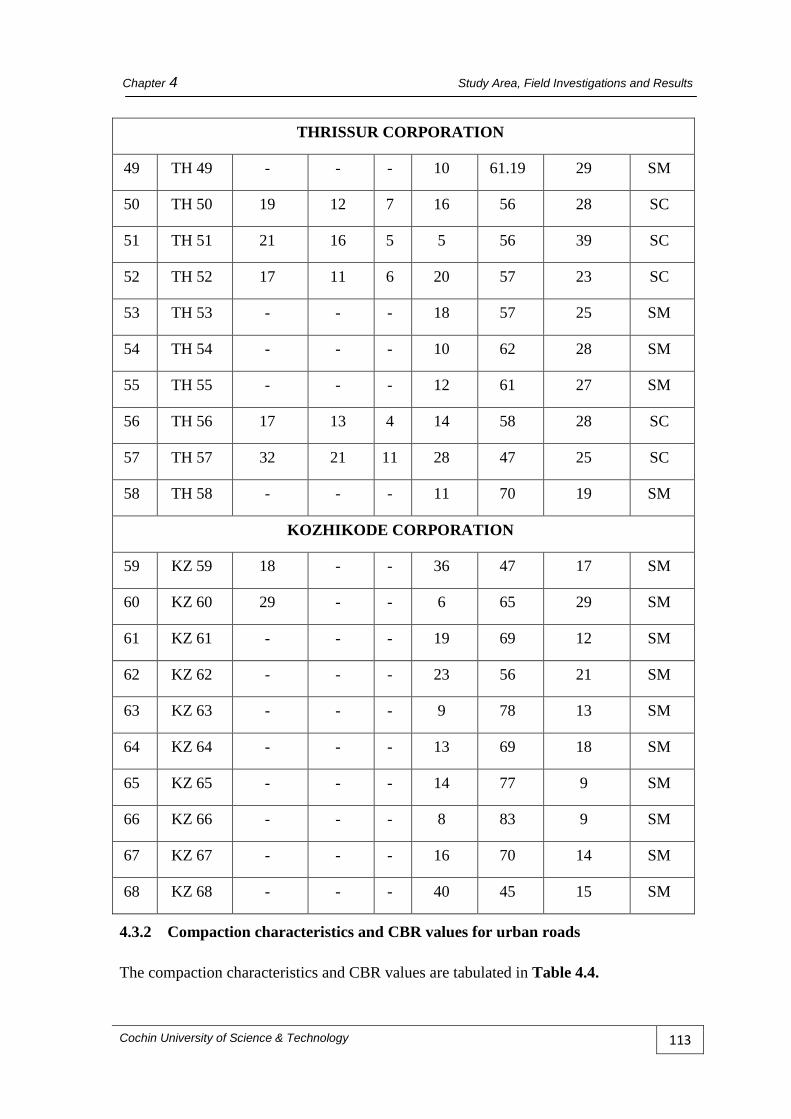
4.3.1 Subgrade soil properties for urban roads
The results of the sub grade soil analysis are given in Table 4.3. The values indicated
that the soil predominantly belong to SC and SM class.
Table 4.3 Subgrade Soil Properties for urban roads
Sl.
No
Section
ID
LL
(%)
PL
(%)
PI
Grain size Distribution
Soil
Type Gravel
(%)
Sand
(%)
Silt & Clay
(%)
THIRUVANANTHAPURAM CORPORATION
1 TR 01 - - - 11 70 19 SM
2 TR 02 36 20 16 20 36. 44 SC
3 TR 03 33 18 15 31 40 29 SC
Cochin University of Science & Technology 110
Chapter 4 Study Area, Field Investigations and Results
4 TR 04 16 9 7 16 64 20 SC
5 TR 05 47 32 15 17 48 35 SC
6 TR 06 52 35 17 40 33 27 SC
7 TR 07 15 - - 27 49 24 SM
8 TR 08 - - - 6 66 28 SM
9 TR 09 30 21 9 24 44 32 SC
10 TR 10 36 18 18 24 46 30 SC
11 TR 11 24 14 10 15 57 28 SC
12 TR 12 23 17 6 37 41 22 SC
13 TR 13 18 10 8 23 57 20 SC
14 TR 14 21 12 9 5 56 39 SC
15 TR 15 15 - - 12 58 30 SM
16 TR 16 25 15 10 15 55 30 SC
17 TR 17 18 - - 20 53 27 SM
18 TR 18 - - - 10 78 12 SM
19 TR 19 - - - 3 87 10 SM
KOLLAM CORPORATION
20 KL 20 36 23 13 45 32 23 SC
21 KL 21 - - - 8 81 11 SM
22 KL 22 - - - 4 84 12 SM
23 KL 23 18 - - 14 64 22 SM
24 KL 24 - - - 13 69 18 SM
25 KL 25 - - - 7 76 17 SM
26 KL 26 - - - 19 52 29 SM
Cochin University of Science & Technology 111
Chapter 4 Study Area, Field Investigations and Results
27 KL 27 - - - 2 85 13 SM
28 KL 28 - - - 21 56 23 SM
29 KL 29 - - - 15 67 18 SM
KOCHI CORPORATION
30 KO 30 24 14 10 18 45 37 SC
31 KO 31 23 16 7 21 49 30 SC
32 KO 32 - - - 6 84 10 SM
33 KO 33 - - - 23 65 12 SM
34 KO 34 21 12 9 29 38 33 SC
35 KO 35 - - - 23 63 14 SM
36 KO 36 - - - 23 66 11 SM
37 KO 37 - - - 28 56 16 SM
38 KO 38 - - - 11 64 25 SM
39 KO 39 34 22 12 20 50 30 SC
40 KO 40 32 19 13 30 48 22 SC
41 KO 41 - - - 20 71 9 SM
42 KO 42 - - - 5 77 18 SM
43 KO 43 26 19 7 32 54 14 SC
44 KO 44 - - - 13 64 23 SM
45 KO 45 - - - 23 70 7 SM
46 KO 46 - - - 23 65 12 SM
47 KO 47 - - - 15 72 13 SM
48 KO 48 - - - 6 77 17 SM
Cochin University of Science & Technology 112
Chapter 4 Study Area, Field Investigations and Results
THRISSUR CORPORATION
49 TH 49 - - - 10 61.19 29 SM
50 TH 50 19 12 7 16 56 28 SC
51 TH 51 21 16 5 5 56 39 SC
52 TH 52 17 11 6 20 57 23 SC
53 TH 53 - - - 18 57 25 SM
54 TH 54 - - - 10 62 28 SM
55 TH 55 - - - 12 61 27 SM
56 TH 56 17 13 4 14 58 28 SC
57 TH 57 32 21 11 28 47 25 SC
58 TH 58 - - - 11 70 19 SM
KOZHIKODE CORPORATION
59 KZ 59 18 - - 36 47 17 SM
60 KZ 60 29 - - 6 65 29 SM
61 KZ 61 - - - 19 69 12 SM
62 KZ 62 - - - 23 56 21 SM
63 KZ 63 - - - 9 78 13 SM
64 KZ 64 - - - 13 69 18 SM
65 KZ 65 - - - 14 77 9 SM
66 KZ 66 - - - 8 83 9 SM
67 KZ 67 - - - 16 70 14 SM
68 KZ 68 - - - 40 45 15 SM
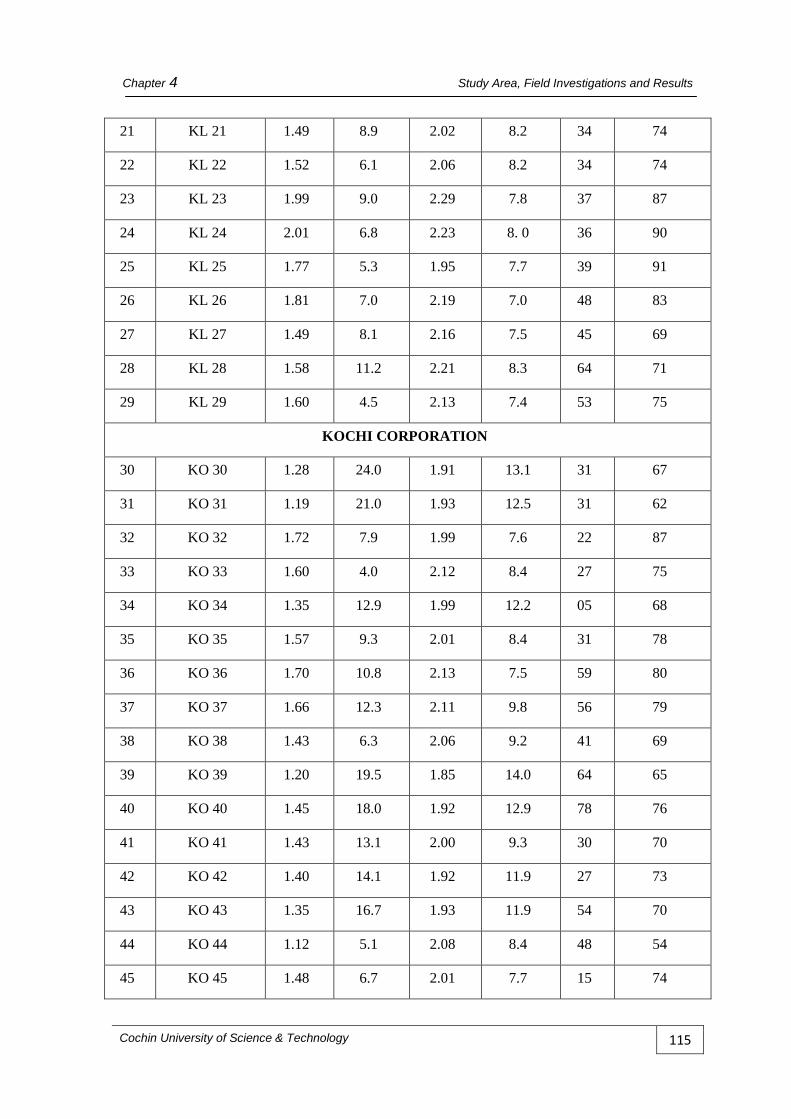
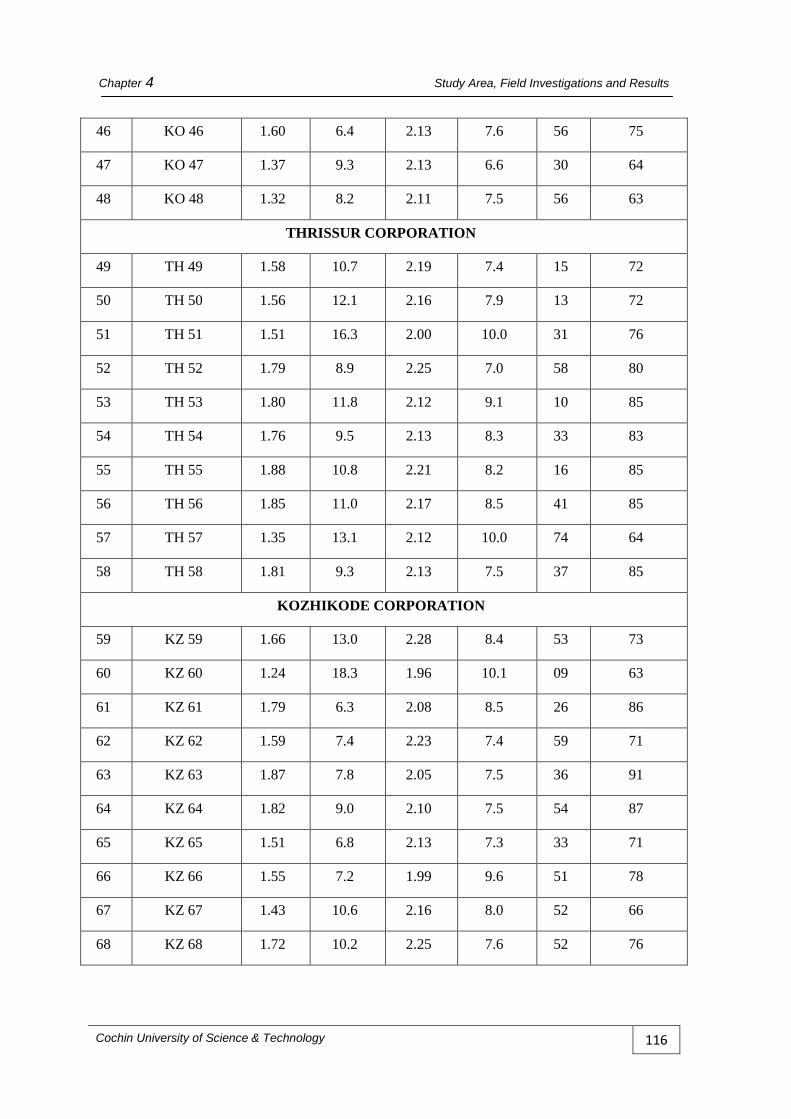
4.3.2 Compaction characteristics and CBR values for urban roads
The compaction characteristics and CBR values are tabulated in Table 4.4.
Cochin University of Science & Technology 113

Chapter 4 Study Area, Field Investigations and Results
Table 4.4 Compaction and CBR for urban roads
Sl.
No
Section ID
Field
Dry
Density
(g/cc)
Field
Moisture
Content
(%)
Max
Dry
Density
(g/cc)
Optimum
Moisture
Content
(%)
CBR
(%)
Relative
compaction
(%)
THIRUVANANTHAPURAM CORPORATION
1 TR 01 1.24 13.32 2.10 8.5 24 59
2 TR 02 1.47 11.2 1.85 16.6 19 79
3 TR 03 1.61 15.7 1.97 11.3 39 82
4 TR 04 1.66 5.6 2.28 6.7 40 73
5 TR 05 1.14 21.2 1.67 21.4 32 68
6 TR 06 1.34 22.5 1.74 19.0 26 77
7 TR 07 2.50 11.3 2.28 7.65 24 110
8 TR 08 1.64 7.0 2.20 6.7 26 74
9 TR 09 1.36 18.1 1.83 16.0 30 74
10 TR 10 1.48 14.5 1.97 11.2 10 75
11 TR 11 1.83 6.5 2.17 8.2 33 84
12 TR 12 1.88 10.7 2.19 6.6 54 86
13 TR 13 1.54 7.7 2.18 7.0 24 71
14 TR 14 1.52 10.6 2.15 9.4 25 71
15 TR 15 2.34 4.0 2.30 6.0 64 102
16 TR 16 1.76 10.0 2.15 8.1 26 82
17 TR 17 1.46 11.5 2.1 9.5 9 70
18 TR 18 1.45 8.0 2.07 5.0 43 70
19 TR 19 1.32 2.4 1.99 8.3 41 66
KOLLAM CORPORATION
20 KL 20 1.66 15.7 2.05 13.5 11 81
Cochin University of Science & Technology 114
Chapter 4 Study Area, Field Investigations and Results
21 KL 21 1.49 8.9 2.02 8.2 34 74
22 KL 22 1.52 6.1 2.06 8.2 34 74
23 KL 23 1.99 9.0 2.29 7.8 37 87
24 KL 24 2.01 6.8 2.23 8. 0 36 90
25 KL 25 1.77 5.3 1.95 7.7 39 91
26 KL 26 1.81 7.0 2.19 7.0 48 83
27 KL 27 1.49 8.1 2.16 7.5 45 69
28 KL 28 1.58 11.2 2.21 8.3 64 71
29 KL 29 1.60 4.5 2.13 7.4 53 75
KOCHI CORPORATION
30 KO 30 1.28 24.0 1.91 13.1 31 67
31 KO 31 1.19 21.0 1.93 12.5 31 62
32 KO 32 1.72 7.9 1.99 7.6 22 87
33 KO 33 1.60 4.0 2.12 8.4 27 75
34 KO 34 1.35 12.9 1.99 12.2 05 68
35 KO 35 1.57 9.3 2.01 8.4 31 78
36 KO 36 1.70 10.8 2.13 7.5 59 80
37 KO 37 1.66 12.3 2.11 9.8 56 79
38 KO 38 1.43 6.3 2.06 9.2 41 69
39 KO 39 1.20 19.5 1.85 14.0 64 65
40 KO 40 1.45 18.0 1.92 12.9 78 76
41 KO 41 1.43 13.1 2.00 9.3 30 70
42 KO 42 1.40 14.1 1.92 11.9 27 73
43 KO 43 1.35 16.7 1.93 11.9 54 70
44 KO 44 1.12 5.1 2.08 8.4 48 54
45 KO 45 1.48 6.7 2.01 7.7 15 74
Cochin University of Science & Technology 115
Chapter 4 Study Area, Field Investigations and Results
46 KO 46 1.60 6.4 2.13 7.6 56 75
47 KO 47 1.37 9.3 2.13 6.6 30 64
48 KO 48 1.32 8.2 2.11 7.5 56 63
THRISSUR CORPORATION
49 TH 49 1.58 10.7 2.19 7.4 15 72
50 TH 50 1.56 12.1 2.16 7.9 13 72
51 TH 51 1.51 16.3 2.00 10.0 31 76
52 TH 52 1.79 8.9 2.25 7.0 58 80
53 TH 53 1.80 11.8 2.12 9.1 10 85
54 TH 54 1.76 9.5 2.13 8.3 33 83
55 TH 55 1.88 10.8 2.21 8.2 16 85
56 TH 56 1.85 11.0 2.17 8.5 41 85
57 TH 57 1.35 13.1 2.12 10.0 74 64
58 TH 58 1.81 9.3 2.13 7.5 37 85
KOZHIKODE CORPORATION
59 KZ 59 1.66 13.0 2.28 8.4 53 73
60 KZ 60 1.24 18.3 1.96 10.1 09 63
61 KZ 61 1.79 6.3 2.08 8.5 26 86
62 KZ 62 1.59 7.4 2.23 7.4 59 71
63 KZ 63 1.87 7.8 2.05 7.5 36 91
64 KZ 64 1.82 9.0 2.10 7.5 54 87
65 KZ 65 1.51 6.8 2.13 7.3 33 71
66 KZ 66 1.55 7.2 1.99 9.6 51 78
67 KZ 67 1.43 10.6 2.16 8.0 52 66
68 KZ 68 1.72 10.2 2.25 7.6 52 76
Cochin University of Science & Technology 116
Chapter 4 Study Area, Field Investigations and Results
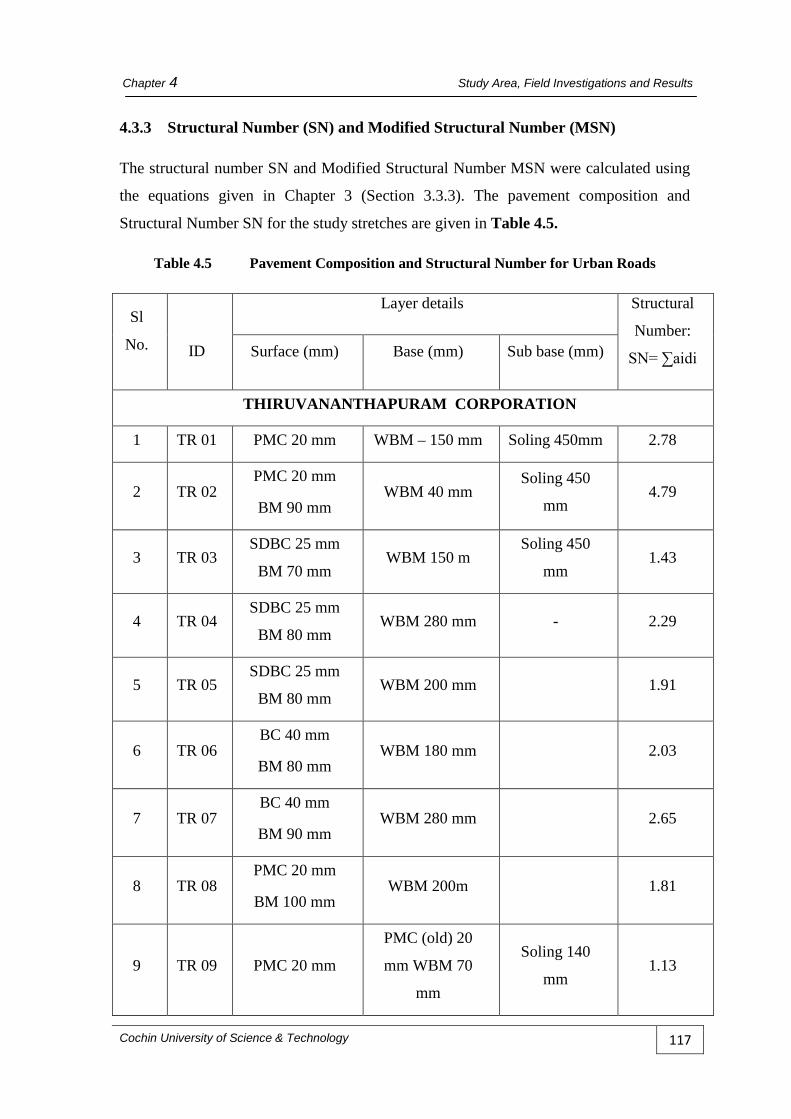
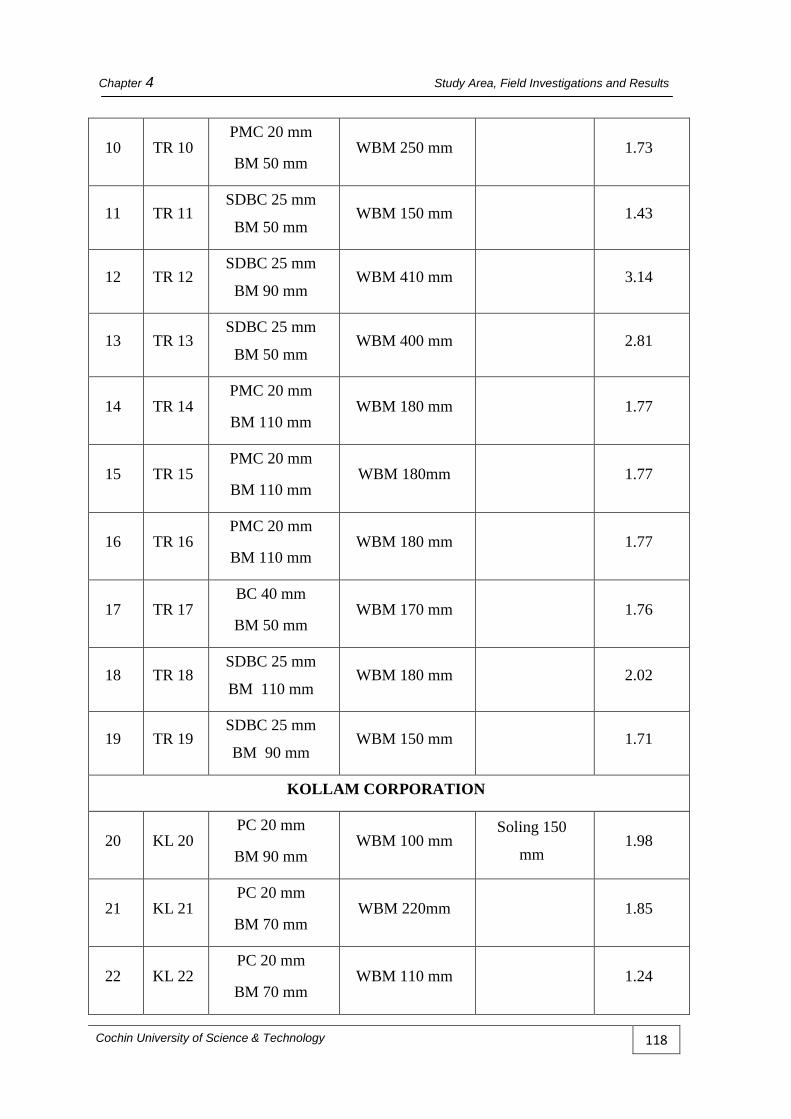
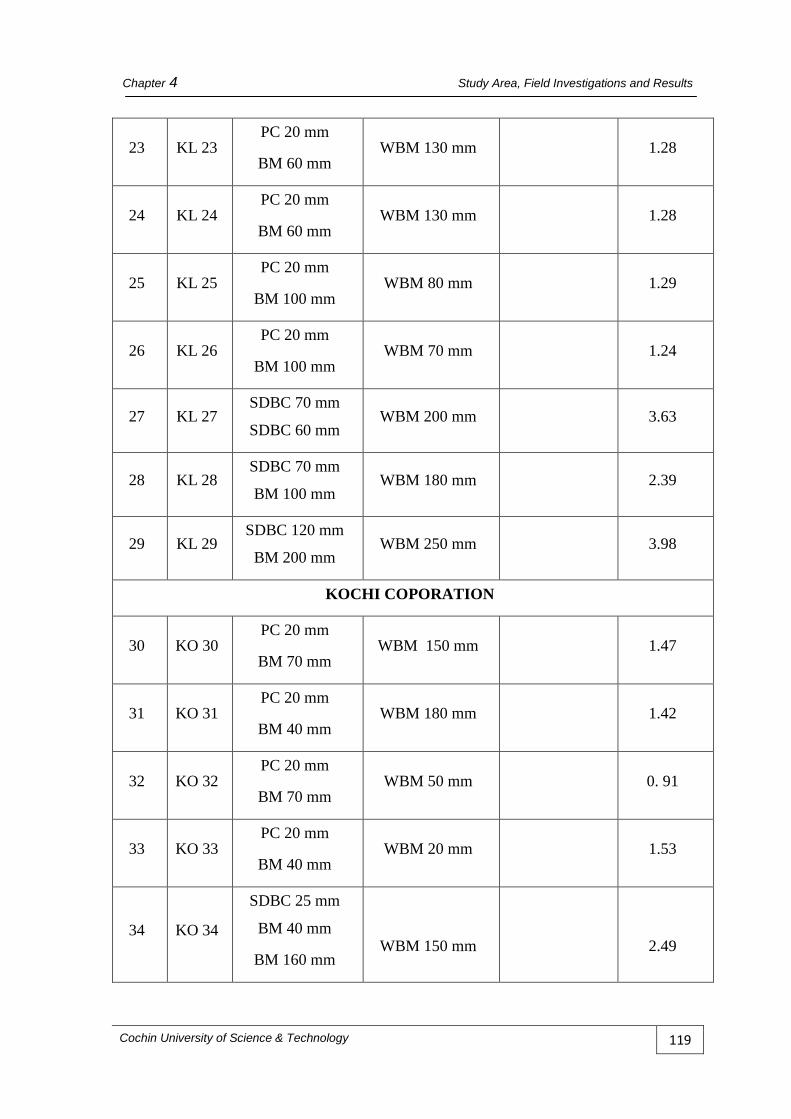
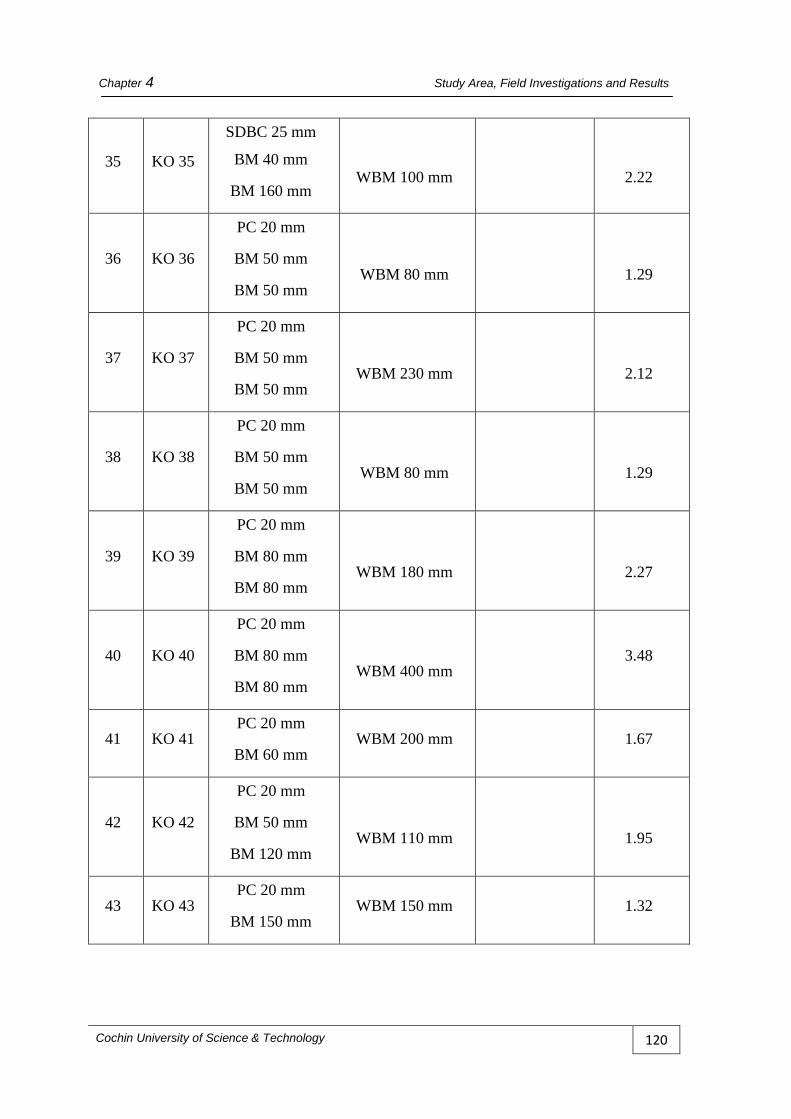
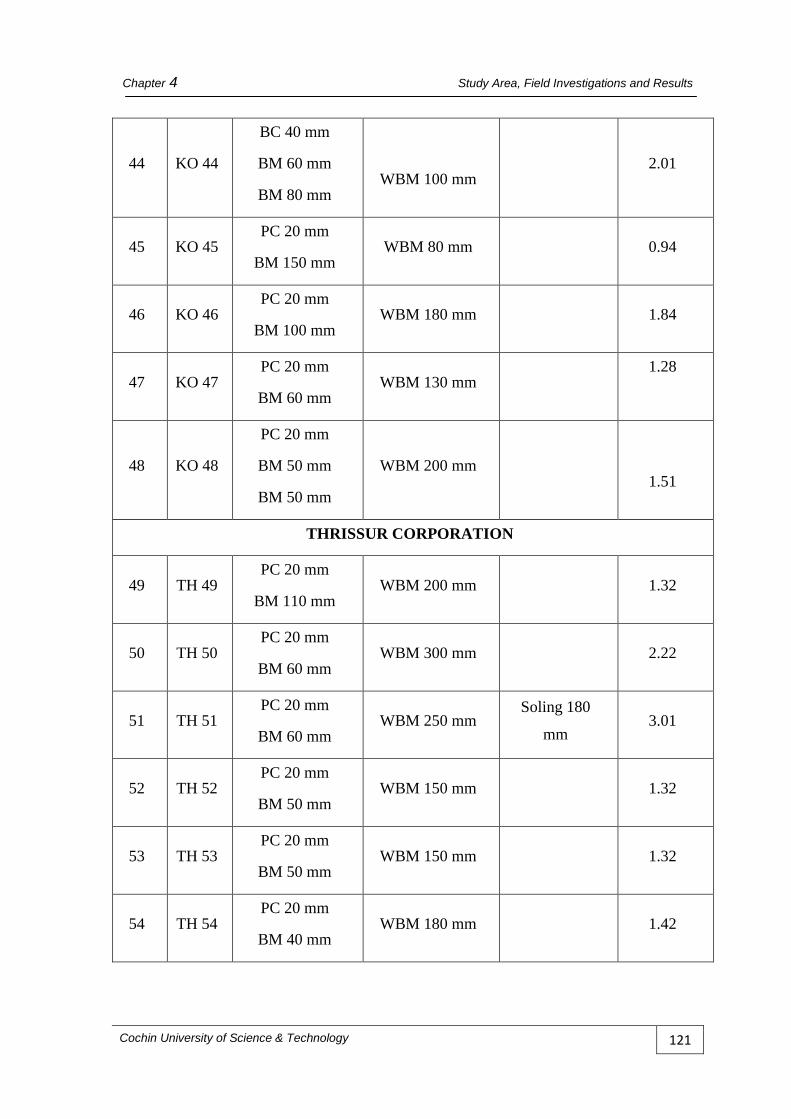
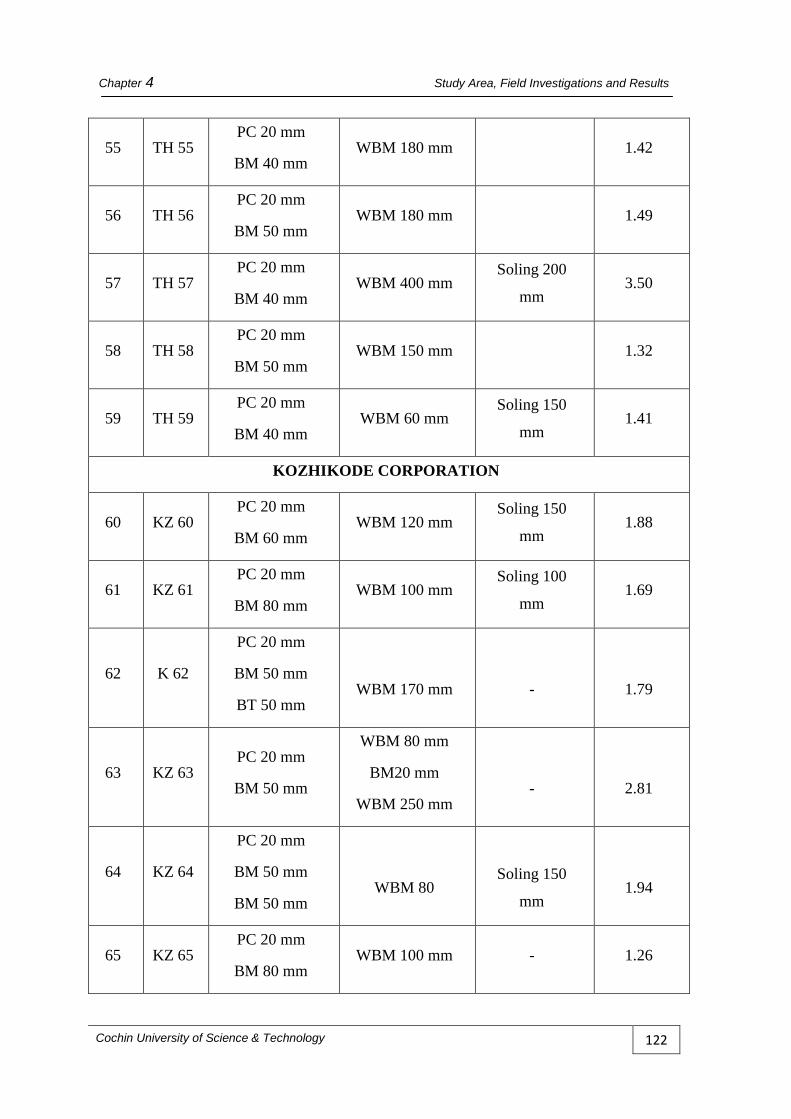
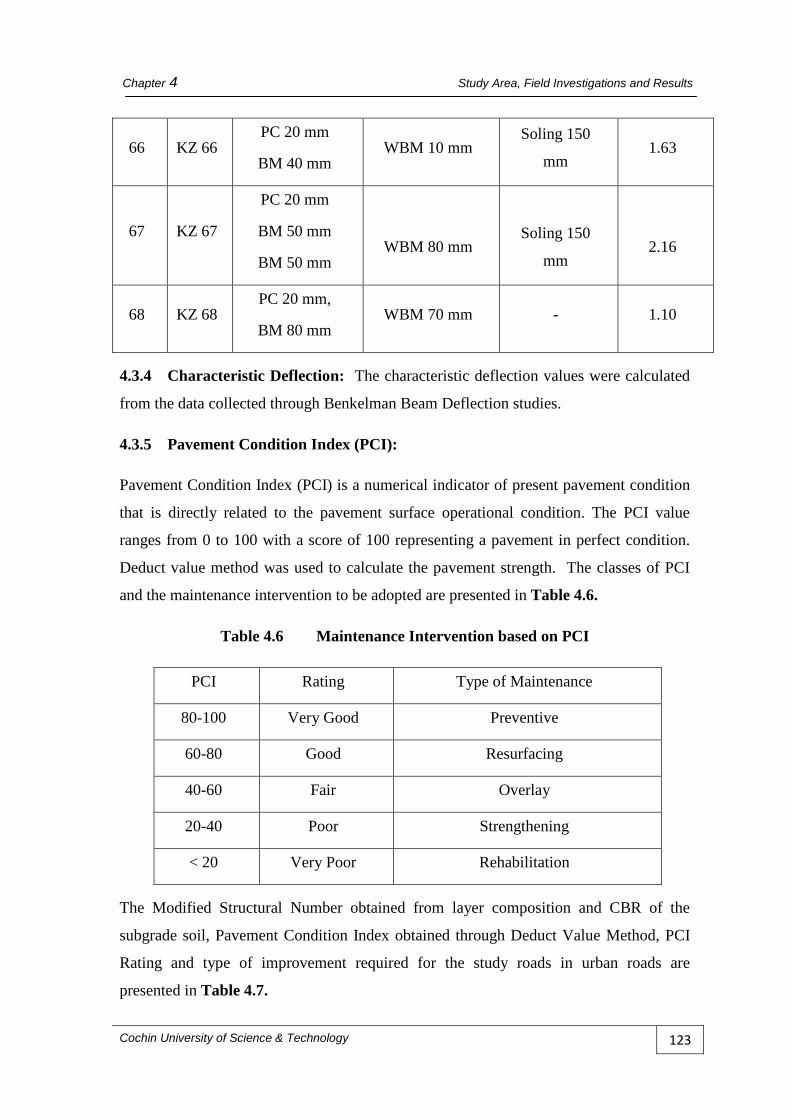
4.3.3 Structural Number (SN) and Modified Structural Number (MSN)
The structural number SN and Modified Structural Number MSN were calculated using
the equations given in Chapter 3 (Section 3.3.3). The pavement composition and
Structural Number SN for the study stretches are given in Table 4.5.
Table 4.5 Pavement Composition and Structural Number for Urban Roads
Sl
No.
ID
Layer details Structural
Number:
SN= ∑aidi Surface (mm) Base (mm) Sub base (mm)
THIRUVANANTHAPURAM CORPORATION
1 TR 01 PMC 20 mm WBM – 150 mm Soling 450mm 2.78
2 TR 02 PMC 20 mm
BM 90 mm WBM 40 mm
Soling 450
mm 4.79
3 TR 03 SDBC 25 mm
BM 70 mm WBM 150 m
Soling 450
mm 1.43
4 TR 04 SDBC 25 mm
BM 80 mm WBM 280 mm - 2.29
5 TR 05 SDBC 25 mm
BM 80 mm WBM 200 mm 1.91
6 TR 06 BC 40 mm
BM 80 mm WBM 180 mm 2.03
7 TR 07 BC 40 mm
BM 90 mm WBM 280 mm 2.65
8 TR 08 PMC 20 mm
BM 100 mm WBM 200m 1.81
9 TR 09 PMC 20 mm
PMC (old) 20
mm WBM 70
mm
Soling 140
mm 1.13
Cochin University of Science & Technology 117
Chapter 4 Study Area, Field Investigations and Results
10 TR 10 PMC 20 mm
BM 50 mm WBM 250 mm 1.73
11 TR 11 SDBC 25 mm
BM 50 mm WBM 150 mm 1.43
12 TR 12 SDBC 25 mm
BM 90 mm WBM 410 mm 3.14
13 TR 13 SDBC 25 mm
BM 50 mm WBM 400 mm 2.81
14 TR 14 PMC 20 mm
BM 110 mm WBM 180 mm 1.77
15 TR 15 PMC 20 mm
BM 110 mm WBM 180mm 1.77
16 TR 16 PMC 20 mm
BM 110 mm WBM 180 mm 1.77
17 TR 17 BC 40 mm
BM 50 mm WBM 170 mm 1.76
18 TR 18 SDBC 25 mm
BM 110 mm WBM 180 mm 2.02
19 TR 19 SDBC 25 mm
BM 90 mm WBM 150 mm 1.71
KOLLAM CORPORATION
20 KL 20 PC 20 mm
BM 90 mm WBM 100 mm
Soling 150
mm 1.98
21 KL 21 PC 20 mm
BM 70 mm WBM 220mm 1.85
22 KL 22 PC 20 mm
BM 70 mm WBM 110 mm 1.24
Cochin University of Science & Technology 118
Chapter 4 Study Area, Field Investigations and Results
23 KL 23 PC 20 mm
BM 60 mm WBM 130 mm 1.28
24 KL 24 PC 20 mm
BM 60 mm WBM 130 mm 1.28
25 KL 25 PC 20 mm
BM 100 mm WBM 80 mm 1.29
26 KL 26 PC 20 mm
BM 100 mm WBM 70 mm 1.24
27 KL 27 SDBC 70 mm
SDBC 60 mm WBM 200 mm 3.63
28 KL 28 SDBC 70 mm
BM 100 mm WBM 180 mm 2.39
29 KL 29 SDBC 120 mm
BM 200 mm WBM 250 mm 3.98
KOCHI COPORATION
30 KO 30 PC 20 mm
BM 70 mm WBM 150 mm 1.47
31 KO 31 PC 20 mm
BM 40 mm WBM 180 mm 1.42
32 KO 32 PC 20 mm
BM 70 mm WBM 50 mm 0. 91
33 KO 33 PC 20 mm
BM 40 mm WBM 20 mm 1.53
34 KO 34
SDBC 25 mm
BM 40 mm
BM 160 mm
WBM 150 mm
2.49
Cochin University of Science & Technology 119
Chapter 4 Study Area, Field Investigations and Results
35 KO 35
SDBC 25 mm
BM 40 mm
BM 160 mm
WBM 100 mm
2.22
36 KO 36
PC 20 mm
BM 50 mm
BM 50 mm
WBM 80 mm
1.29
37 KO 37
PC 20 mm
BM 50 mm
BM 50 mm
WBM 230 mm
2.12
38 KO 38
PC 20 mm
BM 50 mm
BM 50 mm
WBM 80 mm
1.29
39 KO 39
PC 20 mm
BM 80 mm
BM 80 mm
WBM 180 mm
2.27
40 KO 40
PC 20 mm
BM 80 mm
BM 80 mm
WBM 400 mm 3.48
41 KO 41 PC 20 mm
BM 60 mm WBM 200 mm 1.67
42 KO 42
PC 20 mm
BM 50 mm
BM 120 mm
WBM 110 mm
1.95
43 KO 43 PC 20 mm
BM 150 mm WBM 150 mm 1.32
Cochin University of Science & Technology 120
Chapter 4 Study Area, Field Investigations and Results
44 KO 44
BC 40 mm
BM 60 mm
BM 80 mm
WBM 100 mm 2.01
45 KO 45 PC 20 mm
BM 150 mm WBM 80 mm 0.94
46 KO 46 PC 20 mm
BM 100 mm WBM 180 mm 1.84
47 KO 47 PC 20 mm
BM 60 mm WBM 130 mm
1.28
48 KO 48
PC 20 mm
BM 50 mm
BM 50 mm
WBM 200 mm
1.51
THRISSUR CORPORATION
49 TH 49 PC 20 mm
BM 110 mm WBM 200 mm 1.32
50 TH 50 PC 20 mm
BM 60 mm WBM 300 mm 2.22
51 TH 51 PC 20 mm
BM 60 mm WBM 250 mm
Soling 180
mm 3.01
52 TH 52 PC 20 mm
BM 50 mm WBM 150 mm 1.32
53 TH 53 PC 20 mm
BM 50 mm WBM 150 mm 1.32
54 TH 54 PC 20 mm
BM 40 mm WBM 180 mm 1.42
Cochin University of Science & Technology 121
Chapter 4 Study Area, Field Investigations and Results
55 TH 55 PC 20 mm
BM 40 mm WBM 180 mm 1.42
56 TH 56 PC 20 mm
BM 50 mm WBM 180 mm 1.49
57 TH 57 PC 20 mm
BM 40 mm WBM 400 mm
Soling 200
mm 3.50
58 TH 58 PC 20 mm
BM 50 mm WBM 150 mm 1.32
59 TH 59 PC 20 mm
BM 40 mm WBM 60 mm
Soling 150
mm 1.41
KOZHIKODE CORPORATION
60 KZ 60 PC 20 mm
BM 60 mm WBM 120 mm
Soling 150
mm 1.88
61 KZ 61 PC 20 mm
BM 80 mm WBM 100 mm
Soling 100
mm 1.69
62 K 62
PC 20 mm
BM 50 mm
BT 50 mm
WBM 170 mm
-
1.79
63 KZ 63 PC 20 mm
BM 50 mm
WBM 80 mm
BM20 mm
WBM 250 mm
-
2.81
64 KZ 64
PC 20 mm
BM 50 mm
BM 50 mm
WBM 80
Soling 150
mm
1.94
65 KZ 65 PC 20 mm
BM 80 mm WBM 100 mm - 1.26
Cochin University of Science & Technology 122
Chapter 4 Study Area, Field Investigations and Results
66 KZ 66 PC 20 mm
BM 40 mm WBM 10 mm
Soling 150
mm 1.63
67 KZ 67
PC 20 mm
BM 50 mm
BM 50 mm
WBM 80 mm
Soling 150
mm
2.16
68 KZ 68 PC 20 mm,
BM 80 mm WBM 70 mm - 1.10
4.3.4 Characteristic Deflection: The characteristic deflection values were calculated
from the data collected through Benkelman Beam Deflection studies.
4.3.5 Pavement Condition Index (PCI):
Pavement Condition Index (PCI) is a numerical indicator of present pavement condition
that is directly related to the pavement surface operational condition. The PCI value
ranges from 0 to 100 with a score of 100 representing a pavement in perfect condition.
Deduct value method was used to calculate the pavement strength. The classes of PCI
and the maintenance intervention to be adopted are presented in Table 4.6.
Table 4.6 Maintenance Intervention based on PCI
PCI Rating Type of Maintenance
80-100 Very Good Preventive
60-80 Good Resurfacing
40-60 Fair Overlay
20-40 Poor Strengthening
< 20 Very Poor Rehabilitation
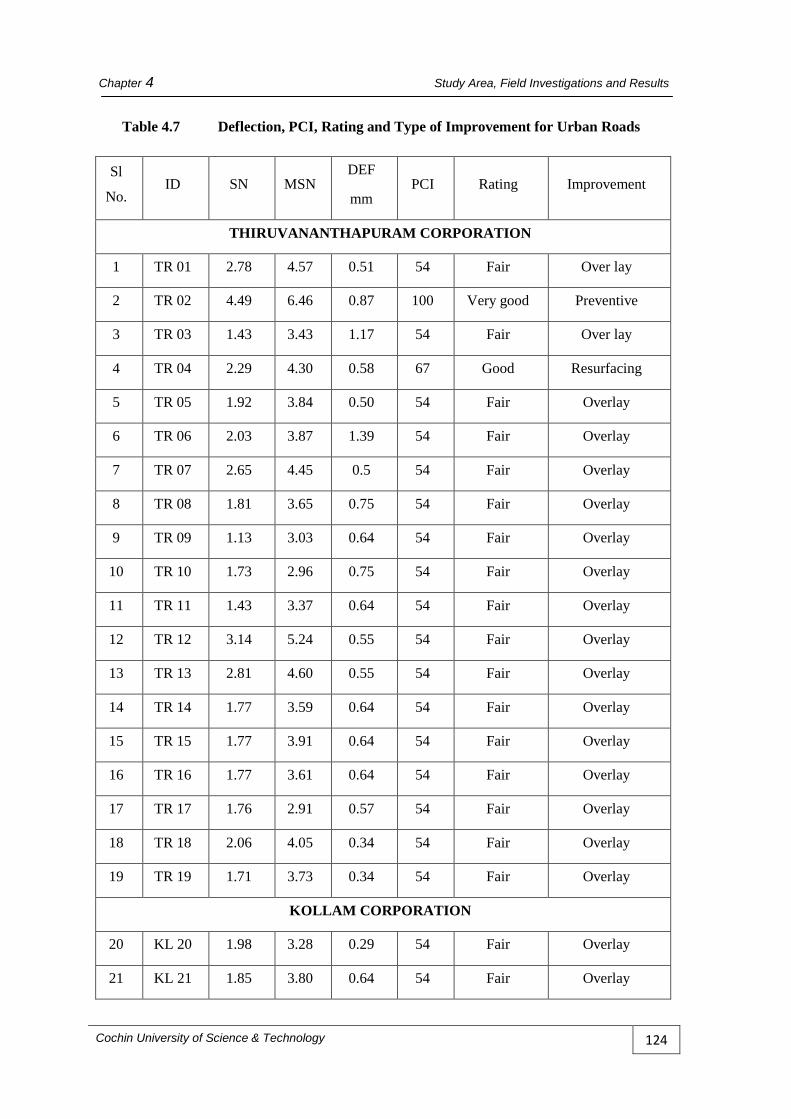
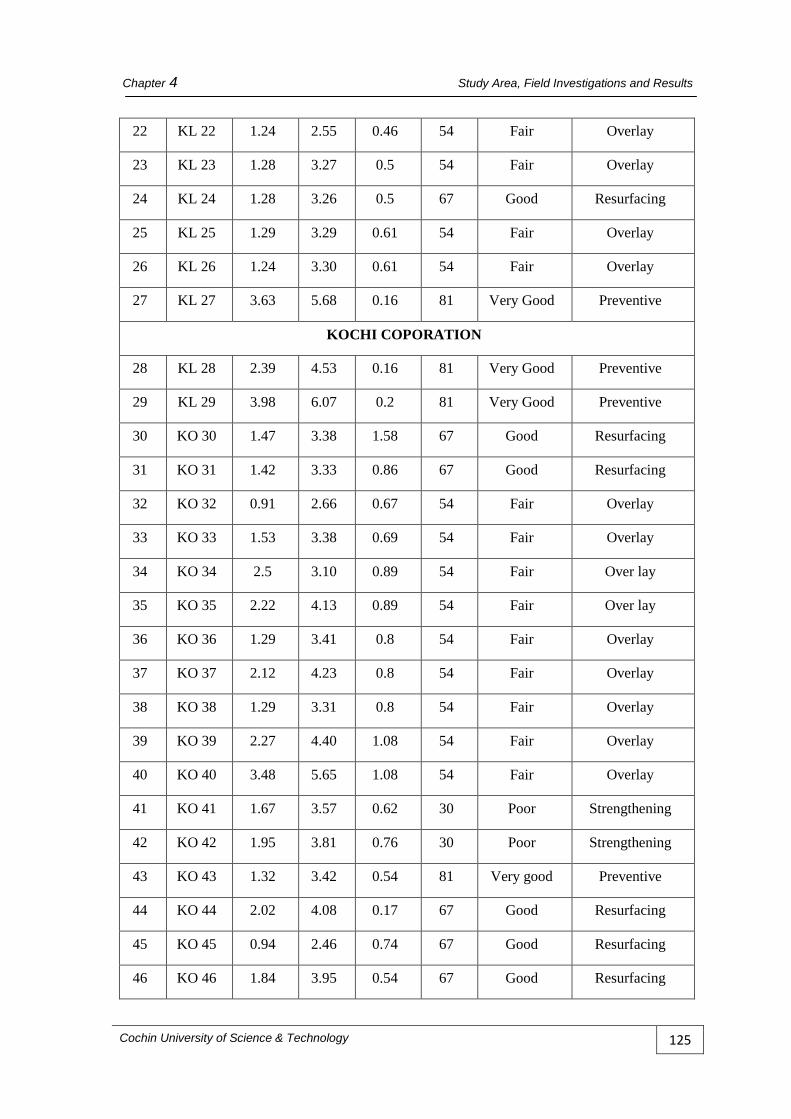
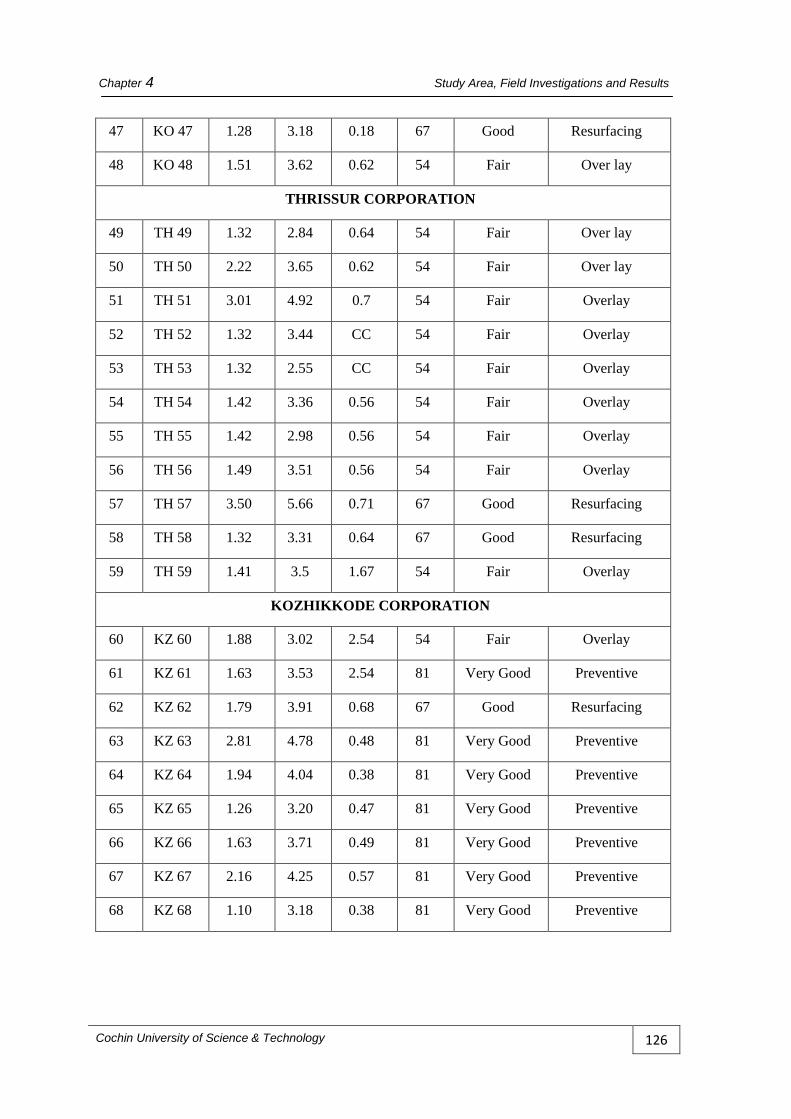
The Modified Structural Number obtained from layer composition and CBR of the
subgrade soil, Pavement Condition Index obtained through Deduct Value Method, PCI
Rating and type of improvement required for the study roads in urban roads are
presented in Table 4.7.
Cochin University of Science & Technology 123
Chapter 4 Study Area, Field Investigations and Results
Table 4.7 Deflection, PCI, Rating and Type of Improvement for Urban Roads
Sl
No. ID SN MSN
DEF
mm PCI Rating Improvement
THIRUVANANTHAPURAM CORPORATION
1 TR 01 2.78 4.57 0.51 54 Fair Over lay
2 TR 02 4.49 6.46 0.87 100 Very good Preventive
3 TR 03 1.43 3.43 1.17 54 Fair Over lay
4 TR 04 2.29 4.30 0.58 67 Good Resurfacing
5 TR 05 1.92 3.84 0.50 54 Fair Overlay
6 TR 06 2.03 3.87 1.39 54 Fair Overlay
7 TR 07 2.65 4.45 0.5 54 Fair Overlay
8 TR 08 1.81 3.65 0.75 54 Fair Overlay
9 TR 09 1.13 3.03 0.64 54 Fair Overlay
10 TR 10 1.73 2.96 0.75 54 Fair Overlay
11 TR 11 1.43 3.37 0.64 54 Fair Overlay
12 TR 12 3.14 5.24 0.55 54 Fair Overlay
13 TR 13 2.81 4.60 0.55 54 Fair Overlay
14 TR 14 1.77 3.59 0.64 54 Fair Overlay
15 TR 15 1.77 3.91 0.64 54 Fair Overlay
16 TR 16 1.77 3.61 0.64 54 Fair Overlay
17 TR 17 1.76 2.91 0.57 54 Fair Overlay
18 TR 18 2.06 4.05 0.34 54 Fair Overlay
19 TR 19 1.71 3.73 0.34 54 Fair Overlay
KOLLAM CORPORATION
20 KL 20 1.98 3.28 0.29 54 Fair Overlay
21 KL 21 1.85 3.80 0.64 54 Fair Overlay
Cochin University of Science & Technology 124
Chapter 4 Study Area, Field Investigations and Results
22 KL 22 1.24 2.55 0.46 54 Fair Overlay
23 KL 23 1.28 3.27 0.5 54 Fair Overlay
24 KL 24 1.28 3.26 0.5 67 Good Resurfacing
25 KL 25 1.29 3.29 0.61 54 Fair Overlay
26 KL 26 1.24 3.30 0.61 54 Fair Overlay
27 KL 27 3.63 5.68 0.16 81 Very Good Preventive
KOCHI COPORATION
28 KL 28 2.39 4.53 0.16 81 Very Good Preventive
29 KL 29 3.98 6.07 0.2 81 Very Good Preventive
30 KO 30 1.47 3.38 1.58 67 Good Resurfacing
31 KO 31 1.42 3.33 0.86 67 Good Resurfacing
32 KO 32 0.91 2.66 0.67 54 Fair Overlay
33 KO 33 1.53 3.38 0.69 54 Fair Overlay
34 KO 34 2.5 3.10 0.89 54 Fair Over lay
35 KO 35 2.22 4.13 0.89 54 Fair Over lay
36 KO 36 1.29 3.41 0.8 54 Fair Overlay
37 KO 37 2.12 4.23 0.8 54 Fair Overlay
38 KO 38 1.29 3.31 0.8 54 Fair Overlay
39 KO 39 2.27 4.40 1.08 54 Fair Overlay
40 KO 40 3.48 5.65 1.08 54 Fair Overlay
41 KO 41 1.67 3.57 0.62 30 Poor Strengthening
42 KO 42 1.95 3.81 0.76 30 Poor Strengthening
43 KO 43 1.32 3.42 0.54 81 Very good Preventive
44 KO 44 2.02 4.08 0.17 67 Good Resurfacing
45 KO 45 0.94 2.46 0.74 67 Good Resurfacing
46 KO 46 1.84 3.95 0.54 67 Good Resurfacing
Cochin University of Science & Technology 125
Chapter 4 Study Area, Field Investigations and Results
47 KO 47 1.28 3.18 0.18 67 Good Resurfacing
48 KO 48 1.51 3.62 0.62 54 Fair Over lay
THRISSUR CORPORATION
49 TH 49 1.32 2.84 0.64 54 Fair Over lay
50 TH 50 2.22 3.65 0.62 54 Fair Over lay
51 TH 51 3.01 4.92 0.7 54 Fair Overlay
52 TH 52 1.32 3.44 CC 54 Fair Overlay
53 TH 53 1.32 2.55 CC 54 Fair Overlay
54 TH 54 1.42 3.36 0.56 54 Fair Overlay
55 TH 55 1.42 2.98 0.56 54 Fair Overlay
56 TH 56 1.49 3.51 0.56 54 Fair Overlay
57 TH 57 3.50 5.66 0.71 67 Good Resurfacing
58 TH 58 1.32 3.31 0.64 67 Good Resurfacing
59 TH 59 1.41 3.5 1.67 54 Fair Overlay
KOZHIKKODE CORPORATION
60 KZ 60 1.88 3.02 2.54 54 Fair Overlay
61 KZ 61 1.63 3.53 2.54 81 Very Good Preventive
62 KZ 62 1.79 3.91 0.68 67 Good Resurfacing
63 KZ 63 2.81 4.78 0.48 81 Very Good Preventive
64 KZ 64 1.94 4.04 0.38 81 Very Good Preventive
65 KZ 65 1.26 3.20 0.47 81 Very Good Preventive
66 KZ 66 1.63 3.71 0.49 81 Very Good Preventive
67 KZ 67 2.16 4.25 0.57 81 Very Good Preventive
68 KZ 68 1.10 3.18 0.38 81 Very Good Preventive
Cochin University of Science & Technology 126
Chapter 4 Study Area, Field Investigations and Results
4.4 PERIODIC PAVEMENT EVALUATION STUDIES
Results obtained from the field investigations and laboratory tests for the eight study
roads identified for periodic pavement evaluation are discussed here. One time data on
subsoil parameters, traffic and drainage characteristics were collected. The results were
used as variables in development of models.
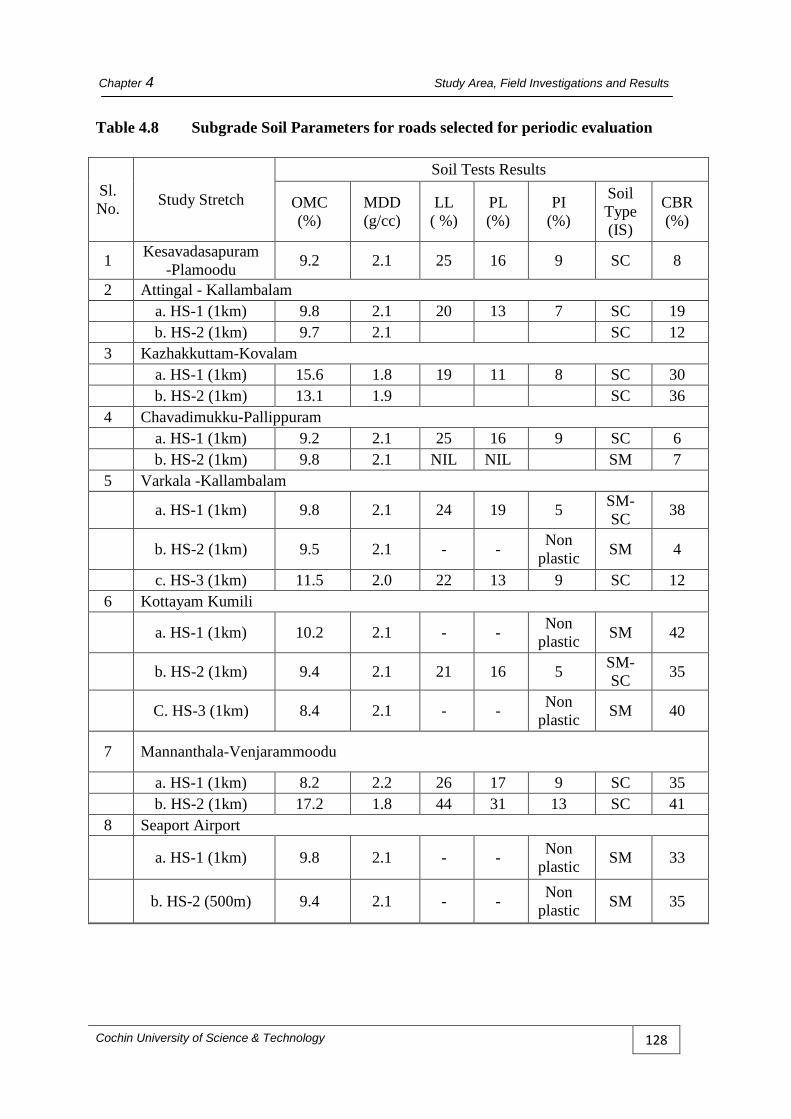
4.4.1 Subgrade Soil Investigation results
The results of the various tests conducted on the sub grade soil collected from the study
roads are given in Table 4. 8
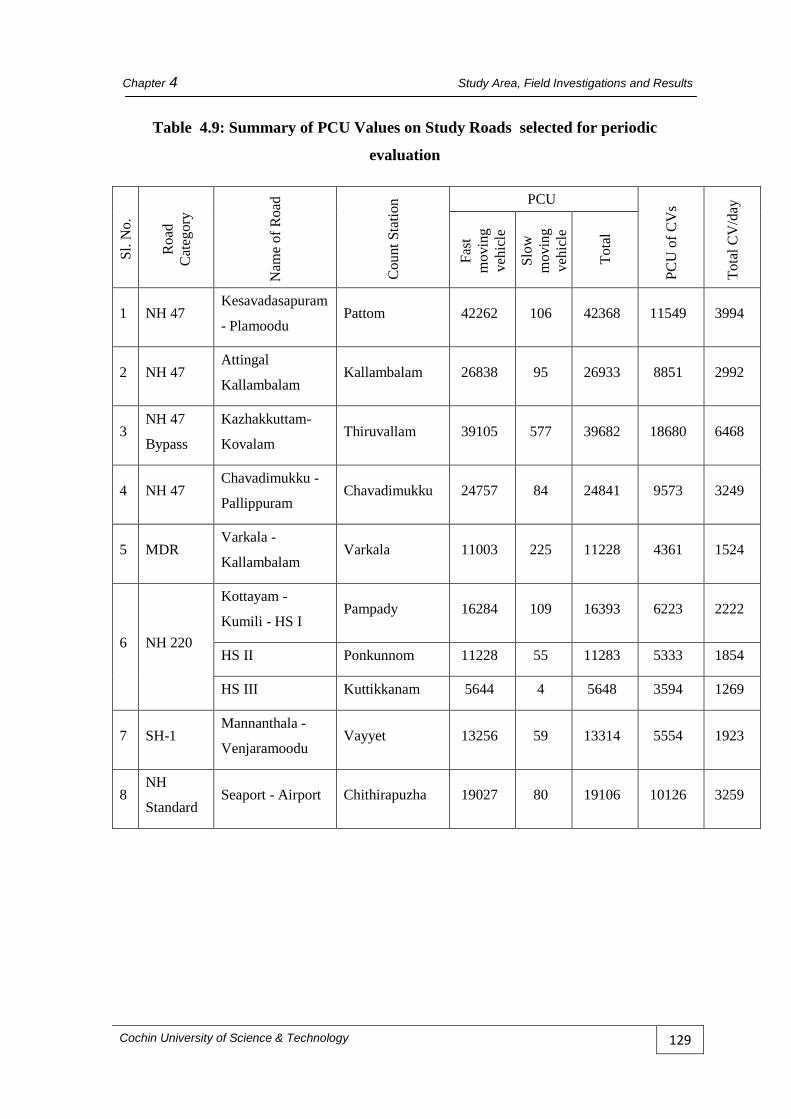
4.4.2 Traffic Volume Count Survey
The Traffic Census Data collected on all the study roads were analysed. The Passenger
Car Unit values for each count station were calculated. PCU values were determined for
the slow moving vehicles, fast moving vehicles & for the commercial vehicles are given
in Table 4.9.
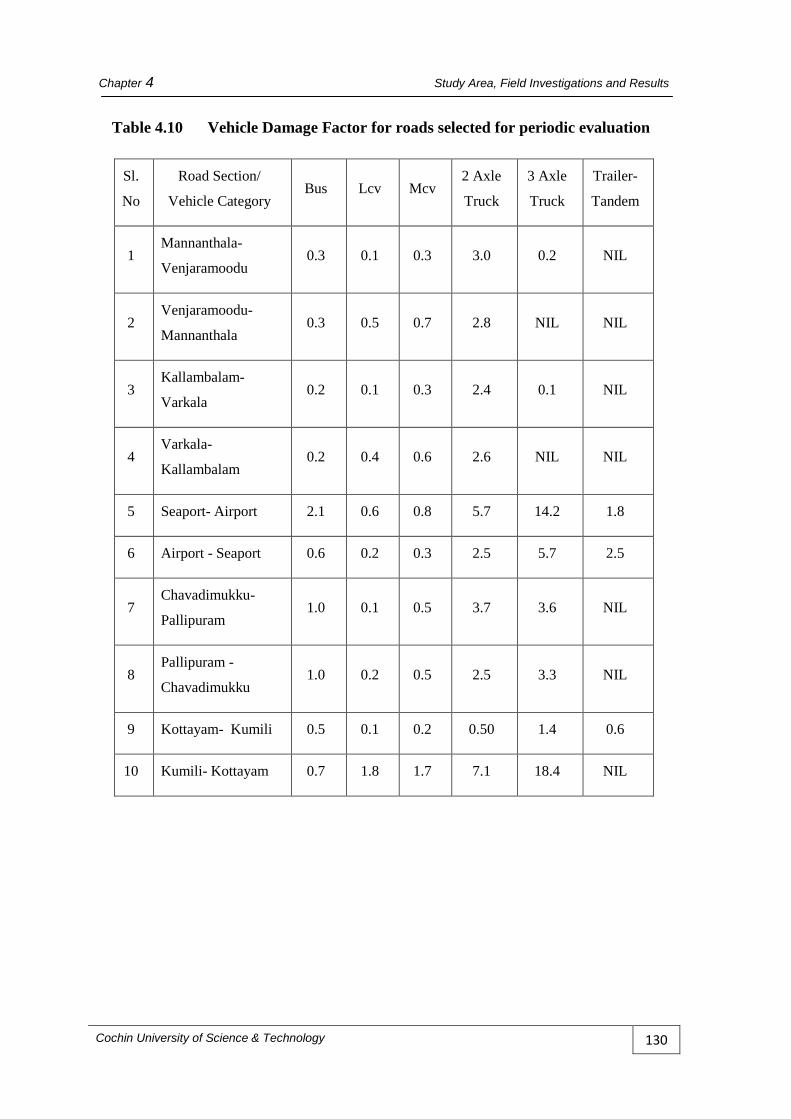
4.4.3 Axle load survey and Vehicle Damage Factor
Axle load survey was conducted for five study roads. Vehicle Damage Factor is an input
variable for crack and raveling progression models. The VDF values for each Type of
Vehicles in both directions were calculated and total ESAL were obtained for each
category. The summary of the VDF values on the study roads are given in Table 4.10.
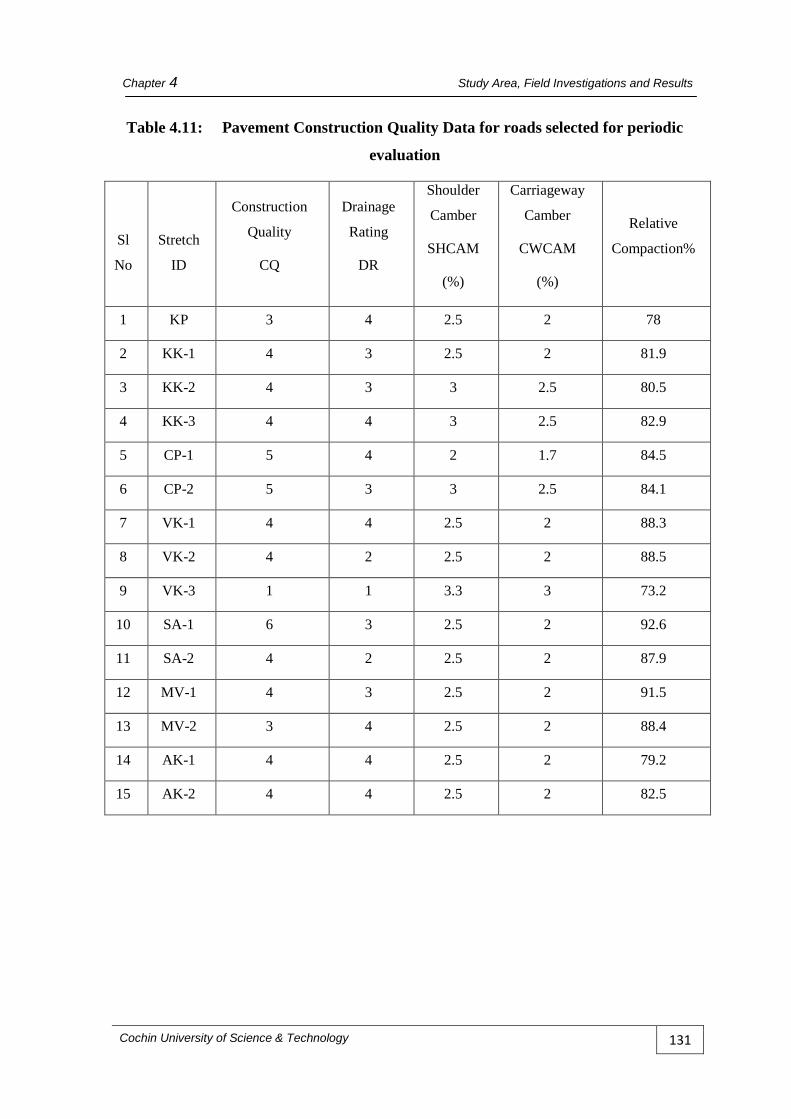
4.4.4 Pavement Construction Quality
The construction quality of the pavement arrived at on a five point rating scale, drainage
properties, camber values of the shoulder and relative compaction data are presented in
Table 4.11.
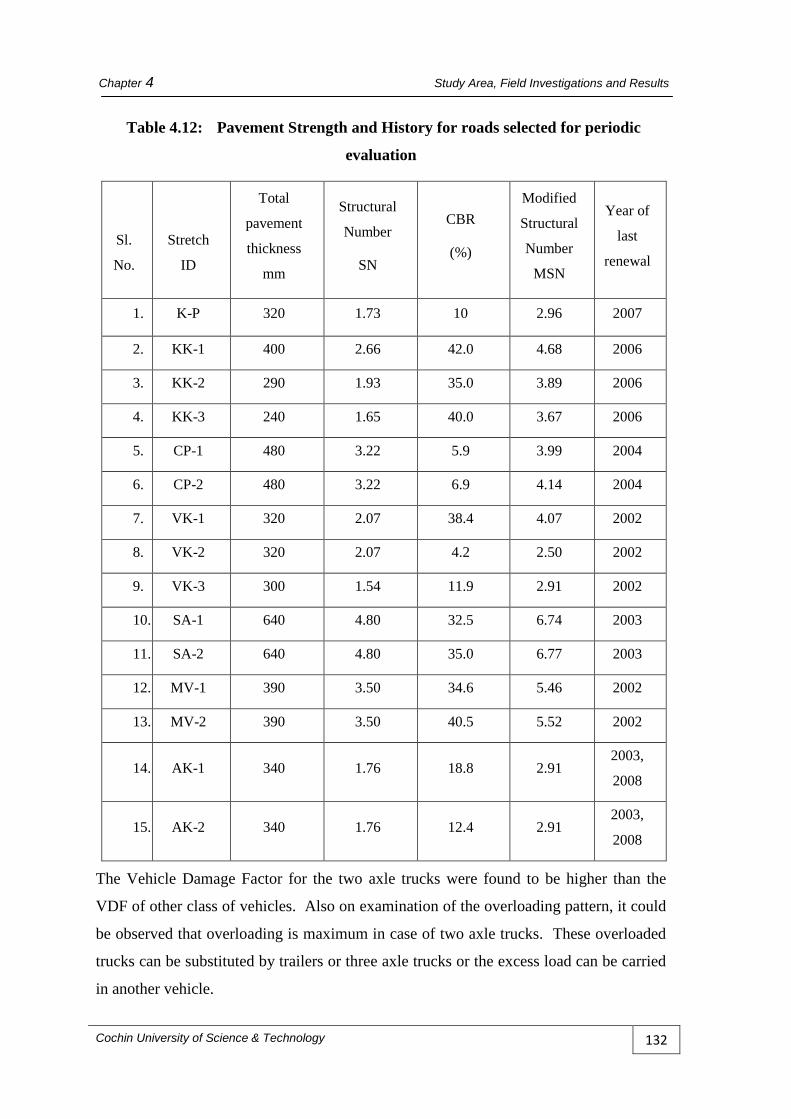
4.4.5 Pavement Strength and History
The pavement thickness, strength represented as Modified Structural Number, Relative
compaction of the subgrade soil and history are given in Table 4.12.
Cochin University of Science & Technology 127
Chapter 4 Study Area, Field Investigations and Results
Table 4.8 Subgrade Soil Parameters for roads selected for periodic evaluation
Sl. No. Study Stretch
Soil Tests Results
OMC (%)
MDD (g/cc)
LL ( %)
PL (%)
PI (%)
Soil Type (IS)
CBR (%)
1 Kesavadasapuram-Plamoodu 9.2 2.1 25 16 9 SC 8
2 Attingal - Kallambalam
a. HS-1 (1km) 9.8 2.1 20 13 7 SC 19
b. HS-2 (1km) 9.7 2.1 SC 12 3 Kazhakkuttam-Kovalam
a. HS-1 (1km) 15.6 1.8 19 11 8 SC 30
b. HS-2 (1km) 13.1 1.9 SC 36 4 Chavadimukku-Pallippuram
a. HS-1 (1km) 9.2 2.1 25 16 9 SC 6
b. HS-2 (1km) 9.8 2.1 NIL NIL SM 7 5 Varkala -Kallambalam
a. HS-1 (1km) 9.8 2.1 24 19 5 SM-SC 38
b. HS-2 (1km) 9.5 2.1 - - Non plastic SM 4
c. HS-3 (1km) 11.5 2.0 22 13 9 SC 12 6 Kottayam Kumili
a. HS-1 (1km) 10.2 2.1 - - Non plastic SM 42
b. HS-2 (1km) 9.4 2.1 21 16 5 SM-SC 35
C. HS-3 (1km) 8.4 2.1 - - Non plastic SM 40
7 Mannanthala-Venjarammoodu
a. HS-1 (1km) 8.2 2.2 26 17 9 SC 35
b. HS-2 (1km) 17.2 1.8 44 31 13 SC 41 8 Seaport Airport
a. HS-1 (1km) 9.8 2.1 - - Non plastic SM 33
b. HS-2 (500m) 9.4 2.1 - - Non plastic SM 35
Cochin University of Science & Technology 128
Chapter 4 Study Area, Field Investigations and Results
Table 4.9: Summary of PCU Values on Study Roads selected for periodic
evaluation
Sl. N
o.
Roa
d
Cat
egor
y
Nam
e of
Roa
d
Cou
nt S
tatio
n PCU
PCU
of C
Vs
Tota
l CV
/day
Fast
m
ovin
g ve
hicl
e
Slow
m
ovin
g ve
hicl
e
Tota
l
1 NH 47 Kesavadasapuram
- Plamoodu Pattom 42262 106 42368 11549 3994
2 NH 47 Attingal
Kallambalam Kallambalam 26838 95 26933 8851 2992
3 NH 47
Bypass
Kazhakkuttam-
Kovalam Thiruvallam 39105 577 39682 18680 6468
4 NH 47 Chavadimukku -
Pallippuram Chavadimukku 24757 84 24841 9573 3249
5 MDR Varkala -
Kallambalam Varkala 11003 225 11228 4361 1524
6 NH 220
Kottayam -
Kumili - HS I Pampady 16284 109 16393 6223 2222
HS II Ponkunnom 11228 55 11283 5333 1854
HS III Kuttikkanam 5644 4 5648 3594 1269
7 SH-1 Mannanthala -
Venjaramoodu Vayyet 13256 59 13314 5554 1923
8 NH
Standard Seaport - Airport Chithirapuzha 19027 80 19106 10126 3259
Cochin University of Science & Technology 129
Chapter 4 Study Area, Field Investigations and Results
Table 4.10 Vehicle Damage Factor for roads selected for periodic evaluation
Sl.
No
Road Section/
Vehicle Category Bus Lcv Mcv
2 Axle
Truck
3 Axle
Truck
Trailer-
Tandem
1 Mannanthala-
Venjaramoodu 0.3 0.1 0.3 3.0 0.2 NIL
2 Venjaramoodu-
Mannanthala 0.3 0.5 0.7 2.8 NIL NIL
3 Kallambalam-
Varkala 0.2 0.1 0.3 2.4 0.1 NIL
4 Varkala-
Kallambalam 0.2 0.4 0.6 2.6 NIL NIL
5 Seaport- Airport 2.1 0.6 0.8 5.7 14.2 1.8
6 Airport - Seaport 0.6 0.2 0.3 2.5 5.7 2.5
7 Chavadimukku-
Pallipuram 1.0 0.1 0.5 3.7 3.6 NIL
8 Pallipuram -
Chavadimukku 1.0 0.2 0.5 2.5 3.3 NIL
9 Kottayam- Kumili 0.5 0.1 0.2 0.50 1.4 0.6
10 Kumili- Kottayam 0.7 1.8 1.7 7.1 18.4 NIL
Cochin University of Science & Technology 130
Chapter 4 Study Area, Field Investigations and Results
Table 4.11: Pavement Construction Quality Data for roads selected for periodic
evaluation
Sl
No
Stretch
ID
Construction
Quality
CQ
Drainage
Rating
DR
Shoulder
Camber
SHCAM
(%)
Carriageway
Camber
CWCAM
(%)
Relative
Compaction%
1 KP 3 4 2.5 2 78
2 KK-1 4 3 2.5 2 81.9
3 KK-2 4 3 3 2.5 80.5
4 KK-3 4 4 3 2.5 82.9
5 CP-1 5 4 2 1.7 84.5
6 CP-2 5 3 3 2.5 84.1
7 VK-1 4 4 2.5 2 88.3
8 VK-2 4 2 2.5 2 88.5
9 VK-3 1 1 3.3 3 73.2
10 SA-1 6 3 2.5 2 92.6
11 SA-2 4 2 2.5 2 87.9
12 MV-1 4 3 2.5 2 91.5
13 MV-2 3 4 2.5 2 88.4
14 AK-1 4 4 2.5 2 79.2
15 AK-2 4 4 2.5 2 82.5
Cochin University of Science & Technology 131
Chapter 4 Study Area, Field Investigations and Results
Table 4.12: Pavement Strength and History for roads selected for periodic
evaluation
Sl.
No.
Stretch
ID
Total
pavement
thickness
mm
Structural
Number
SN
CBR
(%)
Modified
Structural
Number
MSN
Year of
last
renewal
1. K-P 320 1.73 10 2.96 2007
2. KK-1 400 2.66 42.0 4.68 2006
3. KK-2 290 1.93 35.0 3.89 2006
4. KK-3 240 1.65 40.0 3.67 2006
5. CP-1 480 3.22 5.9 3.99 2004
6. CP-2 480 3.22 6.9 4.14 2004
7. VK-1 320 2.07 38.4 4.07 2002
8. VK-2 320 2.07 4.2 2.50 2002
9. VK-3 300 1.54 11.9 2.91 2002
10. SA-1 640 4.80 32.5 6.74 2003
11. SA-2 640 4.80 35.0 6.77 2003
12. MV-1 390 3.50 34.6 5.46 2002
13. MV-2 390 3.50 40.5 5.52 2002
14. AK-1 340 1.76 18.8 2.91 2003,
2008
15. AK-2 340 1.76 12.4 2.91 2003,
2008
The Vehicle Damage Factor for the two axle trucks were found to be higher than the
VDF of other class of vehicles. Also on examination of the overloading pattern, it could
be observed that overloading is maximum in case of two axle trucks. These overloaded
trucks can be substituted by trailers or three axle trucks or the excess load can be carried
in another vehicle.
Cochin University of Science & Technology 132
Chapter 4 Study Area, Field Investigations and Results
4.4.6 Periodic evaluation of the pavement
The data on the condition of the pavement, deflection, unevenness and texture depth
were collected periodically, with two data sets in an year. Hence in most of the cases,
six consecutive data sets were obtained. In the case of Skid resistance studies, three sets
of consecutive data were collected from the four study stretches and only one set of data
could be collected from two stretches. Defects in Bituminous Surfacing: - Surface
defects (Bleeding Streaking etc), Deformations (Rutting, Shoving), Disintegration
(Stripping, Raveling, Edge breaks), Cracks (Hairline, Alligator, Longitudinal etc.) were
recorded and their progression with time was also plotted. The data were further
analyzed and those, which showed experimental errors, were omitted from the analysis.
The progression of these parameters are represented as graphs and charts in Chapter 6
and used for model development.
4.4.7 General observations on pavement condition
The studies conducted on the study roads led to the following general observations
regarding the performance of the roads.
4.4.7.1 Kesavadasapuram - Plamoodu Road
This is the section of NH 66 within the capital city with heavy traffic. The surface
condition of the stretch was bad. Different types of distresses such as cracks, potholes,
raveling etc. were observed in the stretch during the first four sets of data collection.
Roughness of the stretch in terms of IRI was 4.4, which is high and the speed of the
vehicle is affected by this. Characteristic deflection of the stretch was 1.13 mm. A
minimum overlay was done before the fifth set of data was taken.
4.4.7.2 Attingal - Kallambalam Road
Attingal–Kallambalam study stretch is the sub urban section of NH 66 and 8 km in
length. Two homogenous sections HS I and HS II were considered for detailed study.
The surface condition of the stretch was good. Cracks were observed throughout the
section uniformly, which is the major distress on surface. The extent of other defects
such as raveling, potholes etc. were found to be less. The average IRI value of the
section conforms to standards.
Cochin University of Science & Technology 133
Chapter 4 Study Area, Field Investigations and Results
4.4.7.3 Kazhakkuttam - Kovalam Road
Kazhakkuttam - Kovalam stretch is 22.4 kms in length and was divided into two
homogeneous sections for the study based on the surface condition. Distress such as
cracks, raveling, potholes etc. was present on some sections, where as major part of the
new surfacing was free from all these distresses. The IRI value of new surface was
within the limits and that of old surface was high.
4.4.7.4 Kottayam - Kumili Road:
The road composition of Kottayam-Kumili Road consists of:
HS 1: 50 BM + 25mm BC laid in April 2003.
HS 2: Unimproved section with only a chipping carpet laid in March 2003.
HS 3: Hilly terrain. The widening was done using 75mm Built up Spray Grout (BUSG).
20mm Mixed Seal surfacing was done for the entire section in 2005.
HS 1: Characteristic Deflection Value obtained using Benkelman Beam Deflection
Technique for HS-1 was 1.56 mm in the first dataset. Overlay was done before the
second data collection and hence lower deflection values were obtained during the
successive data collection stages. Structural stability of the road stretch could be rated as
good based on the deflection values obtained. After the overlay work, the unevenness
value was found to be decreased in second dataset, rating the surface condition as good.
Thereafter, increase in unevenness values were found in successive datasets.
HS 2: Structural stability of the road stretch could be rated as moderate based on the
deflection values obtained in successive datasets. After the overlay work, the deflection
value got decreased and thereafter slight increase in the deflection values was observed.
Higher value of Unevenness/Roughness (7875 mm/km) was obtained before the overlay
of the pavement and as a result of the overlay there was a steep reduction in unevenness
values thereby bringing the pavement in the category of average surface condition.
HS 3: Comparatively higher values of Characteristic Deflection were obtained compared
to the other sections. Higher values of unevenness index were obtained for this section
in successive datasets. This contrasting difference in surface condition and structural
Cochin University of Science & Technology 134
Chapter 4 Study Area, Field Investigations and Results
stability could be due to the steep terrain and topography of this section.
Unevenness/Roughness value was above the serviceability range as per MORTH
Guidelines for Maintenance Management. As per IRC: SP 16-2004, the road stretch was
in poor riding condition.
4.4.7.5 Chavadimukku - Pallippuram Road
The last resurfacing of the road stretch was done in 2003.
HS 1: The characteristic deflection value obtained in six sets of data collection indicated
a marginal increase in course of time. As per the guidelines the pavement can be rated
as reasonably good from structural stability point of view. The unevenness index values
obtained for the stretch also indicated a slight increase in course of time. As per IRC: SP
16-2004, this road comes under average serviceability range. Less distress was observed
on the stretch.
HS 2: The characteristic deflections values of HS II were comparatively lower than HS
1. As indicated by the characteristic deflection values, this road stretch was reasonably
good from structural stability point of view. As per the roughness data, the road stretch
can be categorized under average serviceability range. No noticeable surface defects
were found. The road stretch has desirable skid resistance values. Low values of surface
texture depth indicate the pavement surface to be smooth.
4.4.7.6 Kallambalam - Varkala Road
The last resurfacing of the road stretch was done in 2006 with 60 mm BM and 20 mm
MSS.
HS 1: The characteristic deflection values was found to be increasing slightly in course
of time and as per the guidelines the pavement can be rated as reasonably strong from
structural stability point of view. The unevenness index values of the stretch depicted
that it was having average surface condition as per IRC: SP: 16-2004. There was an
increasing trend for the unevenness index values despite the decreased value in the third
phase due to the patch works done on the surface. No noticeable surface defects were
found. The surface texture depth along the stretch indicated that the road surface was
smooth. The road stretch showed desirable skid resistance also.
Cochin University of Science & Technology 135
Chapter 4 Study Area, Field Investigations and Results
HS 2: As per the guidelines, the pavement could be rated as reasonably strong from
structural stability point of view as indicated by the characteristic deflection values.
There was an increasing trend for the roughness values and deflection values despite the
decreased value in the third phase due to the patch works done on the surface. This road
stretch was having average surface condition as per IRC: SP: 16-2004. No noticeable
surface defects were found. The surface texture depth along the stretch indicated that the
road surface was smooth.
HS 3: Compared to HS 1 and HS 2, this section showed higher values of characteristic
deflection and unevenness index. The roughness values indicated that this stretch was
having poor surface condition as per IRC: SP: 16-2004. Major surface distresses were
observed in this stretch and the deterioration rate was more compared to HS 1 and HS 2.
The stretch indicated higher values of texture depth with coarser surface appearance.
4.4.7.7 Mannanthala - Venjarammoodu Road
HS 1: This road stretch could be rated as reasonably strong from structural stability
point of view as was indicated by characteristic deflection values. As per the unevenness
index values, the road stretch came under average serviceability range. The Skid value
for the road stretch was satisfactory. Some distresses were observed on the road stretch.
The stretch was showing smooth surface texture.
HS 2: This road stretch could be rated as reasonably strong from structural stability
point of view. As per the unevenness index of the stretch, it came under average
serviceability range. The Skid value for the road stretch was satisfactory. The stretch
showed smooth surface texture.
4.4.7.8 Seaport - Airport Road
The Sea Port Airport road constructed in 2003, running between HMT Kalamassery and
Kochi Refineries Ltd is a two lane road of NH standards having a total length 13 km.
The last resurfacing of the road stretch was done in 2003.
HS 1: The pavement could be rated as strong from structural stability point of view due
to the lower characteristic deflection values. As per the roughness values, this road
stretch came under average serviceability range. There was slight increase in roughness
Cochin University of Science & Technology 136
Chapter 4 Study Area, Field Investigations and Results
values and characteristic deflection values in course of time. No noticeable surface
defects were found. The road stretch showed sufficient skid resistance also.
HS 2: Compared to HS I, this section gave higher values of characteristic deflection and
unevenness. Compared to HS I, more surface defects were observed on this stretch in
the initial phases of data collection, but resurfacing was done on the stretch before the
sixth set of data collection. Hence, lower roughness values were obtained in the sixth
data. This section showed sufficient skid resistance.
4.5 SUMMARY
This chapter highlights a brief description of the study stretches highlighting the
condition of the roads with respect to the various investigations carried out. One time
data was collected from all sixty eight urban road sections which include pavement layer
composition, pavement condition, traffic data, characteristic deflection and field density.
From the laboratory analysis of the subgrade soil collected from the trial pits, soil
parameters and CBR values were determined. The Structural Number, Modified
Structural Number, Pavement Condition Index, Relative Compaction, Soil type and CBR
value of subgrade soil for the urban roads are presented in this chapter.
For eight road sections comprising of NH, NH bye pass, urban stretch of NH and other
roads, which were divided into fifteen homogeneous sections, periodic pavement
evaluation was done. One time data for Traffic including axle load data and subgrade
soil properties collected for these roads are presented. VDF values, Modified Structural
Number, Construction Quality represented on a five point scale and Relative
Compaction calculated are also presented in this chapter for these eight roads for
developing the deterioration models.
The general observations about the condition of the roads are given in this chapter based
on the field data collected. On further analysis of the periodic data, charts and graphs are
prepared and presented in Chapter 6. The information thus derived are used to develop
pavement deterioration models which are also discussed in Chapter 6.
*****
Cochin University of Science & Technology 137