chapter 40 analyzing and controlling pharmaceutical expenditures … · 2020. 1. 3. · chapter 40...
TRANSCRIPT
chapter 40
Analyzing and controlling pharmaceutical expendituresSummary 40.240.1 Tools for analyzing costs 40.240.2 Total cost analysis 40.3
Analyzing and controlling costs • Modeling the effect of alternatives for changing the supply system • Compiling the total cost • Standard performance indicators and ratios
40.3 VEN system 40.9Performing VEN analysis • Applications of VEN analysis • Using the VEN system to guide purchases
40.4 ABC analysis 40.13Applications of ABC analysis • Performing ABC analysis
40.5 Therapeutic category analysis 40.19Applications of therapeutic category analysis • Performing therapeutic category analysis
40.6 Price comparison analysis 40.24Acquisition price comparison • Comparison of supply system prices and private-sector prices
40.7 Lead-time and payment-time analysis 40.2640.8 Analysis of expiry dates 40.2840.9 Hidden-cost analysis 40.30References and further readings 40.31Glossary 40.31Assessment guide 40.32
illustrationsFigure 40-1 Efficiency indicators in the supply systems of four
Latin American countries 40.9Figure 40-2 How to perform an ABC value analysis
(step 8) 40.17Figure 40-3 Typical ABC analysis for two pharmaceutical supply
programs 40.19Figure 40-4 Impact of hidden cost on total cost 40.30Table 40-1 Total cost analysis summary 40.4Table 40-2 Sample guidelines for VEN categories 40.10Table 40-3 Examples of medicines classified by the VEN
system 40.11Table 40-4 How to perform an ABC value analysis (steps
1–4) 40.16Table 40-5 How to perform an ABC value analysis (steps 5
and 6) 40.18Table 40-6 Therapeutic category analysis summary 40.20Table 40-7 Therapeutic category analysis—detail with defined
daily dose comparisons 40.22Table 40-8 Price comparison: CMS 30 percent markup
compared with private-sector wholesale and retail prices and NGO prices 40.27
Table 40-9 Lead-time analysis 40.28Table 40-10 Illustrative expiry-date analysis (January
2010) 40.29
boxesBox 40-1 Calculations to fill the pharmaceutical inventory
pipeline 40.7Box 40-2 Determining DDDs and COTs 40.24
country studiesCS 40-1 Analyzing pharmaceutical supply system total costs
and options in Costa Rica 40.8CS 40-2 An example of the VEN analysis process 40.12CS 40-3 Using ABC analysis to control antimicrobial
resistance in Kenya 40.15CS 40-4 Price comparison analysis 40.25
copyright © management sciences for health 2012
Part I: Policy and economic issues Part II: Pharmaceutical management Part III: Management support systemsPlanning and administration
36 Pharmaceutical supply systems assessment37 Managing pharmaceutical programs38 Planning for pharmaceutical management39 Contracting for pharmaceuticals and services40 Analyzing and controlling pharmaceutical expenditures41 Financial planning and management42 Planning and building storage facilities
Organization and managementInformation managementHuman resources management

40.2 PL ANNING AND ADMINISTRATION
40.1 Tools for analyzing costs
The two largest centers of recurrent costs in most public pharmaceutical systems are personnel expenses and phar-maceutical purchases. Controlling personnel costs usually means reducing staff, which may be politically difficult. However, policies may be reformed so that the pharmaceu-tical supply system does not employ extra staff members
who contribute to lowered productivity and increased losses from wastage and theft.
This chapter concentrates on techniques for analyzing costs in the pharmaceutical supply system so that managers can identify major costs, losses, and opportunities for sav-ings. All these techniques have been cited in earlier chapters. Here, the focus is on how to perform each analysis and how to use the results. The techniques considered are—
This chapter focuses on identifying and controlling excess costs in the selection, procurement, distribution, and use of medicines. Several analytical tools are pre-sented that help managers quantify costs and identify areas where costs can be reduced; the information pro-vided is also essential in designing and monitoring inter-ventions to control costs.
Total cost analysis compiles information on variable costs associated with purchasing and inventory manage-ment to help managers consider options for change in terms of their impact on total costs. It is a key tool for pharmaceutical system assessments. The other analytical tools discussed in this chapter may be used as part of a total cost analysis, or they may be used individually for special purposes.
The VEN system categorizes pharmaceuticals by their relative public health value. It is useful in setting purchas-ing priorities, determining safety stock levels and phar-maceutical sales prices, and directing staff activities. The categories in the original system are vital (V), essential (E), and nonessential (N) (sometimes called VED—vital, essential, and desirable). Some health systems find a two-category system more useful than the three-tiered VEN; for example, the categories might be V and N, differen-tiating between those medicines that must always be in stock and other medicines.
ABC analysis examines the annual consumption of medicines and expenditures for procurement by dividing the medicines consumed into three categories. Class A includes 10 to 20 percent of items, which account for 75 to 80 percent of expenditures. Class B items represent 10 to 20 percent of items and 15 to 20 percent of expendi-tures. Class C items are 60 to 80 percent of items but only about 5 to 10 percent of expenditures. ABC analysis can be used to—
• Measure the degree to which actual consumption reflects public health needs and morbidity
• Reduce inventory levels and costs by arranging for
more frequent purchase or delivery of smaller quan-tities of class A items
• Seek major cost reductions by finding lower prices on class A items, where savings will be more noticeable
• Assign import and inventory control staff to ensure that large orders of class A items are handled expedi-tiously
Therapeutic category analysis considers the use and financial impact of various therapeutic categories of medicines and then compares cost and therapeutic benefit to select the most cost-effective medicines in each major therapeutic category. This analysis can be done to select medicines for a formulary or procure-ment list.
Price comparison analysis compares pharmaceutical prices paid by different supply systems as one measure of procurement efficiency. The analysis can also compare supply system acquisition and selling prices with local private-sector prices to gauge the cost-effectiveness of in-house pharmaceutical services and to assess price elastic-ity for cost recovery.
Lead-time analysis is a systematic approach to tracking procurement lead times, determining the points at which lead time can be reduced, and adjusting safety stock appropriately. Payment time should also be analyzed (when delayed payment to suppliers is feasible).
Expiry-date analysis examines levels of stock on hand and their expiry dates and compares this information with average rates of consumption to assess the likeli-hood of wastage (and to develop appropriate counter-measures).
Hidden-cost analysis examines supplier performance to identify any hidden costs incurred because of problems such as late deliveries and short shipments. Hidden costs may make one supplier considerably more expensive than a competitor that offers a higher unit price but bet-ter performance.
s u M M a r y

40 / Analyzing and controlling pharmaceutical expenditures 40.3
• Total cost analysis• VEN system• ABC analysis• Therapeutic category analysis• Price comparison analysis• Lead-time and payment-time analysis• Expiry-date analysis• Hidden-cost analysis
Although these analyses can be carried out manually, the process is very time consuming, except in small supply systems that use relatively few pharmaceutical products. Using a computer to perform these analyses is much eas-ier. Expensive computers and customized software are not required—all the analyses in this chapter can be done with commercial spreadsheet software.
40.2 Total cost analysis
In pharmaceutical supply systems, the total cost of operat-ing the supply system is the sum of pharmaceutical purchase cost, inventory-holding cost, ordering cost, and shortage cost. Total cost analysis compiles the values of these various costs on one data sheet. The manager’s objective is to identify strategies that will minimize the total cost. If an intervention will reduce ordering costs but drive up inventory-holding costs by an amount that produces a net increase in the total cost, it is not worthwhile. Alternatively, a strategy to increase ordering frequency might drive up the costs associated with purchasing, but the net savings in inventory-holding costs might be far greater than the incremental purchasing cost.
Analyzing and controlling costs
Total cost analysis has two basic applications: (1) analyzing current costs to find opportunities for cost reduction and (2) modeling the cost impact of potential changes in the supply system.
Table 40-1 shows a summary sheet for a total cost analysis. In the table, costs and inventory are shown for an illustra-tive warehouse and purchasing office in a Latin American country. Inventory and costs are found at all levels of the sys-tem; in a supply system with several regional warehouses, the inventory (and associated costs) may be considerably higher in the aggregate at the regional level than at the cen-tral warehouse. This result is also true for supply systems in which health facilities hold significant quantities of stock. For the most complete picture, total costs should be calcu-lated for each significant level of the supply system; however, for simplicity’s sake, this example focuses on one central warehouse.
The manager’s objective is to identify apparently excessive costs in one or more cost categories and then to devise strat-
egies to minimize the total cost. A review of the compiled data in Table 40-1 might yield several ideas for reducing costs—
• Reduce the average inventory from the current five months of stock (which would reduce holding costs) by more frequent ordering.
• Reduce the cost of pharmaceutical purchases through more efficient tendering, potentially adding therapeu-tic subcategory tendering.
• Cut down on losses.• Consider whether the number of employees (and sal-
ary costs) can be reduced without harming efficiency.• Cut down on emergency purchases through better
stock management.
Meeting any of these objectives would require trade-offs—when one cost component is reduced, another is likely to increase. For example, suppose that a country has the total cost profile in Table 40-1 and uses annual purchasing almost exclusively. Changing the purchasing system from an annual system to a combination of annual and biannual tenders (see Figure 23-4, in Chapter 23) might possibly reduce the average inventory value by half, but result in two annual tenders, thereby increasing the costs related to pur-chasing.
Holding costs and purchasing costs basically oppose each other. Frequent ordering in small quantities drives up the average cost of placing an order (or managing a tender), because the procurement and accounting offices must go through all the steps on multiple occasions. However, more frequent orders should reduce average stock levels and thus reduce holding costs. Annual ordering in large quantities tends to increase the average inventory level and holding costs but decreases the average annual ordering costs.
Usually an inverse relationship exists between shortage costs and holding costs. The shortage costs in a supply sys-tem are likely to be low when stock levels (and holding costs) are high, and vice versa.
Using the data from Table 40-1, one can model the effects of switching from an annual to a biannual tender. For exam-ple, pharmaceutical acquisition costs are projected to be the same as they were in Table 40-1. Average inventory value decreases by half to 2.9 million U.S. dollars (USD), with an associated decrease in some incremental holding costs: opportunity cost down to USD 290,000; losses down to USD 370,000. This decrease suggests a net savings of USD 660,000 in holding costs, but what are the likely increased costs? Assuming that the additional tender can be managed by existing staff, the additional purchasing costs should be limited to increases in supplies, communications, and other tendering costs. Assuming that these costs double (in the worst case), the extra incremental purchasing costs would be USD 117,000, resulting in a net savings of USD 443,000.

40.4 PL ANNING AND ADMINISTRATION
Table 40-1 Total cost analysis summary
Cost category Total (usD) Incremental (usD) Predictable (usD)
Pharmaceutical acquisition costs
(Includes supplier shipping charges and duty) 14,000,000 14,000,000
Inventory-holding costs
Average inventory, central warehouse
(beginning value plus year-end value, divided by two) 5,800,000 5,800,000
Financial opportunity cost
(10% average interest rate) 580,000 580,000
Losses from inventory
Expiry 69,000 69,000
Spoilage/wastage 18,000 18,000
Loss during repacking 200 200
Short shipments from suppliers 500 500
Obsolete medicines—no longer used 12,000 12,000
Unexplained losses 640,000 640,000
Subtotal 739,700 739,700
Operating costs—storage and stock management
Salaries 665,000 665,000
Space and utilities 117,000 117,000
Communications 4,000 4,000
Supplies 650,000 650,000
Other direct costs 3,700 3,700
Depreciation 46,900 46,900
Administrative overhead NA NA NA
Subtotal 1,486,600 650,000 836,600
Transport costs—to operating units
Salaries 115,000 115,000
Supplies (gas, etc.) 112,000 112,000
Other direct costs 700 700
Depreciation 8,100 8,100
Administrative overhead NA NA NA
Subtotal 235,800 112,700 123,100
Total holding cost 3,042,100 2,082,400 959,700
Holding cost as percentage of average inventory 52%
Percentage incremental and predictable 68% 32%
Purchasing costs
Salaries 72,000 72,000Space and utilities 11,000 11,000Communications 2,000 2,000Supplies 70,000 70,000Other direct costs 400 400Depreciation 5,000 5,000Administrative overhead NA NA NASubtotal 160,400 160,400Total additional costs of annual tender 45,000 45,000Total purchasing cost 205,400 205,400
shortage costs(Estimate 20% emergency purchases at 20% premium) 560,000 560,000
Total cost 17,807,500 16,642,400 1,165,100
Percentage incremental and predictable 93% 7%
Note: Data are based on a composite from Latin America and do not represent any specific country. NA = not applicable; USD = U.S. dollars.

40 / Analyzing and controlling pharmaceutical expenditures 40.5
Of course, the increases would largely be in visible expendi-tures, and the decreases would be in hidden costs, but a real net savings to the system would occur.
Modeling the effect of alternatives for changing the supply system
Suppose that the supply system is considering three options for warehousing and distribution in the future: (1) keeping all services in-house (the current system); (2) keeping ware-housing in-house but contracting out transport; and (3) contracting out both warehousing and distribution. Each of the possible new models implies significant changes in personnel needs and operating costs at the various levels of the supply system. Total cost analysis provides a convenient format to project how the supply system’s operating costs would change with each option.
The basic steps in total cost modeling are the same, what-ever the options being considered. The total cost is compiled for the most recent year for which data are available (as illus-trated in Table 40-1), for one or several levels of the supply system, and adjusted for inflation and expected changes in use, to estimate the total cost with the current system in the year or years in which change would be implemented. Then, for each of the alternate supply system models, the percent-age increase or decrease for each major total cost component is estimated and applied to the baseline cost, again adjusting for inflation and changes in use in subsequent years.
The resulting models are not exact but do predict the relative cost effect of the alternatives being considered. Sometimes the exercise identifies viable interventions that had not been previously considered. For example, in one Latin American country a total cost–modeling exercise showed that total costs could be reduced by consolidating storage at the regional level and privatizing transport and that still greater savings could be gained by contracting out for all warehousing and transport (assuming that the system could be managed). However, the models also showed that a far greater savings in total cost could result from improved medicine selection—if it produced only a 10 percent reduc-tion in pharmaceutical acquisition costs—than could be achieved even by closing all warehouses and contracting out all storage and distribution functions.
The typical annual inventory-holding cost for a commer-cial firm is no more than 25 to 35 percent of the average inventory value, but the percentage could be much higher for a public pharmaceutical supply program. For example, during a multicountry assessment of inventory manage-ment practices in the Caribbean region, one country was found to have an average inventory of twelve months’ con-sumption. The manager of this supply system was very proud of his stock levels, saying that he had no problem with stockouts. Of course, he had not given adequate con-sideration to the costs of holding inventory, which in this
case equaled half the entire annual pharmaceutical pur-chasing budget.
Costs may be either predictable or incremental. If the cost remains the same no matter how many transactions or how much inventory is involved, it is a predictable cost (sometimes called a fixed cost—see Chapter 41). If the cost increases directly with the number of purchases or volume of inventory, it is an incremental cost. In most accounting systems, incremental costs are termed variable costs, but for this analysis, all the costs are variable. By their nature, pharmaceutical acquisition costs, many inventory-holding costs, and shortage costs are incremental; most purchas-ing costs tend to be predictable, but they are likely to have incremental components. Although the difference between predictable and incremental costs can be important, most data from developing countries are insufficient to differenti-ate between the two. In these cases, the focus should be on identifying and addressing the major overall contributors to excessive costs, whether they are predictable or incremental.
Compiling the total cost
Many of the costs discussed in this section are visible, in that they are actual budget expenditures; others are hidden, in that the costs are not expenditures but represent reductions in available resources. Managers should understand that both visible and hidden costs are real.
In most supply systems, data gaps make assembling all this information difficult, but the effort should yield a real understanding of where expenses are concentrated and what sorts of interventions may yield substantial cost savings.
The total cost is made up of four components, which are compiled in one table—
• Pharmaceutical acquisition costs (totally incremental)• Inventory-holding costs (predictable and incremental)• Purchasing costs (predictable and incremental)• Shortage costs (primarily incremental)
Pharmaceutical acquisition costs. These costs are the net cost of all pharmaceutical purchases, including shipping and insurance charges from the manufacturer and any duty or customs fees. They are an incremental cost. Data can be obtained from purchasing records, stock records, or sup-plier invoices.
Inventory-holding costs. The inventory-holding cost has several subcomponents, some of which are incremental and some of which are predictable.
The first entry under “inventory-holding costs” in Table 40-1 is the average inventory value (which is used to calcu-late the percentage of holding costs). The standard basis for valuing inventory is the original net purchase cost rather than the selling price. Four standard methods can be used for determining the original purchase cost for all items in

40.6 PL ANNING AND ADMINISTRATION
inventory: actual value, first-in/first-out (FIFO), last-in/first-out (LIFO), and average value. As discussed in Chapter 41, most pharmaceutical supply systems are unable to accu-rately track actual value and should use either the average value or the FIFO method.
The key is that the method, once chosen, needs to be applied consistently from one financial year to the next; otherwise, year-to-year comparisons of holding costs and financial performance may be invalid.
The standard components of the inventory-holding cost are the following—
Financial opportunity cost is incremental and varies with the average inventory value; it is obtained by multiplying the average inventory value by the average interest rate paid on money-market accounts in local banks (or some-times by the average interest rate charged for short-term loans).
Loss from inventory is often an incremental cost, in that losses rise as inventory values increase. The amounts may be broken down as shown in Table 40-1, to the extent that data are available from inventory records. If data are not available, estimate losses as a percentage of the average inventory value, based on local expert opinion.
Deterioration and spoilage costs for medicines are more likely to occur with poor storekeeping practices, but some risk exists in all warehouses. In general, these costs are incremental—the higher the stock levels, the higher the costs of spoilage.
Expiry costs are often 3 to 5 percent of pharmaceutical inventory each year. If this ratio holds, the costs are incremental as inventory value increases. High expiry costs are a reflection of poor inventory control and store-keeping.
Obsolescence costs apply principally to equipment and spare parts, but changes in formulary lists and prescribing practices may make certain medicines obsolete. These may be viewed as predictable costs; they do not necessar-ily vary with the inventory size or value.
Wastage costs caused by theft, pilferage, and other unex-plained losses add considerably to the cost of carrying inventories. As noted in Chapter 23, losses of 10 percent are not unusual in public pharmaceutical supply systems. These are likely to be incremental costs—the total loss increases as the average inventory rises.
Operating costs for storage and stock management are a mix-ture of predictable and incremental costs. Salaries (which should include benefits), space costs (rent or building depreciation), utilities, communications, other direct costs, and depreciation of equipment are predictable costs unless additional staff, space, or equipment is added to manage a growing inventory. In such a situation, the added costs are incremental. Supplies are primarily incremental, in that more supplies are used as more stock
is stored and distributed. In some settings, a predictable component of the supplies cost may possibly be deter-mined. Data should be obtained from financial records or budget books or (if necessary) by estimates from local experts. If administrative overhead is charged as a cost by the supply system, it should be added in the appropriate percentage to operating costs here.
Transport costs to operating units include predictable costs (salaries and benefits for transport personnel, deprecia-tion of vehicles) and incremental costs (gasoline, repairs, and travel expenses for transport personnel). Again, if more drivers or vehicles were added to cope with an increased workload, these costs would be incremental.
The total of all these costs is the total inventory-holding cost, showing predictable and incremental components.
Purchasing costs. Purchasing costs (sometimes called reordering costs) are the costs associated with managing tenders, placing purchase orders, and receiving goods. Like inventory-holding costs, purchasing costs have several components. Salaries (including benefits) should include wages for all staff who are involved in managing tenders, ordering medicines, and receiving them. Note that some staff may be attached to the warehouse rather than the purchasing office, but for this purpose, their costs should be attributed to purchasing. If warehouse staff members have multiple responsibilities, including some that are related to purchasing, attribute a portion of their cost to inventory-holding and a portion to purchasing. Utilities and space costs include rent, basic communications, and all utilities for the purchasing office. Supplies include all forms used in tenders and purchase orders (this might be broken down into predictable and incremental com-ponents in a perpetual or scheduled purchasing system). Other direct costs include travel costs and maintenance of building and equipment. Depreciation may be calculated on all valuable equipment and on the building if it is owned by the system. Again, if administrative overhead is charged, it should be added using the current percentage. Additional tender costs include costs that are not included in standard purchasing costs but that are associated with the quantification, tendering, and adjudication processes, including travel, per diem, and other costs associated with committee meetings.
In a public pharmaceutical supply system that uses annual or biannual purchasing, most of these purchasing costs can be considered predictable, assuming the existence of a procurement office with permanent staff and office space. In a perpetual system, or a scheduled system with periodic orders, the costs of communications and supplies such as forms are incremental with each order placed.
Data on the individual component costs may be available from financial records or budget books; once the individual component costs (actual or estimated) are obtained and
40 / Analyzing and controlling pharmaceutical expenditures 40.7
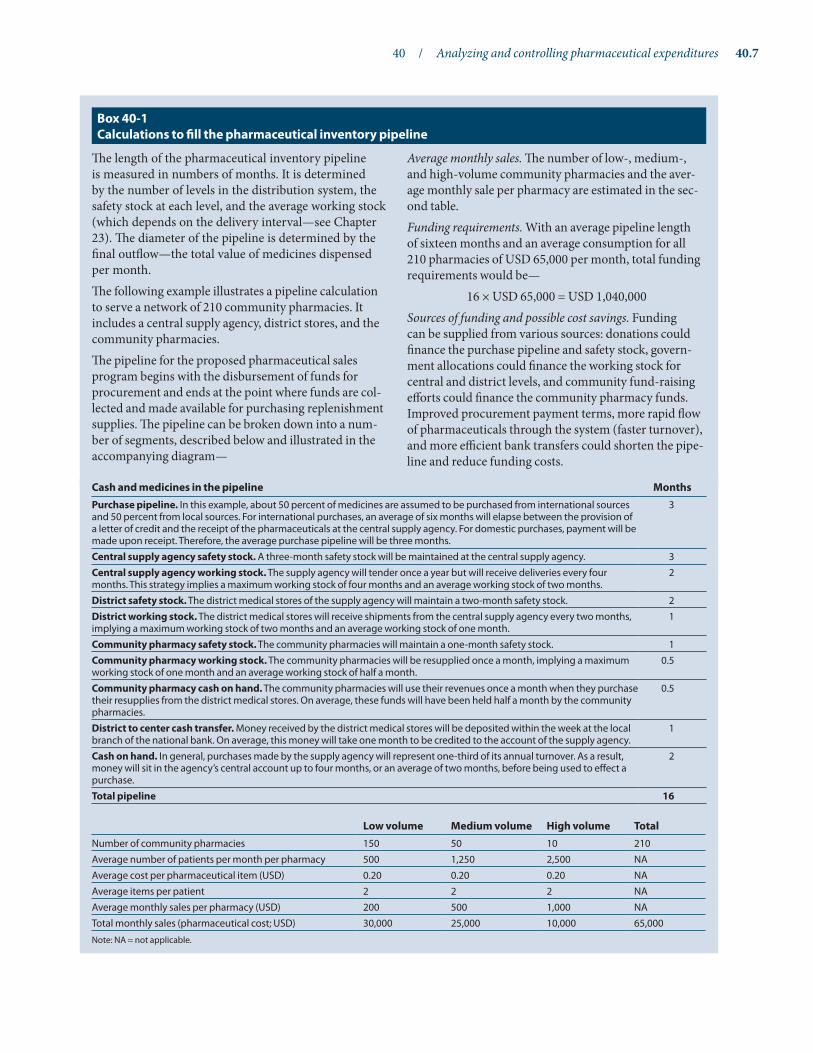
The length of the pharmaceutical inventory pipeline is measured in numbers of months. It is determined by the number of levels in the distribution system, the safety stock at each level, and the average working stock (which depends on the delivery interval—see Chapter 23). The diameter of the pipeline is determined by the final outflow—the total value of medicines dispensed per month.The following example illustrates a pipeline calculation to serve a network of 210 community pharmacies. It includes a central supply agency, district stores, and the community pharmacies.The pipeline for the proposed pharmaceutical sales program begins with the disbursement of funds for procurement and ends at the point where funds are col-lected and made available for purchasing replenishment supplies. The pipeline can be broken down into a num-ber of segments, described below and illustrated in the accompanying diagram—
Average monthly sales. The number of low-, medium-, and high-volume community pharmacies and the aver-age monthly sale per pharmacy are estimated in the sec-ond table.Funding requirements. With an average pipeline length of sixteen months and an average consumption for all 210 pharmacies of USD 65,000 per month, total funding requirements would be—
16 × USD 65,000 = USD 1,040,000Sources of funding and possible cost savings. Funding can be supplied from various sources: donations could finance the purchase pipeline and safety stock, govern-ment allocations could finance the working stock for central and district levels, and community fund-raising efforts could finance the community pharmacy funds. Improved procurement payment terms, more rapid flow of pharmaceuticals through the system (faster turnover), and more efficient bank transfers could shorten the pipe-line and reduce funding costs.
Box 40-1 Calculations to fill the pharmaceutical inventory pipeline
Cash and medicines in the pipeline MonthsPurchase pipeline. In this example, about 50 percent of medicines are assumed to be purchased from international sources and 50 percent from local sources. For international purchases, an average of six months will elapse between the provision of a letter of credit and the receipt of the pharmaceuticals at the central supply agency. For domestic purchases, payment will be made upon receipt. Therefore, the average purchase pipeline will be three months.
3
Central supply agency safety stock. A three-month safety stock will be maintained at the central supply agency. 3Central supply agency working stock. The supply agency will tender once a year but will receive deliveries every four months. This strategy implies a maximum working stock of four months and an average working stock of two months.
2
District safety stock. The district medical stores of the supply agency will maintain a two-month safety stock. 2District working stock. The district medical stores will receive shipments from the central supply agency every two months, implying a maximum working stock of two months and an average working stock of one month.
1
Community pharmacy safety stock. The community pharmacies will maintain a one-month safety stock. 1Community pharmacy working stock. The community pharmacies will be resupplied once a month, implying a maximum working stock of one month and an average working stock of half a month.
0.5
Community pharmacy cash on hand. The community pharmacies will use their revenues once a month when they purchase their resupplies from the district medical stores. On average, these funds will have been held half a month by the community pharmacies.
0.5
District to center cash transfer. Money received by the district medical stores will be deposited within the week at the local branch of the national bank. On average, this money will take one month to be credited to the account of the supply agency.
1
Cash on hand. In general, purchases made by the supply agency will represent one-third of its annual turnover. As a result, money will sit in the agency’s central account up to four months, or an average of two months, before being used to effect a purchase.
2
Total pipeline 16
Low volume Medium volume High volume TotalNumber of community pharmacies 150 50 10 210Average number of patients per month per pharmacy 500 1,250 2,500 NAAverage cost per pharmaceutical item (USD) 0.20 0.20 0.20 NAAverage items per patient 2 2 2 NAAverage monthly sales per pharmacy (USD) 200 500 1,000 NATotal monthly sales (pharmaceutical cost; USD) 30,000 25,000 10,000 65,000
Note: NA = not applicable.
40.8 PL ANNING AND ADMINISTRATION
recorded, they are summed to produce the total purchasing cost.
Shortage costs. Four potential kinds of shortage or stock-out costs exist: excess cost of emergency purchases, loss of revenue when clients purchase outside the system, increased morbidity and mortality caused by stockouts, and loss of goodwill caused by erosion of confidence in the system. Only the first two can be realistically quantified for a public pharmaceutical supply system.
If good procurement records for both regular and emer-gency purchases are available, the actual cost of emergency purchases can be calculated by recording the difference between the emergency cost and the regular cost per unit or package and multiplying by the quantity purchased for each emergency purchase. If data are not available for all emergency purchases, a sample may be used to estimate the average percentage price difference and the percentage of purchases attributable to emergency purchases (as was done in Table 40-1).
If the supply system sells medicines from one level to another, itemized data on actual purchases outside the system may be obtained for items that would normally be purchased inside. An estimate can be made for the value of such purchases based on the breakdown between purchases inside and outside the supply system.
Calculating the total cost. The total cost is calculated as the sum of the subtotals for each component. In Table 40-1, the costs total USD 17.8 million. The major component is pharmaceutical acquisition, but holding costs and shortage costs are significant factors; purchasing costs are the low-est component. As discussed earlier, the inventory-holding costs are mostly incremental, and the purchasing costs are mostly predictable.
Structure of the inventory pipeline. To compile a total cost analysis, one must consider the structure of the sup-ply system to determine where costs are incurred. As dis-cussed in Chapter 22, the inventory management system is similar to a pipeline, with warehouses and health facilities that function as reservoirs where stock is held. To ensure a continuous supply of medicines to patients, the pipeline must be filled; once filled, consumption must be matched by purchases. Box 40-1 illustrates the calculations used to determine pipeline funding and expenditures.
One of the single-most important decisions in terms of cost and efficiency of the distribution system is the number of storage levels in the system. Chapter 22 discusses options for selecting the best structure and considering setup, oper-ating, and inventory-holding costs.
Generally, more levels in the supply system create higher inventory levels and inventory costs, but the increase is not
In Costa Rica, the health care services of almost 90 percent of the population are covered under the govern-ment’s social insurance scheme, the Costa Rica Social Security Fund (CCSS). As part of a health-sector reform project, the CCSS board of directors expressed an interest in addressing issues related to medicine stockouts and a large increase in warehouse costs. Management Sciences for Health (MSH) conducted an assessment of the CCSS distribution system to analyze pharmaceutical supply system costs and identify intervention options to reduce costs through improved efficiency.
The analysis showed the following annual costs in the CCSS system—
• Warehouse operations (USD 2.1 million)• Lease for one regional warehouse (USD 3.6 million)• Inventory losses (USD 779,000)• Financial opportunity cost (USD 7.3 million)
By sector within the distribution system, 58 percent of the costs were associated with the main CCSS warehouse, 41 percent of the costs with system pharmacies, and 1 percent of the costs with the regional warehouses.
MSH analyzed four options to address the issues related to warehouse and distribution costs: (1) strengthening the current system; (2) implementing a direct delivery system, where the pharmaceutical sup-plier would be responsible for storage and distribution; (3) implementing a primary distributor system, which would outsource supply logistics; or (4) implement-ing a mixed system that combines elements of basic models.
As a result of the analysis and recommendations, the government instituted—
• Renewable contracts to reduce the number of phar-maceutical tenders
• An open contract with preselected suppliers to pro-cure emergency supplies
• Direct delivery of large-volume parenterals• Procurement of slow-moving items (orthopedic
supplies) on a consignment basis
The CCSS is also using the postal service to deliver some medicines to patients more efficiently.
Country study 40-1 analyzing pharmaceutical supply system total costs and options in Costa rica

40 / Analyzing and controlling pharmaceutical expenditures 40.9
always directly proportional. Ordering frequency, aver-age supplier lead time, and policies for safety stock have a major effect on inventory levels. As shown in Figure 22-4, in Chapter 22, a supply system with three levels (regional stores, district stores, and health facilities) might have three times the inventory of a two-level system (district stores and health facilities). However, depending on the inventory management system’s operating efficiency, the differences in inventory levels and costs between the two types of sys-tems might be much lower or even greater than that shown in Figure 22-4.
Overstocking at health facilities and lower-level stores can disproportionately affect overall inventory costs. The large number of these units multiplies the impact of overstocking. When conducting an analysis of inventory costs or develop-ing an inventory control policy, the analysis needs to con-sider costs at each level of the system and identify options for rationalizing order frequency and safety stock levels to achieve desired services with the lowest possible total inven-tory in the supply system.
Country Study 40-1 describes a total cost and options analysis in Costa Rica.
Standard performance indicators and ratios
When the total cost has been compiled, several ratios cal-culated from total cost components can serve as basic indi-cators for comparing operating efficiency among different parts of the current supply system (or with alternative mod-els). Standard ratios include—
• Holding cost as a percentage of average inventory, calculated by dividing the total holding cost by the average inventory value and expressing the result as a percentage. In commercial firms, the inventory-holding cost is usually between 25 and 35 percent of average inventory value; in a public pharmaceutical supply system, the percentage may be considerably higher, although it need not be with good inventory management.
• Purchasing costs as a percentage of pharmaceutical acquisition costs, to compare how efficiently the pur-chasing function is managed.
• Average inventory turnover (the total value of medi-cines purchased or distributed, divided by the average inventory value), discussed in Chapter 23.
• Personnel costs, space costs, transport costs, other direct operating costs, each as a percentage of total holding costs, showing the relative proportion of total costs attributable to each category.
• Total holding cost as a percentage of the value of medicines distributed or the value of receipts, giving an indication of the cost-effectiveness of maintaining in-house services rather than contracting out some or
all aspects of storage and distribution. A variation of this ratio is total cost to value of medicines distributed or received.
Figure 40-1 illustrates two efficiency indicators in four Latin American countries.
40.3 VEN system
The VEN system sets priorities for selection, procurement, and use according to the potential health impact of individ-ual medicines. VEN assigns each pharmaceutical product on the formulary or essential medicines list to one of the fol-lowing three categories—
V: vital medicines are potentially lifesaving, have significant withdrawal side effects (making regular supply manda-tory), or are crucial to providing basic health services.
Figure 40-1 Efficiency indicators in the supply systems of four Latin American countries
a. stock-turnover ratio
Note: The ratio represents the total value of medicines purchased or distributed, divided by the average inventory value.
b. Inventory-holding costs
Note: The percentage represents holding cost as a percentage of average inventory, calculated by dividing the total holding cost by the average inventory value.
Suriname
1.5
Costa Rica
2.5
0
0.5
1
1.5
2
2.5
3
3.5
0
10%
20%
30%
40%
50%
60%
70% 65%
El Salvador
26%
Suriname
63%
Ecuador
30%
Costa Rica
El Salvador
1.3
Ecuador
3.3
Suriname
1.5
Costa Rica
2.5
0
0.5
1
1.5
2
2.5
3
3.5
0
10%
20%
30%
40%
50%
60%
70% 65%
El Salvador
26%
Suriname
63%
Ecuador
30%
Costa Rica
El Salvador
1.3
Ecuador
3.3

40.10 PL ANNING AND ADMINISTRATION
E: essential medicines are effective against less severe but nevertheless significant forms of illness but are not abso-lutely vital to providing basic health care.
N: nonessential medicines are used for minor or self-limited illnesses, are of questionable efficacy, or have a comparatively high cost for a marginal therapeutic advantage.
Assignment to the nonessential category does not mean the medicine is no longer on the system’s formulary or essential medicines list; in many cases, medicines for minor illnesses are included on the essential medicines list but may be considered a lower priority for procurement than other medicines.
The classification of medicines should not be a one-time exercise. As the national formulary or essential medicines list is updated, and as public health priorities change, the VEN or VN categories should be reviewed and updated. Any new medicines added to the list should be categorized appropriately, and category assignments for older medicines should be reviewed and changed if needed.
The VEN system was developed in Sri Lanka, where it was first applied to importations by the State Pharmaceuticals Corporation. All pharmaceuticals procured by the cor-poration were reviewed by a clinical pharmacologist and assigned to one of the three categories. Since the first edition of this book in 1981, the VEN approach has been adapted and used in other countries around the world.
Some supply systems may find maintaining and updating the three-tiered VEN system difficult; they may find decid-ing how to classify certain medicines hard. An alternative is a two-tiered VN system, in which vital medicines are those that should be available at all times, and nonessential medi-cines, although still on the formulary, are of lower priority and should be purchased only after the need for all vital medicines is satisfied.
Either system—two or three categories—will work if the system is maintained; the main objective is an ongoing system to give priority to essential, lifesaving medicines as opposed to expensive nonessential items.
Performing VEN analysis
Because of its broad implications for procurement and use, classification of medicines into VEN or VN categories is probably best done by a designated expert committee, such as a national formulary committee. The classification should be determined primarily on the basis of the public health impact of individual medicines. Unit prices should be a secondary consideration, and popularity of medications should have minimal influence on the process. Table 40-2 provides sample guidelines for establishing VEN categories. Examples of medicines classified under this method are given in Table 40-3.
Applications of VEN analysis
The major uses of VEN analysis are assigning priorities for medicine selection, procurement, and use in a supply sys-tem; guiding inventory management activities; and deter-mining appropriate medicine prices.
Selection: Vital and essential medicines should be given pri-ority in selection, especially when funds are short.
Procurement: A medicine’s VEN classification may affect the following—
• Order monitoring: Orders for vital and essential medi-cines should be monitored closely, as shortages in these items require expensive air shipment of supplies.
• Safety stock: Safety stocks should be higher for vital and essential items. Inventory savings can be realized by
Table 40-2 Sample guidelines for VEN categories
Characteristic of medicine or target condition Vital Essential NonessentialOccurrence of target condition
Persons affected (percent of population) Over 5 1–5 Less than 1
Persons treated (number per day at average health center) Over 5 1–5 Less than 1
severity of target condition
Life-threatening Yes Occasionally Rarely
Disabling Yes Occasionally Rarely
Therapeutic effect of medicine
Prevents serious disease Yes No No
Cures serious disease Yes Yes No
Treats minor, self-limited symptoms and conditions No Possibly Yes
Has proven efficacy Always Usually May or may not
Has unproven efficacy Never Rarely May or may not

40 / Analyzing and controlling pharmaceutical expenditures 40.11
reducing safety stocks of nonessential items.• Order quantities: If funds are short, the VEN system
should be used to ensure that enough quantities of vital and essential medicines are bought first.
• Supplier selection: Only reliable suppliers should be used for vital and essential medicines. Quality and ser-vice for new and unknown suppliers can be tested by awarding them contracts for nonessential medicines.
Use: Review of usage by VEN categories may suggest under use of vital or essential items or overuse of non-essential items. VEN or VN categories can be compared with ABC analysis and therapeutic category analysis (see following sections) to monitor how well actual use com-pares with priorities.
Pricing in pharmaceutical sales programs: Higher prices on popular but marginally useful items, such as cough and cold remedies, can be used to subsidize immunizations and antibiotics.
Stock control: Special attention should be paid to stock lev-els of vital and essential items to avoid stockouts.
Assignment of staff: Stock clerks and other inventory control staff who are more experienced or more skilled should be assigned to keep track of vital and essential items.
Country Study 40-2 describes the application of the VEN system.
Using the VEN system to guide purchases
The VEN (or VN) system helps minimize distortions in the pharmaceutical procurement process and thus maximizes the health effect of available funds. When procurement quantities must be reduced, these steps can be taken—
Step 1. Classify all medicines on the national essential medi-cines list as V, E, or N (or V or N): If the funding shortage is temporary, consider options for limiting individual
Table 40-3 Examples of medicines classified by the VEN system
Vital Essential Nonessential
Criteria • Potentially lifesaving• Significant withdrawal side effects• Major public health importance
• Effective against less severe but nevertheless significant forms of illness
• Used for minor or self-limited illnesses• Questionable efficacy• High cost for marginal therapeutic
advantage
Health center
• Phenobarbitone sodium tablet, 30 g• Phenoxymethylpenicillin tablet, 250
mg• Co-trimoxazole tablet, 480 mg• Nystatin pessaries, 100,000 units• Artemether-lumefantrine tablet,
20 mg + 120 mg• Ferrous sulfate/folic acid tablet,
200 mg/0.5 mg• Adrenaline injectable, 1/1,000,
1 mL ampoule• Oral rehydration salts (ORS) powder,
1 liter (WHO)• Gentamicin injectable, 40 mg/mL,
2 mL vial• Condoms with spermicide• Measles vaccine, live injectable,
10-dose (5 mL) vial• Ergometrine maleate injectable,
500 mcg/mL, 1 mL ampoule• Salbutamol sulfate tablet, 4 mg• Vitamin A capsule, 200,000 IU
• Lignocaine HCl injectable 1%, 25 mL vial
• Praziquantel tablet, 600 mg• Gentian violet paint, aqueous 0.5%,
500 mL• Benzyl benzoate application, 25%,
100 mL• Magnesium trisilicate complex tablet,
chewable• Chlorpromazine HCl tablet, 25 mg• Aminophylline tablet, 100 mg• Vitamin B complex tablet• Aluminum acetate eardrops, 13%• Zinc oxide ointment, 15%• Mebendazole tablet, 200 mg• Ferrous sulfate mixture, pediatric,
60 mg/5 mL• Chlorpheniramine maleate tablet,
4 mg• Lidocaine + adrenaline dental
cartridge 2% + 1/80,000
• Lignocaine + adrenaline injectable, 1% + 1/200,000
• Aspirin tablet, pediatric, 75 mg• Suramin sodium injectable,
1 g vial, powder for reconstitution• Nystatin tablet, 500,000 units• Amodiaquine tablet, 200 mg base• Migril tablet• Ferrous sulfate tablet, 200 mg• Propranolol HCl tablet, 10 mg• Magenta paint, 20 mL• Anti-snakebite serum injectable,
10 mL amp• Ergometrine maleate tablet, 500 mcg• Vitamins, multiple pediatric drops• Thymol mouthwash solution tablet
District hospital
• Diazepam injectable, 5 mg/mL, 2 mL ampoule
• Atropine sulfate injectable, 600 mcg/mL, 1 mL ampoule
• Nalidixic acid tablet, 500 mg• Isoniazid + thiacetazone tablet, (HT3)
300 mg/150 mg• Digoxin tablet, 250 mcg
• Diazepam tablet, 5 mg• Paracetamol tablet, 500 mg• Codeine phosphate tablet, 15 mg• Amoxicilline elixir, 125 mg/5 mL• Erythromycin suspension, 125 mg/
5 mL

40.12 PL ANNING AND ADMINISTRATION
order quantities (and increasing order frequency) for high-turnover V and E medicines, as determined by ABC analysis (see Section 40.4).
Step 2. Reconsider the proposed purchase quantities to make sure they are justified: Check assumptions, order formu-las, and the accuracy of calculations. Particular attention should be paid to V and E medicines, because they will be the last eliminated from the list.
Step 3. Try to find additional funds: A clear and well- documented presentation of a system’s requirements may result in increased pharmaceutical budget allocations or additional funds from donors. Introduction of a cost-recovery or a cost-sharing system may be an alternative source of additional funds in the long term (see Chapter 13).
Step 4. Remove from the procurement list any N medicines for which no clear therapeutic need exists: Then reassess funds in relation to revised estimates. If a funding gap still exists, proceed to Step 5.
Step 5. Reduce quantities of or eliminate other N items, and reassess the estimated procurement cost for remaining
items: If requirements still exceed the available budget after all N items are eliminated, proceed to Step 6.
Step 6. Limit therapeutic duplications: If the list of V and E items (or V items in a VN system) contains more than one medicine with a similar therapeutic effect, some tendering by therapeutic subcategory may be possible (see Chapters 18 and 21). If certain medicines are usually purchased in more than one strength, it may be possible to limit such duplication and reduce total quantities for the medicines in question. If these sorts of adjustments are not feasible, or if they do not produce the necessary cost reductions, proceed to Step 7. Therapeutic category analysis (Section 40.5) may be useful to identify opportu-nities for limiting duplication.
Step 7. Reduce the quantities of medicines that must be pur-chased using the “preferential weighting” or “equal misery” approach: With a VN system, this step applies to all remain-ing medicines on the list. With a VEN system, one option is to purchase the entire quantity of V medicines and allo-cate remaining funds among E medicines. The alternative is to reduce quantities of both V and E medicines.
A country’s ministry of health (MOH) felt the need to further prioritize the medicines on its essential medi-cines list (EML) for procurement for the public sector because its limited resources prevented the central medi-cal stores (CMS) from ensuring the continuous availabil-ity of all products on the EML.
The national medicines committee (NMC), the com-mittee responsible for selecting medicines and updating the EML, started planning its review of the list as part of an ongoing review process to prioritize items on the list using VEN principles. In preparation for a two-day national meeting, all members of the NMC received information on amendments to the EML proposed by various health workers (along with scientific evidence backing up the proposals). Members also received a draft protocol for the VEN allocation exercise, clarifying both the rationale for the exercise (continuous availability of the most important medicines) and the proposed thera-peutic criteria for allocation to V, E, or N categories. In addition, they received a list of all medicines on the EML by level of use and therapeutic group, with a suggested VEN allocation prepared by the NMC secretariat, with assistance from selected clinicians.
At the start of the meeting, participants agreed that in view of the economic circumstances, all items of limited therapeutic benefit (N medicines) should be removed
from the list. They then used the VEN system to allocate medicines to V or E according to therapeutic relevance.
Early on during the meeting, it became clear that the NMC had to reinterpret the VEN criteria to reach con-sensus. For example, according to the original criteria, paracetamol did not qualify as a vital medicine. However, the majority of the committee members believed that because of the public health implications (that is, paracetamol is an antipyretic and also used for non-specific complaints), it should be a V item.
In addition to allocation by therapeutic relevance, the NMC allocated all items by level of use (H, health cen-ter; D, district hospital; and C, central hospital) and by expected consumption (A for high- and B for low-con-sumption medicines).
The NMC agreed with the CMS that the CMS’s first responsibility should be to ensure the continuous avail-ability of vital high-consumption items (especially HVA items). Procurement of all other medicines would depend on the availability of additional funds. In addition, the CMS would not routinely stock low-consumption (especially DEB and CEB) items. Finally, clients (hospi-tals and districts) would be responsible for ordering all B items well in advance (for example, once a year at the beginning of the financial year).
Country study 40-2 an example of the VEN analysis process

40 / Analyzing and controlling pharmaceutical expenditures 40.13
The preferential weighting strategy protects one or more classes of medicines or one or more classes of facilities.
In one variation, the highest-priority classes are exempted from the cuts, and quantities of remaining medicines (or facility estimates) are reduced until the procurement bud-get balances with estimated purchases. Another option is to reduce quantities for the highest-priority classes less than for the lower-priority classes.
The equal misery strategy for reducing quantities is sometimes applied to pharmaceuticals or facilities. If it is applied to a single list of medicines, all medicine quantities are reduced by an equal percentage until the necessary cost reductions are achieved. If equal misery is applied to indi-vidual health facility estimates, all health facility estimates are reduced by the same percentage. Equal misery is not recommended for general use in the public pharmaceuti-cal supply system—in most situations, preference should be given to certain medicines (and sometimes to certain types of health facilities).
40.4 ABC analysis
A well-known fact in supply chain management is that a relatively small number of items account for most of the value of annual consumption. The analysis of this phenom-enon is known as Pareto analysis or, more commonly, ABC analysis.
In any supply system, analyzing consumption patterns and the value of total consumption for all items is useful; in all but the smallest systems, inventory items can be clas-sified into three categories (A, B, and C) based on the value of their annual usage. Related tools such as therapeutic cate-gory analysis and price comparison analysis build on the basic ABC analysis, and the data for these analyses can be compiled as the ABC analysis is constructed by adding data columns to the spreadsheet.
A, B, and C categories are not assigned categories like VEN categories; each line item is categorized based on the result of a particular ABC analysis. If use patterns change, the item may fall into a different category the next time ABC analysis is performed.
Applications of ABC analysis
ABC analysis is an extremely powerful tool, with uses in selection, procurement, management of distribution, and promotion of rational medicine use.
Selection. Review of class A medicines may uncover high-use items for which lower-cost alternatives are avail-able on the formulary or in the marketplace. The ABC analysis also helps managers identify purchases made for items that are not on the formulary or essential medi-cines list or not approved for use in the supply system.
In a West African country, analyses of consumption in a sample of twenty health facilities showed that three of the facilities (15 percent) continued to use and stock ampi-cillin suspension regularly, although it had been deleted from the national formulary five years earlier in favor of amoxicilline.
Procurement. ABC analysis can be useful to facilitate procurement-related activities, such as determining sources for lower-priced products, assuring procurement is in line with public health priorities, and assessing how order fre-quency affects overall supply—
Determining order frequency: Ordering class A items more often and in smaller quantities should lead to a reduction in inventory-holding costs. Note that order frequency and quantity influence supply activities in at least six ways: (1) they determine average inventory (higher order quantity means higher inventory levels); (2) they determine procurement workload (higher order quantity means a lower number of orders, and vice versa); (3) they determine safety stock (more frequent ordering means less inventory and less safety stock); (4) they influence bulk prices (larger orders mean more special bulk rates); (5) they determine storage space requirements for medi-cines; and (6) they influence the likelihood of losses to expiry (less frequent bulk purchasing may lead to more expired medicines).
Seeking lower-cost sources for class A items: The procure-ment office should concentrate on getting lower prices for class A items by looking for cheaper dosage forms or cheaper suppliers. Price reductions for items classified as A products in the analysis can lead to significant savings.
Monitoring order status: Emphasis should be placed on monitoring the order status of class A items, because an unexpected shortage may lead to expensive emergency purchases.
Monitoring procurement priorities: As mentioned in the VEN system discussion, ABC analysis can help monitor procurement patterns in comparison with health system priorities. For example, an ABC analysis of Kenya’s con-sumption of antiretrovirals showed the high proportion of the budget dedicated to nevirapine. After switching to procurement of generic nevirapine, its value shifted significantly—from representing 40 percent of the anti-retroviral budget in 2005 to about 9 percent in 2007.
Comparing actual and planned purchases: ABC analysis can be used to compare actual and planned purchases in a public-sector supply system. For example, in one Latin American ministry of health supply system, the original procurement budget for the year specified that 97 items would be purchased through tender at an estimated cost of USD 2.5 million. ABC analysis of the year’s two tenders showed that 124 items were actually purchased, at a total cost of USD 3.36 million. Of the

40.14 PL ANNING AND ADMINISTRATION
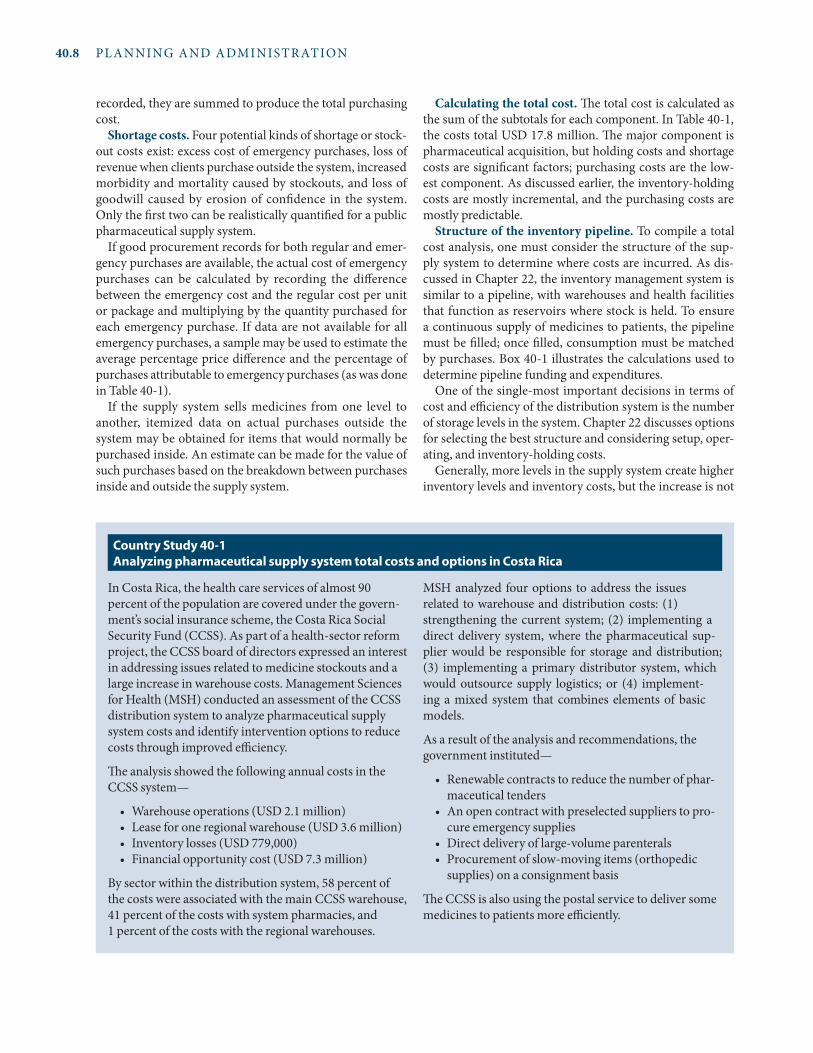
ABC ANALYSIS SHOWS THAT ALL MEDICINES ARE NOT CREATED EQUAL A few medicines
consume the majority of funds.
I know my priorities.
HIGHEST POTENTIAL FOR SAVINGS
SOME ADDITIONAL SAVINGS POSSIBLE
HIGH MANAGEMENT INPUT REQUIRED
FOR PRACTICALLY NO COST REDUCTION
High volume, high unit cost
A larger number of medicines
The majority of inventory

40 / Analyzing and controlling pharmaceutical expenditures 40.15
124 items purchased, 61 (nearly half) did not appear on the original procurement plan, and 34 of the medicines that had been on the plan were not purchased. The cost of the unplanned medicines was USD 1.17 million. Senior health system managers were unpleasantly surprised to learn of these discrepancies, and reforms in quantifica-tion and procurement procedure were devised for the procurement office.
Distribution and inventory management. In addition to selection and procurement, ABC analysis can also help with distribution and inventory management activities such as the following—
Monitoring shelf life: Emphasis should be given to class A items to minimize waste caused by medicines exceeding their shelf lives.
Delivery schedules: Even when all medicines are ordered only once a year, divided deliveries of class A items can lead to increased shelf lives.
Stock count: As discussed in Chapter 23, cyclic stock counts should be guided by ABC analysis, with more frequent counts for class A items.
Storage: Improving control for the issuance and storage of class A medicines at user points, such as hospitals and health centers, can minimize waste, pilferage, and orga-nized theft of medicines.
Use. Review of high-use items by health officials, practic-ing physicians, and other health workers may suggest areas of overuse and underuse as exemplified in a Kenya hospital (Country Study 40-3).
Performing ABC analysis
ABC analysis can be applied to total annual consumption, to consumption during a short period, or to a particular tender or set of tenders; the basic methodology is the same no matter which data are used. The basic steps are also the same whether the ABC analysis is done manually or by computer, although the process is much easier with a com-puter.
The process is described in eight steps and illustrated in Tables 40-4 and 40-5 and Figure 40-2; the example used in the illustrations comes from an essential medicines program in Central Asia in 2010. The values shown are for part of one tender and do not represent annual pharmaceutical con-sumption in the country.
Step 1. List all items purchased or consumed and enter the unit cost: The cost is for one basic unit of an item (column 3 of Table 40-4). The basic unit should be the same as the issue unit tracked on stock records, except when a smaller basic unit such as a milliliter or a gram is needed to incorporate several different bottle, tube, or vial sizes
The Drug and Therapeutics Committee (DTC) at Aga Khan University Hospital in Nairobi established a multi-disciplinary antimicrobial subcommittee to focus on interventions to contain antimicrobial resistance. The DTC did an ABC analysis of 793 medicines for 2005 and found that the top four products were antimicrobials, accounting for almost 10 percent of the medicine budget. Meropenem, an expensive, broad-spectrum carbapenem, had the highest consumption by value.
Top five medicines by value in aBC analysis for 2005
Medicine Quantity
Cumulative percentage of budget
Meropenem, injectable, 1 g 3,346 3.44
Tazocin, injectable, 4.5 g 3,056 5.62
Augmentin, injectable, 1.2 g 15,212 7.70
Zinnat, tablets, 500 mg 48,422 9.60
The results of a retrospective drug use evaluation on Meropenem from 100 inpatient records reinforced the
need for its rational use: only 40 patients received the standard treatment regimen (5–7 days); 35 received it despite inappropriate indications; 27 patients got a sub-therapeutic dose; and 27 patients were given a 7–14-day regimen without valid justification.
In response, the DTC endorsed the development of an order sheet that restricted the use of Meropenem and six other antimicrobials. The antimicrobial order sheet was piloted in the intensive care unit and in surgical and medical wards. It was subsequently refined and launched hospitalwide. The DTC also endorsed the subcommittee recommendation that the microbiolo-gist be involved in intensive care unit rounds, where the threat of antimicrobial resistance is high. Health care providers received information on the correct use of Meropenem and other antibiotics. The ABC analysis was repeated for 2006, and the results showed a 62 per-cent decrease in Meropenem consumption compared with 2005. Source: Shah, Konduri, and Gunturu 2007.
Country study 40-3 using aBC analysis to control antimicrobial resistance in Kenya

40.16 PL ANNING AND ADMINISTRATION
Table 40-4 How to perform an ABC value analysis, using 2010 data from a Central Asian country (steps 1–4)
1 2 3 4 5 6
Product description Basic unit
unit tender price (local currency)
Total units purchased over twelve months
Value (local currency)
Percentage of total value
Acyclovir 200 mg Tablet 5 3,700 18,500 0.95
Amikacin 100 mg Ampoule 50 340 17,000 0.87
Amino acid 500 mL Bottle 80 425 34,000 1.75
Amoxicilline 250 mg Capsule 3 6,000 18,000 0.93
Amoxicilline 500 mg Capsule 4 5,760 23,040 1.18
Ampicillin 1 g Vial 22 6,270 137,940 7.09
Ampicillin 500 mg Vial 18 11,930 214,740 11.04
Atropine sulfate 0.5 mg Ampoule 8 1,205 9,640 0.50
Benzathine benzylpenicillin 1.2 M IU Vial 20 1,475 29,500 1.52
Calcium D3 Bottle 30 400 12,000 0.62
Cefazolin 1 g Vial 40 805 32,200 1.65
Cefotaxime 1 g Vial 40 512 20,480 1.05
Ceftazidime 1 g Vial 50 250 12,500 0.64
Ceftriaxone 1 g Vial 40 905 36,200 1.86
Ceftriaxone 2 g Vial 60 200 12,000 0.62
Chloramphenicol 1 g Vial 22 720 15,840 0.82
Ciprofloxacin 250 mg Tab 5 5,000 25,000 1.29
Cloxacillin 500 mg Tablet 3 5,000 15,000 0.77
Diclofenac 75 mg/3 mL Ampoule 10 1,557 15,570 0.80
Dopamine 200 mg Ampoule 63 770 48,510 2.50
Erythromycin 250 mg Tablet 2.5 34,860 87,150 4.48
Gentamicin 80 mg Ampoule 20 8,549 170,980 8.79
Glucose 1,000 mL Bottle 25 5,186 129,650 6.67
Glucose 500 mL Bottle 25 1,195 29,875 1.54
Ketamine 500 mg Vial 110 2,348 258,280 13.28
Metronidazole 400 mg Tablet 40 440 17,600 0.91
Mix 500 mL Bottle 35 1,320 46,200 2.37
Morphine 10 mg Tablet 110 100 11,000 0.56
NaCl 1,000 mL Bottle 25 4,720 118,000 6.07
Penicillin crystal 1 million IU Vial 8 3,200 25,600 1.32
Penicillin procaine 2 million IU Vial 10 1,900 19,000 0.98
Phenobarbital 100 mg Ampoule 45 349 15,705 0.81
Polyvitamin Tablet 2 9,000 18,000 0.93
Povidone iodine 450 cc Bottle 85 656 55,760 2.87
Ringer’s lactate 1,000 mL Bottle 35 4,337 151,795 7.80
Ringer’s lactate 500 mL Bottle 35 670 23,450 1.20
Silver sulfadizine 1% Tube 60 315 18,900 0.97
Total 1,944,605
IU = international units.
40 / Analyzing and controlling pharmaceutical expenditures 40.17
for the same item. See Chapter 50 for a discussion of issue units, basic units, and pack sizes.
Ideally, the actual CIF (cost, insurance, and freight) acquisition unit cost for all items should be used, but this cost is difficult to track when multiple purchases of an item have been made at different prices. The most accurate alternatives are a weighted average or a FIFO average, as discussed in Chapter 41. In Table 40-4, the unit cost of one basic unit (tablet) of acyclovir was 5 units of the local currency, which is the equivalent of USD 0.012.
Step 2. Enter consumption quantities: Enter the number of basic units consumed or purchased during the period under review. Make sure that the same review period is used for all items to avoid invalid comparisons. Table 40-4 shows that for acyclovir, 3,700 tablets were pur-chased over the twelve months under review.
Step 3. Calculate the value of consumption: Multiply the unit cost by the number of units consumed or purchased to obtain the total value for each item. In Table 40-4, column 5 shows that for acyclovir, the total value of pur-chases was 18,500 local currency, or USD 430. After this amount is calculated for each item, add up the total value of all items at the bottom of column 5.
Step 4. Calculate the percentage of total value represented by each item: Divide the value of each item by the total value of all items. Enter the results for each item under the heading “Percentage of Total Value,” as shown in column 6 of Table 40-4. At this point, any ABC list will look something like Table 40-4; in the example, amika-cin (the second item) represented 0.87 percent of total value. (Carrying the percentage to two decimal places is useful because several items may be close together in value and many may represent less than 1 percent of total value. The data are easier to understand when these items are clearly differentiated with two decimal places.)
Step 5. Rearrange the list: Rank the items in descending order by total value (column 5), starting at the top with the highest value. For example, in Table 40-4, the highest-value item was ketamine, which now becomes item 1; ampicillin 500 mg moves to second place, and so forth. This rearrangement yields a list that is also ordered by percentage of total value, as in Table 40-5.
Step 6. Calculate the cumulative percentage of total value for each item: Beginning with the first item at the top of Table 40-5, add the percentage in column 6 to that of the item below it in the list (creating column 7). For example, ketamine represented 13.28 percent of total procurement value. Ampicillin 500 mg represented 11.04 percent; the cumulative percentage of the two items was 24.32 percent (rounded) of total procurement value.
Step 7. Choose cutoff points or boundaries for class A, B, and C medicines: In general, the following boundaries are
used: A items have the highest annual usage, with 10 to 20 percent of the items usually accounting for 75 to 80 percent of the funds spent. B items represent another 10 to 20 percent of the items and use 15 to 20 percent of the funds, and C items account for 60 to 80 percent of the items but only 5 to 10 percent of the value of annual con-sumption.
These boundaries are somewhat flexible; for example, class A status might be given to items that cumula-tively account for 70 percent of the funds. The decision depends on how volume and value are dispersed among items on the list and how the results of the ABC analy-sis are going to be used. If class A items are going to be managed more intensively than class B and C items, allocation of items to class A must be based on manage-ment capacity. Using the suggested boundaries with the Central Asian example would result in only two products in the A category; therefore, cumulative value might be the more appropriate way to categorize in this instance.
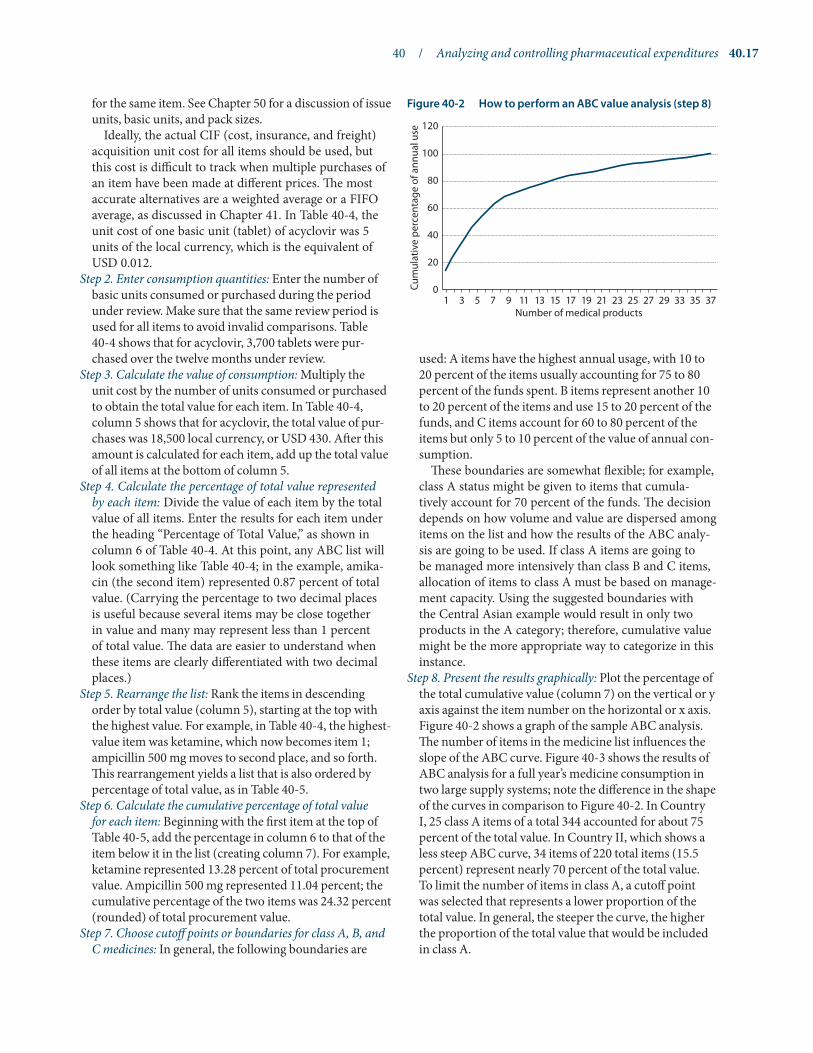
Step 8. Present the results graphically: Plot the percentage of the total cumulative value (column 7) on the vertical or y axis against the item number on the horizontal or x axis. Figure 40-2 shows a graph of the sample ABC analysis. The number of items in the medicine list influences the slope of the ABC curve. Figure 40-3 shows the results of ABC analysis for a full year’s medicine consumption in two large supply systems; note the difference in the shape of the curves in comparison to Figure 40-2. In Country I, 25 class A items of a total 344 accounted for about 75 percent of the total value. In Country II, which shows a less steep ABC curve, 34 items of 220 total items (15.5 percent) represent nearly 70 percent of the total value. To limit the number of items in class A, a cutoff point was selected that represents a lower proportion of the total value. In general, the steeper the curve, the higher the proportion of the total value that would be included in class A.
Cum
ulat
ive
perc
enta
ge o
f ann
ual u
se 120
100
80
60
40
20
0
Number of medical products1 3 5 7 9 11 13 15 17 19 21 23 25 27 29 33 35 37
Figure 40-2 How to perform an ABC value analysis (step 8)

40.18 PL ANNING AND ADMINISTRATION
Table 40-5 How to perform an ABC value analysis, using 2010 data from a Central Asian country (steps 5 and 6)
1 2 3 4 5 6 7
Product description Basic unit
unit tender price (local currency) Total units
Value (local currency)
Percentage of total value
Cumulative percentage
of total value
1 Ketamine 500 mg Vial 110 2,348 258,280 13.28 13.28
2 Ampicillin 500 mg Vial 18 11,930 214,740 11.04 24.32
3 Gentamicin 80 mg Ampoule 20 8,549 170,980 8.79 33.11
4 Ringer’s lactate 1,000 mL Bottle 35 4,337 151,795 7.80 40.91
5 Ampicillin 1 g Vial 22 6,270 137,940 7.09 48.00
6 Glucose 1,000 mL Bottle 25 5,186 129,650 6.67 54.67
7 NaCl 1,000 mL Bottle 25 4,720 118,000 6.07 60.74
8 Erythromycin 250 mg Tablet 2.5 34,860 87,150 4.48 65.22
9 Povidone iodine 450 cc Bottle 85 656 55,760 2.87 68.09
10 Dopamine 200 mg Ampoule 63 770 48,510 2.50 70.59
11 Mix 500 mL Bottle 35 1,320 46,200 2.37 72.96
12 Ceftriaxone 1 g Vial 40 905 36,200 1.86 74.82
13 Amino acid 500 mL Bottle 80 425 34,000 1.75 76.57
14 Cefazolin 1 g Vial 40 805 32,200 1.65 78.22
15 Glucose 500 mL Bottle 25 1,195 29,875 1.54 79.76
16 Benzathine benzylpenicillin 1.2 million IU Vial 20 1,475 29,500 1.52 81.28
17 Penicillin crystal 1 million IU Vial 8 3,200 25,600 1.32 82.60
18 Ciprofloxacin 250 mg Tablet 5 5,000 25,000 1.29 83.89
19 Ringer’s lactate 500 mL Bottle 35 670 23,450 1.20 85.09
20 Amoxicilline 500 mg Capsule 4 5,760 23,040 1.18 86.27
21 Cefotaxime 1 g Vial 40 512 20,480 1.05 87.32
22 Penicillin procaine 2 million IU Vial 10 1,900 19,000 0.98 88.30
23 Silver sulfadizine 1% Tube 60 315 18,900 0.97 89.27
24 Acyclovir 200 mg Tablet 5 3,700 18,500 0.95 90.22
25 Amoxicilline 250 mg Capsule 3 6,000 18,000 0.93 91.15
26 Polyvitamin Tablet 2 9,000 18,000 0.93 92.08
27 Metronidazole 40 mg Tablet 40 440 17,600 0.91 92.99
28 Amikacin 100 mg Ampoule 50 340 17,000 0.87 93.86
29 Chloramphenicol 1 g Vial 22 720 15,840 0.82 94.68
30 Phenobarbital 100 mg Ampoule 45 349 15,705 0.81 95.49
31 Diclofenac 75 mg/3 mL Ampoule 10 1,557 15,570 0.80 96.29
32 Cloxacillin 500 mg Tablet 3 5,000 15,000 0.77 97.06
33 Ceftazidime 1 g Vial 50 250 12,500 0.64 97.70
34 Calcium D3 Bottle 30 400 12,000 0.62 98.32
35 Ceftriaxone 2 g Vial 60 200 12,000 0.62 98.94
36 Morphine 10 mg Tablet 110 100 11,000 0.56 99.50
37 Atropine sulfate 0.5 mg Ampoule 8 1,205 9,640 0.50 100.00
Total 1,944,605
IU = international units.

40 / Analyzing and controlling pharmaceutical expenditures 40.19
40.5 Therapeutic category analysis
Therapeutic category analysis reviews the volume of use and the value of various therapeutic categories and subcategories of medicines. This technique builds on ABC analysis, sort-ing the ABC list into therapeutic categories (based on the cumulative volume and value of the individual medicines in those categories). Table 40-6 shows a summary therapeu-tic category analysis, using data from a Caribbean country. Table 40-7 provides details on the top three therapeutic cat-egories in Table 40-6.
Applications of therapeutic category analysis
The applications of therapeutic category analysis are simi-lar to those of ABC analysis. Managers should focus cost-control efforts on the therapeutic categories that show the highest consumption and greatest expenditures.
Selection. Therapeutic category analysis can be used to choose the most cost-effective products for essential medicines lists and formularies and find opportunities for therapeutic substitution. For example, in Table 40-7, look at the comparison between methyldopa and ateno-lol. If all hypertensive patients in the sample were con-verted from methyldopa to atenolol, the health system would save about USD 33,440—over 20 percent of the
total expenditures for pharmaceutical purchases in this country.
In addition, therapeutic category analysis can help provide information for pharmacoeconomic analysis. Pharmacoeconomic analysis is the process of comparing cost, therapeutic efficacy, and safety. Two techniques are most commonly used in comparing treatment regimens: cost-minimization and cost-effectiveness analysis. Other pharmacoeconomic techniques such as cost-utility and cost-benefit analysis are less appropriate for comparing treatment regimens (see Chapter 10). Cost minimization is the simpler of the two techniques—it is used when two therapeutic options are the same in terms of therapeutic benefit and safety but one is less expensive. As discussed in Chapter 10, cost-effectiveness is used to compare the costs and benefits of therapeutic alternatives when cost minimi-zation alone is not appropriate. (For more information on pharmacoeconomic analysis, see Bootman, Townsend, and McGhan 2005.)
Procurement. As discussed in Chapters 18 and 21, some supply systems tender for certain therapeutic subcategories (for example, first-generation cephalosporins) rather than for individual medicines. A therapeutic category analysis would show managers how many different products in a subcategory are being purchased. If duplications exist—for example, two oral products are being purchased—tenders
Figure 40-3 Typical ABC analysis for two pharmaceutical supply programs
0
10
20
30
40
50
60
70
80
90
100
Percentage of all items
Perc
enta
ge o
f tot
al a
nnua
l con
sum
ptio
n(c
umul
ativ
e va
lue)
10 20 30 40 50 60 70 80 90 100
Country I
Country II
B2
B1
A1
A2
Country I – aBC class Country II – aBC class
a B C Total a B C Total
Number of items 25 34 285 344 34 35 151 220
Percentage of all items 7.3 9.9 82.8 100 15.5 15.9 68.6 100
Value of annual consumption (USD) 11,151,270 2,197,600 1,438,274 14,787,144 6,401,593 1,415,641 1,401,088 9,218,322
Percentage of total annual consumption 75.4 14.9 9.7 100 69.4 15.4 15.2 100

40.20 PL ANNING AND ADMINISTRATION
Table 40-6 Therapeutic category analysis summary
Formulary code Formulary category
Number of products
Category total cost (usD)
Percentage of total cost
Cumulative percentage of total cost
1 8.12 Antibacterial/antifungal agents, systemic 30 46,053 19.17 19.17
2 68.20 Antidiabetic agents 5 36,175 15.06 34.23
3 24.08 Hypotensive agents 8 31,006 12.91 47.13
4 40.12 Replacement solution/agents 10 14,834 6.17 53.31
5 84.04 Topical anti-infectives 4 14,302 5.95 59.26
6 40.20 Caloric agents (dextrose solutions) 6 12,480 5.19 64.46
7 28.08 Analgesics/antipyretics 10 11,835 4.93 69.38
8 36.00 Diagnostic strips 1 6,496 2.70 72.09
9 86.00 Anti-asthmatic medicines 8 6,195 2.58 74.66
10 4.00 Antihistamines 5 4,892 2.04 76.70
11 38.00 Disinfectants 3 4,846 2.02 78.72
12 28.16 Psychotherapeutic agents (antipsychotic/antidepressant) 14 4,574 1.90 80.62
13 88.28 Multiple vitamins 3 4,318 1.80 82.42
14 20.04 Iron preparations 3 3,207 1.33 83.75
15 56.40 Miscellaneous gastrointestinal medicines 4 3,039 1.26 85.02
16 8.08 Anthelmintics 2 2,663 1.11 86.13
17 92.00 Dispensing envelopes 1 2,643 1.10 87.23
18 68.04 Adrenal hormones 4 2,246 0.93 88.16
19 48.00 Antitussive/anti-expectorant 2 2,240 0.93 89.09
20 56.04 Antacids 2 1,781 0.74 89.84
21 28.04 General anesthetics 3 1,693 0.70 90.54
22 84.05 Topical antifungals 4 1,633 0.68 91.22
23 88.08 Vitamin B preparations 5 1,547 0.64 91.86
24 28.12 Anticonvulsant agents 5 1,465 0.61 92.47
25 92.00 IV administration sets 1 1,300 0.54 93.02
26 12.20 Skeletal muscle relaxants 3 1,283 0.53 93.55
27 52.04 Eye, ear, nose, and throat (EENT) anti-infectives 4 1,283 0.53 94.08
28 40.28 Diuretics 5 1,248 0.52 94.60
29 8.16 Antitubercular agents 5 1,212 0.50 95.11
30 24.04 Cardiotonic and antiarrhythmic agents 6 1,119 0.47 95.57
31 52.08 EENT anti-inflammatory agents 2 1,113 0.46 96.04
32 12.08 Anticholinergic agents 4 925 0.39 96.42
33 56.12 Laxatives 5 886 0.37 96.79
34 84.07 Scabicides/pediculocides 1 765 0.32 97.11
35 76.00 Oxytocics 3 718 0.30 97.41
36 20.12 Anticoagulants and coagulants 2 691 0.29 97.70
37 52.20 Miotics 1 534 0.22 97.92
38 56.22 Anti-emetics 3 531 0.22 98.14
39 84.36 Miscellaneous topical preparations 2 515 0.21 98.35
40 72.00 Local anesthetics 6 491 0.20 98.56
41 8.32 Antitrichomonal agents (metronidazole) 3 481 0.20 98.76
42 84.06 Topical anti-inflammatory 2 363 0.15 98.91

40 / Analyzing and controlling pharmaceutical expenditures 40.21
could specify only “oral first-generation cephalosporins.” Review of Table 40-7 does not yield obvious candidates for subcategory tendering.
Use. Therapeutic category analysis can help promote rational medicine use by identifying potential problems of irrational use: for example, managers can compare infor-mation from the summary (Table 40-6) and the detailed analysis (Table 40-7) with known patterns of morbidity to see how well use matches the patterns. For example, in Table 40-7, note that 7,467 courses of therapy (COTs) of chlor-propamide were used; the manager might ask how that corresponds with the incidence of diabetes that would jus-tify the use of chlorpropamide. Note that the use of chlor-propamide was almost three times greater than the use of glibenclamide (and chlorpropamide’s unit cost was seven times higher). Are these patterns rational for the situation? Table 40-7 does not have enough information to make that determination, but a small, well-targeted study of prescrib-ing might be used to find out (as described in Chapter 28).
In addition, this type of analysis can identify over-prescribing and leakage by comparing the number of COTs that theoretically should have been provided against patient contact data—for example, are the numbers of diabetic patients treated consistent with the number of COTs?
Performing therapeutic category analysis
Therapeutic category analysis is divided into two phases: the summary analysis and the detailed analysis. The sum-
mary analysis starts with the same steps taken as part of an ABC analysis, then includes a classification by therapeutic category. The detailed analysis is a more in-depth look at the high-cost categories identified in the summary phase.
Summary therapeutic category analysis. The summary analysis consists of five steps—
Steps 1–3: Follow the first three steps in ABC analysis (see Section 40.4) to produce a list of medicines, with the vol-ume and value of use calculated for each medicine.
Step 4: Add a column and assign each of the medicines to a therapeutic category, as discussed in Chapter 16. The key requirement is a standard formulary coding system. The system can be simple (with relatively broad categories) or complex (with many subcategories). Commonly used coding systems include the World Health Organization (WHO) Model List of Essential Medicines and the American Hospital Formulary Service (AHFS) Pharmacologic-Therapeutic Classification. More detailed, multilayered schemes are the Anatomical, Therapeutic, Chemical Classification System with Defined Daily Doses of the WHO Collaborating Centre for Drug Statistics Methodology and the U.S. Department of Veterans Affairs Drug Classification System.
Step 5: Rearrange the list into therapeutic categories by sorting according to the formulary codes. The values and percentages for the various therapeutic categories are then summed from the results for the individual items in
Formulary code Formulary category
Number of products
Category total cost (usD)
Percentage of total cost
Cumulative percentage of total cost
43 52.36 EENT miscellaneous 2 358 0.15 99.06
44 28.24 Anxiolytics, sedatives, hypnotics 3 356 0.15 99.21
45 88.12 Vitamin C 1 345 0.14 99.35
46 68.36 Thyroid/antithyroid preparations 2 246 0.10 99.45
47 88.24 Vitamin K-1 1 201 0.08 99.54
48 24.12 Coronary vasodilators 2 189 0.08 99.61
49 12.12 Adrenergic agents 1 188 0.08 99.69
50 64.00 Antidotes/metal antagonists 1 149 0.06 99.75
51 28.10 Narcotic antagonists 1 135 0.06 99.81
52 12.16 Adrenergic blocking agents 1 85 0.04 99.85
53 8.36 Urinary anti-infectives 2 82 0.03 99.88
54 40.08 Alkalinizing agents 1 79 0.03 99.91
55 12.04 Cholinergic agents 1 74 0.03 99.94
56 52.10 Carbonic anhydrase inhibitor 1 63 0.03 99.97
57 40.40 Antigout agents 1 60 0.02 100.00
58 52.24 Mydriatic/cycloplegic 1 12 0.00 100.00
Total 222 240,241
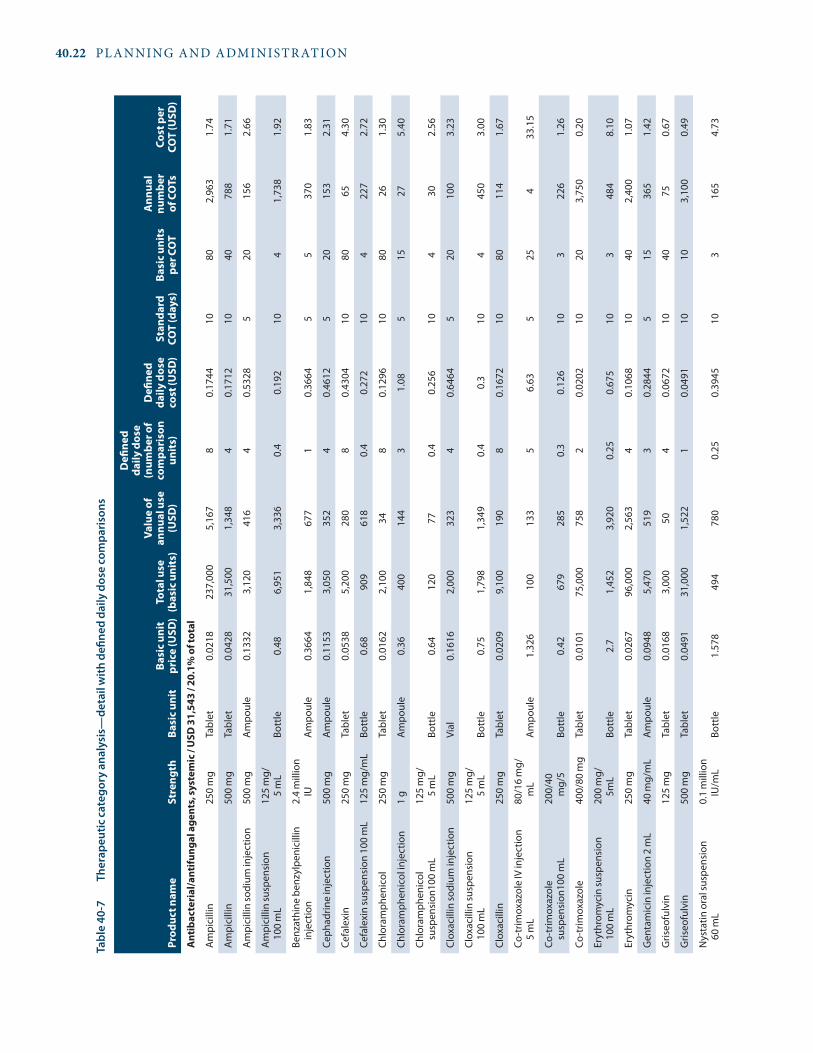
40.22 PL ANNING AND ADMINISTRATION
Tabl
e 40
-7
Ther
apeu
tic c
ateg
ory
anal
ysis
—de
tail
with
defi
ned
daily
dos
e co
mpa
rison
s
Prod
uct n
ame
stre
ngth
Basi
c uni
tBa
sic u
nit
pric
e (u
sD)
Tota
l use
(b
asic
uni
ts)
Valu
e of
an
nual
use
(u
sD)
Defi
ned
daily
dos
e (n
umbe
r of
com
pari
son
unit
s)
Defi
ned
daily
dos
e co
st (u
sD)
stan
dard
CO
T (d
ays)
Basi
c uni
ts
per C
OT
ann
ual
num
ber
of C
OTs
Cost
per
CO
T (u
sD)
ant
ibac
teri
al/a
ntifu
ngal
age
nts,
syst
emic
/ u
sD 3
1,54
3 / 2
0.1%
of t
otal
Am
pici
llin
250
mg
Tabl
et0.
0218
237,
000
5,16
78
0.17
4410
802,
963
1.74
Am
pici
llin
500
mg
Tabl
et0.
0428
31,5
001,
348
40.
1712
1040
788
1.71
Am
pici
llin
sodi
um in
ject
ion
500
mg
Am
poul
e0.
1332
3,12
041
64
0.53
285
2015
62.
66
Am
pici
llin
susp
ensi
on
100
mL
125
mg/
5
mL
Bott
le0.
486,
951
3,33
60.
40.
192
104
1,73
81.
92
Benz
athi
ne b
enzy
lpen
icill
in
inje
ctio
n2.
4 m
illio
n IU
Am
poul
e0.
3664
1,84
867
71
0.36
645
537
01.
83
Ceph
adrin
e in
ject
ion
500
mg
Am
poul
e0.
1153
3,05
035
24
0.46
125
2015
32.
31
Cefa
lexi
n25
0 m
gTa
blet
0.05
385,
200
280
80.
4304
1080
654.
30
Cefa
lexi
n su
spen
sion
100
mL
125
mg/
mL
Bott
le0.
6890
961
80.
40.
272
104
227
2.72
Chlo
ram
phen
icol
25
0 m
gTa
blet
0.01
622,
100
348
0.12
9610
8026
1.30
Chlo
ram
phen
icol
inje
ctio
n1
gA
mpo
ule
0.36
400
144
31.
085
1527
5.40
Chlo
ram
phen
icol
su
spen
sion
100
mL
125
mg/
5
mL
Bott
le0.
6412
077
0.4
0.25
610
430
2.56
Clox
acill
in so
dium
inje
ctio
n50
0 m
gVi
al0.
1616
2,00
032
34
0.64
645
2010
03.
23
Clox
acill
in su
spen
sion
10
0 m
L12
5 m
g/
5 m
LBo
ttle
0.75
1,79
81,
349
0.4
0.3
104
450
3.00
Clox
acill
in
250
mg
Tabl
et0.
0209
9,10
019
08
0.16
7210
8011
41.
67
Co-t
rimox
azol
e IV
inje
ctio
n 5
mL
80/1
6 m
g/m
LA
mpo
ule
1.32
610
013
35
6.63
525
433
.15
Co-t
rimox
azol
e su
spen
sion
100
mL
200/
40
mg/
5Bo
ttle
0.42
679
285
0.3
0.12
610
322
61.
26
Co-t
rimox
azol
e 40
0/80
mg
Tabl
et0.
0101
75,0
0075
82
0.02
0210
203,
750
0.20
Eryt
hrom
ycin
susp
ensi
on
100
mL
200
mg/
5m
LBo
ttle
2.7
1,45
23,
920
0.25
0.67
510
348
48.
10
Eryt
hrom
ycin
25
0 m
gTa
blet
0.02
6796
,000
2,56
34
0.10
6810
402,
400
1.07
Gen
tam
icin
inje
ctio
n 2
mL
40 m
g/m
LA
mpo
ule
0.09
485,
470
519
30.
2844
515
365
1.42
Gris
eofu
lvin
125
mg
Tabl
et0.
0168
3,00
050
40.
0672
1040
750.
67
Gris
eofu
lvin
500
mg
Tabl
et0.
0491
31,0
001,
522
10.
0491
1010
3,10
00.
49
Nys
tatin
ora
l sus
pens
ion
60
mL
0.1
mill
ion
IU/m
LBo
ttle
1.57
849
478
00.
250.
3945
103
165
4.73

40 / Analyzing and controlling pharmaceutical expenditures 40.23
Prod
uct n
ame
stre
ngth
Basi
c uni
tBa
sic u
nit
pric
e (u
sD)
Tota
l use
(b
asic
uni
ts)
Valu
e of
an
nual
use
(u
sD)
Defi
ned
daily
dos
e (n
umbe
r of
com
pari
son
unit
s)
Defi
ned
daily
dos
e co
st (u
sD)
stan
dard
CO
T (d
ays)
Basi
c uni
ts
per C
OT
ann
ual
num
ber
of C
OTs
Cost
per
CO
T (u
sD)
Nys
tatin
ora
l.5
MU
Tabl
et0.
0514
1,10
057
30.
1542
1030
371.
54
Peni
cilli
n G
sodi
um in
ject
ion
1 M
UVi
al0.
0864
2,25
019
45.
760.
4976
645
2978
2.51
Peni
cilli
n G
sodi
um in
ject
ion
5 M
UVi
al0.
256
1,30
033
31.
150.
2944
56
217
1.54
Peni
cilli
n VK
susp
ensi
on
100
mL
125
mg/
5
mL
Bott
le0.
712,
257
1,60
20.
40.
284
104
564
2.84
Peni
cilli
n VK
250
mg
Tabl
et0.
018
72,0
001,
296
80.
144
1080
900
1.44
Proc
aine
pen
icill
in G
inje
ctio
n4.
8 m
gVi
al0.
4157
3,26
91,
359
10.
4157
55
654
2.08
Tetr
acyc
line
HCl
250
mg
Tabl
et0.
0107
174,
000
1,86
24
0.04
2810
404,
350
0.43
ant
idia
beti
c age
nts /
usD
83,
112
/ 52.
9% o
f tot
al
Chlo
rpro
pam
ide
250
mg
Tabl
et0.
0292
336,
000
9,81
11.
50.
0438
3045
7,46
71.
31
Glib
encl
amid
e5
mg
Tabl
et0.
0041
152,
000
623
20.
0082
3060
2,53
30.
25
Insu
lin (s
olub
le) i
njec
tion,
10
mL
100
IU/m
LVi
al8.
018
385
3,08
70.
040.
3207
230
1.2
321
9.62
Insu
lin le
nte,
10
mL
100
IU/m
LVi
al9.
656,
568
63,3
810.
040.
386
301.
25,
473
11.5
8
Insu
lin le
nte
hum
an in
ject
ion,
10
mL
100
IU/m
LVi
al11
.585
536
6,21
00.
040.
4634
301.
244
713
.90
ant
ihyp
erte
nsiv
e ag
ents
/ u
sD 4
2,20
5 / 2
6.9%
of t
otal
Aten
olol
100
mg
Tabl
et0.
0076
29,0
0022
01
0.00
7630
3096
70.
23
Hyd
rala
zine
50 m
gTa
blet
0.04
86,0
003,
440
20.
0830
601,
433
2.40
Hyd
rala
zine
inje
ctio
n20
mg/
mL
Am
poul
e1.
6592
410
680
23.
3184
510
4116
.59
Met
hyld
opa
500
mg
Tabl
et0.
083
443,
500
36,8
114
0.33
230
120
3,69
69.
96
Nife
dipi
ne10
mg
Tabl
et0.
0116
7,00
081
30.
0348
3090
781.
04
Prop
rano
lol H
Cl40
mg
Tabl
et0.
0055
70,0
0038
54
0.02
230
120
583
0.66
Prop
rano
lol
80 m
gTa
blet
0.02
315,
000
116
20.
0462
3060
831.
39
Rese
rpin
e.2
5 m
gTa
blet
0.01
629
,500
472
20.
032
3060
492
0.96
Thre
e ca
tego
ry to
tals
: usD
156
,860
IU =
inte
rnat
iona
l uni
ts.

40.24 PL ANNING AND ADMINISTRATION
the category and cumulative percentages are calculated, producing a summary therapeutic category analysis (see Steps 4–6 under ABC analysis).
In the summary therapeutic category analysis in Table 40-6, fifty-eight different therapeutic categories are rep-resented; this country uses the Organisation of Eastern Caribbean States’ Pharmaceutical Procurement Service formulary coding system (OECS/PPS 2006), which has seventy-four possible therapeutic categories. The system is based on the AHFS system, with minor modifications.
Note that seven of the categories were responsible for nearly 70 percent of total expenditures. This grouping resembles class A in ABC analysis, and the principle is the same—a relatively small number of therapeutic categories often consume most of the funds in a supply system. To reduce costs, managers should look first at these high-cost therapeutic categories.
Detailed therapeutic category analysis. The second phase of the analysis focuses on the high-cost categories identified in the summary phase. The goal is to identify pos-sible changes in therapeutic strategy that might prove to be cost-effective. This analysis compares the cost for a defined daily dose (DDD) of the medicines (the average daily dose for all patients) and the cost of a defined COT.
This stage of the analysis starts with the detailed list of medicines for important therapeutic categories assembled in phase 1. The list of medicines within the categories can be sorted either alphabetically (which is probably easiest for additional data entry) or by value. Data fields (columns) are added to the list to enter the number of basic units per DDD, the annual use in DDDs, the cost per DDD, the standard COT in days, the annual number of COTs, and the average cost per COT (see Box 40-2).
After the standard COT is determined, the final step in constructing the detailed therapeutic category analysis is multiplying the DDD cost by the COT and dividing the annual number of DDDs by the COT (see Table 40-7 for examples).
40.6 Price comparison analysis
Procurement prices can be compared with prices from other systems, and sales prices can be compared with local private-sector prices. These comparisons can help manag-ers set prices for cost-sharing programs and understand whether continuing with current in-house pharmaceutical services is cost-effective.
Acquisition price comparison
Acquisition price comparison analysis tells the manager whether the system is getting the maximum benefit from
available procurement funds, and if not, how much might be saved with alternative procurement practices.
Applications. The obvious application of price compari-son analysis is to measure procurement performance and to focus efforts on obtaining better prices. The comparison of average tender prices with international prices can be used as a routine indicator of procurement system perfor-mance.
The analysis can also identify certain medicines that should be considered for alternative methods of procure-ment. For example, if a supply system is currently purchas-ing all medicines from local suppliers, the price comparison analysis may indicate some medicines that could be obtained for a significantly lower price through international tender or even through direct procurement from one of the inter-national nonprofit agencies.
Country Study 40-4 shows the results of a 2009 price comparison analysis from a Latin American country.
The DDD can be obtained from at least two sources; the official list is published periodically by the WHO Collaborating Centre in Oslo, Norway (WHOCC 2011), and the Management Sciences for Health International Drug Price Indicator Guide (MSH 2010) includes the DDD for selected essential medicines. Note that the DDD in Table 40-7 is listed in terms of comparison units; in the references cited here, the DDD is specified in grams and International Units, so they must be converted to comparison units. For exam-ple, the DDD for ampicillin is 2 grams, which converts to eight capsules of 250 mg, four capsules of 500 mg, and four ampoules of 500 mg for the injection. The official DDD for ampicillin suspension would be 80 mL (0.8 bottles of 100 mL), but the official DDD does not differentiate between adult and pediatric dosages. For the various pediatric suspensions in Table 40-7, the DDD was assumed to be 40 mL. The annual number of DDDs is obtained by dividing total annual consump-tion by the DDD; the cost per DDD is calculated by multiplying the comparison unit price by the DDD.
The average COT will differ according to local policy and custom; for example, some health systems might specify a standard course of ten days for outpatient antibiotic therapy, and other systems might say five or seven days. The COT for chronic medications can be set at thirty days (for ease of comparison). The COT for inpatient medicines might be set at five days (again, for ease of comparison).
Box 40-2 Determining DDDs and COTs

40 / Analyzing and controlling pharmaceutical expenditures 40.25
In this analysis, 2009 prices from local suppliers in a Latin American country were compared with the Organisation of Eastern Caribbean States’ Pharmaceutical Procure-ment Service (OECS/PPS) prices, based on information from the MSH International Drug Price Indicator Guide.The Latin American country received a better or the same price locally as the OECS/PPS did internationally for twelve of thirty products—in some cases, particu-larly for solutions, the local price was better than the international price (largely because shipping costs are
a major component of the international price). OECS/PPS international prices were better on eighteen of thirty products. Certain items, in particular, made a difference; for example, items that had higher local prices combined with large order quantities, such as chloramphenicol suspension, halothane liquid, lidocaine solution, and rifampicin tablets. The country could have saved over USD 143,000 by purchasing only those four items inter-nationally. The accompanying table shows the format for the price comparison analysis.
Country study 40-4 Price comparison analysis
Description strength FormComparison unit
Total units purchased,
two tenders
Total usD at country
tender price
Total usD at OECs/PPs
tender price
Country price as percentage of OECs/PPs
price
Acetazolamide 250 mg Tablet Tablet 3,000 200.40 60.00 334.0
Allopurinol 100 mg Tablet Tablet 15,000 171.00 300.00 57.0
Benzathine penicillin 2.4 million IU Solution Ampoule 60,000 30,840.00 36,000.00 85.7
Bisacodyl 5 mg Tablet Tablet 30,000 3,486.00 2,700.00 129.1
Cephalexin 500 mg Capsule Tablet 500,000 32,250.00 32,050.00 100.6
Chloramphenicol 1 g Solution Ampoule 25,000 12,857.50 25,000.00 51.4
Chloramphenicol 125 mg/5 mL Suspension 100 mL bottle 125,000 110,000.00 58,750.00 187.2
Co-trimoxazole 80 mg+40 Tablet Tablet 2,000,000 28,800.00 28,800.00 100.0
Co-trimoxazole 240 mg/5 mL Suspension 100 mL bottle 110,000 56,100.00 50,600.00 110.9
Dextrose in NaCl, 1 L 5%/0.9% mg Solution Ampoule 110,000 80,300.00 99,000.00 81.1
Diazepam 5 mg Tablet Tablet 200,000 2,420.00 1,700.00 142.4
Erythromycin 250 mg Tablet Tablet 500,000 29,800.00 19,550.00 152.4
Furosemide 40 mg Tablet Tablet 50,000 500.00 290.00 172.4
Gentamicin 80 mg/2 mL Solution Ampoule 200,000 18,000.00 12,760.00 141.1
Halothane 250 mL Liquid Bottle 2,000 92,620.00 60,000.00 154.4
Hydralazine 50 mg Tablet Tablet 10,000 373.00 250.00 149.2
Insulin NPH, 10 mL 40 units/mL Solution Ampoule 8,000 40,448.00 43,840.00 92.3
Ketamine (10 mL) 50 mg/mL Solution Ampoule 4,000 9,220.00 9,600.00 96.0
Lidocaine (50 mL) 2% sin epi Solution Ampoule 8,000 35,120.00 4,240.00 828.3
Methyldopa 500 mg Tablet Tablet 100,000 9,380.00 4,400.00 213.2
Metronidazole 250 mg Tablet Tablet 3,000,000 44,400.00 15,300.00 290.2
Oral rehydration salts — Powder Packet 200,000 31,040.00 46,400.00 66.9
Oxytocin 10 U/mL Solution Ampoule 25,000 1,365.00 8,250.00 16.5
Phenytoin 100 mg Capsule Capsule 270,000 10,989.00 5,832.00 188.4
Propranolol 40 mg Tablet Tablet 150,000 1,740.00 1,275.00 136.5
Propranolol 80 mg Tablet Tablet 50,000 1,305.00 1,000.00 130.5
Quinidine sulfate 200 mg Tablet Tablet 60,000 7,800.00 8,082.00 96.5
Rifampicin 300 mg Capsule Tablet 1,600,000 221,600.00 126,720.00 174.9
Sodium chloride, 1 L 0.9% Solution Ampoule 70,000 39,200.00 62,300.00 62.9
Vitamin B complex 120 mL Solution Bottle 100,000 49,000.00 21,000.00 233.3
Average tender price as percentage of international price 175.2%
Standard deviation—average tender price/international price 144.81%
Weighted average percentage—tender price/international price 127%
Note: — Not applicable; IU = international units.
40.26 PL ANNING AND ADMINISTRATION
Pharmaceutical price comparison analysis. One poten-tial source for comparative procurement information is a list of prices from a neighboring supply system. Another is the MSH International Drug Price Indicator Guide (available online or in a CD-ROM version that allows the user to enter local prices and compare them with the international prices that are already in the system). In addition, Health Action International and WHO have developed a methodology to assess medicine prices; the website (http://www.haiweb.org/medicineprices) includes survey data from many countries as well as resources for many other sources of medicine prices.
When the comparison prices have been entered for each medicine, divide the local price by the comparison price, which calculates the local price as a percentage of the com-parison price. After doing this, all these percentages are totaled and divided by the number of medicines to get the average percentage.
A manager can also determine how much overall differ-ence exists for a certain volume of purchases (the weighted average percentage) in a manner similar to the ABC analy-sis. Total annual values are calculated for each item for both local prices and comparison prices, based on annual con-sumption. The values at local prices and the values at com-parison prices are totaled at the bottom of the respective columns. Then the weighted average percentage is calcu-lated by dividing the total value for all items at local prices by the total value at comparison prices. The weighted average is useful because large differences may exist for individual medicines that skew the simple average comparison.
When using the MSH indicator prices for comparison, it is important to understand that the international reference prices reflect a combination of actual tender prices paid by selected countries’ procurement programs and prices from international nonprofit suppliers such as Supply Chain Management System and the IDA Foundation; the reference prices are not actual prices. When a wide range of prices makes up the average, the average may be much higher or lower than actual prices from any of the individual suppliers or tendering programs listed. Therefore, the guide shows the median prices, which controls for skewing that may occur with price averaging.
The prices being compared must refer to the same year; the pharmaceutical products being compared must be the same generic products in the same or comparable dosage forms, and the comparison units must be the same. If all these points are not addressed correctly, the price compari-son analysis will be invalid.
Comparison of supply system prices and private-sector prices
This analysis compares acquisition and selling prices against local private-sector wholesale and retail prices.
Applications. The analysis provides useful information for cost-recovery programs. Note in Table 40-8 that CMS sales prices at a 30 percent markup were, on average, 84 percent of the private-sector wholesale prices for the same medicines (47 percent of the average retail sales price) and 92 percent of the sales prices from the local nongovernmen-tal organization (NGO) warehouse. This finding might seem to indicate that the CMS could increase prices somewhat. However, this simple comparison is not enough to make a determination, because the key issue is how much services are valued by patients. If public pharmaceutical services are not valued as highly as private-sector medicines and ser-vices, there may be no room at all for price increases.
The most useful application of this type of analysis is to indicate the cost-effectiveness of in-house pharmaceutical services. If supply system procurement acquisition prices are higher than or nearly as high as the private-sector sales prices, and procurement system improvements are unlikely to be able to significantly reduce acquisition prices, further investigation is warranted—for example, serving public-sector patients through contracts with private pharmacies may be more cost-effective.
Doing the analysis. This analysis demands some extra effort to get comparative information. Information on aver-age wholesale or retail prices may be available from the local pharmacy association, but if it is not or if it is not reliable, prices in local wholesale and retail outlets can be obtained through a simple survey, focusing on a limited list of essential medicines (see MSH/RPM 1995). If a wide range of prices is obtained in the survey, using the simple median retail price rather than an average of the prices may be best.
This analysis is set up in the same way as the preceding price comparison analysis, building on the list used for ABC analysis and adding columns of comparative prices from the private sector. If the public supply system is selling medi-cines from one level to the next or to the public, columns should be provided for both acquisition and selling prices.Again, a percentage comparison is made for both individual medicines and an overall average. To show the private-sector price as a percentage of the supply system prices, the retail price is divided by the supply system price. To show the sup-ply system prices as a percentage of the private-sector prices, supply system prices are divided by private-sector prices.
Table 40-8 illustrates a comparison between CMS prices and local wholesale prices.
40.7 Lead-time and payment-time analysis
Lead time is defined as the interval between submit-ting an order and receiving the goods. In many countries, most pharmaceuticals purchased by the public sector are imported, and lead times are frequently long and variable.

40 / Analyzing and controlling pharmaceutical expenditures 40.27
Tabl
e 40
-8
Pric
e co
mpa
rison
: CM
S 30
per
cent
mar
kup
com
pare
d w
ith p
rivat
e-se
ctor
who
lesa
le a
nd re
tail
pric
es a
nd N
GO
pric
es
Des
crip
tion
stre
ngth
Issu
e un
it
Proj
ecte
d CM
s 30
per
cent
m
arku
p on
20
09 co
stW
hole
sale
av
erag
e pr
ice
CMs
pric
e as
pe
rcen
tage
of
ave
rage
w
hole
sale
pr
ice
reta
il av
erag
e pr
ice
CMs
pric
e as
pe
rcen
tage
of
ave
rage
re
tail
pric
eN
GO
May
200
9 un
it p
rice
CMs
pric
e as
pe
rcen
tage
of
NG
O p
rice
Acet
ylsa
licyl
ic a
cid
325
mg
Tabl
et0.
0030
0.00
3781
0.00
9631
0.00
3390
Am
odia
quin
e20
0 m
gTa
blet
0.01
180.
0219
540.
0423
28—
NA
Am
oxic
illin
e12
5 m
g/5
mL
60 m
L bo
ttle
0.47
580.
5874
810.
7674
620.
3473
137
Am
oxic
illin
e25
0 m
gTa
blet
0.02
91—
NA
—N
A0.
0313
93
Chlo
ram
phen
icol
250
mg
Tabl
et0.
0208
0.02
4585
0.03
5359
0.01
8411
3
Chlo
roqu
ine
150
mg
Tabl
et0.
0251
0.03
7467
0.05
9742
—N
A
Chlo
rphe
nira
min
e4
mg
Tabl
et0.
0025
0.00
3668
0.00
7533
0.00
3083
Co-t
rimox
azol
e48
0 m
gTa
blet
0.01
440.
0166
870.
0225
640.
0129
112
Dia
zepa
m5
mg
Tabl
et0.
0043
0.00
7557
0.01
8723
0.00
6962
Ferr
ous s
ulfa
te60
mg
iron
Tabl
et0.
0098
0.01
0692
0.02
4440
0.00
9110
7
Folic
aci
d +
iron
0.25
mg/
60 m
gTa
blet
0.00
270.
0303
90.
0455
6—
NA
Furo
sem
ide
40 m
gTa
blet
0.00
680.
0169
400.
0338
200.
0111
61
Meb
enda
zole
100
mg
Tabl
et0.
0059
0.05
8510
0.14
634
0.01
9530
Met
roni
dazo
le25
0 m
gTa
blet
0.00
650.
0081
800.
0159
410.
0078
83
Mul
tivita
min
NA
Tabl
et0.
0099
0.00
5916
80.
0154
640.
0069
144
Ora
l reh
ydra
tion
salts
NA
Sach
et0.
1573
0.17
4890
0.25
3762
0.18
7384
Para
ceta
mol
500
mg
Tabl
et0.
0059
0.00
4911
90.
0087
670.
0049
119
Peni
cilli
n pr
ocai
ne4
mill
ion
IUVi
al0.
4194
0.44
1595
0.65
5364
—N
A
Peni
cilli
n, b
enzy
l5
mill
ionn
IUVi
al0.
4940
0.20
4124
20.
3293
150
—N
A
Rese
rpin
e0.
25 m
gTa
blet
0.05
380.
1455
370.
3166
170.
0828
65
ave
rage
s—30
% C
Ms
mar
kup
as %
of o
ther
84.1
3%47
.25%
92%
Not
e: —
Not
app
licab
le; N
A =
not
ava
ilabl
e; IU
= in
tern
atio
nal u
nits
.
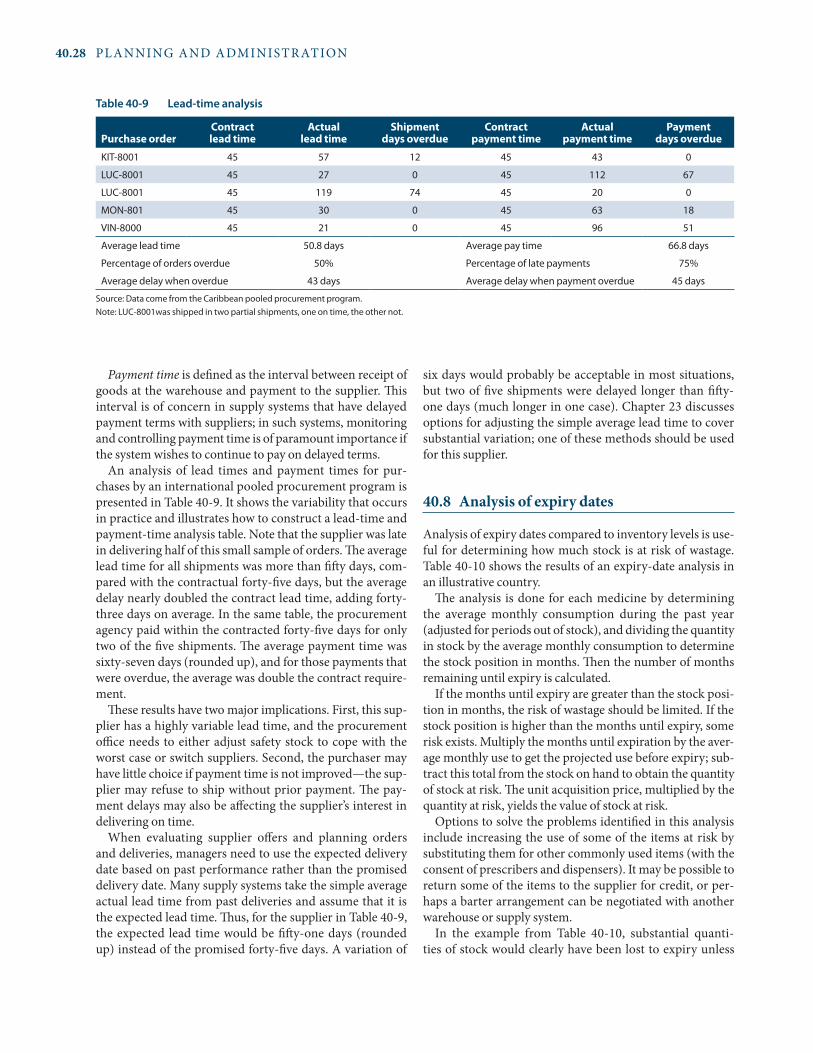
40.28 PL ANNING AND ADMINISTRATION
Payment time is defined as the interval between receipt of goods at the warehouse and payment to the supplier. This interval is of concern in supply systems that have delayed payment terms with suppliers; in such systems, monitoring and controlling payment time is of paramount importance if the system wishes to continue to pay on delayed terms.
An analysis of lead times and payment times for pur-chases by an international pooled procurement program is presented in Table 40-9. It shows the variability that occurs in practice and illustrates how to construct a lead-time and payment-time analysis table. Note that the supplier was late in delivering half of this small sample of orders. The average lead time for all shipments was more than fifty days, com-pared with the contractual forty-five days, but the average delay nearly doubled the contract lead time, adding forty-three days on average. In the same table, the procurement agency paid within the contracted forty-five days for only two of the five shipments. The average payment time was sixty-seven days (rounded up), and for those payments that were overdue, the average was double the contract require-ment.
These results have two major implications. First, this sup-plier has a highly variable lead time, and the procurement office needs to either adjust safety stock to cope with the worst case or switch suppliers. Second, the purchaser may have little choice if payment time is not improved—the sup-plier may refuse to ship without prior payment. The pay-ment delays may also be affecting the supplier’s interest in delivering on time.
When evaluating supplier offers and planning orders and deliveries, managers need to use the expected delivery date based on past performance rather than the promised delivery date. Many supply systems take the simple average actual lead time from past deliveries and assume that it is the expected lead time. Thus, for the supplier in Table 40-9, the expected lead time would be fifty-one days (rounded up) instead of the promised forty-five days. A variation of
six days would probably be acceptable in most situations, but two of five shipments were delayed longer than fifty-one days (much longer in one case). Chapter 23 discusses options for adjusting the simple average lead time to cover substantial variation; one of these methods should be used for this supplier.
40.8 Analysis of expiry dates
Analysis of expiry dates compared to inventory levels is use-ful for determining how much stock is at risk of wastage. Table 40-10 shows the results of an expiry-date analysis in an illustrative country.
The analysis is done for each medicine by determining the average monthly consumption during the past year (adjusted for periods out of stock), and dividing the quantity in stock by the average monthly consumption to determine the stock position in months. Then the number of months remaining until expiry is calculated.
If the months until expiry are greater than the stock posi-tion in months, the risk of wastage should be limited. If the stock position is higher than the months until expiry, some risk exists. Multiply the months until expiration by the aver-age monthly use to get the projected use before expiry; sub-tract this total from the stock on hand to obtain the quantity of stock at risk. The unit acquisition price, multiplied by the quantity at risk, yields the value of stock at risk.
Options to solve the problems identified in this analysis include increasing the use of some of the items at risk by substituting them for other commonly used items (with the consent of prescribers and dispensers). It may be possible to return some of the items to the supplier for credit, or per-haps a barter arrangement can be negotiated with another warehouse or supply system.
In the example from Table 40-10, substantial quanti-ties of stock would clearly have been lost to expiry unless
Table 40-9 Lead-time analysis
Purchase orderContract lead time
actual lead time
shipment days overdue
Contract payment time
actual payment time
Payment days overdue
KIT-8001 45 57 12 45 43 0
LUC-8001 45 27 0 45 112 67
LUC-8001 45 119 74 45 20 0
MON-801 45 30 0 45 63 18
VIN-8000 45 21 0 45 96 51
Average lead time 50.8 days Average pay time 66.8 days
Percentage of orders overdue 50% Percentage of late payments 75%
Average delay when overdue 43 days Average delay when payment overdue 45 days
Source: Data come from the Caribbean pooled procurement program.Note: LUC-8001was shipped in two partial shipments, one on time, the other not.

40 / Analyzing and controlling pharmaceutical expenditures 40.29
Tabl
e 40
-10
Illus
trat
ive
expi
ry-d
ate
anal
ysis
(Jan
uary
201
0)
Nam
e, st
reng
th,
and
form
Issu
e un
itIs
sue
unit
co
st (u
sD)
ave
rage
m
onth
ly
use
Curr
ent
stoc
k po
siti
on
(uni
ts)
Curr
ent
stoc
k po
siti
on
(mon
ths)
Expi
ry d
ate
Mon
ths
unti
l exp
iry
Proj
ecte
d us
eQ
uant
ity
of
stoc
k at
risk
Valu
e
of st
ock
at
risk
(usD
)
Ceph
alex
in 1
25 m
g/
5 m
L su
spen
sion
100
mL
bott
le1.
264
6013
.5Ju
ne 2
010
522
3847
.88
Ceph
alex
in 2
50 m
gTa
blet
0.05
2633
38,
200
24.6
Augu
st 2
010
72,
333
5,86
730
8.60
Chlo
rhex
idin
e gl
ucon
ate
5%
solu
tion
5 L
bott
le30
.51
4545
Apr
il 20
1215
1530
915.
00
Chlo
rphe
nira
min
e
2 m
g/5
mL
elix
ir1
L bo
ttle
38
140
16.8
Sept
embe
r 201
18
6773
219.
00
Code
ine
30 m
gTa
blet
0.05
5552
104
2N
ovem
ber 2
011
2218
402.
22
Dex
amet
haso
ne in
ject
ion,
4
mg/
mL,
5 m
L5
mL
vial
0.42
517
290
17.4
Febr
uary
201
01
1727
311
6.03
Dia
zepa
m in
ject
ion,
10
mg/
2 m
L2
mL
ampo
ule
0.11
1615
01,
300
8.7
Augu
st 2
011
71,
050
250
27.9
0
Eryt
hrom
ycin
bas
e sa
lts
250
mg
Tabl
et0.
0342
333
6,00
018
Nov
embe
r 201
110
3,33
32,
667
91.2
1
Lido
cain
e 2%
jelly
15 g
tube
1.03
520
640
32Ju
ne 2
012
1734
030
031
0.50
Nal
oxon
e H
Cl in
ject
ion,
0.
02 m
g/m
L, 2
mL
2 m
L am
poul
e0.
406
311
044
Dec
embe
r 201
111
2883
33.7
0
Panc
uron
ium
bro
mid
e in
ject
ion,
2 m
g/m
L2
mL
ampo
ule
1.14
84
5012
Dec
embe
r 201
111
464
4.59
Peni
cilli
n G
ben
zath
ine
inje
ctio
n, 2
.4 m
illio
n IU
Am
poul
e0.
3228
391,
990
50.5
June
201
229
1,14
384
727
3.41
Peni
cilli
n G
Na
inje
ctio
n,
pow
der,
1 M
UVi
al0.
1399
331,
000
30M
ay 2
012
1653
346
765
.33
Phyt
omen
adio
ne
inje
ctio
n, 1
mg/
1 m
LA
mpo
ule
0.18
0783
2,00
024
.2D
ecem
ber 2
011
1190
91,
091
197.
14
Wat
er fo
r inj
ectio
n, 1
0 m
LVi
al0.
0611
740
03.
4A
pril
2010
335
050
3.00
Tota
l val
ue a
t ris
k
2,
615.
52
IU =
inte
rnat
iona
l uni
ts.

40.30 PL ANNING AND ADMINISTRATION
action was taken. Note that for cephalexin tablets and injec-tions, action was needed quickly because of the rapidly approaching expiration date. It was already too late to use up dexamethasone or water for injection. The chlorhexidine gluconate presented the highest financial risk (almost one-third of the total value at risk).
For some of the items at risk, increasing use through sub-stitution might be feasible. For example, cephalexin tablets could be substituted for erythromycin. Penicillin injec-tion might replace cephalosporins (if they are commonly used). Substitution would be a less appropriate solution for medicines such as codeine, diazepam, or phytomenadione; probably the best solution for these items (and for most overstocks) would be a barter arrangement with a neighbor-ing supply system.
The real value of expiry-date analysis is that, if used regu-larly, it can help avoid a situation like the one illustrated by detecting potential wastage problems before they are insoluble.
40.9 Hidden-cost analysis
The concept of hidden costs was introduced in Chapter 18. Hidden costs are those costs that occur because of poor sup-plier performance; they are not obvious in the invoice price.
The total cost of purchasing an item from a specific sup-plier is the sum of the quoted price, any shipping and han-dling costs, and any hidden costs. In comparing quotations from different suppliers, procurement officers should con-sider the expected hidden costs for each supplier, based on past performance. One way to do this is to calculate the hid-den cost ratio (hidden costs divided by visible costs). Visible costs are the sum of cost, insurance, and freight (CIF) for all past orders. Hidden costs are the sum of the following—
• Commissions for local agents• Cost of late deliveries (including air freight for emer-
gency needs, use of more expensive alternatives, higher cost for emergency replacements, and so forth)
• Cost of delivery errors (sum of costs incurred because of short shipments, incorrect medicines shipped, ship-ments delivered to wrong port, additional port costs because of lack of proper documents, and so forth)
• Value of losses caused by poor packaging• Replacement cost of unusable medicines (short shelf
lives, disintegrated medicines, and so forth)
The value of cost-saving contributions (deferred payment terms, suggestions for less expensive dosage forms, and so forth) is subtracted from this total.
In the example illustrated in Figure 40-4, assume that Supplier A has provided pharmaceuticals to a supply system at a net CIF cost of USD 100,000 (the visible cost). A review
of the procurement office’s records might show that for these purchases, the following hidden costs were incurred—
• Unusable medicines (replacement cost for tablets that disintegrated in transit; expired products not replaced by supplier) = USD 6,000
• Commission for local agents (3 percent) = USD 3,000• Late deliveries (air freight and higher price for tempo-
rary emergency stocks) = USD 9,000• Delivery errors (2 percent average short packing) =
USD 2,000• Losses from poor packaging (not covered by insur-
ance) = USD 3,000
Based on this experience with Supplier A, the procure-ment office calculates a hidden cost ratio of 23 percent, derived from (USD 6,000 + USD 3,000 + USD 9,000 + USD 2,000 + USD 3,000) / USD 100,000. This information can then be used to project total costs of later orders for com-parison with competing suppliers. A hidden cost ratio of 23 percent for Supplier A means that the total cost for the phar-maceutical supply system will be about USD 1.23 for every USD 1.00 quoted by Supplier A for a product. If Supplier A quotes a CIF price of USD 100 for an item, the total expected cost would be USD 123. If Supplier B quotes a CIF price of USD 110, but Supplier B has an estimated hidden cost ratio of only 5 percent, the expected total cost (USD 115) would make Supplier B the most cost-effective choice.
Precision in calculating hidden cost estimates is rarely possible, but criteria for reviewing supplier performance might include hidden costs as one aspect of comparison. If
Figure 40-4 Impact of hidden cost on total cost
Supplier A Supplier B
TOTAL COST = VISIBLE COST + HIDDEN COST
Hidden costs
Visible costs
Lowertotalcosts
Lowerhidden
costs
Highervisible
cost
Early expiry and disintegration of medicines
Commissions for local agents
Air freight for late delivery
Short packing
Losses due to poor packaging

40 / Analyzing and controlling pharmaceutical expenditures 40.31
large differences in hidden cost ratios exist between two sup-pliers, based on past performance, this might be a deciding factor in the choice. As discussed in Chapter 18, if hidden costs are to be considered in evaluating supplier offers, this fact should be clearly specified in procurement evaluation criteria and in tender documents. n
References and further readings
H = Key readings.
H Bootman, J. L., R. J. Townsend, and W. F. McGhan, eds. 2005. Principles of Pharmacoeconomics. 3rd ed. Cincinnati, Ohio: Harvey Whitney Books.
Bragg, S. M. 2004. Inventory Best Practices. Hoboken, N.J.: John Wiley & Sons.
H Creese, A., and D. Parker, eds. 1994. Cost Analysis in Primary Health Care: A Training Manual for Programme Managers. Geneva: World Health Organization. <http://www.who.int/immunization_ financing/data/methods/en/caphc_creese.pdf>
Freund, D. A., and R. S. Dittus. 1992. Principles of Pharmacoeconomic Analysis of Drug Therapy. Pharmacoeconomics 1(1):20–31.
MSH (Management Sciences for Health). 2010. International Drug Price Indicator Guide, 2009 Edition. (Updated annually.) Cambridge, Mass.: MSH. <http://erc.msh.org>
MSH/RPM (Management Sciences for Health/Rational Pharmaceutical Management Project). 1996. Prescription Analysis Software System—User’s Manual. Washington, D.C.: MSH/RPM.
H ————. 1995. Rapid Pharmaceutical Management Assessment: An Indicator-Based Approach. Arlington, Va.: MSH/RPM. <http://erc.msh.org/toolkit/Tool.cfm?lang=1&TID=197>
OECS/PPS (Organisation of Eastern Caribbean States’ Pharmaceutical Procurement Service). 2006. Formulary 06/07. Castries, St. Lucia: OECS/PPS.
Shah, S., N. Konduri, and R. Gunturu. 2007. Taking Action on Antimicrobial Resistance: Experience of Pharmacy and Therapeutics Committee in a Kenyan Hospital. Presentation at the 67th FIP World Congress “From Anecdote to Evidence: Pharmacists Helping Patients Make the Best Use of Medicines,” Beijing, China, September 3.
USP (United States Pharmacopeia). 2010. USP Dictionary. (Updated annually.) Rockville, Md.: USP.
WHOCC (WHO Collaborating Centre for Drug Statistics Methodology). 2011. Anatomical therapeutic chemical/defined
daily dose (ATC/DDD) classification index. (Updated regularly.) Oslo: WHOCC. <http://www.whocc.no/atcddd/>
Glossary
ABC analysis: Classification of inventory items into three cat-egories (A, B, and C) according to the value of their annual use, which is useful for analyzing medicine consumption and use, comparing actual versus planned purchases, justifying procure-ment budgets, guiding procurement patterns, and setting priori-ties for stock management.
Analysis of expiry dates: The analysis of stock position compared to expiry dates in the supply system inventory to avoid or mini-mize losses caused by wastage.
Lead-time analysis: The analysis of supplier lead time (interval between decision to order and receipt of stock), to help in select-ing the best suppliers for future procurements, and payment lead time (interval between receipt of goods and payment to supplier), to monitor procurement office compliance with contracts.
Pipeline analysis: Analysis of the logistics system to identify the optimal location and quantities of stock in the distribution net-work, which serves as the basis for devising more efficient order-ing and stock-keeping policies and procedures.
Price comparison analysis: The comparison of a supply system’s costs and prices to those of other programs or systems; for exam-ple, comparison of procurement prices to those paid by neigh-boring supply systems or obtainable internationally, or of sales prices to prices in the local private and NGO sectors.
Technical efficiency: Using inputs to achieve the greatest output for a given cost or to achieve a given output at the lowest cost. For pharmaceutical management, this includes therapeutic efficiency (selection and use) and operational efficiency (management of procurement and distribution):
Therapeutic category analysis: The analysis of expenditures by therapeutic category, for comparison with morbidity patterns and public health priorities, as a means of focusing cost control efforts:
VEN system: A system of categorizing medicines by their public health value (vital, essential, and nonessential), which can be use-ful in setting purchasing priorities, determining safety stock lev-els, and directing staff activities.

40.32 PL ANNING AND ADMINISTRATION
Indicators related to analytical techniques
• Numbers of medicines and value of average con-sumption for medicines in classes A, B, and C from ABC analysis
• Value of unplanned purchases (items not on original quantification list) as a percentage of value of total purchases
• Average supply system acquisition price as a per-centage of average international price for indicator medicines
• Average medical stores sales price as a percentage of local wholesale sales price for indicator medicines—private and NGO sectors
• Average public-sector pharmacy sales price as a percentage of local retail pharmacy sales price for indicator medicines
• Ratio of net sales (or value of distributed medicines) to inventory—also called “inventory turnover”
• Operating margin on total sales—the value of total sales, minus the cost of goods sold, divided by the total sales
• Inventory-holding costs as percentage of average inventory value
• Purchasing costs as a percentage of average inven-tory value
• Average lead time and payment time for each major supplier
• Value of medicines at risk of expiry as a percentage of inventory value
Total cost analysis
Data elements that contribute to a total cost analysis include—
• Availability of expenditure reports or budget esti-mates of operating costs in warehouses and purchas-ing offices
• Value of accounts receivable from patients and from other facilities
• Value of bad-debt write-offs• Value of total purchases and total sales (or value of
medicines distributed)• Value of cost of goods sold (or distributed)• Beginning and ending inventory value for the fiscal
year for major warehouses and health facilities, and average inventory value
• Inventory shrinkage: the sum of beginning inven-tory value plus purchases, minus the sum of cost of goods sold plus ending inventory value
• Value of any donations received or stock returns from clients
• Value of operating costs—predictable and incre-mental—for stock management functions (ideally at each major level of the system)
• Value of expired or wasted stock removed during the year and any such stock remaining
• Value of operating costs associated with pharmaceu-tical transport
• Value of operating costs—predictable and incremen-tal—for purchasing functions
• Value of incremental costs associated with managing tenders
• Value of incremental costs of emergency purchases to cover shortages
• Value of lower-level purchases outside supply system (for centralized procurement systems)
Analytical capacity in supply system
• Which departments or offices in the supply system are responsible for analyzing recurrent costs and developing cost-control strategies?
• What kinds of analyses and reports are produced (and how frequently are they produced)?
• Are computers and spreadsheet software available for analyzing costs in the pharmaceutical supply system?
• What kinds of software with analytical and reporting capacity, in addition to spreadsheets, are available?
VEN analysis
• Does a two- or three-tier system exist for prioritizing procurement according to public health value (simi-lar to VEN or VN)?
• If no formal system exists, how are priorities deter-mined when funds are insufficient to purchase all medicines requested?
ABC analysis
• Has an ABC analysis been done recently of medicine consumption or purchases (and if not, does the sys-tem have the data and the capacity needed to do this analysis)?
• How do use and expenditures compare with health priorities?
• How is information from ABC analysis used to improve purchasing and inventory management?
a s s E s s M E N T G u I D E

40 / Analyzing and controlling pharmaceutical expenditures 40.33
Therapeutic category analysis
• Have recent efforts been made to analyze consump-tion and expenditures by therapeutic category (and if so, how is the information used)?
• How are the merits of one pharmaceutical product compared with those of other products in medicine selection and procurement?
• Does the purchasing office sometimes tender by therapeutic category or subcategory rather than for specific medicines?
Price comparison analysis
• What sources of data are available for price compari-son analysis? (See also price comparison indicators above.)
Lead-time and payment-time analysis
• How are lead times and payment times tracked and used by the purchasing office?
Expiry-date analysis
• How does the supply system track expiration dates? Are reports prepared on the expiry status of medi-cines in stock?
• What is done about stock that will likely expire before it can be used?
Hidden-cost analysis
• Are hidden costs calculated for regular suppliers to the supply system, and if not, are records adequate to compile the information?