chapter 4.6: air quality 4.6.1 introduction and methodology · funding, this analysis used the air...
TRANSCRIPT
4.6-1
Chapter 4.6: Air Quality
4.6.1 INTRODUCTION AND METHODOLOGY
This chapter assesses the potential long-term impacts on ambient air quality due to operation of the Preferred Alternative. Emissions of greenhouse gases from the Preferred Alternative are also discussed in this chapter. Potential short-term air quality impacts from construction of the Preferred Alternative are discussed in Chapter 4.12, “Construction Impacts.”
Air quality impacts can be either direct or indirect. Direct impacts stem from emissions generated by stationary sources at the project site, such as emissions from fuel burned on site for heating systems. For the proposed Moynihan Station, direct effects would be insignificant since it would continue to use steam from Con Edison for heating purposes. However, fossil fuel-fired heating, ventilation and air conditioning systems would be utilized at the Development Transfer Site. Direct impacts could also result from existing nearby stationary sources affecting the new residential or hotel uses at the Development Transfer Site. Therefore, the potential effects of stationary source emissions from existing nearby industrial facilities on the Preferred Alternative were assessed.
Indirect impacts are caused by the potential for emissions from vehicle trips generated by the Preferred Alternative. A mobile source analysis was therefore conducted to evaluate potential impacts from the Preferred Alternative.
Since the project involves both New York City and New York State agency approvals and/or funding, this analysis used the air quality analysis procedures suggested in CEQR Technical Manual and the New York State Department of Transportation’s (NYSDOT) Environmental Procedures Manual (EPM) in the development of the methodology and assessment of impacts.
4.6.2 PRINCIPAL CONCLUSIONS
The results of this analysis show that the maximum predicted carbon monoxide (CO) and respirable particulate matter (PM10) concentrations from mobile sources with the Project would be below the corresponding ambient air standards. Furthermore, CO concentrations would not exceed the City’s de minimis criteria, and PM2.5 concentrations would not exceed the interim guidance criteria regarding PM2.5 impacts.
The stationary source analysis demonstrated that there would be no significant adverse air quality impacts from fossil fuel-fired combustion equipment at the Development Transfer Site, or from emissions due to nearby industrial sources on the Project’s sensitive uses.
The total net emissions due to the Project would not exceed the de minimis levels for general conformity during construction or operation, and therefore a conformity determination is not required for the Project, and the Project would conform to all relevant SIPs and maintenance plans. The proposed Moynihan Station is expected to result in a net long-term reduction in regional emissions associated with the mode shift from on-road use to rail. As recognized in the

Moynihan Station Development Project
4.6-2
Congestion Mitigation and Air Quality (CMAQ) Improvement Program application, there would be some regional air quality benefits resulting from the proposed transportation investment and the transit-oriented development associated with the Project.
Some greenhouse gas emissions would be associated with the Project operation, including electricity consumption and the use of natural gas for the Development Transfer Site, similar or less than those associated with similar uses in less dense areas. The transit-oriented, mixed-use, and dense nature of the Development Transfer Site and the area in which it is located would result in less on-road emissions than similar uses elsewhere. A net reduction in transportation-related greenhouse gas emissions would occur due to the mode shift from on-road to rail. Since reducing greenhouse gas emissions and energy consumption is both a New York State and New York City goal under the State Energy Plan, PlaNYC, and other policies and initiatives, the proposed project would be consistent with those policies.
4.6.3 POLLUTANTS FOR ANALYSIS
Ambient air quality is affected by air pollutants produced by both motor vehicles and stationary sources. Emissions from motor vehicles are referred to as mobile source emissions, while emissions from fixed facilities are referred to as stationary source emissions. Ambient concentrations of carbon monoxide (CO) are predominantly influenced by mobile source emissions. Particulate matter (PM), volatile organic compounds (VOCs), and nitrogen oxides (NO and NO2, collectively referred to as NOx) are emitted from both mobile and stationary sources. Fine PM is also formed when emissions of NOx, sulfur oxides (SOx), ammonia, organic compounds, and other gases react or condense in the atmosphere. Emissions of sulfur dioxide (SO2) are associated mainly with stationary sources, and sources utilizing non-road diesel such as diesel trains, marine engines, and non-road vehicles (e.g., construction engines). On-road diesel vehicles currently contribute very little to SO2 emissions since the sulfur content of on-road diesel fuel, which is federally regulated, is extremely low. Ozone is formed in the atmosphere by complex photochemical processes that include NOx and VOCs.
CARBON MONOXIDE
CO, a colorless and odorless gas, is produced in the urban environment primarily by the incomplete combustion of gasoline and other fossil fuels. In urban areas, approximately 80 to 90 percent of CO emissions are from motor vehicles. Since CO is a reactive gas which does not persist in the atmosphere, CO concentrations can vary greatly over relatively short distances; elevated concentrations are usually limited to locations near crowded intersections, heavily traveled and congested roadways, parking lots, and garages. Consequently, CO concentrations must be predicted on a local, or microscale, basis.
The Project would result in changes in traffic patterns and an increase in traffic volume in the study area and could potentially result in local increases in CO concentrations. Therefore, a mobile source analysis was conducted at critical intersections in the study area to evaluate future CO concentrations with and without the Project.
The Project would potentially result in changes to the regional vehicular travel patterns in the study areas. Therefore, the change in regional CO emissions was analyzed.
Chapter 4.6: Air Quality
4.6-3
NITROGEN OXIDES, VOCS, AND OZONE
NOx are of principal concern because of their role, together with VOCs, as precursors in the formation of ozone. Ozone is formed through a series of reactions that take place in the atmosphere in the presence of sunlight. Because the reactions are slow, and occur as the pollutants are advected downwind, elevated ozone levels are often found many miles from sources of the precursor pollutants. The effects of NOx and VOC emissions from all sources are therefore generally examined on a regional basis. The contribution of any action or project to regional emissions of these pollutants would include any added stationary or mobile source emissions; the change in regional mobile source emissions of these pollutants would be related to the total vehicle miles traveled added or subtracted on various roadway types throughout the New York and New Jersey metropolitan area, which is designated as a moderate non-attainment area for ozone by the U.S. Environmental Protection Agency (EPA).
In addition to being a precursor to the formation of ozone, NO2 (one component of NOx) is also a regulated pollutant. Since NO2 is mostly formed from the transformation of NO in the atmosphere, it is has mostly been of concern further downwind from large stationary point sources, and not a local concern from mobile sources. (NOx emissions from fuel combustion consist of approximately 90 percent NO and 10 percent NO2 at the source.) However, with the promulgation of the 2010 1-hour average standard for NO2, local sources such as mobile may become of greater concern for this pollutant.
Potential impacts on annual-average local NO2 concentrations from the fuel combustion for the Development Transfer Site’s HVAC systems were evaluated. The Project would potentially result in changes to the regional vehicular travel patterns in the study areas. Therefore, the change in regional NOx and VOC emissions was analyzed.
Regarding the new 1-hour average NO2 standard, there is uncertainty at this time as to background levels, specifically for near-road conditions which are not yet monitored. No specific guidance exists at this time describing how this standard should be evaluated for mobile sources or for evaluating the ratio of NO2 to NOx in estimating NO2 emissions from Mobile sources.
Region wide, the project is projected to reduce NOx emissions (including NO2) due to the increase in the use of passenger rail and the ensuing reduction in on-road vehicles. Overall, NYSDEC is projecting lower future NOx (including NO2) concentrations due to existing plans for reducing emissions aimed at attaining the ozone standards. Overall, the project may result in some minor increases in local NO2 concentrations, specifically near intersections where small increases in traffic volumes may occur, and HVAC emissions, which were screened out in this EA as insignificant for the annual NO2 standard (those emissions were 13 percent of the screening threshold). Some increments would also occur due to construction engines as well in the immediate vicinity of the site.
LEAD
Airborne lead emissions are currently associated principally with industrial sources. Effective January 1, 1996, the Clean Air Act (CAA) banned the sale of the small amount of leaded fuel that was still available in some parts of the country for use in on-road vehicles, concluding a 25-year effort to phase out lead in gasoline. Even at locations in the New York City area where traffic volumes are very high, atmospheric lead concentrations are far below the 3-month average national standard of 0.15 micrograms per cubic meter (µg/m3).

Moynihan Station Development Project
4.6-4
No significant sources of lead are associated with the Project, and, therefore, analysis was not warranted.
RESPIRABLE PARTICULATE MATTER—PM10 AND PM2.5
PM is a broad class of air pollutants that includes discrete particles of a wide range of sizes and chemical compositions, as either liquid droplets (aerosols) or solids suspended in the atmosphere. The constituents of PM are both numerous and varied, and they are emitted from a wide variety of sources (both natural and anthropogenic). Natural sources include the condensed and reacted forms of naturally occurring VOC; salt particles resulting from the evaporation of sea spray; wind-borne pollen, fungi, molds, algae, yeasts, rusts, bacteria, and material from live and decaying plant and animal life; particles eroded from beaches, soil, and rock; and particles emitted from volcanic and geothermal eruptions and from forest fires. Naturally occurring PM is generally greater than 2.5 micrometers in diameter. Major anthropogenic sources include the combustion of fossil fuels (e.g., vehicular exhaust, power generation, boilers, engines, and home heating), chemical and manufacturing processes, all types of construction, agricultural activities, as well as wood-burning stoves and fireplaces. PM also acts as a substrate for the adsorption (accumulation of gases, liquids, or solutes on the surface of a solid or liquid) of other pollutants, often toxic and some likely carcinogenic compounds.
As described below, PM is regulated in two size categories: particles with an aerodynamic diameter of less than or equal to 2.5 micrometers (PM2.5), and particles with an aerodynamic diameter of less than or equal to 10 micrometers (PM10, which includes PM2.5). PM2.5 has the ability to reach the lower regions of the respiratory tract, delivering with it other compounds that adsorb to the surfaces of the particles, and is also extremely persistent in the atmosphere. PM2.5 is mainly derived from combustion material that has volatilized and then condensed to form primary PM (often soon after the release from a source exhaust) or from precursor gases reacting in the atmosphere to form secondary PM.
Diesel-powered vehicles, especially heavy duty trucks and buses, are a significant source of respirable PM, most of which is PM2.5; PM concentrations may, consequently, be locally elevated near roadways with high volumes of heavy diesel powered vehicles. The Project would increase the number of diesel-powered vehicles and could potentially result in local increases of respirable PM concentrations. Therefore, an analysis of potential PM10 and PM2.5 impacts was conducted at an intersection in the study area.
The Project would potentially result in changes to the regional vehicular travel patterns in the study areas. Therefore, the change in regional PM10 and PM2.5 emissions was analyzed.
SULFUR DIOXIDE
Sulfur Dioxide (SO2) emissions are primarily associated with the combustion of sulfur-containing fuels (oil and coal). Monitored SO2 concentrations in New York City are lower than the national standards. Due to the federal restrictions on the sulfur content in diesel fuel for on-road vehicles, no significant quantities are emitted from vehicular sources. Vehicular sources of SO2 are not significant, and therefore, an analysis of SO2 from mobile sources was not warranted.
The Moynihan Station Development Project would not involve the addition of any significant new stationary emission sources, since it would use steam from Con Edison for heating purposes, and the Development Transfer Site would utilize natural gas, which emits a negligible

Chapter 4.6: Air Quality
4.6-5
quantity of sulfur dioxide. Therefore, an analysis of potential increases in SO2 emissions was not warranted. However, as required for general conformity, the net change in SO2 emissions from all relevant sources were estimated as a precursor to PM2.5.
CARBON DIOXIDE
Carbon dioxide (CO2), together with a number of other pollutants referred to as greenhouse gasses (GHGs), unlike the criteria pollutants listed above, are not pollutants with direct health impacts, but are associated with global climate change. GHGs absorb infrared radiation (heat) emitted from the earth’s surface, the atmosphere, and clouds. This property causes the general warming of the earth’s atmosphere, or the “greenhouse effect”, leading to global climate change. The net change in CO2 emissions associated with the proposed project was analyzed.
4.6.4 REGULATORY CONTEXT
NATIONAL AND STATE AIR QUALITY STANDARDS
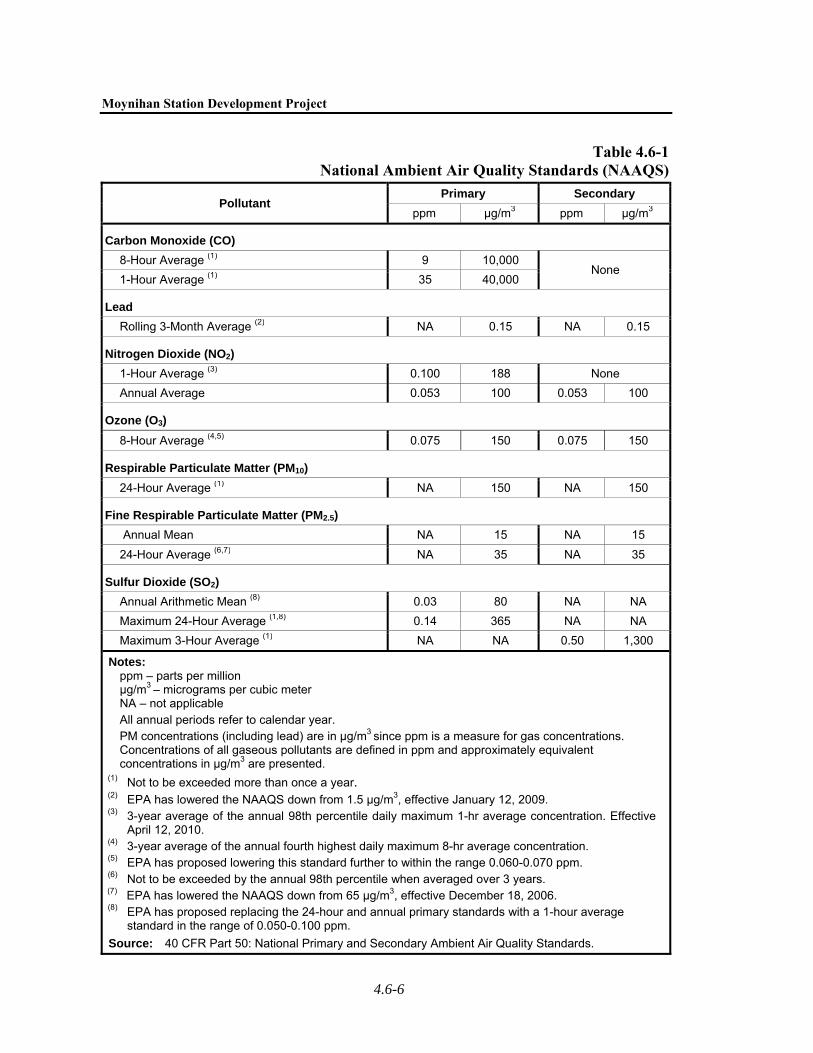
As required by the CAA, primary and secondary National Ambient Air Quality Standards (NAAQS) have been established for six major air pollutants: CO, NO2, ozone, respirable PM (both PM2.5 and PM10), SO2, and lead. The primary standards represent levels that are requisite to protect the public health, allowing an adequate margin of safety. The secondary standards are intended to protect the nation’s welfare, and account for air pollutant effects on soil, water, visibility, materials, vegetation, and other aspects of the environment. The primary and secondary standards are the same for NO2, ozone, lead, and PM, and there is no secondary standard for CO. The NAAQS are presented in Table 4.6-1. The NAAQS for CO, NO2, and SO2 have also been adopted as the ambient air quality standards for New York State, but are defined on a running 12-month basis rather than for calendar years only. New York State also has standards for total suspended particulate matter (TSP), settleable particles, non-methane hydrocarbons (NMHC), and ozone which correspond to federal standards that have since been revoked or replaced, and for beryllium, fluoride, and hydrogen sulfide (H2S).
EPA has revised the NAAQS for PM, effective December 18, 2006. The revision included lowering the level of the 24-hour PM2.5 standard from 65 µg/m3 to 35 µg/m3 and retaining the level of the annual standard at 15 µg/m3. The PM10 24-hour average standard was retained and the annual average PM10 standard was revoked. EPA has also revised the 8-hour ozone standard, lowering it from 0.08 to 0.075 parts per million (ppm), effective as of May 2008.
EPA lowered the primary and secondary standards for lead to 0.15 μg/m3, effective January 12, 2009. EPA revised the averaging time to a rolling 3-month average and the form of the standard to not-to-exceed across a 3-year span. The current lead NAAQS will remain in place for one year following the effective date of attainment designations for the new NAAQS before being revoked.
EPA established a new 1-hour average NO2 standard of 0.100 ppm, effective April 12, 2010, in addition to the current annual standard. The statistical form is the 3-year average of the 98th percentile of daily maximum 1-hour average concentration in a year.
Moynihan Station Development Project
4.6-6
Table 4.6-1National Ambient Air Quality Standards (NAAQS)
Pollutant Primary Secondary
ppm µg/m3 ppm µg/m3
Carbon Monoxide (CO)
8-Hour Average (1) 9 10,000 None
1-Hour Average (1) 35 40,000
Lead
Rolling 3-Month Average (2) NA 0.15 NA 0.15
Nitrogen Dioxide (NO2)
1-Hour Average (3) 0.100 188 None
Annual Average 0.053 100 0.053 100
Ozone (O3)
8-Hour Average (4,5) 0.075 150 0.075 150
Respirable Particulate Matter (PM10)
24-Hour Average (1) NA 150 NA 150
Fine Respirable Particulate Matter (PM2.5)
Annual Mean NA 15 NA 15
24-Hour Average (6,7) NA 35 NA 35
Sulfur Dioxide (SO2)
Annual Arithmetic Mean (8) 0.03 80 NA NA
Maximum 24-Hour Average (1,8) 0.14 365 NA NA
Maximum 3-Hour Average (1) NA NA 0.50 1,300
Notes: ppm – parts per million µg/m3 – micrograms per cubic meter NA – not applicable All annual periods refer to calendar year. PM concentrations (including lead) are in μg/m3 since ppm is a measure for gas concentrations. Concentrations of all gaseous pollutants are defined in ppm and approximately equivalent concentrations in μg/m3 are presented.
(1) Not to be exceeded more than once a year. (2) EPA has lowered the NAAQS down from 1.5 µg/m3, effective January 12, 2009. (3) 3-year average of the annual 98th percentile daily maximum 1-hr average concentration. Effective
April 12, 2010. (4) 3-year average of the annual fourth highest daily maximum 8-hr average concentration. (5) EPA has proposed lowering this standard further to within the range 0.060-0.070 ppm. (6) Not to be exceeded by the annual 98th percentile when averaged over 3 years. (7) EPA has lowered the NAAQS down from 65 μg/m3, effective December 18, 2006. (8) EPA has proposed replacing the 24-hour and annual primary standards with a 1-hour average
standard in the range of 0.050-0.100 ppm.
Source: 40 CFR Part 50: National Primary and Secondary Ambient Air Quality Standards.

Chapter 4.6: Air Quality
4.6-7
On November 16, 2009, EPA proposed to establish a new 1-hour average SO2 standard at a level between 0.050-0.100 ppm, replacing the current 24-hour and annual primary standards. The statistical form proposed is the 3-year average of the 4th highest daily maximum 1-hour average concentration in a year (the the 4th highest daily maximum corresponds approximately to 99th percentile for a year.) EPA intends to issue a final decision on the SO2 standard by June 2, 2010.
On January 6, 2010, EPA proposed a change in the 2008 ozone NAAQS, lowering the primary NAAQS from the current 0.075 ppm level to within the range of 0.060-0.070 ppm. EPA is also proposing a secondary standard, measured as a cumulative concentration within the range of 7-15 ppm-hours aimed mainly at protecting sensitive vegetation. EPA intends to complete this reconsideration of the 2008 ozone NAAQS by August 31, 2010.
STATE IMPLEMENTATION PLANS (SIP)
The CAA, as amended in 1990, defines non-attainment areas (NAA) as geographic regions that have been designated as not meeting one or more of the NAAQS. When an area is designated as non-attainment by EPA, the state is required to develop and implement a State Implementation Plan (SIP), which delineates how a state plans to achieve air quality that meets the NAAQS under the deadlines established by the CAA.
In 2002, EPA re-designated New York City as in attainment for CO. The CAA requires that a maintenance plan ensure continued compliance with the CO NAAQS for former non-attainment areas. New York City is also committed to implementing site-specific control measures throughout the city to reduce CO levels, should unanticipated localized growth result in elevated CO levels during the maintenance period.
Manhattan has been designated as a moderate NAA for PM10. On December 17, 2004, EPA took final action designating the five New York City counties, Nassau, Suffolk, Rockland, Westchester, and Orange counties as a PM2.5 non-attainment area under the CAA due to exceedance of the annual average standard. New York State has submitted a draft SIP to EPA, dated April 2008, designed to meet the annual average standard by April 8, 2010, which will be finalized after public review.
As described above, EPA has revised the 24-hour average PM2.5 standard. In October 2009 EPA finalized the designation of the New York City Metropolitan Area as nonattainment with the 2006 24-hour PM2.5 NAAQS, effective in November 2009. The nonattainment area includes the same 10-county area EPA designated as nonattainment with the 1997 annual PM2.5 NAAQS. By November 2012 New York will be required to submit a SIP demonstrating attainment with the 2006 24-hour standard by November 2014. (EPA may grant attainment date extensions for up to five additional years.)
Nassau, Rockland, Suffolk, Westchester, Lower Orange County Metropolitan Area (LOCMA), and the five New York City counties had been designated as a severe non-attainment area for ozone (1-hour average standard). In November 1998, New York State submitted its Phase II Alternative Attainment Demonstration for Ozone, which was finalized and approved by EPA effective March 6, 2002, addressing attainment of the 1-hour ozone NAAQS by 2007. These SIP revisions included additional emission reductions that EPA requested to demonstrate attainment of the standard, and an update of the SIP estimates using the latest versions of the mobile source emissions model, MOBILE6.2, and the nonroad emissions model, NONROAD—which have been updated to reflect current knowledge of engine emissions and the latest mobile and nonroad engine emissions regulations.

Moynihan Station Development Project
4.6-8
On April 15, 2004, EPA designated these same counties as moderate non-attainment for the 8-hour average ozone standard which became effective as of June 15, 2004 (LOCMA was moved to the Poughkeepsie moderate non-attainment area for 8-hour ozone). EPA revoked the 1-hour standard on June 15, 2005; however, the specific control measures for the 1-hour standard included in the SIP are required to stay in place until the 8-hour standard is attained. The discretionary emissions reductions in the SIP would also remain but could be revised or dropped based on modeling. On February 8, 2008, NYSDEC submitted final revisions to a new SIP for the ozone to EPA. NYSDEC has determined that achieving attainment for ozone before 2012 is unlikely, and has therefore made a request for a voluntary reclassification of the New York nonattainment area as “serious”.
In March 2008 EPA strengthened the 8–hour ozone standards. SIPs will be due three years after the final designations are made. On March 12, 2009, NYSDEC recommended that the counties of Suffolk, Nassau, Bronx, Kings, New York, Queens, Richmond, Rockland, and Westchester be designated as a non-attainment area for the 2008 ozone NAAQS (the NYMA MSA nonattainment area).
New York City is currently in attainment of the annual-average NO2 standard. EPA has promulgated a new 1-hour standard, but it is unclear at this time what the City’s attainment status will be due to the need for additional near road monitoring required for the new standard. The existing monitoring data indicates background concentrations below the standard. It is likely that New York City will be designated as “unclassifiable” at first (January 2012), and then classified once three years of monitoring data are available (2016 or 2017).
New York City is currently in attainment of the SO2 standards. EPA has proposed to replace the current standards with a new 1-hour standard. Bronx, Chautauqua, and Suffolk counties are the only counties in NY State currently within the proposed range of the standard and the status of those areas will be determined based on the level established in the final standard. Concentrations in all other areas are below the proposed range.
GENERAL CONFORMITY
In November 1993, EPA promulgated the General Conformity Rule under the CAA to ensure that actions taken by federal entities do not impede SIP efforts to attain and maintain the NAAQS. Actions conforming to the SIP would not:
1. Cause or contribute to any new violation of any standard in any area;
2. Interfere with provisions in the applicable SIP for maintenance of any standard;
3. Increase the frequency or severity of any existing violation of any standard in any area; or
4. Delay timely attainment of any standard or any required interim emission reductions or other milestones in any area.
Federal actions with the Federal Railroad Administration (FRA) as the lead agency are subject to the General Conformity Rule, pursuant to 40 C.F.R. 51.850-51.860. Under this rule, a conformity determination is required for any criteria pollutant in a non-attainment or maintenance area affected by a federal action if the action would result in pollutant emissions exceeding the established screening criteria (de minimis) emissions rates or exceeding 10 percent of the area-wide emissions. Actions that would not result in emissions exceeding the above criteria would conform to the SIPs.
Chapter 4.6: Air Quality
4.6-9
As an FRA action, the Moynihan Station Development Project must conform to the CO2, ozone, PM10, and PM2.5 SIPs in the metropolitan area. The applicable de minimis threshold for PM10, CO, PM2.5, SO2 (PM2.5 precursor), and NOx (a PM2.5 and ozone precursor) is 100 tons per year; the de minimis threshold for VOC (an ozone precursor) is 50 tons per year since New York City is within an ozone transport zone.
The Project would increase rail ridership and therefore increase locomotive emission and would reduce on-road trips and the ensuing emissions. The rail emissions increments due to the Project would occur mainly in the New York Metropolitan region, but negligible increments would occur in other nonattainment areas in New York State, New Jersey, and Connecticut as well. The Project would also result in a small increase in emissions from the heating systems of the Development Transfer Site. Temporarily, during construction, there would be emissions associated with non-road construction engines and with on-road deliveries. These emissions have been estimated in this chapter.
DETERMINING THE SIGNIFICANCE OF AIR QUALITY IMPACTS
Any action predicted to increase the concentration of a criteria air pollutant to a level that would exceed the concentrations defined by the NAAQS (see Table 4.6-1) would be deemed to have a potential significant adverse impact. In addition, in order to maintain concentrations lower than the NAAQS in attainment areas, or to ensure that concentrations will not be significantly increased in non-attainment areas, threshold levels have been defined for certain pollutants. Any action predicted to increase the concentrations of these pollutants above the thresholds may be deemed to have a potential significant adverse impact, even in cases where violations of the NAAQS are not predicted. The applicable incremental thresholds are discussed below.
There are no specific benchmarks or regulations applicable to GHG emission levels or impacts from actions subject to environmental review under NEPA. Accordingly, the potential effects of the Project are evaluated in the context of their consistency with the objectives stated in the New York State Energy Plan, PlaNYC, and other relevant policies. The potential change in CO2 emissions from the Project are assessed and disclosed and evaluated in the context of those policies.
DE MINIMIS CRITERIA REGARDING CO IMPACTS
New York City has developed de minimis criteria to assess the significance of the incremental increase in CO concentrations that would result from proposed projects or actions, as set forth in the CEQR Technical Manual. These criteria set the minimum change in CO concentration that defines a significant environmental impact. Significant increases of CO concentrations in New York City are defined as: (1) an increase of 0.5 ppm or more in the maximum 8-hour average CO concentration at a location where the predicted 8-hour concentration in the Future Without the Proposed Action (the No Build condition) is equal to or between 8 and 9 ppm; or (2) an increase of more than half the difference between baseline (i.e., No Build) concentrations and the 8-hour standard, when No Build concentrations are below 8.0 ppm.
INTERIM GUIDANCE CRITERIA REGARDING PM2.5 IMPACTS
DEC has published a policy to provide interim direction for evaluating PM2.5 impacts. This policy would apply only to facilities applying for permits or major permit modifications under SEQRA that emit 15 tons of PM10 or more annually. The policy states that such a project will be deemed to have a potentially significant adverse impact if the project’s maximum impacts are
Moynihan Station Development Project
4.6-10
predicted to increase PM2.5 concentrations by more than 0.3 µg/m3 averaged annually or more than 5 µg/m3 on a 24-hour basis. Projects that exceed either the annual or 24-hour threshold will be required to prepare an Environmental Impact Statement (EIS) to assess the severity of the impacts, to evaluate alternatives, and to employ reasonable and necessary mitigation measures to minimize the PM2.5 impacts of the source to the maximum extent practicable.
In addition, DEP is currently recommending interim guidance criteria for evaluating the potential PM2.5 impacts for projects subject to CEQR. The interim guidance criteria currently employed by DEP for determination of potential significant adverse PM2.5 impacts under CEQR are as follows:
24-hour average PM2.5 concentration increments which are predicted to be greater than 5 µg/m3 at a discrete receptor location would be considered a significant adverse impact on air quality under operational conditions (i.e., a permanent condition predicted to exist for many years regardless of the frequency of occurrence);
24-hour average PM2.5 concentration increments which are predicted to be greater than 2 µg/m3 but no greater than 5 µg/m3 would be considered a significant adverse impact on air quality based on the magnitude, frequency, duration, location, and size of the area of the predicted concentrations;
Annual average PM2.5 concentration increments which are predicted to be greater than 0.1 µg/m3 at ground level on a neighborhood scale (i.e., the annual increase in concentration representing the average over an area of approximately 1 square kilometer, centered on the location where the maximum ground-level impact is predicted for stationary sources; or at a distance from a roadway corridor similar to the minimum distance defined for locating neighborhood scale monitoring stations); or
Annual average PM2.5 concentration increments which are predicted to be greater than 0.3 µg/m3 at a discrete receptor location (elevated or ground level).
Actions under CEQR predicted to increase PM2.5 concentrations by more than the DEP or DEC interim guidance criteria above will be considered to have a potential significant adverse impact. DEP recommends that its actions subject to CEQR that fail the interim guidance criteria prepare an environmental impact statement (EIS) and examine potential measures to reduce or eliminate such potential significant adverse impacts.
The annual emissions of PM10 from the proposed building at the Development Transfer Site are estimated to be well below the 15-ton-per- year threshold under DEC’s PM2.5 policy guidance. The above NYCDEP and NYSDEC interim guidance criteria have been used to evaluate the significance of predicted impacts of the proposed project on PM2.5 concentrations and determine the need to minimize particulate matter emissions from the proposed project.
4.6.5 ANALYSIS METHODOLOGY
As mentioned above, the air quality analysis procedures suggested in the CEQR Technical Manual and NYSDOT’s EPM were used to assist in the development of the methodology and assessment of impacts in this air quality study.
MOBILE SOURCES
The prediction of vehicle-generated CO and PM concentrations in an urban environment incorporates meteorological phenomena, traffic conditions, and physical configurations. Air

Chapter 4.6: Air Quality
4.6-11
pollutant dispersion models mathematically simulate how traffic, meteorology, and geometry combine to affect pollutant concentrations. The mathematical expressions and formulations contained in the various models attempt to describe an extremely complex physical phenomenon as closely as possible. However, because all models contain simplifications and approximations of actual conditions and interactions and it is necessary to predict the reasonable worst case condition, most of these dispersion models predict conservatively high concentrations of pollutants.
The mobile source analyses for the Project employ a model approved by EPA that has been widely used for evaluating air quality impacts of projects in New York City, other parts of New York State, and throughout the country. The modeling approach includes a series of conservative assumptions relating to meteorology, traffic, and background concentration levels resulting in a conservatively high estimate of expected pollutant concentrations that could ensue from the proposed project. The significance criteria used in the PM analysis were based on the PM2.5 interim guidance developed by the NYCDEP.
DISPERSION MODEL FOR MICROSCALE ANALYSES
Maximum CO concentrations adjacent to streets near the project site, resulting from vehicle emissions, were predicted using the CAL3QHC model Version 2.0.1 The CAL3QHC model employs a Gaussian (normal distribution) dispersion assumption and includes an algorithm for estimating vehicular queue lengths at signalized intersections. CAL3QHC predicts emissions and dispersion of CO from idling and moving vehicles. The queuing algorithm includes site-specific traffic parameters, such as signal timing and delay calculations (from the 2000 Highway Capacity Manual traffic forecasting model), saturation flow rate, vehicle arrival type, and signal actuation (i.e., pre-timed or actuated signal) characteristics to accurately predict the number of idling vehicles. The CAL3QHC model has been updated with an extended module, CAL3QHCR, which allows for the incorporation of hourly meteorological data into the modeling, instead of worst-case assumptions regarding meteorological parameters. This refined version of the model, CAL3QHCR, is employed if maximum predicted future CO concentrations are greater than the applicable ambient air quality standards or when de minimis thresholds are exceeded using the first-level CAL3QHC modeling.
To determine motor vehicle-generated PM concentrations adjacent to streets near the Project’s study area, the CAL3QHCR model was applied. This refined version of the model can utilize hourly traffic and meteorology data, and is therefore more appropriate for calculating 24-hour and annual average concentrations.
METEOROLOGY
Tier I Analyses—CAL3QHC
In general, the transport and concentration of pollutants from vehicular sources are influenced by three principal meteorological factors: wind direction, wind speed, and atmospheric stability. Wind direction influences the accumulation of pollutants at a particular prediction location
1 User’s Guide to CAL3QHC, A Modeling Methodology for Predicted Pollutant Concentrations Near Roadway
Intersections, Office of Air Quality, Planning Standards, EPA, Research Triangle Park, North Carolina, Publication EPA-454/R-92-006.

Moynihan Station Development Project
4.6-12
(receptor), and atmospheric stability accounts for the effects of vertical mixing in the atmosphere.
CO calculations were performed using the CAL3QHC model. In applying the CAL3QHC model, the wind angle was varied to determine the wind direction resulting in the maximum concentrations at each receptor.
Following the EPA guidelines1, CO computations were performed using a wind speed of 1 meter per second and the neutral stability class D. The 8-hour average CO concentrations were estimated by multiplying the predicted 1-hour average CO concentrations by a factor of 0.77 to account for persistence of meteorological conditions and fluctuations in traffic volumes. A surface roughness of 3.21 meters was chosen. At each receptor location, the wind angle that maximized the pollutant concentrations was used in the analysis regardless of frequency of occurrence. These assumptions ensured that reasonable worst-case meteorology was used to estimate impacts.
Tier II Analyses—CAL3QHCR
A Tier II analysis performed with the CAL3QHCR model, which includes the modeling of hourly concentrations based on hourly traffic data and 5 years of monitored hourly meteorological data, was performed to predict maximum 24-hour and annual average PM levels. The data consists of surface data collected at LaGuardia Airport and upper air data collected at Brookhaven, New York for the period 2003-2007. All hours were modeled, and the highest resulting concentration for each averaging period is presented.
ANALYSIS YEAR
The microscale analysis for CO was performed for Existing Conditions (baseline year), and CO and PM was performed for future year conditions without the proposed project (No Build conditions) and future conditions with the proposed project (Build conditions) for the build year of 2015.
VEHICLE EMISSIONS DATA
Engine Emissions
Vehicular CO and PM emission factors were computed using the EPA mobile source emissions model, MOBILE6.22. This emissions model is capable of calculating engine emission factors for various vehicle types, based on the fuel (gasoline, diesel, or natural gas), meteorological conditions, vehicle speeds, vehicle age, roadway types, number of starts per day, engine soak time, and various other factors that influence emissions, such as inspection maintenance programs. The inputs and use of MOBILE6.2 incorporates the most current guidance available from the NYSDEC and NYCDEP. An ambient temperature of 50° Fahrenheit was used in accordance with CEQR guidelines.
1 Guidelines for Modeling Carbon Monoxide from Roadway Intersections, EPA Office of Air Quality Planning and
Standards, Publication EPA-454/R-92-005. 2 EPA, User’s Guide to MOBILE6.1 and MOBILE6.2: Mobile Source Emission Factor Model, USEPA420-R-02-028,
October 2002.
Chapter 4.6: Air Quality
4.6-13
Vehicle classification data were based on field studies conducted as part of the 2006 Farley/Moynihan FEIS and the Hudson Yards Final Generic EIS (FGEIS). Appropriate credits were used to accurately reflect the inspection and maintenance programs that require inspections of automobiles and light trucks to determine if pollutant emissions from the vehicles’ exhaust systems are below emission standards. Vehicles failing the emissions test must undergo maintenance and pass a repeat test to be registered in New York State.
Road Dust
The contribution of re–entrained road dust to PM10 concentrations, as presented in the PM10 SIP, is considered to be significant; therefore, the PM10 estimates include both exhaust and road dust. Road dust emission factors were calculated according to the latest procedure delineated by EPA.1 In accordance with the NYCDEP PM2.5 interim guidance criteria, emission rates were determined with fugitive road dust to account for their impacts in local microscale analyses. However, fugitive road dust was not included in the neighborhood scale PM2.5 microscale analysis, since it is considered to be an insignificant contribution on that scale.
TRAFFIC DATA
Traffic data for the air quality analysis were derived from existing traffic counts, projected future growth in traffic, and other information developed as part of the traffic analysis for the currently proposed Project.
Traffic data for the future without and with the Project were employed in the respective air quality modeling scenarios. The weekday AM (8 to 9 AM), weekday midday (12 AM to 1 PM), and weekday PM (5 to 6 PM) peak periods were subjected to microscale analysis. These time periods were selected for the mobile source analysis to represent reasonable worst-case conditions when considering total traffic volumes, Level of Service (LOS), and project-generated traffic at each of the intersections selected for analysis.
For particulate matter, the peak weekday AM, midday, and PM period traffic volumes were used as a baseline; traffic volumes for other hours due to No Build traffic and project-generated traffic were determined by adjusting the peak period volumes by the 24-hour distributions of actual vehicle counts collected for the project. PM impacts were determined by using the 24-hour distribution associated with the highest total daily vehicle count.
BACKGROUND CONCENTRATIONS
Background concentrations are those pollutant concentrations not directly accounted for through the modeling analysis, which directly account for vehicle-generated emissions on the streets within 1,000 feet and line-of-sight of the receptor location. Background concentrations must be added to modeling results to obtain total pollutant concentrations at a study site.
The 8-hour average background CO concentration used in this analysis was 1.7 ppm, which is based on the highest, second-highest 8-hour measurements over the most recent three-year period for which complete monitoring data are available (2005-2007).
The PM10 24-hour background concentration is based on the highest and second highest concentrations, respectively, measured over a recent 3-year period at the nearest NYSDEC 1 EPA, Compilations of Air Pollutant Emission Factors AP-42, Fifth Edition, Volume I: Stationary Point and Area
Sources, Draft Ch. 13.2.1, NC, http://www.epa.gov/ttn/chief/ap42, November 2006.
Moynihan Station Development Project
4.6-14
background monitoring station. For the proposed project, the 24-hour background concentration is 60 μg/m3. For PM2.5, background concentrations are not considered, since impacts are determined on an incremental basis only based on NYCDEP guidance.
MOBILE SOURCE ANALYSIS SITES
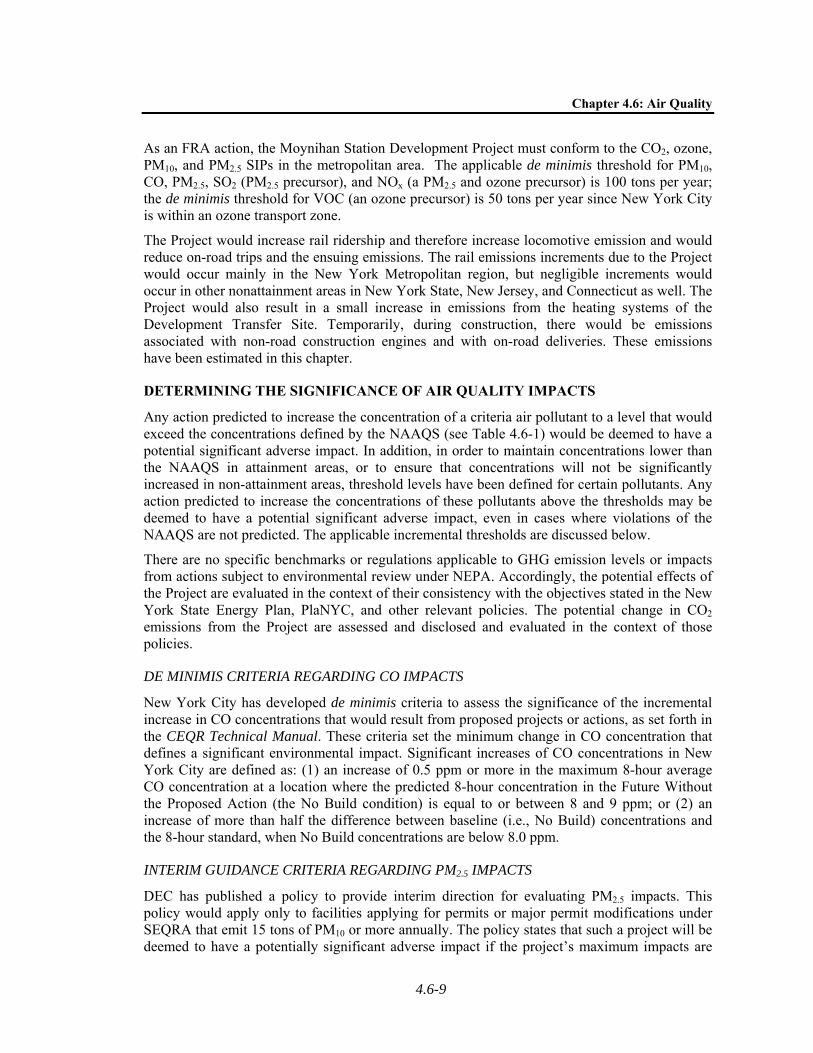
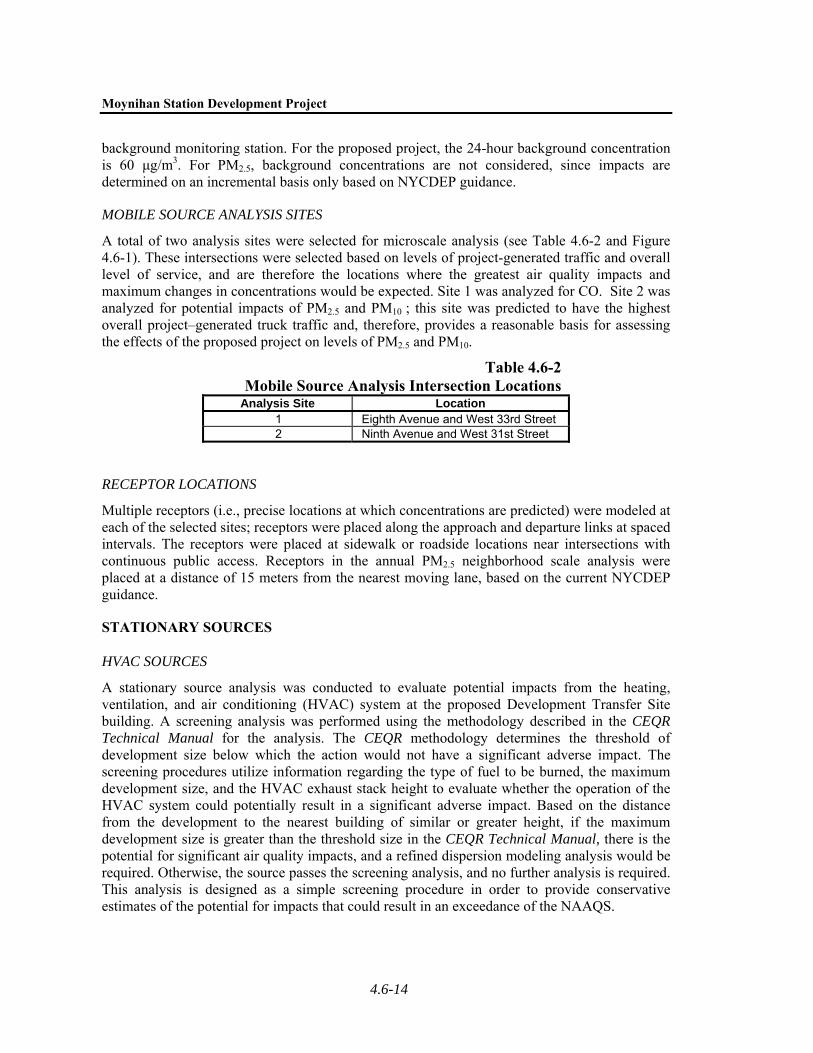
A total of two analysis sites were selected for microscale analysis (see Table 4.6-2 and Figure 4.6-1). These intersections were selected based on levels of project-generated traffic and overall level of service, and are therefore the locations where the greatest air quality impacts and maximum changes in concentrations would be expected. Site 1 was analyzed for CO. Site 2 was analyzed for potential impacts of PM2.5 and PM10 ; this site was predicted to have the highest overall project–generated truck traffic and, therefore, provides a reasonable basis for assessing the effects of the proposed project on levels of PM2.5 and PM10.
Table 4.6-2Mobile Source Analysis Intersection Locations
Analysis Site Location1 Eighth Avenue and West 33rd Street 2 Ninth Avenue and West 31st Street
RECEPTOR LOCATIONS
Multiple receptors (i.e., precise locations at which concentrations are predicted) were modeled at each of the selected sites; receptors were placed along the approach and departure links at spaced intervals. The receptors were placed at sidewalk or roadside locations near intersections with continuous public access. Receptors in the annual PM2.5 neighborhood scale analysis were placed at a distance of 15 meters from the nearest moving lane, based on the current NYCDEP guidance.
STATIONARY SOURCES
HVAC SOURCES
A stationary source analysis was conducted to evaluate potential impacts from the heating, ventilation, and air conditioning (HVAC) system at the proposed Development Transfer Site building. A screening analysis was performed using the methodology described in the CEQR Technical Manual for the analysis. The CEQR methodology determines the threshold of development size below which the action would not have a significant adverse impact. The screening procedures utilize information regarding the type of fuel to be burned, the maximum development size, and the HVAC exhaust stack height to evaluate whether the operation of the HVAC system could potentially result in a significant adverse impact. Based on the distance from the development to the nearest building of similar or greater height, if the maximum development size is greater than the threshold size in the CEQR Technical Manual, there is the potential for significant air quality impacts, and a refined dispersion modeling analysis would be required. Otherwise, the source passes the screening analysis, and no further analysis is required. This analysis is designed as a simple screening procedure in order to provide conservative estimates of the potential for impacts that could result in an exceedance of the NAAQS.

W. 38TH ST.
W. 36TH ST.
W. 37TH ST.
W. 35TH ST.
W. 34TH ST.
W. 33RD ST.
W. 32ND ST.
W. 31ST ST.
W. 30TH ST.
W. 29TH ST.
W. 28TH ST.
W. 27TH ST.
W. 26TH ST.
W. 25TH ST.
NIN
TH A
VE.
TEN
TH A
VE.
EIG
HTH
AVE
.
SEVE
NTH
AVE
.
1
N
SCALE
0 400 800 FEET
1
2
Mobile Source Analysis Site LocationsFigure 4.6-1
12.1
5.09
Farley Complex
Development Transfer Site
Mobile Source Analysis Site Location
MOYNIHAN STATION DEVELOPMENT PROJECT
Chapter 4.6: Air Quality
4.6-15
INDUSTRIAL SOURCES
Since the Development Transfer Site would include hotel and residential uses and, as noted earlier, a hotel use has been proposed for the Farley Building, an assessment was conducted to determine the potential for impacts due to industrial activities on sensitive receptors associated with the proposed project.
Data Collection
All industrial air pollutant emission sources within 400 feet of the Farley Complex and the Development Transfer Site were considered for inclusion in the air quality impact analyses. These boundaries were used to identify the extent of the study area for determining air quality impacts associated with the proposed project.
A request was made to NYCDEP’s Bureau of Environmental Compliance (BEC) to obtain the most current information regarding the release of air pollutants from all existing manufacturing or industrial sources within the entire study area. The NYCDEP air permit data provided was compiled into a database of source locations, air emission rates, and other data pertinent to determining source impacts. A comprehensive search was also performed to identify NYSDEC Title V permits and permits listed in the EPA Envirofacts database.1 Facilities that appeared in the Envirofacts database but did not also possess a NYCDEP certificate to operate were cross-referenced against NYSDEC’s Air Guide-1 software emissions database, which presents a statewide compilation of permit data for toxic air pollutants, to obtain emissions data and stack parameters.
A field survey was conducted on March 3, 2005, to determine the operating status of permitted industries and identify any potential industrial sites not included in the permit databases. The results of the field survey were compared against NYCDEP data sources.
Dispersion Modeling
Potential impacts from industrial sources on the Project buildings were evaluated using the Industrial Source Complex Short Term (ISCST3) dispersion model, developed by EPA2. The ISCST3 model calculates pollutant concentrations from one or more points (e.g., exhaust stacks) based on emission rates, source parameters, and hourly meteorological data. Computations with the ISCST3 model to predict concentrations from exhaust stacks were made assuming stack tip downwash, buoyancy-induced dispersion, gradual plume rise, urban dispersion coefficients and wind profile exponents, no collapsing of stable stability classes, and elimination of calms. Since the highest concentrations were predicted to occur on elevated (flagpole) receptors, the ISCST3 model was run without downwash. The meteorological data set consisted of five years of meteorological data: surface data collected at LaGuardia Airport (1999-2003) and concurrent upper air data collected at Brookhaven, Suffolk County, New York.
Discrete receptors (i.e., locations at which concentrations were calculated) were placed on the Farley Complex site and the Development Transfer Site. The receptor network consisted of receptors located at spaced intervals along the sides of the Farley Complex and the Development
1 EPA, Envirofacts Data Warehouse, http://oaspub.epa.gov/enviro/ef_home2.air, accessed March 4, 2005. 2 EPA, User's Guide for the Industrial Source Complex (ISC3) Dispersion Models, EPA-454/B-95-003a, NC,
September 1995 and Addendum, February 2002.
Moynihan Station Development Project
4.6-16
Transfer Site buildings from the ground floor to the roofline and at other publicly accessible ground level locations.
Emission rates and stack parameters, obtained from the NYCDEP permits, were input into the ISCST3 dispersion model.
Predicted worst-case impacts were compared with the short-term and annual guideline concentrations (SGCs and AGCs) recommended in NYSDEC’s DAR-1 AGC/SGC Tables.1 These guideline concentrations are applied as screening thresholds to determine if the Project could be significantly impacted by nearby air pollution sources.
To assess the effects of multiple sources emitting the same pollutants, cumulative source impacts were determined. Concentrations of the same pollutant from industrial sources that were within 400 feet of the Farley Complex and Development Transfer Site were combined and compared to the guideline concentrations discussed above.
GENERAL CONFORMITY AND GREENHOUSE GAS EMISSIONS
To determine the benefits that the fully operational Moynihan Station would have on regional air quality by increasing rail ridership and thereby reducing vehicular traffic, region-wide annual net pollutant emissions were estimated. Emissions associated with the heating systems for the Development Transfer Site building and construction period were included as well, in order to determine the net change in pollutant emissions due to the Project. Criteria pollutants and precursor emissions analyzed include NOx, VOCs, CO, PM10, PM2.5, and SO2. Greenhouse gas emissions were estimated as well.
The regional emissions analysis was conducted for the first operational year of the project, 2015. Since future locomotive emission rates are expected to decrease more than on-road vehicle emission rates, 2015 emissions would be the most conservative and further future year emissions increments would be lower than in 2015 (the Project would increase locomotive emissions and decrease on-road emissions). Construction emissions were calculated for the construction period, 2010-2014.
MOBILE SOURCES
Induced ridership on Amtrak and other rail operators, due to station improvements, would result in potential reductions in vehicle-miles traveled (VMT). Emission benefits are calculated to represent the vehicle emissions saved from passengers who would normally use motor vehicles as their mode of transportation along each segment, but would instead choose to travel by rail due to the station improvements proposed as part of the Project.
In addition, as part of the Project, a new taxi bay will be created on the midblock of West 31st Street and/or West 33rd Street for improved taxi drop-off and pick-up operations at Moynihan Station. As a result, vehicle emissions would be reduced from taxis that no longer circulate through West Midtown Manhattan as they search for passengers. However, additional taxi emissions would be generated from taxis idling in the taxi bays as they arrive, pick-up/drop-off passengers and depart.
The removal of idling USPS trucks from Ninth Avenue would also result in emissions reductions. Without the Project, an average of 10 USPS trucks per hour (for 12 hours per day) 1 NYSDEC Division of Air Resources, September 10, 2007.

Chapter 4.6: Air Quality
4.6-17
would idle on Ninth Avenue waiting to enter the loading areas at the Western Annex. In order to facilitate the proposed project, trucking activities have been consolidated at the Morgan Annex nearby, so that these trucks are no longer idling on local streets. Instead of waiting to enter the constricted truck loading entrance at the Farley Complex's Ninth Avenue facade, these trucks now proceed directly to the Morgan Annex, where they are able to go directly into the building to loading areas, and turn off their engines.
Trip generation for Project uses was included as well for the conformity analysis. Distances were all conservatively assumed to be 9 miles per trip.1
The reductions in annual pollutant emissions due to the above elements of the Project were analyzed using the emissions modeling assumptions described above for the mobile source analysis, in conjunction with the VMT reduction estimates due to the Project. CO2 emissions were estimated by dividing the net VMT by the average car and truck fuel efficiencies of 22.1 miles per gallon and 6.2 miles per gallon, respectively, projected for the 2015 analysis year,2 to estimate total gallons of fuel consumed, and multiplying by the carbon content of the fuels, 3 which result in 8,877 grams of CO2 per gallon of gasoline and 10,186 grams of CO2 per gallon of diesel.
LOCOMOTIVE EMISSIONS
Passenger locomotive emission factors were taken from EPA’s support documentation for the 1997 Locomotive Emissions Final Rulemaking,4 and adjusted for changes expected as a result of the rule published by EPA in 2008,5 which will further reduce locomotive emissions. Specifically, the rule is expected to reduce PM and NOx emissions significantly in future years, starting in 2010.
Passenger train locomotives are assumed to consume 54,312 Btu per rail car.6
STATIONARY SOURCE EMISSIONS
Stationary source emission rates were calculated as described above for the Development Transfer Site, and annual emissions were calculated based on total annual fuel consumption. CO2 emissions were estimated based on the carbon content of natural gas—117 pounds of CO2 per million British thermal units (MMBtu).7
1 Center for Transportation Analysis, Oak Ridge National Laboratories, Add-on for New York State, National
Household Travel Survey (NHTS), 2001. 2 Energy Information Administration, An Updated Annual Energy Outlook 2009 Reference Case Reflecting
Provisions of the American Recovery and Reinvestment Act and Recent Changes in the Economic Outlook, 2009. Table 7 Transportation Sector Key Indicators and Delivered Energy Consumption.
3 The Code of Federal Regulations (40 CFR 600.113). 4 Data published by EPA, December 17, 1997 and corrections, http://www.epa.gov/otaq/locomotives.htm. 5 EPA, Control of Emissions of Air Pollution From Locomotive Engines and Marine Compression-Ignition Engines
Less Than 30 Liters per Cylinder; 40 CFR Parts 9, 85, 86, 89, 92, 94, 1033, 1039, 1042, 1065, and 1068; Republication June 30, 2008.
6 Oak Ridge National Laboratory, Transportation Energy Data Book, Edition 27, 2008. 7 Energy Information Administration. Voluntary Reporting of Greenhouse Gases Program, Fuel and Energy Source
Codes and Emission Coefficients. http://www.eia.doe.gov/oiaf/1605/coefficients.html
Moynihan Station Development Project
4.6-18
CONSTRUCTION EMISSIONS
Construction emissions were estimated for all on-site nonroad and on-road sources based on the EPA NONROAD model emission factors, mobile source emissions factors as described above, and on detailed construction activity data. For more details on the emissions calculations for construction see Appendix 3, “Air Quality”.
4.6.6 EXISTING CONDITIONS
EXISTING MONITORED AIR QUALITY CONDITIONS (2007)
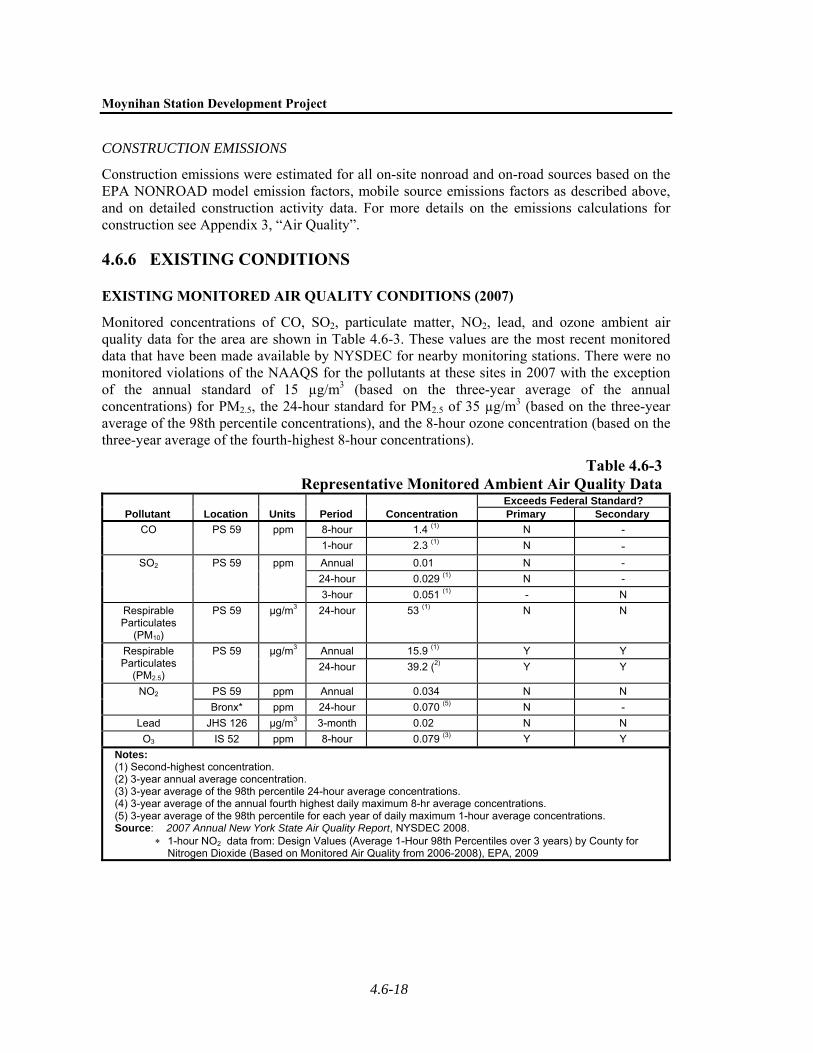
Monitored concentrations of CO, SO2, particulate matter, NO2, lead, and ozone ambient air quality data for the area are shown in Table 4.6-3. These values are the most recent monitored data that have been made available by NYSDEC for nearby monitoring stations. There were no monitored violations of the NAAQS for the pollutants at these sites in 2007 with the exception of the annual standard of 15 µg/m3 (based on the three-year average of the annual concentrations) for PM2.5, the 24-hour standard for PM2.5 of 35 µg/m3 (based on the three-year average of the 98th percentile concentrations), and the 8-hour ozone concentration (based on the three-year average of the fourth-highest 8-hour concentrations).
Table 4.6-3Representative Monitored Ambient Air Quality Data
Pollutant Location Units Period Concentration Exceeds Federal Standard? Primary Secondary
CO PS 59 ppm 8-hour 1.4 (1) N -
1-hour 2.3 (1) N - SO2 PS 59 ppm Annual 0.01 N -
24-hour 0.029 (1) N -
3-hour 0.051 (1) - N
Respirable Particulates
(PM10)
PS 59 μg/m3 24-hour 53 (1) N N
Respirable Particulates
(PM2.5)
PS 59 μg/m3 Annual 15.9 (1) Y Y
24-hour 39.2 (2) Y Y
NO2 PS 59 ppm Annual 0.034 N N
Bronx* ppm 24-hour 0.070 (5) N -
Lead JHS 126 μg/m3 3-month 0.02 N N
O3 IS 52 ppm 8-hour 0.079 (3) Y Y
Notes: (1) Second-highest concentration. (2) 3-year annual average concentration. (3) 3-year average of the 98th percentile 24-hour average concentrations. (4) 3-year average of the annual fourth highest daily maximum 8-hr average concentrations. (5) 3-year average of the 98th percentile for each year of daily maximum 1-hour average concentrations. Source: 2007 Annual New York State Air Quality Report, NYSDEC 2008.
1-hour NO2 data from: Design Values (Average 1-Hour 98th Percentiles over 3 years) by County for Nitrogen Dioxide (Based on Monitored Air Quality from 2006-2008), EPA, 2009

Chapter 4.6: Air Quality
4.6-19
MODELED EXISTING POLLUTANT CONCENTRATIONS—CO EMISSIONS FROM MOBILE SOURCES
As noted previously, receptors were placed at multiple sidewalk locations next to the intersection under analysis. The receptor with the highest predicted CO concentrations was used to represent the intersection site for existing conditions. CO concentrations were calculated for each receptor location, for each peak period specified above.
Table 4.6-4 shows the maximum modeled existing CO 8-hour average concentrations at the selected intersection. (No 1-hour values are shown since predicted values are much lower than the standard.) At Receptor Site 1, the maximum predicted 8-hour average concentrations are within the national standard of 9 ppm.
Table 4.6-4Baseline Maximum Predicted 8-Hour
Average Carbon Monoxide Existing Concentrations (parts per million)
Site Location Time Period Existing 8-Hour Concentration
(ppm) 1 Eighth Avenue and
West 33rd Street Weekday AM 2.8
Weekday Midday 3.0 Weekday PM 2.9
Notes: 8-hour CO standard is 9 ppm. An adjusted ambient background concentration of 2.9 ppm is included in the existing values presented above.
4.6.7 NO ACTION ALTERNATIVE
MOBILE SOURCES
CARBON MONOXIDE
CO concentrations without the Project were determined for the 2015 analysis year using the methodology previously described. Table 4.6-5 presents the maximum predicted 8-hour average CO No Build concentrations at the selected analysis intersection in the project study area. The values shown are the highest predicted concentrations.
Table 4.6-52015 Maximum Predicted 8-Hour
Average Carbon Monoxide No Action Alternative Concentrations (parts per million)
Site Location Time Period No Build 8-Hour Concentration (ppm)1 Eighth Avenue and
West 33rd Street Weekday AM 2.7
Weekday Midday 2.9 Weekday PM 2.9
Notes: 8-hour CO standard is 9 ppm. An adjusted ambient background concentration of 2.9 ppm is included in the No Build values presented above.
Moynihan Station Development Project
4.6-20
As indicated in the table, the No Build concentrations are below the corresponding standard of 9 ppm.
PM10
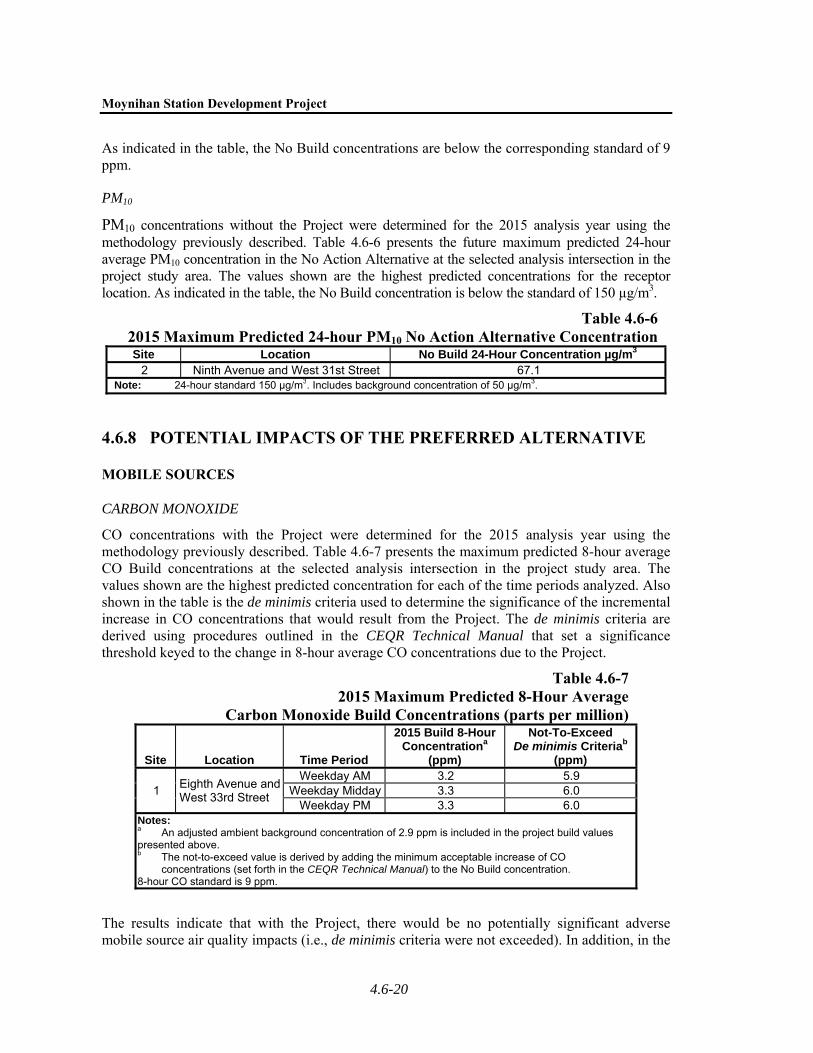
PM10 concentrations without the Project were determined for the 2015 analysis year using the methodology previously described. Table 4.6-6 presents the future maximum predicted 24-hour average PM10 concentration in the No Action Alternative at the selected analysis intersection in the project study area. The values shown are the highest predicted concentrations for the receptor location. As indicated in the table, the No Build concentration is below the standard of 150 µg/m3.
Table 4.6-62015 Maximum Predicted 24-hour PM10 No Action Alternative ConcentrationSite Location No Build 24-Hour Concentration µg/m3
2 Ninth Avenue and West 31st Street 67.1 Note: 24-hour standard 150 µg/m3. Includes background concentration of 50 µg/m3.
4.6.8 POTENTIAL IMPACTS OF THE PREFERRED ALTERNATIVE
MOBILE SOURCES
CARBON MONOXIDE
CO concentrations with the Project were determined for the 2015 analysis year using the methodology previously described. Table 4.6-7 presents the maximum predicted 8-hour average CO Build concentrations at the selected analysis intersection in the project study area. The values shown are the highest predicted concentration for each of the time periods analyzed. Also shown in the table is the de minimis criteria used to determine the significance of the incremental increase in CO concentrations that would result from the Project. The de minimis criteria are derived using procedures outlined in the CEQR Technical Manual that set a significance threshold keyed to the change in 8-hour average CO concentrations due to the Project.
Table 4.6-7 2015 Maximum Predicted 8-Hour Average
Carbon Monoxide Build Concentrations (parts per million)
Site Location Time Period
2015 Build 8-Hour Concentrationa
(ppm)
Not-To-Exceed De minimis Criteriab
(ppm)
1 Eighth Avenue and West 33rd Street
Weekday AM 3.2 5.9 Weekday Midday 3.3 6.0
Weekday PM 3.3 6.0 Notes: a An adjusted ambient background concentration of 2.9 ppm is included in the project build values presented above. b The not-to-exceed value is derived by adding the minimum acceptable increase of CO
concentrations (set forth in the CEQR Technical Manual) to the No Build concentration. 8-hour CO standard is 9 ppm.
The results indicate that with the Project, there would be no potentially significant adverse mobile source air quality impacts (i.e., de minimis criteria were not exceeded). In addition, in the

Chapter 4.6: Air Quality
4.6-21
Future Without and the Future With the Proposed Project, maximum predicted ambient CO con-centrations at the intersection analyzed would be less than the corresponding ambient air quality standards.
PM10
PM10 concentrations with the proposed project were determined for the 2015 analysis year using the methodology previously described. Table 4.6-8 presents the future maximum predicted 24-hour average and annual average PM10 concentrations at the selected analysis intersection in the project study area. The values shown are the highest predicted concentrations for the receptor locations for each of the time periods analyzed. As indicated in the table, the Build concentrations are below the standard of 150 µg/m3.
Table 4.6-82015 Maximum Predicted
PM10 Build Concentrations (parts per million)Site Location 24-Hour Concentration µg/m3
2 Ninth Avenue and West 31st Street 67.2 Note: 24-hour standard 150 µg/m3. Includes background concentration of 50 µg/m3.
PM2.5
PM2.5 concentrations with and without the Project were determined for the 2015 analysis year using the methodology previously described. The results of this analysis are presented in Table 4.6-9 for the 24-hour and annual time periods. As indicated in the table, the predicted incremental increases of PM2.5 concentrations for both time periods are under the corresponding interim guidance levels. Therefore, the Project is not considered to have significant PM2.5 impacts, and no additional modeling is required for this pollutant.
Table 4.6-92015 Maximum Predicted Incremental 24-Hour and
Annual Average PM2.5 Concentrations (μg/m3)Receptor
Site Location Neighborhood Scale
Annual Increment Local 24-Hour
Increment 2 Ninth Avenue and West 31st Street 0.007 0.02
Notes: PM2.5 Interim Guidance Criteria—
Annual Average (Neighborhood Scale): 0.1 µg/m3 24-Hour (Localized): 2 to 5.0 µg/m3
STATIONARY SOURCES
HVAC SOURCES
The primary stationary source of air pollutants associated with the Project would be emissions from the combustion of natural gas at the Development Transfer Site by boilers providing heat and hot water. The primary pollutant of concern when burning natural gas is NO2. Emissions of other pollutants, including PM2.5, are very minor and based on the height of the proposed
Moynihan Station Development Project
4.6-22
building and distance to sensitive uses (see below), the potential for impacts is not considered to be significant enough to warrant an analysis.
The screening methodology in the CEQR Technical Manual was utilized for the Development Transfer Site based on project development area. The total square footage used in the analysis was 1.1 million square feet. The stack was assumed to be placed at a height of approximately 700 feet—three feet above the top of the tallest tier of the building (as per the CEQR Technical Manual).
There were no residential buildings of a similar or greater height within a distance of 400 feet—the maximum distance in the CEQR Technical Manual. Therefore, this distance was used in the analysis. Burning natural gas would not result in any significant air quality impacts because the Project is below the maximum development size shown in Figure 3Q-10 of the CEQR Technical Manual. Therefore, the Project would not result in any significant adverse stationary source air quality impacts from fossil fuel-fired HVAC systems.
INDUSTRIAL SOURCES
A detailed analysis of industrial source impacts was undertaken to analyze potential impacts on the hotel and residential uses, following the methodology previously described. A field survey was conducted and land use information was reviewed to identify manufacturing and industrial uses within 400 feet of the Farley Complex and Development Transfer Site. Addresses with potential industrial emissions were identified based on existing on-site businesses, as well as the presence of visible venting apparatus.
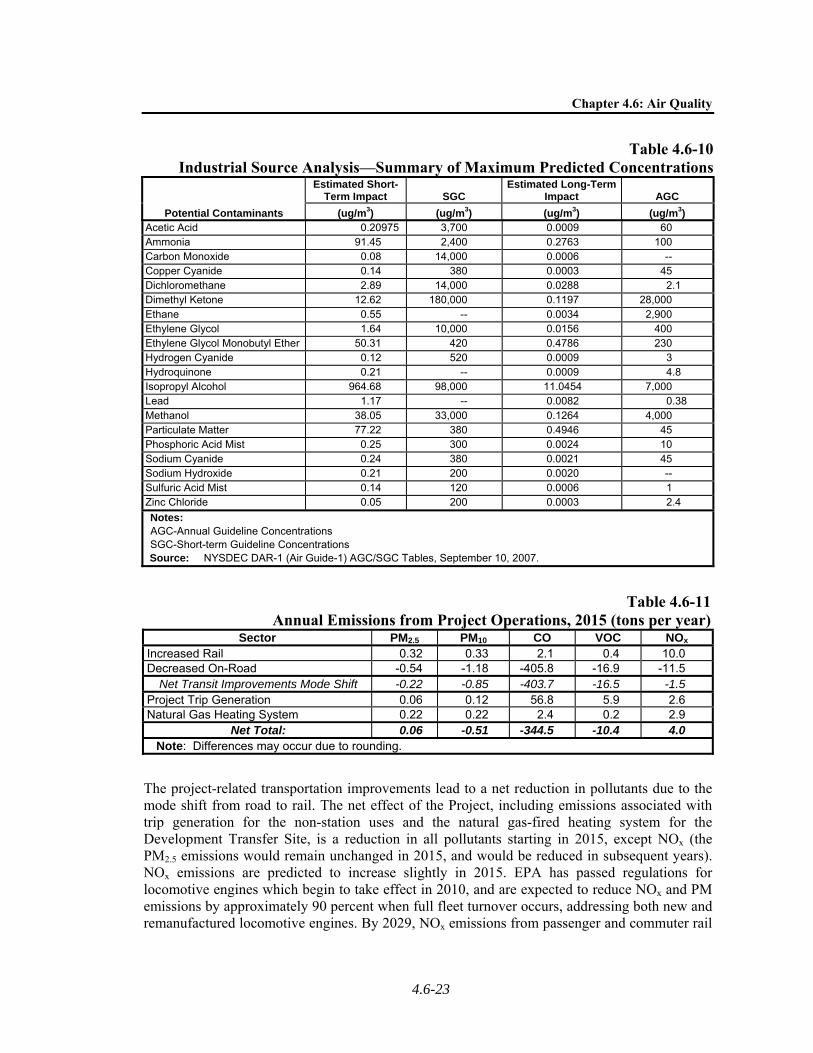
At the nine addresses identified to have the potential for pollutant emissions, a total of twenty-four businesses are on file with BEC and are determined to have potential air pollutant emissions. Table 4.6-10 shows the air contaminants, estimated emissions, calculated concentrations, and the respective, recommended short-term (a 1-hour period, unless otherwise noted) and annual guideline concentrations. The concentrations shown represent worst-case predicted impacts on the Project’s sensitive uses.
The detailed analyses used to estimate maximum potential impacts from these businesses showed that their operations would not result in any predicted exceedances of the DEC SGC or AGC. Therefore, based on data available for the surrounding industrial uses, the Project would not experience significant air quality impacts from these facilities.
GENERAL CONFORMITY
The operation of the proposed Moynihan Station would reduce on-road emissions and increase rail emissions, resulting in a net reduction in emissions for the region. When including the emissions from the natural gas heating system for the Development Transfer Site, a minor increase in PM2.5 and NOx emissions is predicted. However, even those minor increases would not exceed the de minimis thresholds for general conformity. The total estimated annual operational emissions are presented in Table 4.6-11. SO2 emissions would not be affected since all of the relevant fuel sources include negligible amounts of sulfur—natural gas and gasoline do not include significant amounts of sulfur, and all nonroad diesel vehicles will utilize ultra low sulfur diesel (which contains a maximum of 15 ppm sulfur) by 2012. Note that the Project is included in the New York Metropolitan Transportation Council (NYMTC) 2008-2012 Transportation Improvement Plan (TIP).
Chapter 4.6: Air Quality
4.6-23
Table 4.6-10Industrial Source Analysis—Summary of Maximum Predicted Concentrations
Potential Contaminants
Estimated Short-Term Impact SGC
Estimated Long-Term Impact AGC
(ug/m3) (ug/m3) (ug/m3) (ug/m3) Acetic Acid 0.20975 3,700 0.0009 60 Ammonia 91.45 2,400 0.2763 100 Carbon Monoxide 0.08 14,000 0.0006 -- Copper Cyanide 0.14 380 0.0003 45 Dichloromethane 2.89 14,000 0.0288 2.1 Dimethyl Ketone 12.62 180,000 0.1197 28,000 Ethane 0.55 -- 0.0034 2,900 Ethylene Glycol 1.64 10,000 0.0156 400 Ethylene Glycol Monobutyl Ether 50.31 420 0.4786 230 Hydrogen Cyanide 0.12 520 0.0009 3 Hydroquinone 0.21 -- 0.0009 4.8 Isopropyl Alcohol 964.68 98,000 11.0454 7,000 Lead 1.17 -- 0.0082 0.38 Methanol 38.05 33,000 0.1264 4,000 Particulate Matter 77.22 380 0.4946 45 Phosphoric Acid Mist 0.25 300 0.0024 10 Sodium Cyanide 0.24 380 0.0021 45 Sodium Hydroxide 0.21 200 0.0020 -- Sulfuric Acid Mist 0.14 120 0.0006 1 Zinc Chloride 0.05 200 0.0003 2.4
Notes: AGC-Annual Guideline Concentrations SGC-Short-term Guideline Concentrations Source: NYSDEC DAR-1 (Air Guide-1) AGC/SGC Tables, September 10, 2007.
Table 4.6-11Annual Emissions from Project Operations, 2015 (tons per year)
Sector PM2.5 PM10 CO VOC NOx
Increased Rail 0.32 0.33 2.1 0.4 10.0 Decreased On-Road -0.54 -1.18 -405.8 -16.9 -11.5
Net Transit Improvements Mode Shift -0.22 -0.85 -403.7 -16.5 -1.5 Project Trip Generation 0.06 0.12 56.8 5.9 2.6 Natural Gas Heating System 0.22 0.22 2.4 0.2 2.9
Net Total: 0.06 -0.51 -344.5 -10.4 4.0 Note: Differences may occur due to rounding.
The project-related transportation improvements lead to a net reduction in pollutants due to the mode shift from road to rail. The net effect of the Project, including emissions associated with trip generation for the non-station uses and the natural gas-fired heating system for the Development Transfer Site, is a reduction in all pollutants starting in 2015, except NOx (the PM2.5 emissions would remain unchanged in 2015, and would be reduced in subsequent years). NOx emissions are predicted to increase slightly in 2015. EPA has passed regulations for locomotive engines which begin to take effect in 2010, and are expected to reduce NOx and PM emissions by approximately 90 percent when full fleet turnover occurs, addressing both new and remanufactured locomotive engines. By 2029, NOx emissions from passenger and commuter rail
Moynihan Station Development Project
4.6-24
are expected to be 55 percent lower than in 2015,1 resulting in a net reduction in annual NOx emissions from the Project, which would grow over the years as locomotive emission reductions continue. Larger net reduction in PM10, PM2.5, and VOC emissions will occur in future years as well. This would result in a net reduction of those pollutants due to the increased ridership in future years, resulting in an overall net benefit to regional air quality.
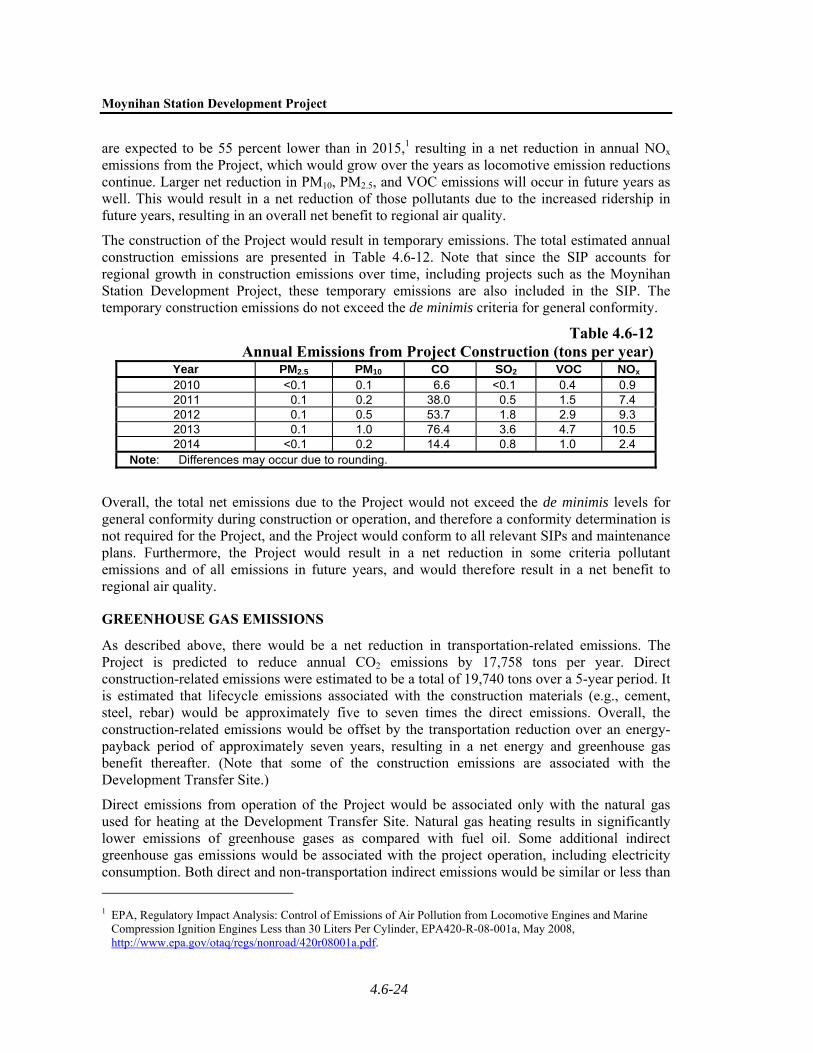
The construction of the Project would result in temporary emissions. The total estimated annual construction emissions are presented in Table 4.6-12. Note that since the SIP accounts for regional growth in construction emissions over time, including projects such as the Moynihan Station Development Project, these temporary emissions are also included in the SIP. The temporary construction emissions do not exceed the de minimis criteria for general conformity.
Table 4.6-12 Annual Emissions from Project Construction (tons per year)
Year PM2.5 PM10 CO SO2 VOC NOx 2010 <0.1 0.1 6.6 <0.1 0.4 0.9 2011 0.1 0.2 38.0 0.5 1.5 7.4 2012 0.1 0.5 53.7 1.8 2.9 9.3 2013 0.1 1.0 76.4 3.6 4.7 10.5 2014 <0.1 0.2 14.4 0.8 1.0 2.4
Note: Differences may occur due to rounding.
Overall, the total net emissions due to the Project would not exceed the de minimis levels for general conformity during construction or operation, and therefore a conformity determination is not required for the Project, and the Project would conform to all relevant SIPs and maintenance plans. Furthermore, the Project would result in a net reduction in some criteria pollutant emissions and of all emissions in future years, and would therefore result in a net benefit to regional air quality.
GREENHOUSE GAS EMISSIONS
As described above, there would be a net reduction in transportation-related emissions. The Project is predicted to reduce annual CO2 emissions by 17,758 tons per year. Direct construction-related emissions were estimated to be a total of 19,740 tons over a 5-year period. It is estimated that lifecycle emissions associated with the construction materials (e.g., cement, steel, rebar) would be approximately five to seven times the direct emissions. Overall, the construction-related emissions would be offset by the transportation reduction over an energy-payback period of approximately seven years, resulting in a net energy and greenhouse gas benefit thereafter. (Note that some of the construction emissions are associated with the Development Transfer Site.)
Direct emissions from operation of the Project would be associated only with the natural gas used for heating at the Development Transfer Site. Natural gas heating results in significantly lower emissions of greenhouse gases as compared with fuel oil. Some additional indirect greenhouse gas emissions would be associated with the project operation, including electricity consumption. Both direct and non-transportation indirect emissions would be similar or less than 1 EPA, Regulatory Impact Analysis: Control of Emissions of Air Pollution from Locomotive Engines and Marine
Compression Ignition Engines Less than 30 Liters Per Cylinder, EPA420-R-08-001a, May 2008, http://www.epa.gov/otaq/regs/nonroad/420r08001a.pdf.

Chapter 4.6: Air Quality
4.6-25
those associated with similar uses in less dense areas, and the transit-oriented, mixed-use, and dense nature of the Development Transfer Site and the area in which it is located would result in less on-road emissions than similar uses elsewhere.
Since reducing greenhouse gas emissions and energy consumption is both a New York State and New York City goal under the State Energy Plan, PlaNYC, and other policies and initiatives, the Project would be consistent with those policies.