chapter 4.8 greenhouse gas emissions and climate … 4.8 greenhouse gas emissions and... · and...
TRANSCRIPT
Fish Habitat Flows Draft EIR and Water Rights Project 4.8-1
.
CHAPTER 4.8 Greenhouse Gas Emissions and Climate Change 4.8.1 Introduction This section presents a brief summary of the current state of climate change science and greenhouse gas (GHG) emissions sources in California; a summary of applicable regulations; sources of potential project-generated GHG emissions and discussion about their potential contribution to global climate change; and analysis of the project’s resiliency to climate change-related risks. Section 4.8.2, “Environmental Setting,” describes the regional and project area environmental setting. Section 4.8.3, “Regulatory Framework” details the federal, state, and local laws related to GHG emissions and climate change. Potential climate change-related impacts resulting from the proposed project are analyzed in Section 4.8.4, “Impacts and Mitigation Measures,” in accordance with the California Environmental Quality Act (CEQA) significance criteria (CEQA Guidelines, Appendix G).
4.8.2 Environmental Setting
The Physical Scientific Basis of Greenhouse Gases and Climate Change The following discussion provides background information about how the carbon cycle functions when considering GHGs and climate change. The discussion focuses on the carbon cycle associated with carbon dioxide (CO2), methane (CH4), and nitrous oxide (N2O), which are GHGs associated with reservoir systems.
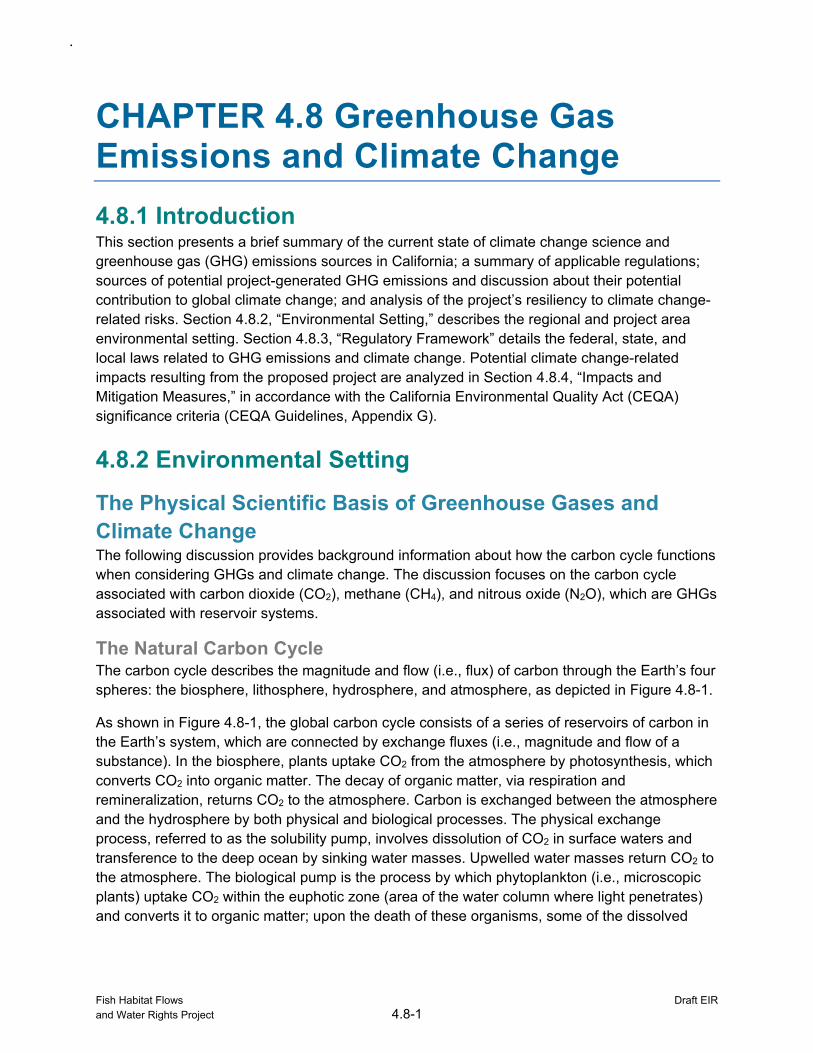
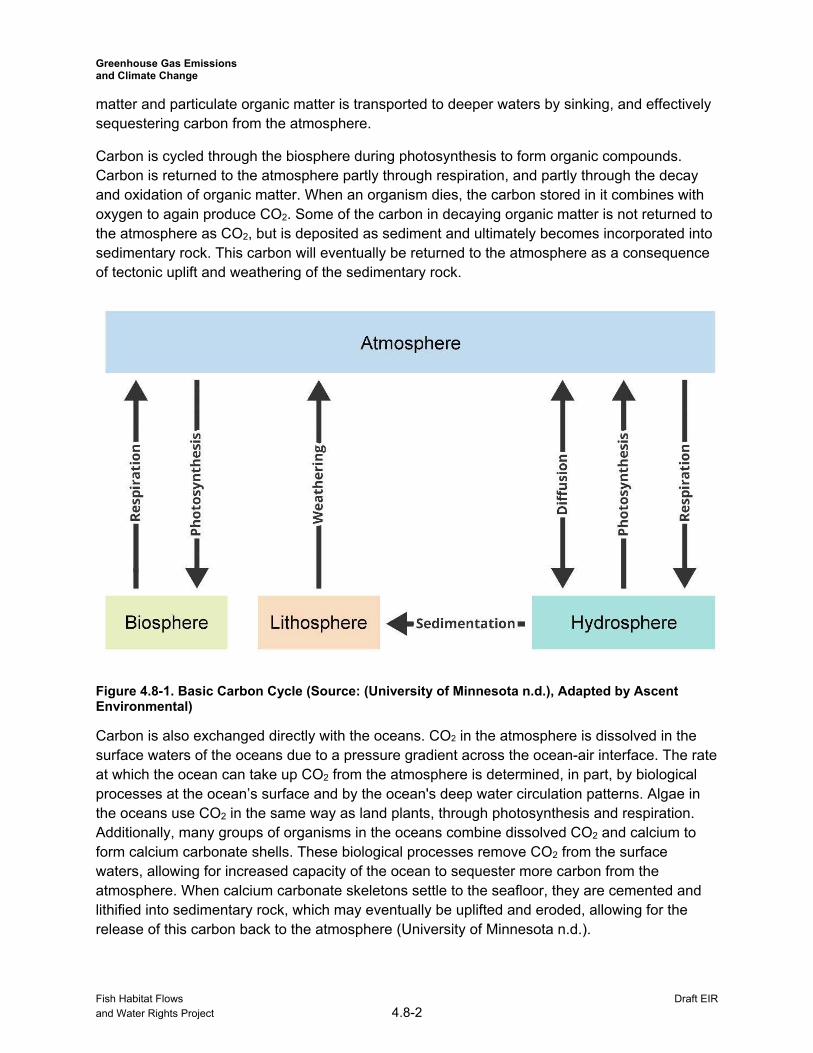
The Natural Carbon Cycle The carbon cycle describes the magnitude and flow (i.e., flux) of carbon through the Earth’s four spheres: the biosphere, lithosphere, hydrosphere, and atmosphere, as depicted in Figure 4.8-1.
As shown in Figure 4.8-1, the global carbon cycle consists of a series of reservoirs of carbon in the Earth’s system, which are connected by exchange fluxes (i.e., magnitude and flow of a substance). In the biosphere, plants uptake CO2 from the atmosphere by photosynthesis, which converts CO2 into organic matter. The decay of organic matter, via respiration and remineralization, returns CO2 to the atmosphere. Carbon is exchanged between the atmosphere and the hydrosphere by both physical and biological processes. The physical exchange process, referred to as the solubility pump, involves dissolution of CO2 in surface waters and transference to the deep ocean by sinking water masses. Upwelled water masses return CO2 to the atmosphere. The biological pump is the process by which phytoplankton (i.e., microscopic plants) uptake CO2 within the euphotic zone (area of the water column where light penetrates) and converts it to organic matter; upon the death of these organisms, some of the dissolved
Greenhouse Gas Emissions and Climate Change
matter and particulate organic matter is transported to deeper waters by sinking, and effectively sequestering carbon from the atmosphere.
Carbon is cycled through the biosphere during photosynthesis to form organic compounds. Carbon is returned to the atmosphere partly through respiration, and partly through the decay and oxidation of organic matter. When an organism dies, the carbon stored in it combines with oxygen to again produce CO2. Some of the carbon in decaying organic matter is not returned to the atmosphere as CO2, but is deposited as sediment and ultimately becomes incorporated into sedimentary rock. This carbon will eventually be returned to the atmosphere as a consequence of tectonic uplift and weathering of the sedimentary rock.
Figure 4.8-1. Basic Carbon Cycle (Source: (University of Minnesota n.d.), Adapted by Ascent Environmental)
Carbon is also exchanged directly with the oceans. CO2 in the atmosphere is dissolved in the surface waters of the oceans due to a pressure gradient across the ocean-air interface. The rate at which the ocean can take up CO2 from the atmosphere is determined, in part, by biological processes at the ocean’s surface and by the ocean's deep water circulation patterns. Algae in the oceans use CO2 in the same way as land plants, through photosynthesis and respiration. Additionally, many groups of organisms in the oceans combine dissolved CO2 and calcium to form calcium carbonate shells. These biological processes remove CO2 from the surface waters, allowing for increased capacity of the ocean to sequester more carbon from the atmosphere. When calcium carbonate skeletons settle to the seafloor, they are cemented and lithified into sedimentary rock, which may eventually be uplifted and eroded, allowing for the release of this carbon back to the atmosphere (University of Minnesota n.d.).
Fish Habitat Flows Draft EIR and Water Rights Project 4.8-2
Greenhouse Gas Emissions and Climate Change
Human-induced Perturbation in the Carbon Cycle Prior to 1750, the atmospheric concentration of CO2 had been relatively stable between 260 and 280 parts per million (ppm) for 10,000 years. Perturbations of the carbon cycle from human activities were not substantial relative to natural variability. Since 1750, the concentration of CO2
in the atmosphere has risen, at an increasing rate, from around 280 ppm to nearly 391 ppm in 2011. The increase in atmospheric CO2 concentration results from human activities: primarily burning of fossil fuels and deforestation, but also cement production and other changes in land use management such as biomass burning, crop production, and conversion of grasslands to croplands. While human activities contribute to climate change in many direct and indirect ways, CO2 emissions from human activities are considered the single largest anthropogenic factor contributing to climate change. Atmospheric CH4 concentrations have similarly experienced a rapid rise from about 700 parts per billion (ppb) in 1750 to about 1,803 ppb in 2011: sources include fossil fuels, landfills and waste treatment, peatlands/wetlands, ruminant animals and rice paddies (IPCC 2013).
Reactive Nitrogen Compounds and the Nitrogen Cycle Natural processes that cause the conversion of nitrogen gas (N2) to reactive nitrogen (Nr) primarily result from lightning and biological nitrogen fixation (a series of reactions that are mediated by microbes). Naturally occurring denitrification processes, typically performed by microbes, convert Nr back to N2. Prior to the Industrial Era, this cycle of nitrification-denitrification is considered to be in equilibrium; however, human activities have resulted in increased production of Nr, primarily through the production of industrial fertilizers and feedstock (producing ammonia), cultivation of legumes (increasing biological nitrogen fixation), and combustion of fossil fuels (resulting in nitrogen oxide [NOx] emissions). Levels of nitrous oxide (N2O) have increased to 324 ppb in 2011, from approximately 270 ppb in 1750 (IPCC 2013).
Increased levels of Nr in the environment are of particular concern due to the nitrogen cascade. The nitrogen cascade is the sequential transfer of the same Nr atom through the atmosphere, terrestrial ecosystems, freshwater ecosystems, and marine ecosystem. For instance, Nr contributes to the acidification of soils and freshwaters; and increases the productivity in forests, grasslands, open and coastal waters and open ocean, which can lead to eutrophication (i.e., dense plant life and death of animal life from lack of oxygen in waterways) and reduction in biodiversity in terrestrial and aquatic ecosystems. In addition, Nr-induced increases in NOX, aerosols, tropospheric ozone, and nitrates in drinking water have negative impacts on human health (IPCC 2013).
Drivers of Climate Change Solar radiation enters the Earth’s atmosphere from space. A portion of the radiation is absorbed by the Earth’s surface and a smaller portion of this radiation is reflected back toward space. The absorbed radiation is then emitted from the Earth as low-frequency infrared radiation within the Earth’s atmosphere. Most solar radiation passes through GHGs; however, infrared radiation is absorbed by these gases. As a result, radiation that otherwise would have returned back into space is instead “trapped,” resulting in a warming of the atmosphere. This phenomenon, known
Fish Habitat Flows Draft EIR and Water Rights Project 4.8-3
Greenhouse Gas Emissions and Climate Change
as the greenhouse effect, is responsible for maintaining a habitable climate on Earth. Without the greenhouse effect, Earth would not be able to support life as we know it.
As discussed above, human activities have resulted in changes to the atmospheric composition of GHGs, including CO2, CH4, and N2O. These GHGs, along with others such as hydrofluorocarbons, perfluorocarbons, and sulfur hexafluoride, play a critical role in determining the Earth’s surface temperature. Human-caused perturbations in the carbon cycle, related to these GHGs, are responsible for intensifying the greenhouse effect and leading to a trend of unnatural warming of the Earth’s climate, known as global climate change or global warming. It is “extremely likely” that more than half of the observed increase in global average surface temperature from 1951 to 2010 was caused by the anthropogenic increase in GHG concentrations and other anthropogenic factors together (IPCC 2014, 3,5).
Climate change is a global problem. GHGs are global pollutants, unlike criteria air pollutants and toxic air contaminants, which are pollutants of regional and local concern. Whereas pollutants with localized air quality effects have relatively short atmospheric lifetimes (e.g., one day for ground-level ozone), GHGs have long atmospheric lifetimes (one to several thousand years). GHGs persist in the atmosphere for long enough time periods to be dispersed around the globe. Although the exact lifetime of any particular GHG molecule is dependent on multiple variables and cannot be pinpointed, it is understood that more CO2 is emitted into the atmosphere than is sequestered by ocean uptake, vegetation, and other forms of sequestration. Of the total annual human-generated CO2 emissions, approximately 55 percent is sequestered through ocean and land uptakes every year, averaged over the last 50 years, whereas the remaining 45 percent remains stored in the atmosphere (IPCC 2013, 467).
The quantity of GHGs necessary to ultimately result in climate change is not precisely known; suffice it to say, the quantity is enormous, and no single project alone would measurably contribute to a noticeable incremental change in the global average temperature, or to global, local, or microclimates. From the standpoint of CEQA, GHG impacts to global climate change are inherently cumulative.
GHGs Emissions Associated with Impounded Lakes and Reservoirs
Lake Stratification and Anoxic Conditions The solubility of gases in water is inversely correlated with temperature and positively correlated with pressure. Lake stratification, described in more detail below, can result in lower temperatures in deeper portions of the lake. Increased stratification generally results in gases, including GHGs, to be dissolved in greater concentrations in deeper areas of water bodies. Releases of water from reservoirs, particularly from colder, deeper portions of the water body, lends to a sudden increase in temperature and decrease in pressure thereby decreasing the solubility of dissolved gases. Generally, this decrease in water solubility results in the release of GHGs to the atmosphere (Grand Valley State University 2016).
Fish Habitat Flows Draft EIR and Water Rights Project 4.8-4
Greenhouse Gas Emissions and Climate Change
Changes in the temperature profile with depth within a lake system is referred to as thermal stratification. Typically, this profile changes from one season to the next and creates a cyclical pattern that is repeated from year to year. During spring, lake water is often the same or very similar temperature from the surface to the bottom. Wind allows circulation and mixing of the lake water. Surface water can be pushed to the lake bottom and deep water can rise to the surface. This circulation pattern allows relatively large amounts of oxygen to reach the bottom of the lake. Without this circulation pattern, oxygen would have to reach the bottom by the relatively slow process of diffusion (Grand Valley State University 2016).
As air temperatures rise in late spring, heat from the sun begins to warm the lake. As the amount of solar radiation absorbed decreases with depth, the lake heats from the surface down. The warm water is less dense than the colder water below resulting in a layer of warm water that floats over the cold water. The layer of warm water at the surface of the lake is called the epilimnion. The cold layer below the epilimnion is called the hypolimnion. These two layers are separated by a layer of water which rapidly changes temperature with depth. This is called the thermocline. The distinct layers of water, each with a different temperature or range of temperatures, are an example of thermal stratification within a lake system (Grand Valley State University 2016).
During the summer, the epilimnion (warm water layer) reaches a maximum depth and stratification is generally maintained for the remainder of the summer. The warm water, abundant sunlight, and nutrients brought up from the lake bottom during spring provide an ideal environment for algae growth within the epilimnion. Stratification during the summer acts as a deterrent to complete lake mixing. Wind circulates the surface water, but the warm water of the epilimnion is unable to drive through the cold, dense water of the hypolimnion. As a result, water only mixes in the epilimnion (Grand Valley State University 2016).
Without mixing that results in dissolved oxygen reaching the deeper waters, the lake bottom, lacking enough light for photosynthesis to occur, tends to have a very limited supply of oxygen during the summer. Respiration by animals and bacteria can deplete the dissolved oxygen at the bottom of the lake. Dead algae sink to the lake bottom and are decomposed by bacteria. This accelerates the depletion of dissolved oxygen in the hypolimnion as aerobic bacteria use oxygen to decompose the wealth of organic material sinking down from the epilimnion. During summer stagnation the lake bottom can become anoxic (i.e., without oxygen) and anaerobic bacteria begin to decompose organic material. If dead algae accumulate at a faster rate than bacteria decompose the organic matter, sediment deposited in the lake will be rich in organics (Grand Valley State University 2016).
As autumn approaches and temperatures decrease, the epilimnion begins to decrease in depth. Eventually the epilimnion gets so shallow that it can no longer be maintained as a separate layer and the lake loses its stratification. Thus, as in the spring, the lake water in the autumn has generally uniform temperatures, and wind can once again thoroughly mix the lake water. In addition, surface water, which is in direct contact with the cold air, gets cooled faster than the water below. This cold, dense water sinks and further helps to mix the lake, and once
Fish Habitat Flows Draft EIR and Water Rights Project 4.8-5
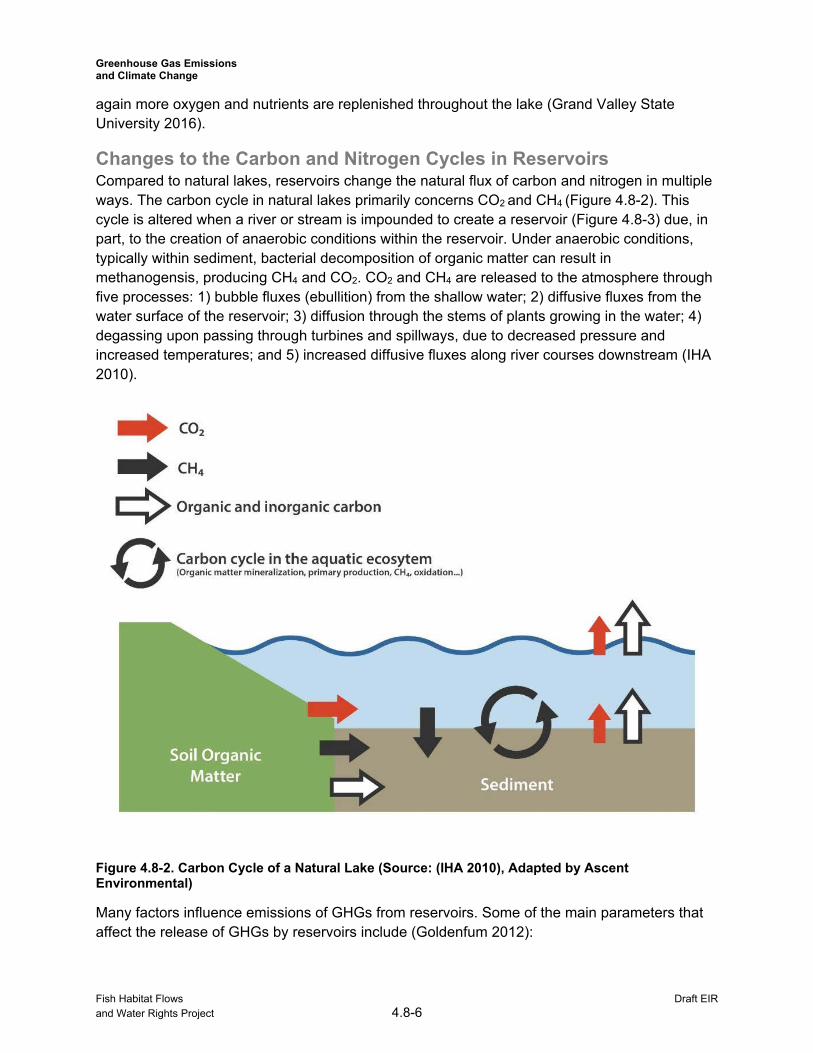
Figure 4.8-2. Carbon Cycle of a Natural Lake (Source: (IHA 2010), Adapted by Ascent Environmental)
Many factors influence emissions of GHGs from reservoirs. Some of the main parameters that affect the release of GHGs by reservoirs include (Goldenfum 2012):
Greenhouse Gas Emissions and Climate Change
again more oxygen and nutrients are replenished throughout the lake (Grand Valley State University 2016).
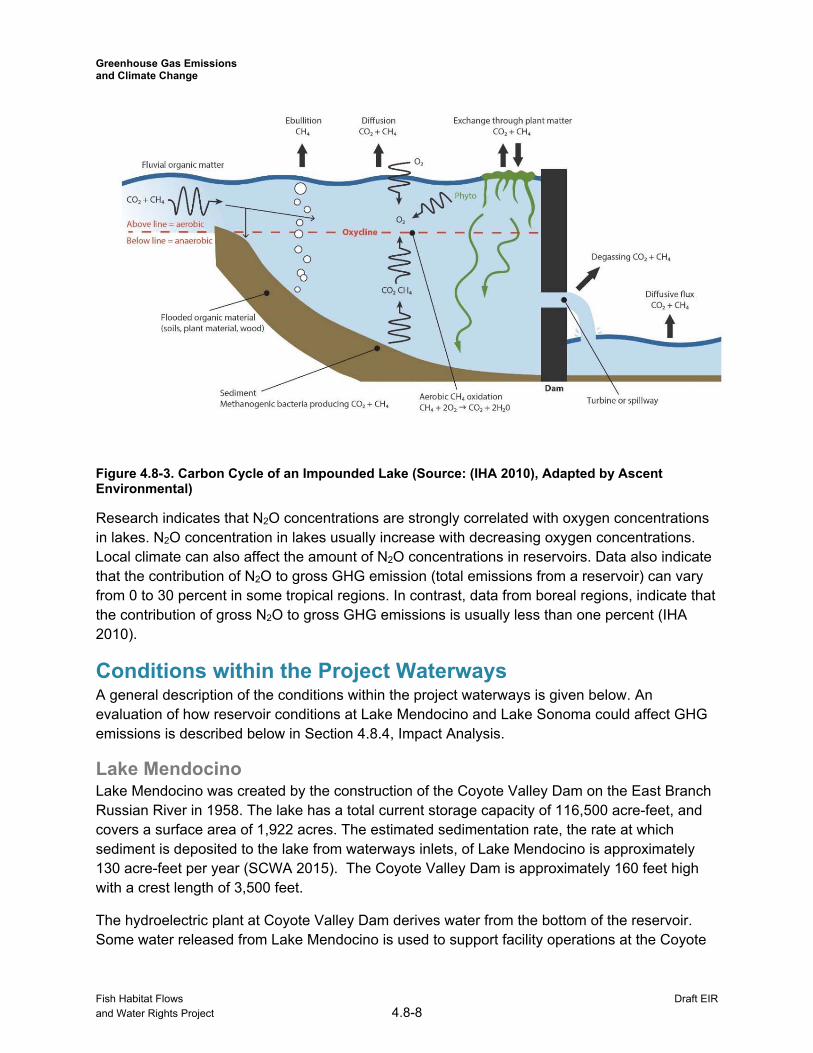
Changes to the Carbon and Nitrogen Cycles in Reservoirs Compared to natural lakes, reservoirs change the natural flux of carbon and nitrogen in multiple ways. The carbon cycle in natural lakes primarily concerns CO2 and CH4 (Figure 4.8-2). This cycle is altered when a river or stream is impounded to create a reservoir (Figure 4.8-3) due, in part, to the creation of anaerobic conditions within the reservoir. Under anaerobic conditions, typically within sediment, bacterial decomposition of organic matter can result in methanogensis, producing CH4 and CO2. CO2 and CH4 are released to the atmosphere through five processes: 1) bubble fluxes (ebullition) from the shallow water; 2) diffusive fluxes from the water surface of the reservoir; 3) diffusion through the stems of plants growing in the water; 4) degassing upon passing through turbines and spillways, due to decreased pressure and increased temperatures; and 5) increased diffusive fluxes along river courses downstream (IHA 2010).
Fish Habitat Flows Draft EIR and Water Rights Project 4.8-6
Greenhouse Gas Emissions and Climate Change
Carbon and nutrient loading in the reservoir: Loading of carbon and nutrients affects the amount of carbon stored in the sediments and the amount of dissolved oxygen.
Rainfall: Rainfall can affect shore erosion, water levels in lakes, and runoff rates of waterways.
Soil type and nearby land use: Some soil types are more likely to create anaerobic conditions; nearby land uses can affect nutrient levels of runoff into waterways.
Biomass of plants, algae, bacteria, and animals in the reservoir and in drawdown zone: Decomposition of biomass, under anaerobic condition converts CO2 into CH4.
Water temperature gradient: Increased water temperatures reduce gas solubility. Water residence time: The amount of time water molecules exist in lakes can affect the
rate at which the carbon cycle functions. Stratification of the reservoir body: Water stratification occurs when water masses
with different properties (e.g., water temperature or oxygen content) form layers that act as barriers to water mixing.
Reservoir age: The length of time the area has been used as a reservoir. New, younger reservoirs have the potential to generate more GHGs because of the amount of carbon-based material inundated with water during the initial inundation.
Drawdown zone exposure area: The area where water level changes as a result of increased or decreased inflow and outflow. Inundated vegetation may result in increased levels of dissolved organic matter. Generation of N2O is positively correlated with the extent of the drawdown zone
Wind speed and direction: Wind speed and direction can influence mixing of reservoir waters
Presence of low-level outlets: Releases of water from low-level outlets can cause immediate pressure reduction allowing for gas to become less soluble in water.
Level of turbulence downstream of the dam associated with ancillary structures: The presence of spillways, turbines, and weirs can affect how much gas is released from water due to changes in temperature and pressure.
Water depth: Water depth can influence the presence of anoxic conditions, temperature, and mixing of lake waters.
Research focusing on fluxes of CO2 and CH4 in reservoirs tends to address climate type: arctic, boreal, temperate, and tropic. It is important to note that published results are limited, and represent approximately 120 of an estimated 33,500 impounded lakes around the world (Goldenfum 2012). However, while research is ongoing, available findings indicate that:
Reservoirs can act as both sinks or sources of carbon, at all latitudes (sinks are more typical and/or of greater magnitude in tropical reservoirs than for reservoirs in temperate or cold areas);
Maximal gross emissions of tropical reservoirs are higher than the maximal gross emissions from temperate- and cold-climate reservoirs, and minimal gross emissions of tropical reservoirs are the same order of magnitude as minimal gross emissions in cold-climate reservoirs of similar size;
Large variability exists in the data, although the greatest variation in CO2 and CH4 emissions from freshwater reservoirs has been recorded in tropical areas (Goldenfum 2012).
Fish Habitat Flows Draft EIR and Water Rights Project 4.8-7
Greenhouse Gas Emissions and Climate Change
Figure 4.8-3. Carbon Cycle of an Impounded Lake (Source: (IHA 2010), Adapted by Ascent Environmental)
Research indicates that N2O concentrations are strongly correlated with oxygen concentrations in lakes. N2O concentration in lakes usually increase with decreasing oxygen concentrations. Local climate can also affect the amount of N2O concentrations in reservoirs. Data also indicate that the contribution of N2O to gross GHG emission (total emissions from a reservoir) can vary from 0 to 30 percent in some tropical regions. In contrast, data from boreal regions, indicate that the contribution of gross N2O to gross GHG emissions is usually less than one percent (IHA 2010).
Conditions within the Project Waterways A general description of the conditions within the project waterways is given below. An evaluation of how reservoir conditions at Lake Mendocino and Lake Sonoma could affect GHG emissions is described below in Section 4.8.4, Impact Analysis.
Lake Mendocino Lake Mendocino was created by the construction of the Coyote Valley Dam on the East Branch Russian River in 1958. The lake has a total current storage capacity of 116,500 acre-feet, and covers a surface area of 1,922 acres. The estimated sedimentation rate, the rate at which sediment is deposited to the lake from waterways inlets, of Lake Mendocino is approximately 130 acre-feet per year (SCWA 2015). The Coyote Valley Dam is approximately 160 feet high with a crest length of 3,500 feet.
The hydroelectric plant at Coyote Valley Dam derives water from the bottom of the reservoir. Some water released from Lake Mendocino is used to support facility operations at the Coyote
Fish Habitat Flows Draft EIR and Water Rights Project 4.8-8
Greenhouse Gas Emissions and Climate Change
Valley Dam Egg Collection Facility. Water that is routed through the Egg Collection Facility and hydroelectric facility is diverted back to the Russian River.
Lake Sonoma The construction of Warm Springs Dam in 1982 created Lake Sonoma, an impoundment that has a capacity of approximately 381,000 acre-feet (USACE 1973), covering a surface area of 3,600 acres (USACE 2008). At the time it was built, it was assumed that it would accumulative 26,000 acre-feet of sediment over its 100-year economic life. In addition, approximately 36,000 acre-feet of sediment is estimated to erode from the slopes surrounding the lake (USACE 1973). Warm Springs Dam is approximately 320 feet high with a crest length of 3,000 feet.
Water is released from Lake Sonoma downstream to Dry Creek via a multilevel outlet in the left abutment. Four intakes are located at elevations 221, 350, 390, and 430 feet above mean sea level (msl). Water from these intakes flows to the hydraulic turbine via a vertical wet well located in the control structure that draws water from the horizontal, low-flow tunnels. Water passing through the turbine flows into the flood control tunnel to a stilling basin located at the base of the dam. From the stilling basin, water flows through a channelized portion of Dry Creek, or is diverted for use in the Dry Creek Fish Hatchery (USACE 2008).
Hydroelectric Facilities Hydropower generation is an important consideration for a GHG analysis, because hydroelectricity is an extremely low carbon power source. A hydroelectric turbine at Warm Springs Dam has been producing electricity since 1989. This turbine has a generation capacity of 2.6 megawatts (MW). Since energy production is influenced by the flow of water through the dam, actual energy production is usually at about 1.3 MW. Actual annual energy production ranges from 9,000 MWh to 15,000 MWh (SCWA 2016).
The U.S. Army Corps of Engineers (USACE) constructed the Coyote Valley Dam in 1959. The Lake Mendocino Hydroelectric Plant began operating in 1986. The City of Ukiah Electric Utility Department operates and maintains the Lake Mendocino Hydroelectric Plant, which has a capacity of 3.5 MW and an annual production of up to 10,000 mega-watt hours per year (City of Ukiah 2014).
While the Northern California Power Association (NCPA) meets the majority of the City of Ukiah’s power needs, energy produced at Coyote Valley Dam directly supplements the City of Ukiah’s power supply. Approximately 62 percent of the City’s power supply was renewable and/or hydroelectric in origin in 2013 (City of Ukiah 2016) and 58 percent was renewable and/or hydroelectric in origin in 2014. This reduction in renewable energy from 2013 to 2014 was a result of the drought and associated reduction in hydroelectric power generation at Coyote Valley and other NCPA hydroelectric facilities (Grandi 2016). In 2014, the City used a total of 108,041 megawatt hours (MWh) of electricity (California Energy Commission 2016). The annual amount of electricity generated by the Coyote Valley Dam hydroelectric facility varies from approximately 3,000 MWh to 10,000 MWh depending on the water year (Grandi 2016), which supplies approximately 2.8 percent to 9.5 percent of the City’s electrical energy needs.
Fish Habitat Flows Draft EIR and Water Rights Project 4.8-9
Greenhouse Gas Emissions and Climate Change
Effects of Climate Change on the Environment in California The Intergovernmental Panel on Climate Change (IPCC) was established in 1988 by the World Meteorological Organization and the United Nations Environment Programme to provide the world with a scientific view on climate change and its potential effects. According to the IPCC global average temperature is projected to increase relative to the 1986-2005 period by 0.3 to 4.8°Celsius (0.5-8.6°Farenheit) by the end of the 21st century (2081-2100), depending on future GHG emission scenarios (IPCC 2014). According to the California Natural Resources Agency, temperatures in California are projected to increase 2.7°Farenheit above 2000 averages by 2050 and, depending on emission levels, 4.1 to 8.6°Farenheit by 2100 (CNRA 2012: 2).
Physical conditions beyond average temperatures could be indirectly affected by the accumulation of GHG emissions. For example, changes in weather patterns resulting from increases in global average temperature are projected to result in a decreased volume of precipitation falling as snow in California and an overall reduction in snowpack in the Sierra Nevada. Based upon historical data and modeling, the California Department of Water Resources projects that the Sierra snowpack will experience a 25 to 40 percent reduction from its historic average by 2050 (CDWR 2008). An increase in precipitation falling as rain rather than snow also could lead to increased potential for floods because water that would normally be held in the Sierra Nevada until spring could flow into the Central Valley concurrently with winter storm events (CNRA 2012). This scenario would place more pressure on California’s levee/flood control system.
Another outcome of global climate change is sea level rise. Sea level rose approximately seven inches during the last century and, assuming that sea-level changes along the California coast continue to track global trends, sea level along the state’s coastline in 2050 could be 10 to 18 inches higher than in 2000, and 31 to 55 inches higher by the end of this century (CNRA 2012).
As the existing climate throughout California changes over time, the ranges of various plant and wildlife species could shift or be reduced, depending on the favored temperature and moisture regimes of each species. In the worst cases, some species would become extinct or be extirpated from the state if suitable conditions are no longer available (CNRA 2012).
Changes in precipitation patterns and increased temperatures are projected to alter the distribution and character of natural vegetation and associated moisture content of plants and soils. An increase in frequency of extreme heat events and drought is also expected. These changes are projected to lead to increased frequency and intensity of wildfires (CNRA 2012).
Local Climate Change Projections The Sonoma County Water Agency (Water Agency) partnered with the United States Geological Survey (USGS) to study the influence of climate change on the hydrology of the Russian River and, in particular, to develop downscaled climate futures for the Russian River and Sonoma County. Results of this study predict warmer temperatures overall; longer, drier summers; increased variability (and reduced reliability) in rainfall, which could indicate either an increase or a decrease in total rainfall; increased soil moisture deficit; and reduced groundwater recharge (USGS 2012).
Fish Habitat Flows Draft EIR and Water Rights Project 4.8-10
Greenhouse Gas Emissions and Climate Change
A local consortium, the North Bay Climate Adaption Initiative (NBCAI), has used the results of this USGS study to develop projections for Sonoma County climate and hydrology given a set of four potential scenarios:
1. high GHG emissions with more precipitation; 2. high GHG emissions with less precipitation; 3. mitigated GHG emissions with more precipitation; and 4. mitigated GHG emissions with less precipitation.
According to Climate Ready Sonoma County: Climate Hazards and Vulnerabilities (Sonoma County 2015), in all four scenarios, Sonoma County will likely experience, among other hazards:
1. More extreme heat events Longer and more frequent droughts Greater frequency and intensity of wildfires Fewer winter nights that freeze
2. More variable rain Bigger, more extreme floods
3. Sea level rise Higher sea level and storm surge
Effects of Climate Change on Reservoirs As discussed above, research indicates that the potential for reservoirs to generate GHG emissions differs among artic, boreal, temperate, and tropic regions. In temperate regions such as Sonoma and Mendocino counties, the most substantial climate change effect on reservoirs would be related to decreased runoff. Decreased runoff to reservoirs could cause a reduction in lake size, reductions in large lakes as a result of fragmentation, and decreases in the extent of the inundated area. In addition, temperate zones are generally projected to experience more droughts and increased eutrophication of waterways, due to increased demand of biofuel and food crops for fertilizer and water. Decreases in lake sizes, and increases in production of primary productivity (e.g., algae) could contribute to increased deposits of organic carbon into lake beds. Further, increased algal populations, duration of stratification (i.e., periods in which lake waters experience relatively colder waters at deeper depths), and sedimentation would lend to greater prevalence of anaerobic conditions in lakes, thereby producing more CH4. However, lower lake levels and flow rates may result in decreased export of GHG emissions from outflow points (Tranvik, et al. 2009).
4.8.3 Regulatory Framework GHG emissions and responses to global climate change are regulated by a variety of federal, state, and local laws and policies. Key regulatory and conservation planning issues applicable to the project are discussed below.
Fish Habitat Flows Draft EIR and Water Rights Project 4.8-11
Greenhouse Gas Emissions and Climate Change
Federal
Supreme Court Ruling of Carbon Dioxide as a Pollutant The U.S. Environmental Protection Agency (EPA) is the federal agency responsible for implementing the federal Clean Air Act (CAA) and its amendments. The Supreme Court of the United States ruled on April 2, 2007 that CO2 is an air pollutant as defined under the CAA, and that EPA has the authority to regulate emissions of GHGs. The ruling in this case resulted in EPA taking steps to regulate GHG emissions and lent support for state and local agencies’ efforts to reduce GHG emissions.
State
Executive Order S-3-05 Executive Order S-3-05, signed by Governor Arnold Schwarzenegger in 2005, proclaims that California is vulnerable to the impacts of climate change. It declares that increased temperatures could reduce the Sierra Nevada snowpack, further exacerbate California’s air quality problems, and potentially cause a rise in sea levels. To combat those concerns, the Executive Order established total GHG emission targets for the state. Specifically, emissions are to be reduced to the 2000 level by 2010, the 1990 level by 2020, and to 80 percent below the 1990 level by 2050.
Assembly Bill 32 Climate Change Scoping Plan and Update In December 2008, the California Air Resources Board (ARB) adopted its Climate Change Scoping Plan, which contains the main strategies California will implement to achieve reduction of approximately 118 million metric tons (MMT) of CO2-equivalent (CO2e) emissions, or approximately 21.7 percent from the state’s projected 2020 emission level of 545 MMT of CO2e under a business-as-usual scenario (this is a reduction of 47 MMT CO2e, or almost 10 percent, from 2008 emissions). CO2e is a measurement used to account for the fact that different GHGs have different potential to retain infrared radiation in the atmosphere and contribute to the greenhouse effect. This potential, known as the global warming potential of a GHG, is dependent on the lifetime, or persistence, of the gas molecule in the atmosphere. ARB’s original 2020 projection was 596 MMT CO2e, but this revised 2020 projection takes into account the economic downturn that occurred in 2008 (ARB 2011). The Scoping Plan reapproved by ARB in August 2011 includes the Final Supplement to the Scoping Plan Functional Equivalent Document, which further examined various alternatives to Scoping Plan measures. The Scoping Plan also includes ARB-recommended GHG reductions for each emissions sector of the state’s GHG inventory. ARB estimates the largest reductions in GHG emissions to be achieved by 2020 will be by implementing the following measures and standards (ARB 2011):
improved emissions standards for light-duty vehicles (estimated reductions of 26.1 MMT CO2e);
the Low-Carbon Fuel Standard (15.0 MMT CO2e); energy efficiency measures in buildings and appliances (11.9 MMT CO2e);
Fish Habitat Flows Draft EIR and Water Rights Project 4.8-12
Greenhouse Gas Emissions and Climate Change
a renewable portfolio and electricity standards for electricity production (23.4 MMT CO2e); and
the Cap-and-Trade Regulation for certain types of stationary emission sources (e.g., power plants).
In 2014, ARB adopted the First Update to the Climate Change Scoping Plan to identify the next steps in reaching AB 32 goals and evaluate the progress that has been made between 2000 and 2012 (ARB 2014). According to the update, California is on track to meet the near-term 2020 GHG limit and is well positioned to maintain and continue reductions beyond 2020 (ARB 2014: ES-2). The update also reports the trends in GHG emissions from various emission sectors.
At the time of writing this draft EIR; however, no specific reduction goal beyond 2020 has been recommended or formally adopted by ARB or the California State Legislature. As noted in the discussion of AB 32, above, ARB is tasked with making a recommendation for targets beyond 2020 as part of the legislation. ARB is currently working on a second update to the Scoping Plan to reflect the 2030 target established in Executive Order B-30-15 (described in more detail below). The State Legislature is currently considering a bill to establish overall GHG targets, along the lines provided in AB 32, for the period after 2020. However, no such bills have been passed as of this writing (June 2016).
Executive Order B-30-15 On April 20, 2015, Governor Edmund G. Brown, Jr., signed Executive Order B-30-15 to establish a California GHG reduction target of 40 percent below 1990 levels by 2030. The Governor’s executive order aligns California’s GHG reduction targets with those of leading international governments such as the 28-nation European Union which adopted the same target in October 2014. California is on track to meet or exceed its legislated target of reducing GHG emissions to 1990 levels by 2020, as established in the California Global Warming Solutions Act of 2006 (AB 32, summarized above). California’s new emission reduction target of 40 percent below 1990 levels by 2030 will make it possible to reach the ultimate goal of reducing emissions 80 percent below 1990 levels by 2050. This is in line with the scientifically established levels needed in the U.S. to limit global warming below 2°Celsius, the warming threshold at which there will likely be major climate disruptions such as super droughts and rising sea levels. None of the targets stated in Executive Order B-30-15 have not been adopted by the state legislature.
Senate Bill X1-2, the California Renewable Energy Resources Act of 2011 SB X1-2 of 2011 requires all California utilities to generate 33 percent of their electricity from renewables1 by 2020.
1 Renewable energy resources under the California Renewable Energy Resources Act include: wind, solar thermal, solar photovoltaic, geothermal, solid-fuel biomass, biogas, and small hydroelectric (i.e., smaller than 30 megawatt capacity).
Fish Habitat Flows Draft EIR and Water Rights Project 4.8-13
Greenhouse Gas Emissions and Climate Change
Senate Bill 350, the Clean Energy and Pollution Reduction Act of 2015 Approved by Governor Brown on October 7, 2015, SB 350 targets a 50 percent renewable mix in California electricity by December 31, 2030 and a cumulative doubling of statewide energy efficiency savings in electricity and natural gas final end uses of retail customers by January 1, 2030, with annual targets established by the California Energy Commission. This bill is meant as an extension of SB X1-2 of 2011.
Local
Mendocino County General Plan No policies that address GHGs in the Mendocino County General Plan are relevant to the GHG efficiency of the Water Agency’s operations.
City of Ukiah General Plan No policies that address GHGs in the City of Ukiah General Plan are relevant to the GHG efficiency of the Water Agency’s operations.
City of Ukiah Climate Action Plan The City of Ukiah CAP outlines strategies, goals, and actions for reducing municipal and community-wide GHG emissions. It is designed to ensure that Ukiah does its part to contribute to the goals of California’s Global Warming Solutions Act of 2006 (AB 32), while remaining consistent with the Ukiah General Plan vision for future growth.
The baseline 2005 GHG inventory for the community of Ukiah totals 155,480 metric tons (MT) of carbon dioxide equivalent (CO2e). In 2005, On-road Transportation accounted for of the largest portion of overall community-wide emissions, constituting 47.9 percent of total emissions. Contributions from other sectors, in order of magnitude, include: City-operated Landfill (23.8 percent), Residential Energy (electricity and natural gas, 10.4 percent), Commercial/Industrial Energy (electricity and natural gas, 9.0 percent), Solid Waste Generation (3.0 percent), Agriculture (2.8 percent), Off-road Transportation (2.7 percent), Wastewater Treatment (0.2 percent), Water Conveyance Electricity (0.1 percent), and Stationary Sources (<0.1 percent). Between 2005 and 2010, community-wide emissions decreased by approximately 7 percent to 144,625 MT CO2e, with 9 of the 12 sectors experiencing a decrease. The 44 percent reduction in emissions from Solid Waste Generation is due to a large increase in waste diversion between 2005 and 2010 (i.e., increased recycling). The decrease at the City-operated Landfill is due to the natural attenuation of methane (CH4) emissions as the waste in place decomposes and releases less landfill gas over time. Electricity-related reductions (Residential, Commercial, and Water Conveyance) can be attributed to lower power consumption resulting from the economic downturn, and an increase in the amount of low-carbon renewable energy sources in the City’s electricity portfolio from 2005 to 2010. Overall, the percent that each sector contributed to total emissions did not change significantly between 2005 and 2010, with On-road Transportation continuing to comprise the largest sector (51.1 percent), followed by the City Landfill (21.1 percent), and Residential Energy (electricity and natural gas, 11.2 percent). The City of Ukiah GHG emissions by sector are depicted in Figure 4.8-4.
Fish Habitat Flows Draft EIR and Water Rights Project 4.8-14
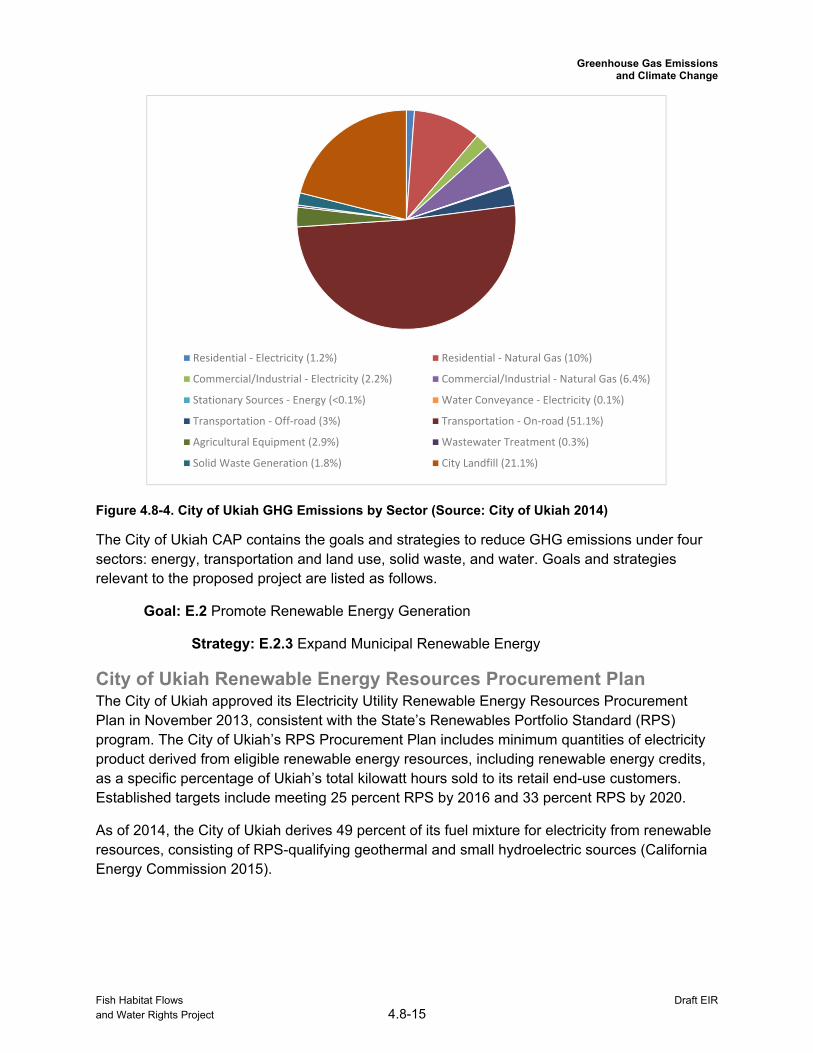
Residential ‐ Electricity (1.2%) Residential ‐ Natural Gas (10%)
Commercial/Industrial ‐ Electricity (2.2%) Commercial/Industrial ‐ Natural Gas (6.4%)
Stationary Sources ‐ Energy (<0.1%) Water Conveyance ‐ Electricity (0.1%)
Transportation ‐ Off‐road (3%) Transportation ‐ On‐road (51.1%)
Agricultural Equipment (2.9%) Wastewater Treatment (0.3%)
Solid Waste Generation (1.8%) City Landfill (21.1%)
Greenhouse Gas Emissions and Climate Change
Figure 4.8-4. City of Ukiah GHG Emissions by Sector (Source: City of Ukiah 2014)
The City of Ukiah CAP contains the goals and strategies to reduce GHG emissions under four sectors: energy, transportation and land use, solid waste, and water. Goals and strategies relevant to the proposed project are listed as follows.
Goal: E.2 Promote Renewable Energy Generation
Strategy: E.2.3 Expand Municipal Renewable Energy
City of Ukiah Renewable Energy Resources Procurement Plan The City of Ukiah approved its Electricity Utility Renewable Energy Resources Procurement Plan in November 2013, consistent with the State’s Renewables Portfolio Standard (RPS) program. The City of Ukiah’s RPS Procurement Plan includes minimum quantities of electricity product derived from eligible renewable energy resources, including renewable energy credits, as a specific percentage of Ukiah’s total kilowatt hours sold to its retail end-use customers. Established targets include meeting 25 percent RPS by 2016 and 33 percent RPS by 2020.
As of 2014, the City of Ukiah derives 49 percent of its fuel mixture for electricity from renewable resources, consisting of RPS-qualifying geothermal and small hydroelectric sources (California Energy Commission 2015).
Fish Habitat Flows Draft EIR and Water Rights Project 4.8-15
Greenhouse Gas Emissions and Climate Change
Sonoma County General Plan The Open Space and Resource Conservation (OSRC) element of the Sonoma County General Plan includes the following applicable goals, objectives, and policies related to reducing GHG emissions in Sonoma County (Sonoma County 2008):
Goal OSRC 14: Promote energy conservation and contribute to energy demand reduction in the County.
Objective OSRC-14.4: Reduce greenhouse gas emissions by 25 percent below 1990 levels by 2015.
Policy OSRC-14j: Encourage the Sonoma County Water Agency and other water and wastewater service providers to reduce energy demand from their operations.
Goal OSRC-16: Preserve and maintain good air quality and provide for an air quality standard that will protect human health and preclude crop, plant and property damage in accordance with the requirements of the Federal and State Clean Air Acts.
Objective OSRC-16.1: Minimize air pollution and greenhouse gas emissions.
Climate Action 2020 and Beyond: Sonoma County Regional Climate Action Plan The Sonoma County Climate Action Plan, Climate Action 2020 and Beyond (Sonoma County CAP), provides GHG emissions inventories and outlines a series of local actions to reduce community GHG emissions to 25 percent below 1990 levels by 2020. The regional framework creates an efficient and consistent approach to address climate change but allows local governments to adopt locally appropriate measures to reduce GHG emissions. It also provides information about local climate hazards and ways Sonoma County communities can be more resilient to those hazards. After 2020, another phase of local climate action planning will begin to meet the future goal of reducing emissions to 80 percent below 1990 levels by 2050. At the time of writing this EIR the Sonoma County CAP and Draft EIR are available for public review and not yet adopted, however relevant information is provided in this discussion as appropriate.
GHG Emission Inventory for Sonoma County Approximately 4 million metric tons of carbon dioxide equivalent (MMTCO2e) were generated by activities in Sonoma County in 1990. By 2010, GHG emissions decreased by approximately 7.7 percent to about 3.7 MMTCO2e. However, in the absence of state and local climate action, emissions are projected to grow to 4.4 MMTCO2e by 2020, largely driven by population and economic growth.
The inventories of community-wide GHG emissions in Sonoma County capture the primary sources of emissions that can be reduced through the actions of local governments and regional entities: energy use in our homes, businesses, vehicles, and off-road equipment; emissions associated with the treatment and delivery of water; emissions from solid waste generation ; and fertilizer and livestock operations. This approach is known as an “activity-based” inventory. It
Fish Habitat Flows Draft EIR and Water Rights Project 4.8-16
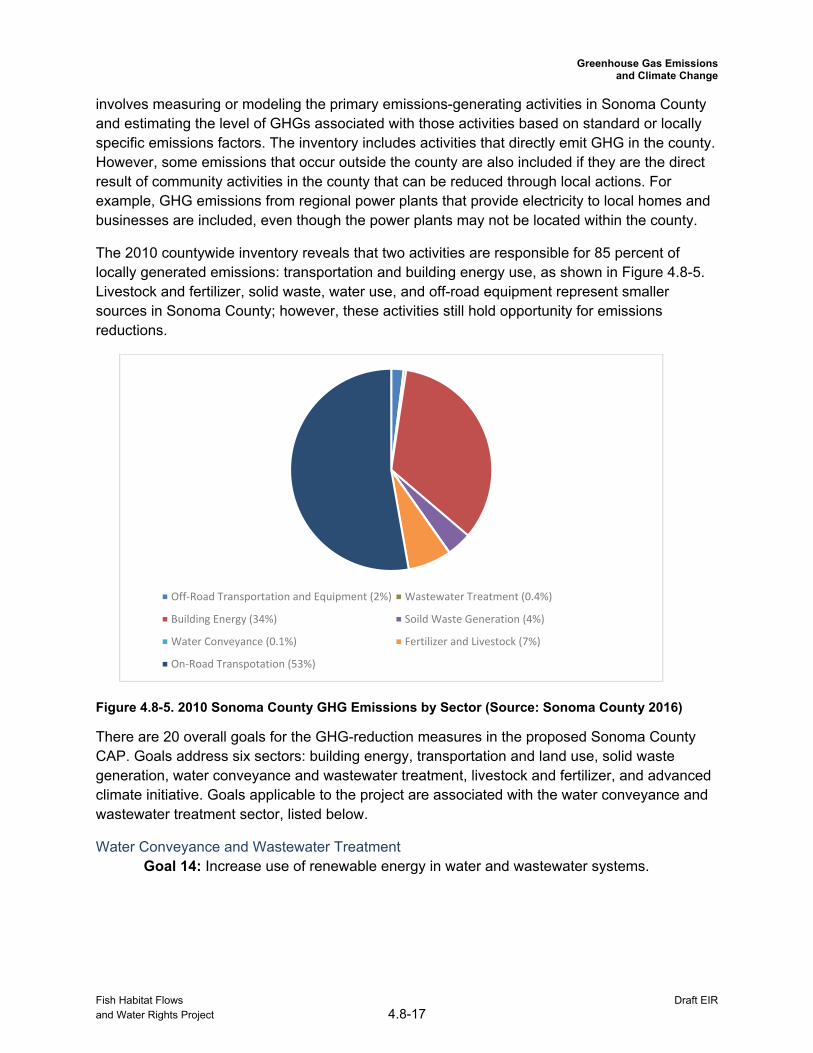
Off‐Road Transportation and Equipment (2%) Wastewater Treatment (0.4%)
Building Energy (34%) Soild Waste Generation (4%)
Water Conveyance (0.1%) Fertilizer and Livestock (7%)
On‐Road Transpotation (53%)
Greenhouse Gas Emissions and Climate Change
involves measuring or modeling the primary emissions-generating activities in Sonoma County and estimating the level of GHGs associated with those activities based on standard or locally specific emissions factors. The inventory includes activities that directly emit GHG in the county. However, some emissions that occur outside the county are also included if they are the direct result of community activities in the county that can be reduced through local actions. For example, GHG emissions from regional power plants that provide electricity to local homes and businesses are included, even though the power plants may not be located within the county.
The 2010 countywide inventory reveals that two activities are responsible for 85 percent of locally generated emissions: transportation and building energy use, as shown in Figure 4.8-5. Livestock and fertilizer, solid waste, water use, and off-road equipment represent smaller sources in Sonoma County; however, these activities still hold opportunity for emissions reductions.
Figure 4.8-5. 2010 Sonoma County GHG Emissions by Sector (Source: Sonoma County 2016)
There are 20 overall goals for the GHG-reduction measures in the proposed Sonoma County CAP. Goals address six sectors: building energy, transportation and land use, solid waste generation, water conveyance and wastewater treatment, livestock and fertilizer, and advanced climate initiative. Goals applicable to the project are associated with the water conveyance and wastewater treatment sector, listed below.
Water Conveyance and Wastewater Treatment Goal 14: Increase use of renewable energy in water and wastewater systems.
Fish Habitat Flows Draft EIR and Water Rights Project 4.8-17
Greenhouse Gas Emissions and Climate Change
Sonoma County Water Agency Energy Policy
Energy Policy and “Carbon-free Water” Campaign The Board of Directors adopted the Water Agency’s Energy Policy in March 2011, which sets the guidelines for the Water Agency’s energy-related projects and innovations and lays the groundwork for a comprehensive program of water-use efficiency, system efficiency, and development and purchase of renewable energy sources. Elements of the multifaceted Water Agency program relevant to the GHG analysis of the Proposed Project are summarized as follows.
Energy use can be decreased by reducing demand for water. By increasing water conservation, the Water Agency can pump less water and wastewater and use less energy. Ongoing water use efficiency initiatives have helped reduce water deliveries throughout the region by approximately 20.7 percent since 2006 (SCWA 2015). Water use efficiency initiatives include public awareness campaigns, programs targeting conversion to low water-use landscaping, and rebates and direct install programs for low water-use fixtures.
The Water Agency also continues efforts to reduce energy consumption throughout its water and wastewater systems through the implementation of efficiency upgrades. Energy efficiency measures include replacing old electric motors and fine-tuning system operations. Additionally the Water Agency’s Operations and Maintenance Building and Services Center were retrofitted with highly efficient heating, ventilation and air conditioning (HVAC) supplied by ground-source and pond-loop heat pump systems, which reduced HVAC energy use by 50 percent.
The Water Agency also pursued expansion of its energy production facilities. In 2006, the Water Agency initiated the installation of a 500kW photovoltaic system at its administrative building. The following year, another 500kW photovoltaic system was installed at the Airport Treatment Plant and a 930 kW system was installed at the Sonoma Valley Treatment Plant. In 2009, the Water Agency began using electricity generated by the existing hydroelectric facilities at Warm Springs Dam rather than selling it to Pacific Gas and Electric (PG&E). Two years later, the Water Agency contracted to use all of the electricity produced by the 2005 Landfill Gas Power Plant, approximately 3 MW. The Water Agency is actively planning additional photovoltaic systems, including up to 12.5 MW of floating solar on recycled water storage ponds. The majority of the power produced by this network of floating solar will be purchased by Sonoma Clean Power, reducing emissions for the region as a whole (SCWA 2015).
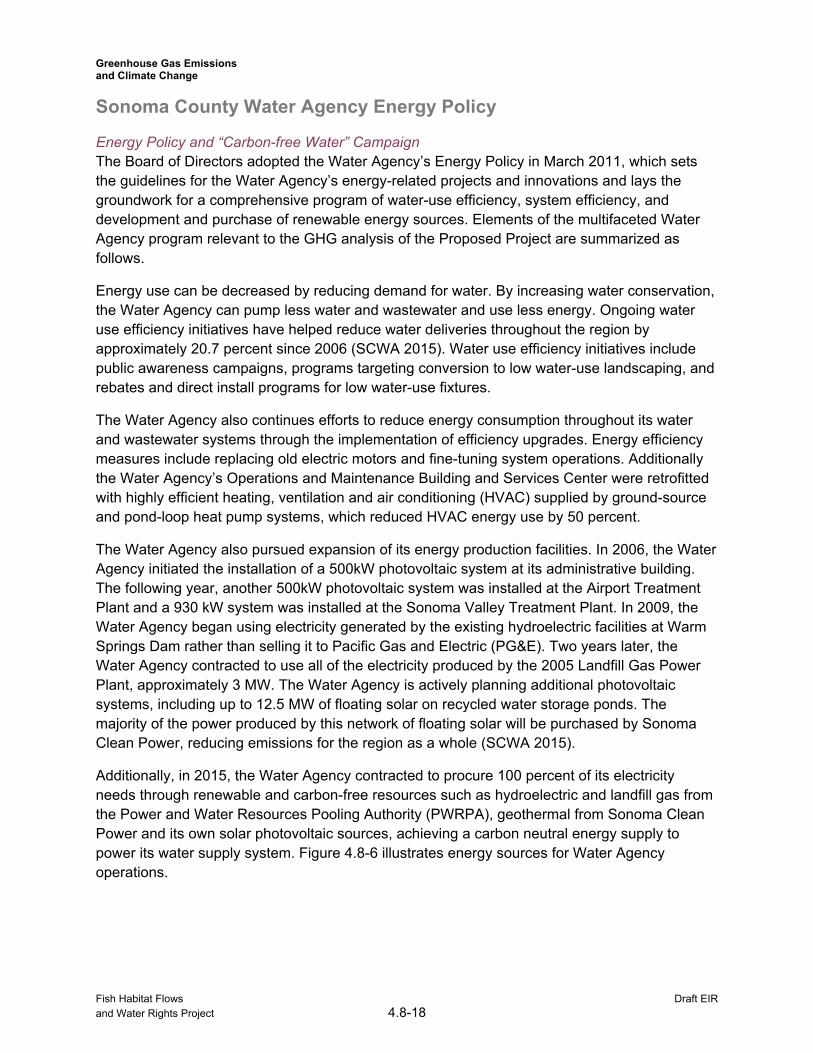
Additionally, in 2015, the Water Agency contracted to procure 100 percent of its electricity needs through renewable and carbon-free resources such as hydroelectric and landfill gas from the Power and Water Resources Pooling Authority (PWRPA), geothermal from Sonoma Clean Power and its own solar photovoltaic sources, achieving a carbon neutral energy supply to power its water supply system. Figure 4.8-6 illustrates energy sources for Water Agency operations.
Fish Habitat Flows Draft EIR and Water Rights Project 4.8-18
SCP Geothermal (5%) Water Agency PV (6%)
PWRPA Large Hydro (7%) PWRPA Water Springs Dam (27%)
PWRPA Landfill Gas (55%)
Greenhouse Gas Emissions and Climate Change
Figure 4.8-6. Sonoma County Water Agency Electric Energy Sources, 2015 (Source: Water Agency, 2015)
Sonoma Clean Power In 2011, the Water Agency Board of Directors directed the Water Agency to investigate forming a community power program in response to Sonoma County’s desire for lower rates and cleaner power. In 2012, a Joint Powers Authority (JPA) was approved by the Board, and Sonoma Clean Power was launched. Sonoma Clean Power is the new, locally controlled electricity provider in Sonoma County that provides the option of using power generated by renewable sources at competitive rates. Sonoma Clean Power offers an “EverGreen” electricity purchase program which allows customers to choose 100% renewable energy from local geothermal sources.
Electric Vehicles Fleet The Water Agency is part of a Bay Area coalition receiving funding for fleet electric vehicles and charging infrastructure through the Local Government Electric Vehicle Fleet Demonstration Project, a project of the Metropolitan Transportation Commission. Currently, the Water Agency has nearly 30 hybrid, plug-in hybrid and electric vehicles, which comprise almost 20 percent of the Water Agency’s fleet.
Applied Solutions The Water Agency is a founding member of Applied Solutions, a non-profit organization that provides a shared forum for local governments to advance local and regional energy independence, economic stability, job creation and resilient infrastructure systems. The group includes over 170 local government affiliates (Sonoma County Water Agency 2015).
Water Agency 2013 GHG Emissions Inventory The Water Agency reported GHG emissions to the California Climate Action Registry for the years 2006-2009 and to the Climate Registry (TCR) from 2010 to the present. The most recently published Greenhouse Gas Inventory Report to date for the Water Agency is for the Calendar Year 2014.
Fish Habitat Flows Draft EIR and Water Rights Project 4.8-19
Greenhouse Gas Emissions and Climate Change
The Water Agency’s 2014 inventory includes emissions from administrative facilities such as office buildings; water supply facilities such as the Wohler-Mirabel diversions and booster pumps; wastewater facilities and pump stations; and mobile sources such as passenger vehicles and construction equipment. Direct emissions include stationary combustion; mobile combustion; process emissions, such as N2O produced by wastewater; and fugitive emissions, such as those from building and vehicle air conditioning systems. Indirect emissions are those resulting from purchased electricity.
Approximately 94 percent of Water Agency-purchased electricity is supplied by the JPA PWRPA and the remainder of electricity used by the Water Agency is purchased from Pacific Gas and Electric Company (PG&E) and Sonoma Clean Power (SCP). PWRPA delivers most of its power from hydroelectric sources (zero emission factor) and also provides the Water Agency with renewable power from the local Landfill-Gas-to-Energy facility. In 2014, the Water Agency purchased 40,902 MWh from PWRPA and 1,548 MWh from PG&E and SCP. The Water Agency’s GHG emissions totaled 4.1327 megatons of CO2 equivalent (MTCO2e) for the 2014 calendar year.
The Water Agency has achieved the Climate Registry’s Platinum Status, the highest achievement level recognized, for the adoption of a carbon reduction plan, achieving greater than 20 percent reduction in emissions, and demonstrating implementation of five or more best practices for climate protection (SCWA 2015).
4.8.4 Impact Analysis
Methodology This impact analysis considers the potential GHG- and climate change-related effects of Water Agency’s proposed changes to its management of water releases from Lake Mendocino and Lake Sonoma. The proposed changes to water release management would not involve the construction of new facilities, increased operation of existing emissions sources (e.g., pumps) operated by the Water Agency or the users its serves, or changes to the type or frequency of maintenance activities performed by the Water Agency. For these reasons, this analysis focuses on whether any of the resultant reservoir conditions at Lake Mendocino and Lake Sonoma could potentially result in a net increase in the level of GHGs emitted directly from the reservoirs.
Data representative of existing emissions of CO2, CH4, and N2O from Lake Mendocino and Lake Sonoma are not available. While research studies have been conducted for lakes of a similar size, the potential for emissions from the Russian River watershed is not considered to be easily interpolated, in part, because standard procedures to obtain data have not been used across studies (Goldenfum 2012). In addition, reservoirs are collection points for material coming from the whole drainage basin area upstream. As part of the natural cycle, organic matter is flushed into these collection points from the surrounding terrestrial ecosystems. In addition, domestic sewage, industrial waste and agricultural runoff may also enter these systems and produce GHG emissions. Therefore, a determination about whether a reservoir results in a net increase
Fish Habitat Flows Draft EIR and Water Rights Project 4.8-20
Greenhouse Gas Emissions and Climate Change
in GHG emissions would necessitate the appropriate estimation of GHG emissions associated with the affected waterways before and after the reservoir is formed. Because data were not collected from areas surrounding the project site before the dams were constructed the associated change in emission levels cannot be measured. Thus, for the purposes of this analysis, a qualitative approach is applied and it is assumed that Lake Mendocino and Lake Sonoma produce some quantities of CO2, CH4, and N2O for the reasons described below. However, no measurements have been taken to verify this assumption.
While CO2 is produced under oxic or anoxic conditions, as described above, CH4 is produced under anoxic conditions in waterways. N2O may be produced in the drawdown zone in reservoirs at the sediment/water interface; however, existing research indicates that N2O levels are relatively low in temperate regions such as the project area (IHA 2010)). Given the presence of sediment, and fluctuating water level, Lake Mendocino and Lake Sonoma provide conditions for the production of CO2, CH4, and N2O.
As described above, CO2 and CH4 are released to the atmosphere through five processes: 1) bubble fluxes (ebullition) from the shallow water; 2) diffusive fluxes from the water surface of the reservoir; 3) diffusion through plant stems; 4) degassing upon passing through turbines and spillways, due to decreased pressure and increased temperatures, and 5) increased diffusive fluxes along river courses downstream (IHA 2010). N2O is emitted to the atmosphere from diffusive fluxes. Both Lake Sonoma and Lake Mendocino operate such that CO2, CH4, and N2O could be emitted through these processes. Because Lake Mendocino’s outfall is located near the bottom of the lake where methanogensis typically occurs, it may release greater levels of GHG than Lake Sonoma because its outflow is near the surface of the water.
The GHG impact analysis presented in this EIR discusses whether reservoir-generated GHG levels could potentially change based on a review of published literature and modeling efforts that account for water temperature, variability in lake water surface elevations, and the level of power generation at the hydroelectric facilities at Coyote Valley Dam and Warm Springs Dam.
The ability for the City of Ukiah to meet its RPS requirements is also addressed based on the degree in which electricity production at Coyote Valley Dam would change.
The Proposed Project’s susceptibility to present and future effects of climate change is analyzed qualitatively. This discussion focuses on the many functions the reservoirs support, including releasing water stored in these reservoirs to supplement natural flows as necessary to maintain the minimum instream flow requirements for the Russian River and Dry Creek established by the State Water Resources Control Board's (SWRCB)2 Decision 1610, to meet the demands for diversions into the Water Agency’s transmission system and to meet the needs of other Russian River water users, as well as stored water for wildfire fighting efforts, and recreational uses.
As described in Chapter 4, the Water Agency’s Russian River ResSim Model was used to simulate the water supply operations of Lake Mendocino and Lake Sonoma as well as flow and water quality conditions at multiple locations along the Russian River and Dry Creek for
2 In this EIR, “SWRCB” refers to both the State Water Resources Control Board and its predecessor agencies.
Fish Habitat Flows Draft EIR and Water Rights Project 4.8-21
Greenhouse Gas Emissions and Climate Change
Baseline Conditions, the Proposed Project, No Project 1 Alternative, and No Project 2 Alternative. System conditions were analyzed for both historical hydrology from 1910 to 2013 and projected climate change hydrology from 2000 to 2099. Please refer to Appendix G for more information on the ResSim model and its results. Reservoir water surface elevations, storage volumes, and instream flow changes, as simulated by the Russian River ResSim model, were then used to assess potential impacts related to greenhouse gases and climate change.
The project alternatives involve changes to water release schedules and do not include any construction or operational activities that directly emit GHGs. For this reason, and for the reasons described above related to that qualitative nature of this assessment, quantified analysis of GHG emissions is not needed.
Significance Criteria
CEQA Direction Because no single project is large enough to meaningfully affect climate change (caused by many years of cumulative global emissions of GHG), a GHG significance threshold for a single project cannot be meaningfully established. For example, although Executive Orders B-30-15 and S-3-05 establish 2030 and 2050 statewide goals, respectively, for reducing GHG emissions, agencies are not required to use those goals to evaluate GHG emissions. In 2008, the Schwarzenegger administration issued guidance regarding this issue; that guidance stated that the adoption of appropriate significance thresholds was a matter of discretion for the lead agency. The guidance states:
“[T]he global nature of climate change warrants investigation of a statewide threshold of significance for GHG emissions. To this end, OPR has asked ARB technical staff to recommend a method for setting thresholds which will encourage consistency and uniformity in the CEQA analysis of GHG emissions throughout the state. Until such time as state guidance is available on thresholds of significance for GHG emissions, we recommend the following approach to your CEQA analysis.”
Determine Significance:
When assessing a project’s GHG emissions, lead agencies must describe the existing environmental conditions or setting, without the project, which normally constitutes the baseline physical conditions for determining whether a project’s impacts are significant.
As with any environmental impact, lead agencies must determine what constitutes a significant impact. In the absence of regulatory standards for GHG emissions or other scientific data to clearly define what constitutes a “significant impact,” individual lead agencies may undertake a project-by-project analysis, consistent with available guidance and current CEQA practice.
The potential effects of a project may be individually limited but cumulatively considerable. Lead agencies should not dismiss a proposed project’s direct and/or indirect climate change impacts without careful consideration, supported by substantial evidence. Documentation of available information and analysis should be provided for any project that may significantly contribute new GHG emissions, either individually or
Fish Habitat Flows Draft EIR and Water Rights Project 4.8-22
Greenhouse Gas Emissions and Climate Change
cumulatively, directly or indirectly (e.g., transportation impacts). Although climate change is ultimately a cumulative impact, not every individual
project that emits GHGs must necessarily be found to contribute to a significant cumulative impact on the environment. CEQA authorizes reliance on previously approved plans and mitigation programs that have adequately analyzed and mitigated GHG emissions to a less than significant level as a means to avoid or substantially reduce the cumulative impact of a project.
The Governor’s Office of Planning and Research’s (OPR) Guidance did not require Executive Order S-3-05 to be used as a significance threshold under CEQA. Rather, the Office of Planning and Research recognized that, until ARB establishes a state-wide standard, selecting an appropriate threshold was within the discretion of the lead agency.
CEQA Guidelines Section 15064.4 was later added, in 2010, to address GHGs. The Guidelines state:
(a) The determination of the significance of greenhouse gas emissions calls for a careful judgment by the lead agency consistent with the provisions in section 15064. A lead agency should make a good-faith effort, based to the extent possible on scientific and factual data, to describe, calculate or estimate the amount of greenhouse gas emissions resulting from a project. (b) A lead agency should consider the following factors, among others, when assessing the significance of impacts from greenhouse gas emissions on the environment:
(1) The extent to which the project may increase or reduce GHG emissions as compared to the existing environmental setting; (2) Whether the project emissions exceed a threshold of significance that the lead agency determines applies to the project; (3) The extent to which the project complies with regulations or requirements adopted to implement a statewide, regional, or local plan for the reduction or mitigation of greenhouse gas emissions. Such requirements must be adopted by the relevant public agency through a public review process and must reduce or mitigate the project’s incremental contribution of greenhouse gas emissions. If there is substantial evidence that the possible effects of a particular project are still cumulatively considerable notwithstanding compliance with the adopted regulations or requirements, an EIR must be prepared for the project.
Standard environmental checklist questions have been reviewed in light of the proposed project to develop significance criteria that are tailored to the consequences of the proposed changes to fish flow releases, As described previously under subheading, “Methodology,” GHG emissions from the project alternatives could be associated with operations and conditions of Lake Sonoma and Lake Mendocino. Due to the qualitative nature of this discussion, there is no quantitative threshold that applies to the analysis. However, the analysis does consider if GHG emissions would increase with operations and if statewide goals and strategies for renewable energy under the RPS would be met (i.e., as reflected in the AB 32 Scoping Plan goals and strategies). Consistency with local plans and programs is evaluated in Section 4.8.5 below. In
Fish Habitat Flows Draft EIR and Water Rights Project 4.8-23
Greenhouse Gas Emissions and Climate Change
addition, while a recent Supreme Court decision clarified that CEQA does not generally require an analysis of the environment’s effect on a project, including exposure to effects of a warming climate, if a project may risk exacerbation of the environmental hazard or adverse condition, the lead agency needs to evaluate how the hazard or condition could affect a project’s future users or residents (Supreme Court of California, December 17, 2015). Based on this guidance, the issue of exposure to climate change risks is included in the analysis. Thus, the Water Agency has determined that the project alternatives could result in a signficant environmental effect if:
the Fish Habitat Flows and Water Rights Project could result in a substantial increase in reservoir-generated GHG emissions;
the Fish Habitat Flows and Water Rights Project could substantially affect the City of Ukiah’s ability to meet RPS requirements (which, in turn, could indirectly affect consistency with AB 32 goals and strategies); or
changed climate could alter hydrological conditions such that Fish Habitat Flows and Water Rights Project operations would potentially result in significant indirect adverse environmental effects.
Impacts and Mitigation Measures The following section presents a detailed discussion of potential greenhouse gas emissions and climate change impacts associated with the project alternatives, including the Proposed Project, the No Project 1 Alternative, and the No Project 2 Alternative. Each impact discussion includes an analysis of the impact, a summary statement of the impact and its significance, and proposed mitigation measures, where applicable. Impacts are summarized and categorized as either “no impact,” “less than significant,” “less than significant with mitigation,” “significant and unavoidable,” or “beneficial.”
Impact 4.8-1. The Fish Habitat Flows and Water Rights Project could result in a substantial increase in reservoir-generated GHG emissions. (Less than Significant)
As discussed above, available data indicate that GHG emissions from reservoirs vary considerably depending on a number of factors. However, for the purposes of this analysis, it is assumed that that: 1) anaerobic conditions exist in both lakes conducive to the production of CO2, CH4, and N2O; and 2) GHGs emitted by Lake Mendocino and Lake Sonoma result from diffusion, ebullition, and degassing. Factors that affect the levels of GHGs emitted from these and other reservoirs include the following (Goldenfum 2012):
Carbon and nutrient loading in the reservoir: Loading of carbon and nutrients affects the amount of carbon stored in the sediments and the amount of dissolved oxygen.
Rainfall: Rainfall can affect shore erosion, water levels in lakes, and runoff rates of waterways.
Soil type and nearby land use: Some soil types are more likely to create anaerobic conditions; nearby land uses can affect nutrient levels of runoff into waterways.
Fish Habitat Flows Draft EIR and Water Rights Project 4.8-24
Greenhouse Gas Emissions and Climate Change
Biomass of plants, algae, bacteria, and animals in the reservoir and in drawdown zone: Decomposition of biomass, under anaerobic condition converts CO2 into CH4.
Water temperature gradient: Increased water temperatures reduce gas solubility.
Water residence time: The amount of time water molecules exist in lakes can affect the rate at which the carbon cycle function.
Stratification of the reservoir body: Water stratification occurs when water masses with different properties (e.g., water temperature or oxygen content) form layers that act as barriers to water mixing.
Reservoir age: The length of time the area has been used as a reservoir. New, younger reservoirs have the potential to generate more GHGs because of the amount of carbon-based material inundated with water during the initial inundation.
Drawdown zone exposure: The area where water level changes as a result of increased or decreased inflow and outflow. Inundated vegetation may result in crease level of dissolved organic matter
Wind speed and direction: Wind speed and direction can influence mixing of reservoir waters
Presence of low-level outlets: Releases of water from low-level outlets can cause immediate pressure reduction that allow for gas to become less soluble in water.
Level of turbulence downstream of the dam associated with ancillary structures: The presence of spillways, turbines, and weirs can affect how much gas is released from water due to changes in temperature and pressure.
Water depth: Water depth can influence the presence of anoxic conditions, temperature, and mixing of lake waters.
Implementation of the project alternatives would have the potential to change some of these parameters but not others. Changes to outflow rates would not affect the general climate and weather conditions, such as wind speed and direction, rainfall, and carbon and nutrient loading into the reservoir. In addition, physical characteristics of the reservoirs would not be altered, such as the presence of low-level outlets, reservoir age, carbon and nutrient loading into the reservoir, soil types, and nearby land uses. Based on existing conditions and water levels, the Proposed Project would not cause new vegetated areas to be inundated.
The project alternatives would potentially change other parameters, however. Because the Proposed Project would affect the rate and timing of water releases from Lake Mendocino and Lake Sonoma, there would be changes to water depth during some parts of the year. In turn this could affect water temperature, stratification of the reservoir body, changes to turbulence levels downstream of the dam, and variation in reservoir depth. Importantly, water surface elevation (i.e., reservoir depth) and the annual variation in surface variation is the single factor that influences all of these parameters. For this reason, this analysis focuses on whether the surface elevations of Lake Mendocino and Lake Sonoma would be substantially changed under the Proposed Project and the No Project 1 and No Project 2 alternatives compared to Baseline Conditions. Minimum and maximum water surface elevations of both reservoirs were modeled for Baseline, Proposed Project, No Project 1, and No Project 2 alternatives. The results of this
Fish Habitat Flows Draft EIR and Water Rights Project 4.8-25
Water Surface Elevations at Lake Sonoma 600
Surface
500
Water
400
Maxim
um
ations
300
Elev 200
and
100 Minim
um
0 Jan Feb Mar Apr May June July Aug Sept Oct Nov Dec
Baseline Min Project Min NP1 Min NP2 Min
Baseline Max Project Max NP1 Max NP2 Max
Water Surface Elevations at Lake Mendocino 900
Surface
800
700
Water 600
Maxim
um
500
ations
400
300
Elev
200
and
100
Minim
um 0
Jan Feb Mar Apr May June July Aug Sept Oct Nov Dec
Baseline Min Project Min NP1 Min NP2 Min
Baseline Max Project Max NP1 Max NP2 Max
Greenhouse Gas Emissions and Climate Change
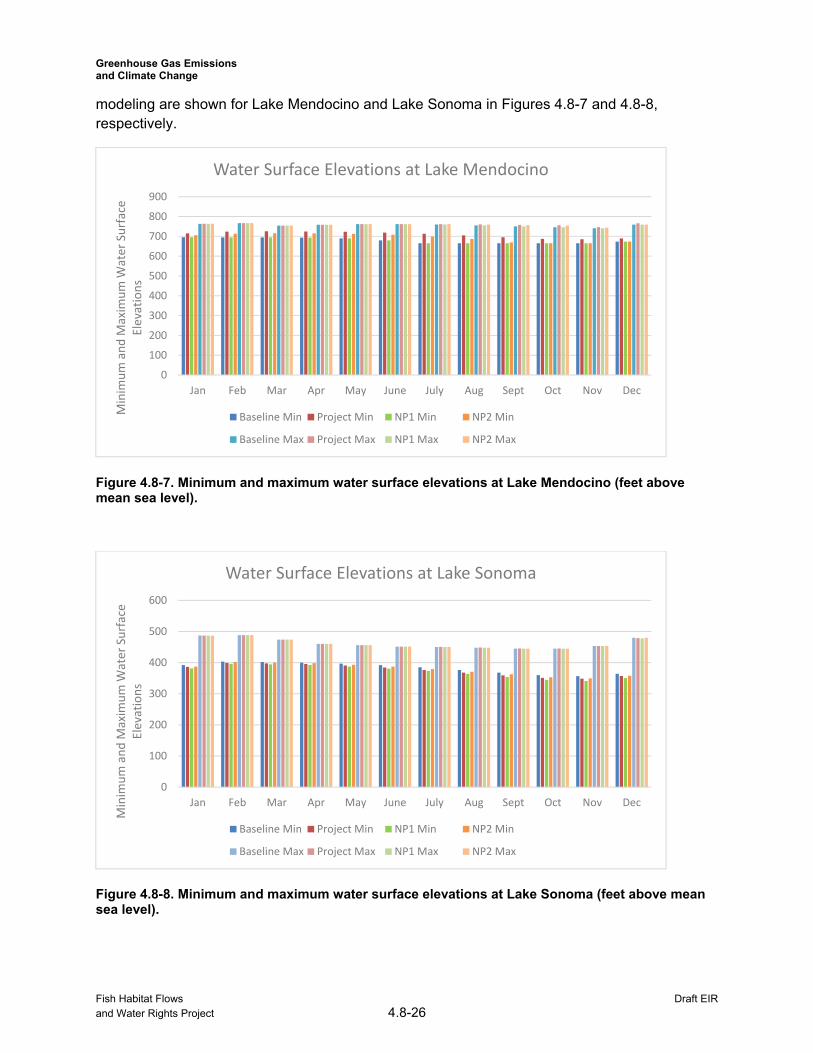
modeling are shown for Lake Mendocino and Lake Sonoma in Figures 4.8-7 and 4.8-8, respectively.
Figure 4.8-7. Minimum and maximum water surface elevations at Lake Mendocino (feet above mean sea level).
Figure 4.8-8. Minimum and maximum water surface elevations at Lake Sonoma (feet above mean sea level).
Fish Habitat Flows Draft EIR and Water Rights Project 4.8-26
Greenhouse Gas Emissions and Climate Change
The No Project 1 Alternative, No Project 2 Alternative, and Proposed Project are discussed separately below.
No Project 1 The No Project 1 Alternative follows Decision 1610 minimum instream flow releases guided by the Decision 1610 Hydrologic Index, but assumes that beneficial use of the existing 75,000 acre-feet of water authorized under water right Permits 12947A, 16596, 12949, and 12950 would be met by greater releases from Warm Springs Dam through Dry Creek and into the Russian River for diversion at the Wohler and Mirabel diversion facilities. Under the No Project 1 Alternative, flows to Dry Creek from Lake Sonoma and flows to the Russian River from Lake Mendocino would be the same as under Baseline Conditions. Thus, conditions in Lake Mendocino and Lake Sonoma would not change. Conditions that could result in production of GHGs, such as stratification of water bodies, carbon and nutrient loading, drawdown zone exposure, water depth, and level of turbulence downstream of the dam would remain similar to the existing conditions. As a result, it is not expected that reservoir-generated emissions of GHGs would substantially increase. Therefore, no impact is anticipated and no mitigation is required.
No Project 2 The No Project 2 Alternative would follow the Russian River Biological Opinion minimum instream flow recommendations on the Russian River during the summer months guided by the Decision 1610 Hydrologic Index, but still assumes that beneficial use of the existing 75,000 acre-feet of water authorized under water right Permits 12947A, 16596, 12949, and 12950 would be met by modified releases from Coyote Valley and Warm Springs dams. Under the No Project 2 alternative, water surface elevation in Lake Sonoma would be similar to Baseline Conditions, with some slight increases or decreases, as shown in Figure 4.8-7. The level of Lake Sonoma and flows to Dry Creek would be similar to existing conditions. Thus, conditions that could result in the generation of GHGs, including the stratification of water bodies, the level of carbon and nutrient loading, the level of drawdown zone exposure, water depth, and level of turbulence downstream of the dam would remain similar to Baseline Conditions. As a result, it is expected that production and emissions of GHGs would not substantially increase.
Under the No Project 2 Alternative, minimum water surface elevation would increase in Lake Mendocino during nearly all months of the year, as shown in Figure 4.8-7. The increase would inundate a greater area of shoreline compared to Baseline Conditions for longer periods of time throughout the year and would decrease the extent of drawdown area. While CO2 is produced under both oxic and anoxic conditions, as described above, CH4 is produced under anoxic conditions in waterways. N2O may be produced in the drawdown zone in reservoirs at the sediment/water interface; however, studies of other reservoirs in temperate regions indicate that levels are low (IHA 2010). Anoxic conditions in lakes are generally the result of decreased mixing of lake waters and warming of the upper layer of a lake to create a separate epilimnion (i.e. warm layer of water at the surface) and hypolimnion (i.e., cold, dense water below) (Grand Valley State University 2016).
Fish Habitat Flows Draft EIR and Water Rights Project 4.8-27
Greenhouse Gas Emissions and Climate Change
Changes to maximum water surface elevations at Lake Mendocino would remain similar to Baseline Conditions under the No Project 2 Alternative and, therefore, it is unlikely there would be a resulting change to oxic or anoxic conditions within the lake. That is, drivers of lake stratification would continue to predominantly be a function of wind speed and weather conditions. Thus, conditions that cause production of CO2 and CH4 would not change substantially. While N2O is not typically associated with lakes in temperate regions, a decrease in the drawdown zone (i.e., increase in minimum water surface elevation and slight increase in maximum water surface elevation) would reduce the likelihood of N2O production. Furthermore, the mechanisms by which GHGs could be released from Lake Mendocino (i.e., diffusion, outflow, and ebullition) would be the same under the No Project 2 Alternative and as under baseline conditions. For these reasons, conditions in Lake Mendocino would remain similar to the Baseline Conditions, indicating that GHG production and emissions would not substantially increase. Therefore, the potential impact would be less than significant and no mitigation is required.
Proposed Project The Proposed Project would follow the release schedule guided by the Russian River Hydrologic Index detailed in Chapter 3, Background and Project Description, and assumes that the beneficial use of the existing 75,000 acre-feet of water authorized under water right Permits 12947A, 16596, 12949, and 12950 would be met by modified releases from Coyote Valley Dam and Warm Springs Dam.
Under the Proposed Project, water surface elevation in Lake Sonoma would be similar to Baseline Conditions, with some slight increases or decreases, as shown in Figure 4.8-8. Thus, the level of Lake Sonoma and flows to Dry Creek would be similar to Baseline Conditions. Conditions that could result in reservoir-generated GHGs, such as the stratification of water bodies, the level of carbon and nutrient loading, the extent of drawdown zone exposure, water depth, and the level of turbulence downstream of the dam, would remain similar to the existing conditions. The similarity of environmental conditions indicate that the level of reservoir-generated GHG emissions would not substantially increase.
Under the Proposed Project, minimum water surface elevations would increase in Lake Mendocino in nearly all months of the year; and, as shown in Figure 4.8-7, maximum water surface elevation would increase from July through December. Compared to Baseline Conditions, the increase would inundate a greater area of shoreline for longer periods of time throughout the year and would decrease the drawdown area. As described above, CO2 is produced under both oxic and anoxic conditions, CH4 is produced under anoxic conditions in waterways, and N2O may be produced in the drawdown zone in reservoirs at the sediment/water interface (IHA 2010).
Implementation of the Proposed Project would decrease the variation in water surface elevations at Lake Mendocino. This change would not alter the likelihood of lake stratification, because this potential condition would continue to be predominantly driven by other factors, such as wind speed and weather. A diminished variation in water surface elevation leads to the conclusion that the Proposed Project would not alter oxic or anoxic conditions in the lake and,
Fish Habitat Flows Draft EIR and Water Rights Project 4.8-28
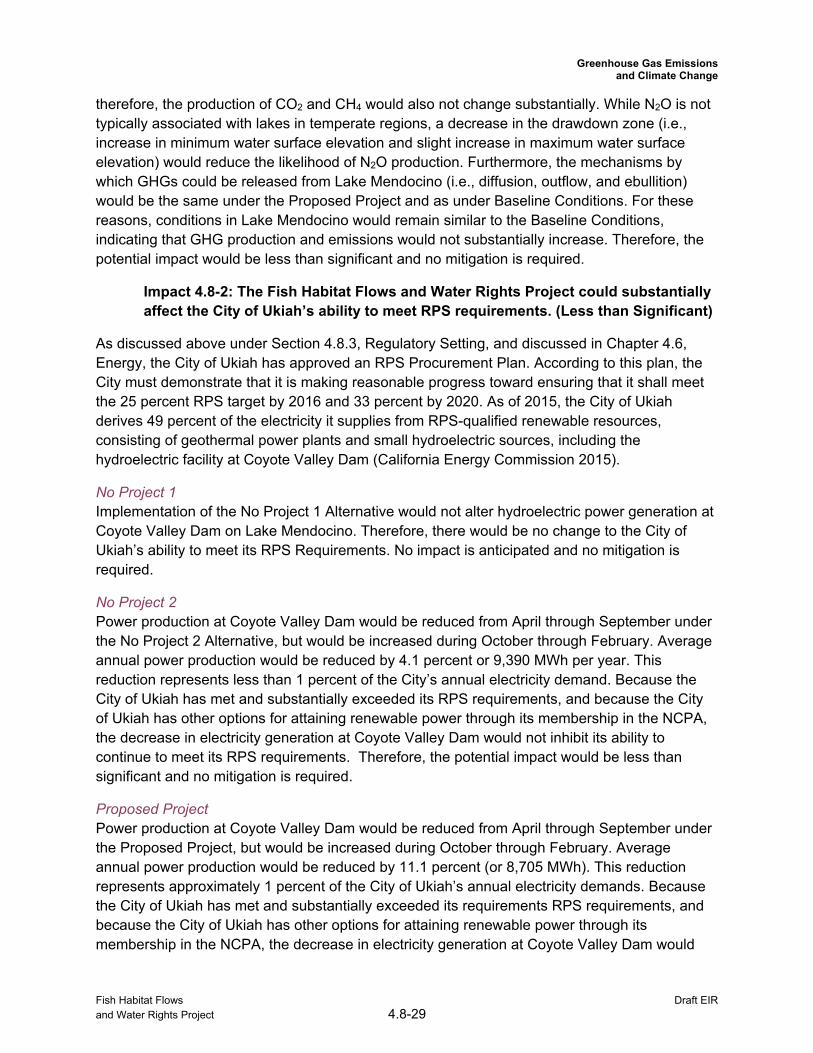
Greenhouse Gas Emissions and Climate Change
therefore, the production of CO2 and CH4 would also not change substantially. While N2O is not typically associated with lakes in temperate regions, a decrease in the drawdown zone (i.e., increase in minimum water surface elevation and slight increase in maximum water surface elevation) would reduce the likelihood of N2O production. Furthermore, the mechanisms by which GHGs could be released from Lake Mendocino (i.e., diffusion, outflow, and ebullition) would be the same under the Proposed Project and as under Baseline Conditions. For these reasons, conditions in Lake Mendocino would remain similar to the Baseline Conditions, indicating that GHG production and emissions would not substantially increase. Therefore, the potential impact would be less than significant and no mitigation is required.
Impact 4.8-2: The Fish Habitat Flows and Water Rights Project could substantially affect the City of Ukiah’s ability to meet RPS requirements. (Less than Significant)
As discussed above under Section 4.8.3, Regulatory Setting, and discussed in Chapter 4.6, Energy, the City of Ukiah has approved an RPS Procurement Plan. According to this plan, the City must demonstrate that it is making reasonable progress toward ensuring that it shall meet the 25 percent RPS target by 2016 and 33 percent by 2020. As of 2015, the City of Ukiah derives 49 percent of the electricity it supplies from RPS-qualified renewable resources, consisting of geothermal power plants and small hydroelectric sources, including the hydroelectric facility at Coyote Valley Dam (California Energy Commission 2015).
No Project 1 Implementation of the No Project 1 Alternative would not alter hydroelectric power generation at Coyote Valley Dam on Lake Mendocino. Therefore, there would be no change to the City of Ukiah’s ability to meet its RPS Requirements. No impact is anticipated and no mitigation is required.
No Project 2 Power production at Coyote Valley Dam would be reduced from April through September under the No Project 2 Alternative, but would be increased during October through February. Average annual power production would be reduced by 4.1 percent or 9,390 MWh per year. This reduction represents less than 1 percent of the City’s annual electricity demand. Because the City of Ukiah has met and substantially exceeded its RPS requirements, and because the City of Ukiah has other options for attaining renewable power through its membership in the NCPA, the decrease in electricity generation at Coyote Valley Dam would not inhibit its ability to continue to meet its RPS requirements. Therefore, the potential impact would be less than significant and no mitigation is required.
Proposed Project Power production at Coyote Valley Dam would be reduced from April through September under the Proposed Project, but would be increased during October through February. Average annual power production would be reduced by 11.1 percent (or 8,705 MWh). This reduction represents approximately 1 percent of the City of Ukiah’s annual electricity demands. Because the City of Ukiah has met and substantially exceeded its requirements RPS requirements, and because the City of Ukiah has other options for attaining renewable power through its membership in the NCPA, the decrease in electricity generation at Coyote Valley Dam would
Fish Habitat Flows Draft EIR and Water Rights Project 4.8-29
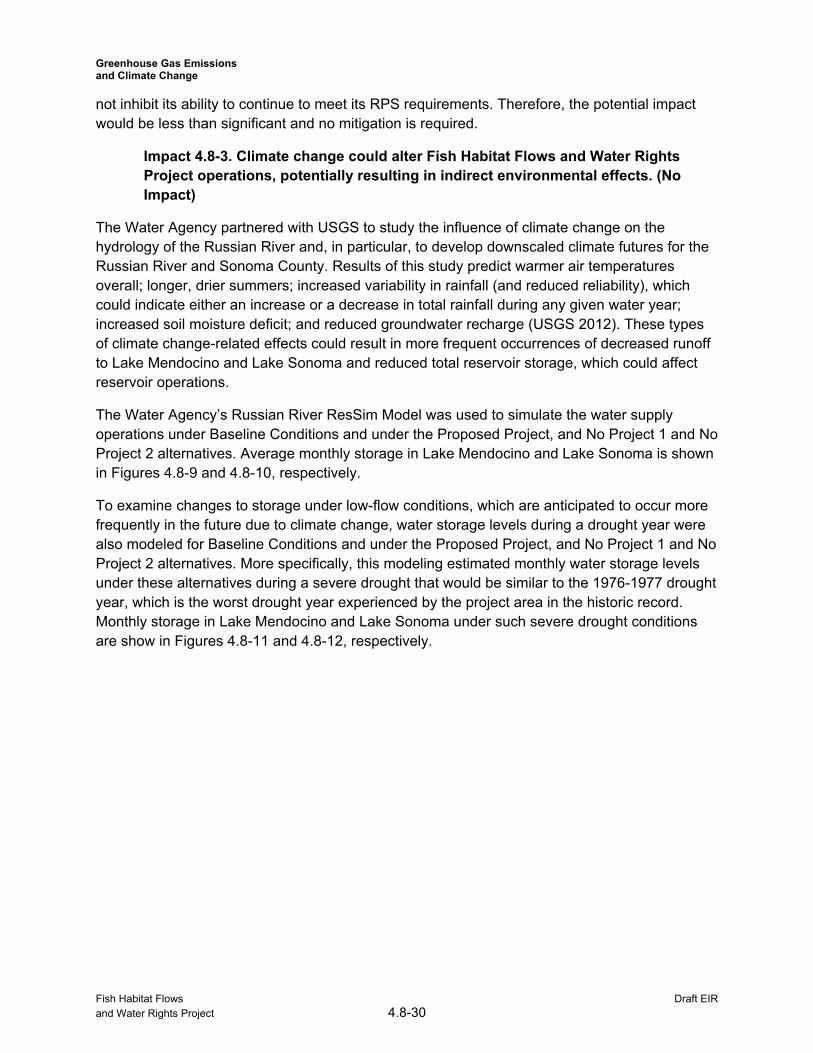
Greenhouse Gas Emissions and Climate Change
not inhibit its ability to continue to meet its RPS requirements. Therefore, the potential impact would be less than significant and no mitigation is required.
Impact 4.8-3. Climate change could alter Fish Habitat Flows and Water Rights Project operations, potentially resulting in indirect environmental effects. (No Impact)
The Water Agency partnered with USGS to study the influence of climate change on the hydrology of the Russian River and, in particular, to develop downscaled climate futures for the Russian River and Sonoma County. Results of this study predict warmer air temperatures overall; longer, drier summers; increased variability in rainfall (and reduced reliability), which could indicate either an increase or a decrease in total rainfall during any given water year; increased soil moisture deficit; and reduced groundwater recharge (USGS 2012). These types of climate change-related effects could result in more frequent occurrences of decreased runoff to Lake Mendocino and Lake Sonoma and reduced total reservoir storage, which could affect reservoir operations.
The Water Agency’s Russian River ResSim Model was used to simulate the water supply operations under Baseline Conditions and under the Proposed Project, and No Project 1 and No Project 2 alternatives. Average monthly storage in Lake Mendocino and Lake Sonoma is shown in Figures 4.8-9 and 4.8-10, respectively.
To examine changes to storage under low-flow conditions, which are anticipated to occur more frequently in the future due to climate change, water storage levels during a drought year were also modeled for Baseline Conditions and under the Proposed Project, and No Project 1 and No Project 2 alternatives. More specifically, this modeling estimated monthly water storage levels under these alternatives during a severe drought that would be similar to the 1976-1977 drought year, which is the worst drought year experienced by the project area in the historic record. Monthly storage in Lake Mendocino and Lake Sonoma under such severe drought conditions are show in Figures 4.8-11 and 4.8-12, respectively.
Fish Habitat Flows Draft EIR and Water Rights Project 4.8-30
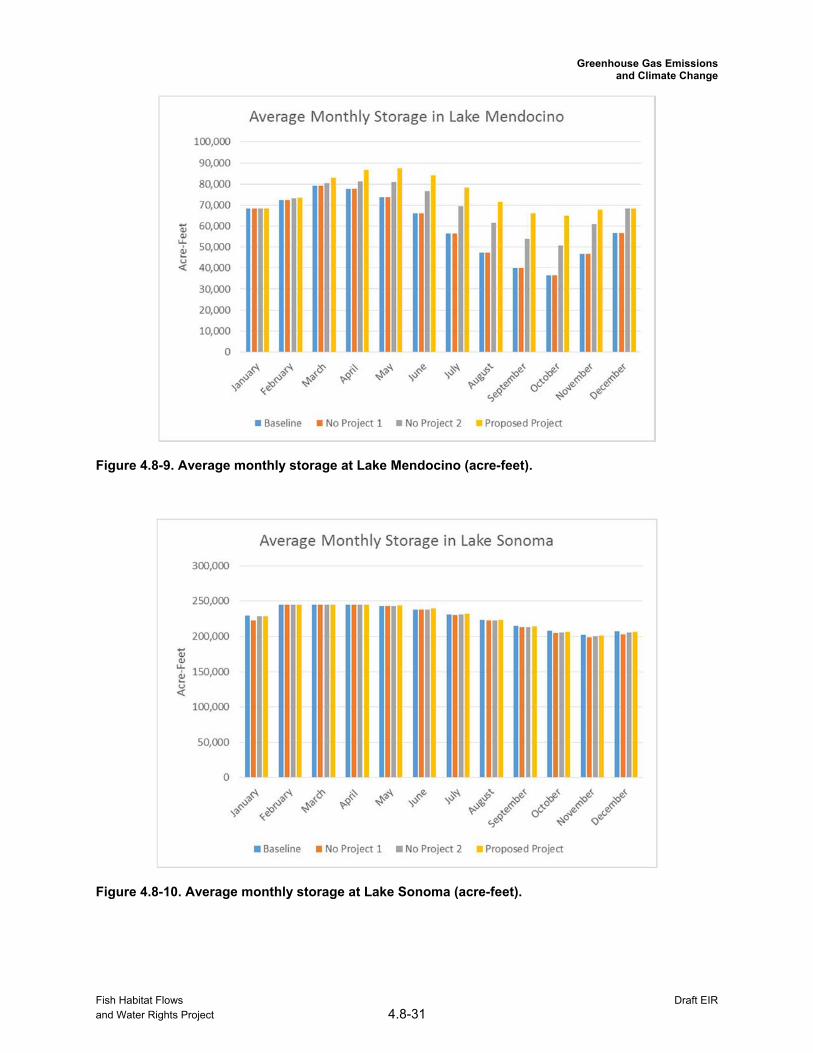
Greenhouse Gas Emissions and Climate Change
Figure 4.8-9. Average monthly storage at Lake Mendocino (acre-feet).
Figure 4.8-10. Average monthly storage at Lake Sonoma (acre-feet).
Fish Habitat Flows Draft EIR and Water Rights Project 4.8-31
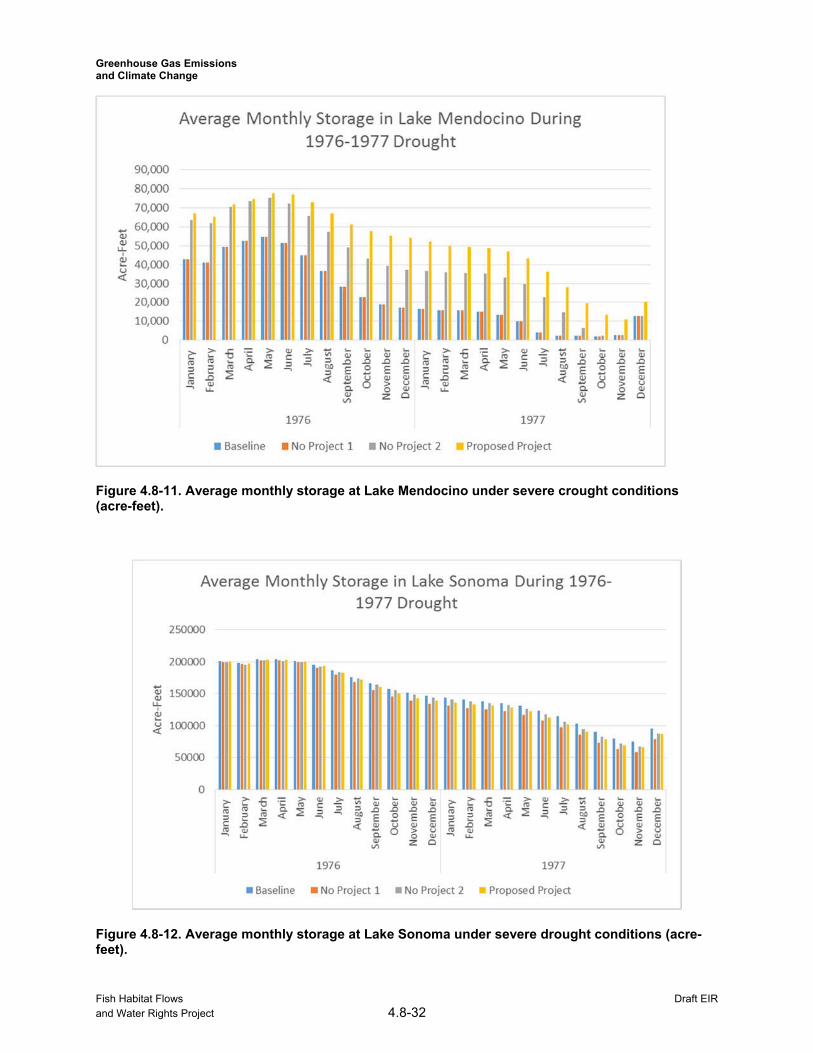
Greenhouse Gas Emissions and Climate Change
Figure 4.8-11. Average monthly storage at Lake Mendocino under severe crought conditions (acre-feet).
Figure 4.8-12. Average monthly storage at Lake Sonoma under severe drought conditions (acre-feet).
Fish Habitat Flows Draft EIR and Water Rights Project 4.8-32
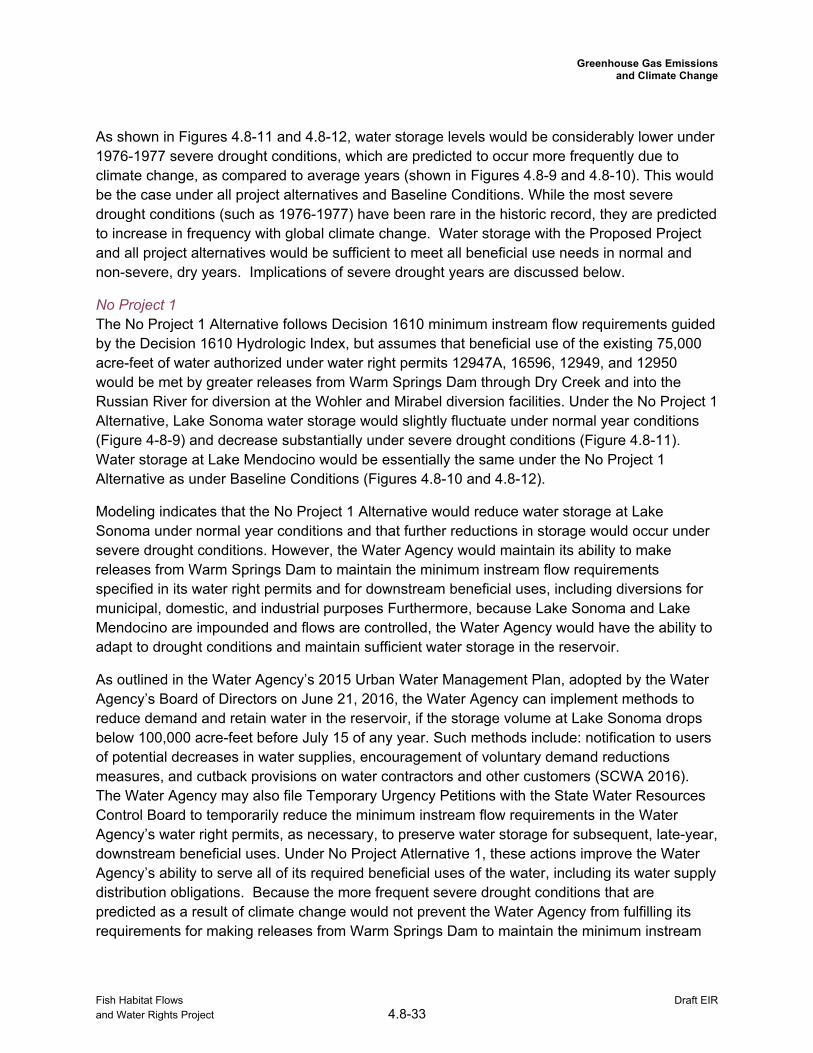
Greenhouse Gas Emissions and Climate Change
As shown in Figures 4.8-11 and 4.8-12, water storage levels would be considerably lower under 1976-1977 severe drought conditions, which are predicted to occur more frequently due to climate change, as compared to average years (shown in Figures 4.8-9 and 4.8-10). This would be the case under all project alternatives and Baseline Conditions. While the most severe drought conditions (such as 1976-1977) have been rare in the historic record, they are predicted to increase in frequency with global climate change. Water storage with the Proposed Project and all project alternatives would be sufficient to meet all beneficial use needs in normal and non-severe, dry years. Implications of severe drought years are discussed below.
No Project 1 The No Project 1 Alternative follows Decision 1610 minimum instream flow requirements guided by the Decision 1610 Hydrologic Index, but assumes that beneficial use of the existing 75,000 acre-feet of water authorized under water right permits 12947A, 16596, 12949, and 12950 would be met by greater releases from Warm Springs Dam through Dry Creek and into the Russian River for diversion at the Wohler and Mirabel diversion facilities. Under the No Project 1 Alternative, Lake Sonoma water storage would slightly fluctuate under normal year conditions (Figure 4-8-9) and decrease substantially under severe drought conditions (Figure 4.8-11). Water storage at Lake Mendocino would be essentially the same under the No Project 1 Alternative as under Baseline Conditions (Figures 4.8-10 and 4.8-12).
Modeling indicates that the No Project 1 Alternative would reduce water storage at Lake Sonoma under normal year conditions and that further reductions in storage would occur under severe drought conditions. However, the Water Agency would maintain its ability to make releases from Warm Springs Dam to maintain the minimum instream flow requirements specified in its water right permits and for downstream beneficial uses, including diversions for municipal, domestic, and industrial purposes Furthermore, because Lake Sonoma and Lake Mendocino are impounded and flows are controlled, the Water Agency would have the ability to adapt to drought conditions and maintain sufficient water storage in the reservoir.
As outlined in the Water Agency’s 2015 Urban Water Management Plan, adopted by the Water Agency’s Board of Directors on June 21, 2016, the Water Agency can implement methods to reduce demand and retain water in the reservoir, if the storage volume at Lake Sonoma drops below 100,000 acre-feet before July 15 of any year. Such methods include: notification to users of potential decreases in water supplies, encouragement of voluntary demand reductions measures, and cutback provisions on water contractors and other customers (SCWA 2016). The Water Agency may also file Temporary Urgency Petitions with the State Water Resources Control Board to temporarily reduce the minimum instream flow requirements in the Water Agency’s water right permits, as necessary, to preserve water storage for subsequent, late-year, downstream beneficial uses. Under No Project Atlernative 1, these actions improve the Water Agency’s ability to serve all of its required beneficial uses of the water, including its water supply distribution obligations. Because the more frequent severe drought conditions that are predicted as a result of climate change would not prevent the Water Agency from fulfilling its requirements for making releases from Warm Springs Dam to maintain the minimum instream
Fish Habitat Flows Draft EIR and Water Rights Project 4.8-33
Greenhouse Gas Emissions and Climate Change
flow requirements specified in its water right permits and for downstream beneficial uses, this impact would be less than significant and no mitigation is required.
No Project 2 The No Project 2 Alternative would follow the Russian River Biological Opinion minimum instream flow recommendations on the Russian River during the summer months guided by the Decision 1610 Hydrologic Index, but still assumes that beneficial use of the existing 75,000 acre-feet of water authorized under water right permits 12947A, 16596, 12949, and 12950 would be met by modified releases from Coyote Valley and Warm Springs dams. Under the No Project 2 Alternative, Lake Sonoma water storage quantities would be the same under normal year conditions (Figure 4.8-10) and decrease slightly under drought year conditions compared to Baseline Conditions (Figure 4.8-12). Water storage quantities at Lake Mendocino would generally be greater under the No Project 2 Alternative for both normal years and under drought conditions compared to Baseline Conditions (note that water quantities would be the same under Baseline Conditions toward the end of drought year conditions) (Figure 4.8-11).
Modeling indicates that the No Project 2 Alternative would not substantially reduce water storage quantities at Lake Sonoma and would generally increase water storage quantities at Lake Mendocino. Thus, the Water Agency would be able to maintain minimum instream flow requirements for making releases from Warm Springs Dam to maintain the minimum instream flow requirements specified in its water right permits and for downstream beneficial uses. Furthermore, as described above for impacts related to the No Project 1 Alternative, several options exist to further reduce demand and manage water quantities to maintain the minimum instream flow requirements in the Water Agency’s water right permits to preserve water storage for late-year, downstream beneficial uses. Thus, projected climate changes would not substantially hinder the ability of the Water Agency to manage reservoirs to continue to serve these functions under the No Project 2 Alternative. This impact would be less than significant and no mitigation is required.
Proposed Project The Proposed Project would follow the release schedule guided by the Russian River Hydrologic Index detailed in Chapter 3, Background and Project Description, and assumes that the beneficial use of the existing 75,000 acre-feet of water authorized under water right Permits 12947A, 16596, 12949, and 12950 would be met by modified releases from Coyote Valley Dam and Warm Springs Dam.
Under the Proposed Project, Lake Sonoma water storage quantities would be similar to Baseline Conditions in most years (Figure 4.8-10) and decrease slightly under drought year conditions, compared to Baseline Conditions (Figure 4.8-12). Water storage quantities at Lake Mendocino would generally be greater with the Proposed Project for most years and under drought conditions compared to Baseline Conditions (note that water quantities would be the same under Baseline during the early months of most years) (Figure 4.8-12).
Modeling indicates that the Proposed Project would not substantially reduce water storage in Lake Sonoma and would generally increase water storage in Lake Mendocino. Thus, the Water Agency would be able to maintain minimum instream flow requirements for releases from Warm
Fish Habitat Flows Draft EIR and Water Rights Project 4.8-34
Greenhouse Gas Emissions and Climate Change
Springs Dam, as specified in its water right permits and for downstream beneficial uses. Furthermore, as described above for impacts related to the No Project 1 and No Project 2 alternatives, several options exist to further manage water demand and storage to maintain the minimum instream flow requirements in the Water Agency’s water right permits as necessary to preserve water supply for subsequent, late-year, downstream beneficial uses. Thus, projected climate change effects would not substantially hinder the ability of the Water Agency to manage the reservoirs to continue to serve these beneficial uses with the Proposed Project. Therefore, this impact would be less than significant and no mitigation is required.
4.8.5 General Plans and Consistency The project area is located within Sonoma County, Mendocino County, and the City of Ukiah. Mendocino County and the City of Ukiah do not have climate action plans or GHG reduction plans and the general plans of these jurisdictions do not directly address climate change or include community-wide GHG reduction goals.
The Sonoma County General Plan 2020, however, includes the following goals, policies and objectives concerning GHG emissions and climate change relevant to the Proposed Project.
Goal OSRC 14: Promote energy conservation and contribute to energy demand reduction in the County.
Objective OSRC-14.4: Reduce greenhouse gas emissions by 25 percent below 1990 levels by 2015.
Policy OSRC-14j: Encourage the Sonoma County Water Agency and other water and wastewater service providers to reduce energy demand from their operations.
Goal OSRC-16: Preserve and maintain good air quality and provide for an air quality standard that will protect human health and preclude crop, plant and property damage in accordance with the requirements of the Federal and State Clean Air Acts.
Objective OSRC-16.1: Minimize air pollution and greenhouse gas emissions.
The Proposed Project is consistent with Sonoma County General Plan 2020. The Proposed Project would not require construction, operation, or maintenance of new facilities and, therefore would not result in an increase in GHG emissions. The Proposed Project, No Project 1 Alternative, and No Project 2 Alternative would be consistent with Sonoma County General Plan 2020.
Climate Action 2020 and Beyond Sonoma County is in the process of completing a Climate Action Plan, called Climate Action 2020 and Beyond, and its associated Environmental Impact Report. This climate action plan addresses all GHG emissions in Sonoma County including the nine incorporated cities in the county. The Sonoma CAP consists of 20 GHG reduction measures, which are presented in Section 4.8.3, “Regulatory Setting” above.
Fish Habitat Flows Draft EIR and Water Rights Project 4.8-35
Greenhouse Gas Emissions and Climate Change
Implementation of the No Project 1 and No Project 2 Alternatives, and the Proposed Project, would change minimum instream flow requirements and releases from Lake Mendocino and Lake Sonoma. It would not involve changes to buildings, transportation, solid waste generation, or livestock and fertilizers. While it does affect water resources, it would not affect water consumption rates, recycled water quantities, or water and wastewater infrastructure. There would be no changes to production of energy at Warm Springs Dam under the project alternatives. Thus, No Project 1, No Project 2, and the Preferred Alternatives would be consistent with the Sonoma County CAP.
City of Ukiah CAP The goals and strategies of the City of Ukiah CAP are also presented in Section 4.8.3, “Regulatory Setting” above.
Implementation of the No Project 1 and No Project 2 Alternatives, and the Proposed Project would change minimum instream flow requirements and releases from Lake Mendocino and Lake Sonoma. It would not involve changes to transportation and land use or solid waste generation. While it does affect water resources, it would not affect water consumption rates or recycled water quantities. The No Project 2 Alternative and the Proposed Project would decrease the amount of electricity generated at Coyote Valley Dam on Lake Mendocino, which qualifies as a renewable source of electricity pursuant to RPS requirements. As discussed under Impact 4.8-3, the decrease in electricity generation would not be substantial and would not impede the City of Ukiah’s ability to meet its RPS requirements.
Fish Habitat Flows Draft EIR and Water Rights Project 4.8-36
Greenhouse Gas Emissions and Climate Change
4.8.6 References ARB. 2014. "First Update to the AB 32 Scoping Plan." California Air Resources Board.
http://www.arb.ca.gov/cc/scopingplan/2013_update/first_update_climate_change_scopin g_plan.pdf.
—. 2011. "Initial AB 32 Climate Change Scooping Plan." California Air Resources Board. Accessed July 2016. http://www.arb.ca.gov/cc/scopingplan/document/scopingplandocument.htm.
California Energy Commission. 2015. "2015 Power Content Label." Accessed July 2016. http://www.energy.ca.gov/pcl/labels/2014_labels/all_labels/Ukiah.pdf. Accessed: July 2016.
—. 2016. "Energy Consumption Data Management System." Accessed July 2016. http://ecdms.energy.ca.gov/elecbyutil.aspx.
CDWR. 2008. Managing an Uncertain Future: Climate Change Adaptation Strategies for California’s Water. California Department of Water Resources. Accessed August 2016. http://www.water.ca.gov/climatechange/ docs/ClimateChangeWhitePaper.pdf.
City of Ukiah. 2016. "2013 power Content Label." April 5. Electric Utility Department: http://www.cityofukiah.com/electric-utility/.
—. 2014. "City of Ukiah Climate Action Plan." http://www.cityofukiah.com/NewWeb/wp-content/uploads/2013/05/Final-Draft_Climate_Action_Plan.pdf.
CNRA. 2012. Our Changing Climate: Vulnerability & Adaptation to the Increasing Risks of Climate Change in California. California Natural Resources Agency. Accessed August 2016. http://www.energy.ca.gov/2012publications/CEC-500-2012-007/CEC-500-2012-007.pdf.
Goldenfum, Joel Avruch. 2012. "Challenges and solutions for assessing the impact of freshwater resevoirs on natural GHG emissions." Ecohydrology and Hydrobiology 12 (No.2): 115-122.
Grand Valley State University. 2016. "Seasonal Lake Stratification." Accessed July 2016. http://faculty.gvsu.edu/videticp/stratification.htm.
Grandi, Mel. 2016. "Personal Communication." June 28.
IHA. 2010. GHG Measurement Guidelines for Freshwater Reservoirs. International Hydropower Association. Accessed August 2016. https://www.hydropower.org/sites/default/files/publications-docs/GHG%20Measurement%20Guidelines%20for%20Freshwater%20Reservoirs.pdf.
Fish Habitat Flows Draft EIR and Water Rights Project 4.8-37
Greenhouse Gas Emissions and Climate Change
IPCC. 2013. "Carbon and Other Biogeochemical Cycles." International Panel on Climate Change. https://www.ipcc.ch/pdf/assessment-report/ar5/wg1/WG1AR5_Chapter06_FINAL.pdf.
—. 2014. "Summary for Policymakers." Climate Change 2014 Synthesis Report. Intergovernmental Panel on Climate Change. Accessed July 2016. https://www.ipcc.ch/pdf/assessment-report/ar5/syr/AR5_SYR_FINAL_SPM.pdf.
SCWA. 2016. "2015 Urban Water Management Plan." Accessed July 2016. http://www.scwa.ca.gov/files/docs/water-resources/Sonoma%20CWA%202015% 20UWMP%20June%201%202016_acc.pdf.
—. 2015. "Brochure: Carbon Free Water." Sonoma County Water Agency.
—. 2016. "Energy and Sustainability Projects ." Sonoma County Water Agency. Accessed July 2016. http://www.scwa.ca.gov/energy-sustainability-projects/.
SCWA. 2015. Water Agency Reliability Report. Sonoma County Water Agency. Accessed July 2016. http://www.scwa.ca.gov/files/docs/projects/rrifr/stateboard/2015/Water Agency_ReliabilityReport_30apr15_Packet.pdf.
Sonoma County. 2015. "Climate Ready Sonoma County: Climate Hazards and Vulnerabilities." Accessed July 2016. http://www.sctainfo.org/pdf/Climate%20Ready_Hazards_Vulnerabilities.pdf.
—. 2008. "Sonoma County General Plan 2020." Accessed July 2016. http://www.sonoma-county.org/PRMD/gp2020/index.htm.
Tranvik, Lars J, John A Downing, James B Cotner, Steven A Loiselle, Robert G Striegl, Thomas J Ballatore, Peter Dillon, et al. 2009. "Lakes and Reservoirs as Regulators of Carbon Cycling and Climate." Limonology and Oceanography 54 (6, part 2): 2298-2314.
University of Minnesota. n.d. "Overview of Causes and Effects of Global Climate Change." Accessed July 2016. http://zadeh.ugent.be/liming/books/climag/causes/.
USACE. 2008. "Biological Opinion for Water Supply, Flood Control Operations, and Channel Maintenance conducted by the U.S. Army Corps of Engineers, the Sonoma County Water Agency, and the Mendocino County Russian River Flood Control and Water Conservation [...]." U.S. Army Corps of Engineers. Accessed July 2016.
USACE. 1973. Environmental Impact Statement. Warm Springs Dam and Lake Sonoma Project. Russian River Basin, Sonoma County, California: U.S. Army Corps of Engineers.
USGS. 2012. "Simulation of Climate Change in San Fransisco Bay Basins, California: Case Studies in the Russian River Valley and Santa Cruz Mountains." Scientific Investigations Report 2012-5132. U.S. Geological Survey.
Fish Habitat Flows Draft EIR and Water Rights Project 4.8-38