chapter 4i.bnet.com/whitepapers/compuwaredebuggingbook.pdf · margosis’s blog (—he’s done the...
TRANSCRIPT


151
Chapter 4
Common .NET Debugging Questions
In this chapter:
Process- and Infrastructure-Related Questions. . . . . . . . . . . . . . . . . . . . . . . . . . . . .151
Visual Studio Bugs . . . . . . . . . . . . . . . . . . . . . . . . . . . . . . . . . . . . . . . . . . . . . . . . . . . . .165
Designing for Debugging. . . . . . . . . . . . . . . . . . . . . . . . . . . . . . . . . . . . . . . . . . . . . . .166
Debugger Questions . . . . . . . . . . . . . . . . . . . . . . . . . . . . . . . . . . . . . . . . . . . . . . . . . . .170
Debugging Scenario Questions . . . . . . . . . . . . . . . . . . . . . . . . . . . . . . . . . . . . . . . . . .177
What Tools Do You Use? . . . . . . . . . . . . . . . . . . . . . . . . . . . . . . . . . . . . . . . . . . . . . . . .185
Summary . . . . . . . . . . . . . . . . . . . . . . . . . . . . . . . . . . . . . . . . . . . . . . . . . . . . . . . . . . . . .195
The best part about writing books and articles, in addition to speaking at conferences, is get-ting the questions from developers about debugging and .NET in general. Although I do get a few “my application doesn’t run—what do I do?” e-mails, most of the questions are well thought out and make me look at areas of .NET I normally don’t get a chance to work with—it’s a great learning experience for me. In fact, I enjoy the questions so much I will feel lonely if I don’t get an e-mail question from each of you who purchase the book.
Since the last edition of this book, I’ve been keeping a list of all the questions I’ve been asked, and I want to answer the most common of those. Obviously, many of them apply to debug-ging .NET applications, but having gotten many questions about other aspects of develop-ment, I wanted to answer those also. Because of the breadth and depth of .NET development, I may not answer your particular burning question in this chapter, but I can guarantee you’ll learn something.
Process- and Infrastructure-Related QuestionsMany questions I’ve gotten are about debugging and process-related issues. Although I’ve done my best to make Chapter 1, “Bugs: Where They Come From and How You Solve Them,” and Chapter 2, “Preparing for Debugging,” which discussed those issues, as complete as pos-sible, I still get many questions about those issues. Additionally, some common questions are even about the nature of using computers.
C04622027.fm Page 151 Monday, October 9, 2006 10:34 AM

152 Part I The Gestalt of Debugging
Why must you always develop as a non-admin?
If you are logging on to your computer using an account with administrator privileges, you need to raise your right hand and repeat after me: “I do solemnly swear that by the time I get to the end of this question’s answer, I will put this book down and immediately correct the sit-uation. Additionally, I will make all my coworkers do the same.” There is absolutely no reason at all for logging in with administrator rights to develop software! The only time you need to use an account with administrator rights is if you are debugging across user accounts. Fortunately, it’s easy to start individual processes with greater rights so you can do the debugging.
One of the most important features of Microsoft Windows Vista is User Account Control (UAC), which defaults users to less privileged accounts and prompts for required credentials whenever a process tries to do something that needs higher privileges. Even with the release of Windows Vista imminent, we will realistically be developing on and using Microsoft Win-dows XP and Microsoft Windows Server 2003 for many years before we have most of our development teams using the new operating system. That doesn’t even consider the end-user or corporate-user scenario, which will take even longer to migrate over.
The most important reason you need to be developing without administrator rights, in other words using a limited user account, is to ensure that your application works correctly on a less privileged account. As someone who’s been developing as a limited user for years, it’s hugely frustrating to run an application and see it crash or have an unhandled exception because the developers assumed that everyone runs with administrator rights. This is a completely preventable bug that tells the user that the developers are lazy and certainly aren’t doing their job.
The good news is that on Windows XP and Windows Server 2003, it’s easy to find all the tricks because there’s now an excellent Web site that will get you started: Jonathan Hardwick’s http://nonadmin.editme.com. Many of the links and articles on the Web site point to Aaron Margosis’s blog (http://blogs.msdn.com/aaron_margosis)—he’s done the best writing on the subject. Both Web sites are excellent and are part of your required reading.
The main idea behind using your computer without administrator rights is that you’ll use the Runas.exe program that comes with Windows to start particular processes as a user with administrator rights on that machine. For example, if you wanted to debug a Microsoft ASP.NET application running inside Internet Information Services (IIS), the debugger would need administrator rights to debug across the user accounts (your account to Local Service), so you would run the following command (assuming that Microsoft Visual Studio is in the path and the account you want to use is Administrator):
runas /u:Administrator devenv.exe
The runas command will prompt you for the Administrator account password, and after you type it, Visual Studio will start. From the new instance of Visual Studio, you can now debug the IIS-based application without exposing your whole system to viruses and spyware
C04622027.fm Page 152 Monday, October 9, 2006 10:34 AM

Chapter 4 Common .NET Debugging Questions 153
because you logged in as an administrator. Note that you can also use Mark Russinovich’s excellent Psexec.exe program (http://www.sysinternals.com/Utilities/PsExec.html), which even allows you to start programs on other machines.
The last thing I want to mention about runas is that when you start a program with it, the pro-gram is using the profile from a different user, not the logged-in user. You probably already guessed that, but I’ve seen people get tripped up with setting an environment variable in their logged in account and wonder why their program started with runas doesn’t see the environ-ment variable.
If you’re still not convinced that running with a non-administrator account is worthwhile, you should read the wonderful study done by Andrew Garcia in the magazine eWeek, “Is System Lockdown the Secret Weapon?” (http://www.eweek.com/article2/0,1759,1891447,00.asp). He took two fully patched systems, one running Microsoft Windows 2000 Professional SP4 and the other running Windows XP Professional SP2, and surfed some not-so-good Web sites using Administrator, Power User, and User accounts. After each surfing session, he ran spy-ware scans. On Windows XP, the Administrator and Power User accounts had 16 total threats! In setting up my friends’ and family members’ machines so they all run as a limited user, I’ve eliminated nearly all the spyware and virus calls I used to get.
The http://nonadmin.editme.com site does a great job of getting you started, but I wanted to share some of my tips about running and developing in a limited user account to help you make the transition. The Runas program is great from the command line, but there’s a hidden feature with shortcuts (.lnk files) that I like to use to automatically be prompted for the user account to run in when clicking the shortcut. After you’ve created the .lnk file, right-click its icon and select Properties from the shortcut menu. On the Shortcut tab, click Advanced to open the Advanced Properties dialog box. If you select the first check box, Run With Different Credentials, now whenever you double-click the shortcut, you’ll be prompted with the Run As dialog box, shown in Figure 4-1, in which you can specify the user name and password to run the application.
Figure 4-1 Shortcut prompt for user account
C04622027.fm Page 153 Monday, October 9, 2006 10:34 AM

154 Part I The Gestalt of Debugging
This is a very convenient way to start applications such as Visual Studio. However, there seems to be a bug in saving the shortcut, because if you change other values in the .lnk file properties, Windows Explorer randomly forgets that you selected the Run With Different Cre-dentials check box. To work around this bug, make all the other changes to the shortcut and save those changes. Go back into the Properties dialog box for the shortcut and select the Run With Different Credentials check box as the last change.
One shortcut I like to set up with Run With Different Credentials is one to a Command Prompt. If the Command Prompt is running with administrator privileges, any applications you start from it are also under the same account. If you need to run multiple items with administrator privileges, this trick is very convenient. I even change the icon for that link to be a pirate skull and bones so it appears when pressing Alt+Tab thus helping me find it quickly.
When logged on with limited privileges, you sometimes need to access to Windows Explorer to set security on a directory or set up a share. To allow you to run Windows Explorer for another account, you’ll first need to log on to that account and then set Windows Explorer to use separate instances. On the Tools menu, select Folder Options, click the View tab, and in the Advanced Settings box, scroll down and select the Launch Folder Windows In A Separate Process check box. It is a very good idea to enable this setting in general because each Explorer window is in a separate process—if one hangs, you don’t hang the desktop, the taskbar, and everything else on the machine.
From your limited user account, you can now use Runas.exe or the shortcut trick I just dis-cussed to start Windows Explorer for the account with administrator privileges. The only problem is that now you’ll have trouble telling your limited account’s Explorer windows from your administrator privilege account’s windows. Fortunately, that’s easy to fix with a bitmap and a registry key; the technique works with all Windows operating systems and CPUs. For the account with administrator privileges you want to use, set the HKEY_CURRENT_USER\Software\Microsoft\Internet Explorer\Toolbar key, BackBitmap string value to the complete file name of a bitmap file you want displayed behind the Microsoft Internet Explorer and Windows Explorer toolbars. I use a solid red 32 x32 pixel bitmap to make it completely obvious which windows have administrator privileges.
There’s a fairly nasty bug you’re going to run into running Windows Explorer in an account with administrator privileges when logged on with limited privileges. The UI of the Explorer instance running with administrator privileges does not properly refresh. When you delete a file, it’s deleted, but the UI doesn’t reflect the change. Just get in the habit of pressing F5 after each operation to force the refresh.
One of the greatest contributions that Aaron Margosis made in his quest to having everyone running in limited privileges accounts is a deceptively simple batch file that solves the hardest problem: temporarily grant your limited account administrator privileges. His script is called MakeMeAdmin (http://blogs.msdn.com/aaron_margosis/archive/2004/07/24/193721.aspx).
C04622027.fm Page 154 Monday, October 9, 2006 10:34 AM

Chapter 4 Common .NET Debugging Questions 155
Now you can log on with your domain account as a limited privilege account on your devel-opment computer, but if you need to run something that needs both network access and administrator privileges on the computer, you’re in business.
Using your computer as a limited user works great until you need to access something in Con-trol Panel. You’ve had great luck with Runas to install applications and perform other tasks that require administrator privileges, but you’ll eventually run into the wall with Control Panel. When you attempt to start Control.exe from Runas.exe, you will find that no window appears. This is incredibly frustrating and means you have to start Windows Explorer with administrator privileges and browse to My Computer\ Control Panel in Explorer’s folder view so you can click the particular item you want.
Fortunately, there’s an easy workaround, but it appears to be undocumented. Go ahead and start Control Panel from your limited privilege account. You may have noticed that in Explorer, if you right-click an executable, one of the menu items is Run As, which brings up the same dialog box shown in Figure 4-1 so you can type the user credentials. If you right-click a Control Panel application, you see Open, but no Run As. However, if you hold down the Shift key and right-click, the elusive Run As command will appear so you can start that indi-vidual Control Panel application with different credentials!
From a debugging standpoint, the only difference is if you need to debug across accounts, you’ll need to start the debugger to run with administrator privileges. If you want to debug a process that’s running under your limited account, you can run Visual Studio in your limited account and debug all day long. Not only is saving yourself from viruses and spyware always worthwhile, but if there’s any chance that your application could be run in limited accounts, you are developing and testing the application in the same usage scenarios as those of your application’s users.
Now that you’ve read this whole question, I’ll remind you of your promise to put the book down and go set up your development machines so your main account has limited privileges. Some of you might be grumbling that running as a limited user isn’t worth the pain, but I hope I’ve proven to you that it’s well worth it. You have no excuse not to do the right thing. The book will wait; your customers and users will not.
What’s the secret to debugging?
In my consulting work, everyone asks if there is a single key to debugging better to produce great code. I’ll sum up the secret in two words: code coverage. Code coverage is simply the per-centage of lines (or blocks) you’ve executed in your module. If 100 lines are in your module and you execute 85, you have 85 percent code coverage. The simple fact is that a line not executed is a line waiting to crash. I’m to the point now at which I enter “religion mode” because I believe in code coverage so much. If you were standing in front of me right now, I’d be jumping up and down and extolling the virtues of code coverage with evangelical fervor. Many developers tell me that taking my advice and trying to get good code coverage has paid off with huge improvements in code quality. It works, and is the only secret there is.
C04622027.fm Page 155 Monday, October 9, 2006 10:34 AM

156 Part I The Gestalt of Debugging
You can get code-coverage statistics in two ways. The first way is the hard way and involves using the debugger and setting a breakpoint on every single line in your module. As your module executes a line, clear the breakpoint. Continue running your code until you’ve cleared all the breakpoints, and you have 100 percent coverage. With .NET, there are far easier ways. If you have either Visual Studio Team Developer Edition, Visual Studio Tester Edition, or Visual Studio Team Suite Edition, you have an excellent code-coverage product built right in. Alternatively, you can use the free NCover (http://www.ncover.net). There are other tools out there, but those are the two I use. Personally, I don’t check in any code to the master sources until I’ve executed at least 85 to 90 percent of the lines in my code. I know some of you are groaning right now. Yes, getting good code coverage can be time consuming. Sometimes you need to do far more testing than you ever considered, and it can take awhile. Getting the best coverage possible means that you need to run your application in the debugger and change data variables to execute code paths that are hard to hit though normal execution. Your job is to write solid code, however, and in my opinion, code coverage is about the only way you’ll get it during the unit test phase.
Granted, I don’t expect developers to test on every flavor of the operating system that custom-ers might be using. However, if engineers can get 90 percent coverage on at least one operating system, the team wins 66 percent of the battle for quality. If you’re not using a code-coverage tool, you’re cheating yourself on quality. When it comes to debugging, you can’t debug code that isn’t executing. By driving the code coverage during your unit tests to high levels, you’re doing the most effective debugging possible: executing the code!
What sort of development methodology should I use?
A Google search for “software development methodologies” yields 82,600,000 different links (at the time I wrote this) expounding on all sorts of wild-sounding names: Adaptive Software Development, Scrum XP (Extreme Programming, not the operating system), Context Driven Testing, Test Driven Development (TDD), and many more. It gets even more confusing when you realize that there are 10 to 15 different versions of Agile development. In addition, people are extremely passionate about their chosen methodology. The last thing you want to do is get caught in the middle of a rumble between Chrystal and Scrum supporters. It’s just like the Capulets and the Montagues, but without the sexy iambic pentameter.
I very much like the ideas of Agile development because they’ve done a good bit to help focus developers on quality, and I try to use the appropriate form of Agile development on all my projects. However, like most things in software, you just can’t walk in to the office one day and say, “We’re going to be a Scrum shop!” What you need to do is have everyone, including upper management, do a complete dump on what went right and wrong on the last few develop-ment cycles. You can use that as a base to start your research into the pros and cons of differ-ent methodologies. You’ll be looking for the one that best matches the type of development you are doing.
C04622027.fm Page 156 Monday, October 9, 2006 10:34 AM

Chapter 4 Common .NET Debugging Questions 157
This is a major undertaking in which you have to have absolute full support from manage-ment to do the experimenting and learning to change how your shop works. The ideal situation is to try to pilot different methodologies on smaller pieces of the development. The goal is to try to get an apples-to-apples comparison on what will work best in your develop-ment shop.
I’d also strongly recommend getting real training for managers and developers in the methodologies you are interested in. It’s one thing to read a book on how to use the Windows Presentation Foundation, but a whole other problem to tackle the fuzziness of software development methodologies that way. The whole team has to go to this training, not just one or two members, so you can practice as a team, and most importantly, think about the ramifications of the ideas as they relate to your company.
When it comes down to the level of developers with their day-to-day work, I’m a firm believer in the precepts of Test Driven Development (TDD)—the idea of developing test cases right along with your code. I’m not a zealot who goes off and blindly follows the extreme view of writing all the tests before I ever tackle a line of the actual code. For me it’s an iterative approach. For example, I’ll write the parameter checking for a method and then write the tests to call the method with all the good and bad conditions. If you look at the code for the book, you’ll also see that my tests are always compiled with the main application code so that no unit tests are ever out of date.
Should we do code reviews?
Absolutely! Unfortunately, many companies go about them in completely the wrong way. One company I worked for required formal code reviews that were straight out of one of those only-in-fantasyland software engineering textbooks I had in college. Everything was role-based: there was a Recorder for recording comments, a Secretary for keeping the meeting moving, a Door Keeper to open the door, a Leader to suck oxygen, and so on. All that you really had, however, were 40 people in a room, none of whom had read the code. It was a huge waste of time.
The kind of code reviews I like are the one-on-one informal kind. You simply sit down with a printout of the code and read it line by line with the developer. As you read it, you’re keeping track of all the input and output so that you can see what’s happening in the code. Think about what I just wrote. If that sounds perilously close to debugging the code, you’re exactly right. Focus on what the code does—that’s the purpose of a code review.
One of the wonderful members of the Review Crew, who reviewed this book as I was writing it, pointed out that on one project he was on, the management dictated that these informal code reviews be done before checking in any code. His reaction was, “This is absolutely nuts, and they won’t accomplish anything!” As he was forced to go through with the reviews, he was pleasantly surprised at how much good advice and bug fixes came out of the review. Even better, the overhead was so much lower than that from actual debugging.
C04622027.fm Page 157 Monday, October 9, 2006 10:34 AM

158 Part I The Gestalt of Debugging
Another trick for ensuring that your code reviews are worthwhile is to have the junior devel-opers review the senior developer’s code. Not only does that teach the less-experienced developers that their contribution is valuable, but it’s also a fine way to teach them about the product and show them great programming tips and tricks.
When you’re doing these code reviews, your focus is on finding logic errors and bugs and making performance tweaks. The first step is to do a very quick read-through after the devel-oper has given a verbal presentation on his requirements and a general description of how he went about solving the problem. What you’re looking for here is if the developer is meeting the requirements. The reviewer has already read the code, but this gives the developer the chance to explain the reason why the developer picked certain implementations and handled situations the way they did. These reviews are also where the reviewer asks the general ques-tions he composed during the initial reading.
The next step is the bulk of the review: reading through the code with the developer. In this stage, you’re manually executing the code. When I do this, I like to sit down, start with good data passed into the module, and follow the flowthrough. As I’m reading, I’m asking the devel-oper who wrote the code the detail questions I came up with in my prior reading.
The key to this process is that confrontation is absolutely not allowed. I know it’s sometimes very hard to avoid offending people when reading their code, but it’s not the job of the reviewer to show any superiority, only to make suggestions. The one way to prevent confron-tation is by keeping the two or three folks doing the code reviews together so they are very aware that if they get out of line, their turn in the review seat is next and their reviews will be done by the person whose code they are currently reviewing.
What do we do if we’re having trouble reproducing builds sent to others outside the team?
Every time you do a build for someone outside the team, you should make a complete copy of the project build directory on CD/DVD or tape. This copy will include all your source files, the intermediate files, the symbol files, and the final output. Also include the installation kit that you sent the customer. CD/DVDs and tapes are inexpensive insurance against future problems.
Even when I’ve done everything possible to preserve a particular build in version control, I’ve still experienced cases in which a rebuild produced a binary that differed from the original. By having the complete build tree archived, you can debug the user’s problem with exactly the same binaries that you sent.
What additional C# compiler options will help me with my proactive debugging of managed code?
Although managed code eliminates many of the most common errors that plagued us with native code, certain errors can still affect your code. Fortunately, there are some fine com-mand-line options to help find some of those errors. The good news about Microsoft Visual
C04622027.fm Page 158 Monday, October 9, 2006 10:34 AM

Chapter 4 Common .NET Debugging Questions 159
Basic is that it has all the appropriate defaults, so no additional compiler switches are neces-sary. If you don’t want to set all of these manually, the SettingsMaster add-in from Chapter 7, “Extending the Visual Studio IDE,” will do the work for you.
/checked+ (Check Integer Arithmetic)
You can specify the checked keyword around potential problem areas, but it’s something you have to remember to do as you’re typing the code. The /checked+ command-line option will turn on integer underflow and overflow checking for the whole program. If a result is out-side the range of the data type, the code will automatically throw a run-time exception. This switch will cause quite a bit of extra code generation, so I like to leave it on in debug builds and look for the places in code where I would need to use the checked keyword for explicit checking in release builds. To turn this switch on, in the project Properties, select the Build tab and click Advanced. In the Advanced Build Settings dialog box, select the Check For Arithmetic Underflow/Overflow check box.
/noconfig (Ignore Csc.rsp)
Interestingly, you can’t set this switch in Visual Studio. However, it’s worth knowing what the switch can allow you to do if you want to build from the command line. By default, the C# compiler reads in the Csc.rsp file to set default command-line options before it processes the command line. You can set any valid command-line options in that file you want to be globally applied. In fact, the default supplied Csc.rsp file includes a slew of /REFERENCE command-line options to common assemblies that we all use over and over. If you’ve ever wondered why you don’t need to specifically reference something like System.XML.dll, it’s because System.XML.dll is included in Csc.rsp with the /r: System.XML.dll switch. Csc.rsp is located in the .NET Frame-work version directory, %SystemRoot%\Microsoft.NET\Framework\Framework_Version.
What CPU should I set my build to?
The default for .NET applications is anycpu, and you should leave it at that. That enables what I think is one of the most interesting features in .NET: automatic bitness. What that means is that your application automatically becomes a full-fledged 64-bit application on 64-bit machines. I think it’s amazing that for the price of a single compile, you have a binary that will run as a natural binary on 32-bit CPUs, 64-bit CPUs, and even the 64-bit Itanium.
The automatic bitness can, though, come back to hurt you. If your code relies on an in-process DLL, either through COM or straight Platform Invoke (PInvoke), you might be in for a shock the first time you run on a 64-bit system. Since your program is loaded and automatically switches to being a 64-bit application, what do you think happens when you go to load that 32-bit dependency you have? Suddenly, your application is no longer happy, and you’re deal-ing with an unexpected unhandled exception.
If you are dependent on a 32-bit native DLL, you’ll want to look at building your application with the /platform:x86 switch to ensure that your code will run on all .NET platforms.
C04622027.fm Page 159 Monday, October 9, 2006 10:34 AM

160 Part I The Gestalt of Debugging
The 64-bit version of the .NET Framework also installs the 32-bit version, so your code will still run just fine. This does not excuse you from testing on 64-bit operating systems at all. Consider this the perfect excuse to justify an x64 box in your office.
As I mentioned in Chapter 2, I did much of the development for this book on Windows XP Professional x64 Edition. What’s been interesting about being an early adopter of 64-bit tech-nology is finding out how much code is still making bad pointer-size assumptions. This is especially prevalent on PInvoke declarations. Even if your code does not knowingly rely on any 32-bit DLLs, you can still cause havoc with incorrectly sized structures.
The one structure I’ve seen consistently wrong is the NMHDR structure, which is the basis of the shell notifications for all the common controls. The problem is that the MSDN documen-tation shows the wrong structure, not the one that’s actually in the headers. The documenta-tion says that the second field is a UINT (unsigned integer), but the actual type is UINT_PTR (unsigned integer pointer) If you’re hand-crafting PInvoke declarations, go directly to the headers and verify exactly what the native types are. The correct C# declaration is as follows:
[StructLayout(LayoutKind.Sequential)]
public struct NMHDR
{
public IntPtr hwndFrom;
public IntPtr idFrom;
public int code;
}
Even if you get your structure declarations from the wonderful http://www.PInvoke.net, dou-ble-check them anyway. I updated the NMHDR definition on the site, but I’m sure there are others that don’t properly account for 64-bit variants.
When should I freeze upgrades to the compiler and other tools?
Once you’ve hit feature complete, also known as beta 1, you should definitely not upgrade any tools. You can’t afford the risk of a new compiler optimization scheme, no matter how well thought out, changing your code. By the time you hit beta 1, you’ve already done some signif-icant testing, and if you change the tools, you’ll need to restart your testing from zero.
Is there anything I can do to speed up the Source Server when I first debug a program?
The Source Server support in Srcsrv.dll executes your version-control system to pull files one at a time. If your version-control software or network isn’t the fastest in the world, you may start dreading bouncing around the stack while debugging because you’ll be waiting for the file to show up. Fortunately, there’s a way to pre-pull the source code versions in a binary—by using the Srctool.exe program.
When I described in Chapter 2 how Source Server performed the source indexing, I mentioned that the Source Server code uses Srctool.exe to extract the names of the source files in a PDB.
C04622027.fm Page 160 Monday, October 9, 2006 10:34 AM

Chapter 4 Common .NET Debugging Questions 161
The developers added many more capabilities to the tool, which you can see by passing ? on the command line. The -x and -d options are the interesting options: -x tells Srctool.exe to do an extraction operation on a specified PDB file, and -d is followed by the destination directory of the extraction. Note that all the -x switch does is extract all the source files indexed in the PDB file.
There’s a small bug in the Srctool.exe directory parsing that you need to be aware of. If you spec-ify C:\Symbols\Source, the actual directory will be C:\Symbols\Source\Src because Srctool.exe appends the SRC no matter what. What I do is extract the files to a temporary directory and copy the directories under the SRC file to my cache directory to work around the bug.
How does ConditionalAttribute work?
There’s a good bit of confusion and misinformation about ConditionalAttribute and condi-tional compilation, so I want to clear up exactly what happens in both. Because code is worth a million words of prose, I’ll use the following program to show exactly what’s happening:
using System;
using System.Collections.Generic;
using System.Text;
using System.Diagnostics;
namespace CondComp
{
class Program
{
[Conditional ( "DEBUG" )]
static void ConditionalWriteALine ( String data )
{
Console.WriteLine ( data );
}
#if DEBUG
static void IfDefWriteALine ( String data )
{
Console.WriteLine ( data );
}
#endif
static String ReturnData ( String data )
{
return ( data );
}
static void Main ( string [] args )
{
ConditionalWriteALine ( ReturnData ( "Hello from " ) +
ReturnData ( "ConditionalWriteALine" ));
#if DEBUG
IfDefWriteALine ( ReturnData ( "Hello from " ) +
ReturnData ( "IfDefWriteALine" ));
#endif
}
}
}
C04622027.fm Page 161 Monday, October 9, 2006 10:34 AM

162 Part I The Gestalt of Debugging
By applying ConditionalAttribute to a method, which can have only a void return value because of the way ConditionalAttribute is declared, you’re telling the compiler to not generate any calls to that method if the defined value is not specified with the /define: compiler switch. The compilers are also smart enough to look at the calls to the method with ConditionalAttribute specified, and if the attributed method has any method calls as parameters, as shown in Main with ConditionalWriteALine in the example above, those calls to ReturnData are also removed. If you look at the release build of the above code with ILDASM, where DEBUG is not defined, Main shows the following intermediate language (IL):
.method private hidebysig static void Main(string[] args) cil managed
{
.entrypoint
// Code size 1 (0x1)
.maxstack 8
IL_0000: ret
} // end of method Program::Main
As you can see, neither the calls to the ConditionalWriteALine or IfDefWriteALine methods appear, nor do any of the calls to the return ReturnData method in the parameter lists. Where things are a little more interesting with ConditionalAttribute is that the definition of the ConditionalWriteALine method is still in the IL for the whole program. That means that a nefarious person who has physical access to your assembly can load it through reflection and call that method you meant only to be called in a debug build because the method is still there in a release build. Depending on your application, that could potentially open up a security hole.
As you saw in the IL snippet, the method that uses the #if DEBUG…#endif conditional compilation is not called either by Main. The advantage to conditional compilation is that the method definition is stripped from the program, so in the example above, the IfDefWriteALine method doesn’t appear in the release build. Of course, the drawback of conditional compila-tion is shown in the C# code at the beginning of this question: you’ll have to surround every call to that method with conditional compilation to avoid compiler errors.
Spencer Low, one of the excellent Review Crew members, suggested a workaround with which you can get the benefit of ConditionalAttribute without letting any debug-only code slide into your released bits. You’ll use ConditionalAttribute on the method, but use conditional compilation inside the method as in the following:
[Conditional ( "DEBUG" )]
static void ConditionalWriteALine ( string data )
{
#if DEBUG
Console.WriteLine ( data );
#endif
}
With Spencer’s trick, you won’t have to litter your code with conditional compilation around all the callers.
C04622027.fm Page 162 Monday, October 9, 2006 10:34 AM
Chapter 4 Common .NET Debugging Questions 163
Why do you always put the constants on the left side of conditional statements?
As you look through my code, you’ll notice that I always use statements such as if (0 == processId )” instead of “if (processId == 0). The reason I use this style is that I’m an ancient C programmer from a bygone era. In the old days, it was very easy to forget one of the equal signs, and unlike the latter statement, using the former syntax will yield a compiler error if you do forget the sec-ond equal sign. The C# compiler is good enough that it will produce a warning if you forget an equal sign on the latter. Having been burned so many times in the old days with the insidious bug of doing an assignment in a conditional statement, it’s ingrained in my DNA to always put the constant on the left side.
By trying to assign to a constant, this becomes a compiler error instead of a warning, thus stopping all builds no matter what the compiler settings are. I’ve found that it’s a lot easier to fix compiler warnings and errors than to fix bugs in the debugger.
Some developers have complained, sometimes vociferously, that the way I write conditional statements makes the code more confusing to read. I don’t agree. My conditional statements take only a second longer to read and translate. I’m willing to give up that second to avoid wasting huge amounts of time later.
What’s the difference between a .NET debug and release binary?
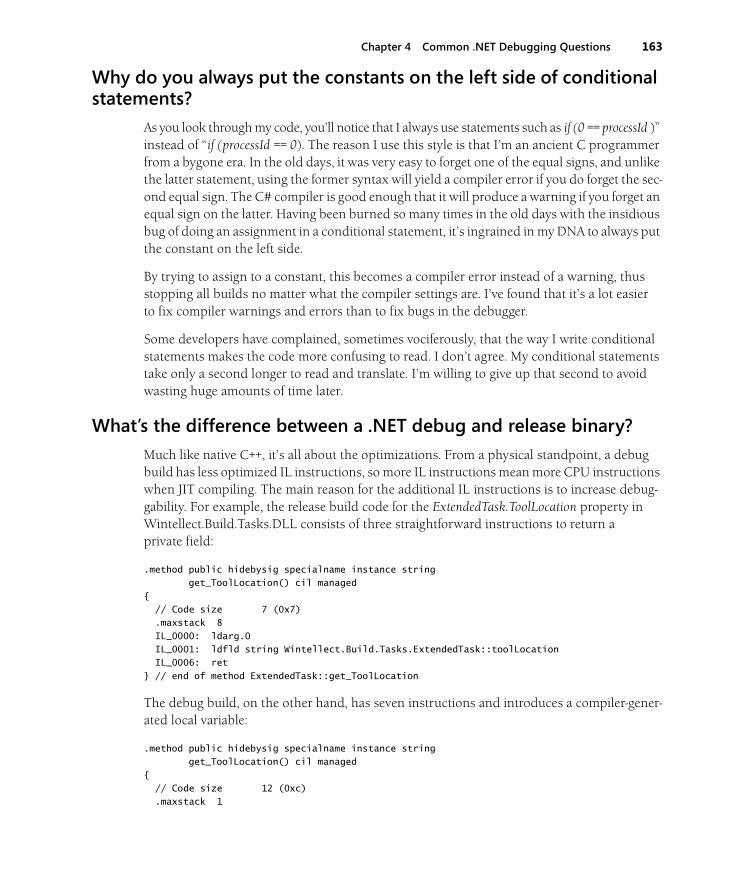
Much like native C++, it’s all about the optimizations. From a physical standpoint, a debug build has less optimized IL instructions, so more IL instructions mean more CPU instructions when JIT compiling. The main reason for the additional IL instructions is to increase debug-gability. For example, the release build code for the ExtendedTask.ToolLocation property in Wintellect.Build.Tasks.DLL consists of three straightforward instructions to return a private field:
.method public hidebysig specialname instance string
get_ToolLocation() cil managed
{
// Code size 7 (0x7)
.maxstack 8
IL_0000: ldarg.0
IL_0001: ldfld string Wintellect.Build.Tasks.ExtendedTask::toolLocation
IL_0006: ret
} // end of method ExtendedTask::get_ToolLocation
The debug build, on the other hand, has seven instructions and introduces a compiler-gener-ated local variable:
.method public hidebysig specialname instance string
get_ToolLocation() cil managed
{
// Code size 12 (0xc)
.maxstack 1
C04622027.fm Page 163 Monday, October 9, 2006 10:34 AM

164 Part I The Gestalt of Debugging
.locals init ([0] string CS$1$0000)
IL_0000: nop
IL_0001: ldarg.0
IL_0002: ldfld string Wintellect.Build.Tasks.ExtendedTask::toolLocation
IL_0007: stloc.0
IL_0008: br.s IL_000a
IL_000a: ldloc.0
IL_000b: ret
} // end of method ExtendedTask::get_ToolLocation
The first instruction in the bug build is a NOP, which just like the x86 instruction with the same mnemonic, means no operation. The C# and Visual Basic compilers put these in for debug builds so that you can set breakpoints at the beginning of a basic block. A basic block is a section of code with exactly one entry and one exit.
Another major difference between a debug and release build is the DebuggableAttribute value. As you can see from the name, this has something to do with debuggability and is what the JIT compiler looks for to determine how to compile the IL. DebuggableAttribute is initialized with the OR’d values from the DebuggingModes structure shown here:
public enum DebuggingModes
{
// Fields
Default = 1,
DisableOptimizations = 0x100,
EnableEditAndContinue = 4,
IgnoreSymbolStoreSequencePoints = 2,
None = 0
}
In a debug build, the compiler sets all the flags in the DebuggerAttribute constructor. Obvi-ously, the DebuggingModes.DisableOptimizations value does what the name says and tells the JIT compiler to do no optimizations. The DebugggingModes.IgnoreSymbolStoreSequencePoints, if set, tells the debugger to use the implicit sequence points in the IL itself instead of the PDB file. The sequence points tell the debugger where a source line maps to an IL instruction. Rick Byers, a developer on the CLR debugging team, has an excellent blog post that describes exactly why you always want to set the DebugggingModes.IgnoreSymbolStoreSequencePoints if you are a compiler writer or using Reflection.Emit at http://blogs.msdn.com/rmbyers/archive/2005/09/08/462676.aspx. In essence, by using the implicit sequence points in the IL, the debugger doesn’t have to read the PDB file, thus producing a large performance boost.
In the “Build All Builds with Debugging Symbols” section in Chapter 2, I mentioned that you want to use /debug:pdbonly when compiling your release builds instead of /debug. As far as the DebuggerAttribute constructor is concerned, the difference is that with /debug, the DebuggingModes value is Default and IgnoreSymbolStoreSequencePoints OR’d together. The Default is present for backwards compatibility with .NET 1.1, so the debugger runs .NET 2.0 binaries the same way they were run in .NET 1.1. The new .NET 2.0 /debug:pdbonly compi-lation switch specifies only IgnoreSymbolStoreSequencePoints.
C04622027.fm Page 164 Monday, October 9, 2006 10:34 AM
Chapter 4 Common .NET Debugging Questions 165
Visual Studio BugsAs we all know, no piece of software is perfect, Visual Studio included. However, there are a few bugs in Visual Studio that have tripped many people up, so I want to show you how to recover from them so you don’t destroy your keyboard or monitor out of complete frustration.
Visual Studio crashes when I load a specific project or when I press F5, won’t debug at all, or won’t hit any breakpoints. What’s going on?
Welcome to .suo hell. Sitting beside your .sln solution files is a hidden file with the same name as your solution except for the .suo file name extension. The .suo file gets corrupted simply by your breathing. If you see any flakiness with Visual Studio, immediately delete the .suo file associated with your solution, and it will usually clear up the problems you are having.
The .suo file contains the open file list for the project, all your breakpoints, and the contents of your Watch windows. For my sanity, every couple of days, I open a command prompt and execute the following command at the root of my project source code to delete any .suo files.
del /f /a:h /s *.suo
What annoys me so much about the corrupt .suo file bug is that it’s been a bug in Visual Studio since Microsoft Visual C++ 2.0, which Microsoft shipped in 1994, when some of you reading were in elementary school. Sadly, the day after the release to manufacturing (RTM) for Visual Studio 2005, I was using my freshly installed RTM bits and I had yet another perfectly reproduc-ible .suo corruption problem with one of my projects. It’s enough to drive you insane.
Suddenly, a specific key doesn’t work in the editor. I’ve tried uninstalling and reinstalling, but I still can’t use the key. How can I get my key back?
When you uninstall Visual Studio, it does not remove your settings, which are stored in C:\Documents and Settings\User_Name\Application Data\Microsoft\VisualStudio\8.0. In that directory is a file, Current.vsk, that contains your current keyboard settings. Move that file to a different directory, and then restart Visual Studio. That should clear up the missing key problem. Obviously, you’ll lose any custom keyboard mappings with this workaround, so you’ll need to recreate them.
What happened to the Debug menu (or some other major UI portion)?
One particularly odd problem that I’ve experienced on a few machines is that selecting Windows on the Debug menu shows only 5 items instead of the 14 items that are supposed
C04622027.fm Page 165 Monday, October 9, 2006 10:34 AM

166 Part I The Gestalt of Debugging
to be there when you are debugging. Additionally, the Debug toolbar will be missing the Step Into and Step Out buttons. Even if you use the command Devenv.exe /ResetSettings, which is supposed to return everything to the raw defaults, you’ll never get all the Windows menu items under Debug menu or toolbar back to what they were.
The trick is to select Import and Export Settings on the Tools menu, and in the Import and Export Settings Wizard, click Reset All Settings. Once you click Next and go through a couple of pages asking if you want to save the settings, you’ll get to a page where you can select the Default Collection Of Settings. (I use the General Development settings.) After clicking Finish, everything will be reset, and your Windows sub-menus under Debug will have the correct screen elements on it.
Designing for DebuggingHaving a consistent plan for exception and error handling is critical to ensuring that you’ll be able to debug problems in production environments. Additionally, many developers are confused about when to use finalization, so I wanted to give you the concise rules to finalization.
How should you implement exception handling?
Even though Microsoft cleaned up the exception handling story considerably in .NET, com-pared to other environments, it’s still the one area people have the biggest problem getting right. Two books show you the background of exception handling and the best practices that everyone needs to follow. The first is Jeffrey Richter’s CLR via C# (Microsoft Press, 2006), and the second is Framework Design Guidelines: Conventions, Idioms, and Patterns for Reusable .NET Libraries, by Krzysztof Cwalina and Brad Abrams (Addison Wesley, 2006). If you’re doing .NET development without having read those books’ sections on exception handling, you’re wasting your time.
Both books mention the idea that you should let the applications crash instead of trying to recover from exceptions. Continually in my consulting work, I find that developers will go to great lengths to attempt to recover from unknown exceptions, and this is exactly the wrong approach to take. If you have an unknown exception occurring in your application, and you attempt to recover, you’ll be running with unpredictable behavior and opening yourself up to security vulnerabilities.
Additionally, if you try to recover from an unknown exception, you will end up causing an exception later in the application and mask off the root cause of the original exception. You could cause a different exception anywhere from a millisecond or less to two weeks later or more depending on the application and exception. By letting the application crash, you’ll have a direct correlation between the root cause and the crash so you’ll be able to fix the applica-tion more quickly.
C04622027.fm Page 166 Monday, October 9, 2006 10:34 AM

Chapter 4 Common .NET Debugging Questions 167
How can I log unhandled exceptions in my applications?
As I described in the last question, you want to let your application crash if there’s an unhan-dled exception, but you will want to at least log that there’s been an unhandled exception. For ASP.NET applications, you can look for unhandled exceptions in two places. If you want to get those errors on a per page basis, provide a Page_Error method for the page. For application-wide unhandled exceptions, add a global application class (in Global.asax) to the project, and put your logging in the Application_Error method.
No matter which method is logging your ASP.NET unhandled exceptions, you’ll be getting the actual Exception-derived unhandled exception by using the Server.GetLastError method. After carefully logging the error in your Page_Error or Application_Error method, you need to decide how to report the error to the user. If you call Server.ClearError, the error propagation through the rest of ASP.NET will not happen. If you do not call Server.ClearError, the error will be reported to the user through the settings in the <customErrors> section of Web.Config.
The one limitation of the <customErrors> section is that the defaultRedirect attribute and <error> elements, where you can specify HTTP error redirects caused by your ASP.NET code, is that you can redirect only to static HTML pages. What I prefer doing in my Application_Error is to put the unhandled exception into the session state and redirect to an ASPX page so I can do better logging and display to the user. I’ll still keep my <customErrors> section for the HTTP errors. The following shows an example Application_Error performing the redirect.
void Application_Error(object sender, EventArgs e)
{
// Get the exception and stuff it into a session state variable.
// If you call Server.GetLastError in the redirect page, it will
// return null.
Exception ex = Server.GetLastError ( );
Session.Add ( "UnhandledException" , ex );
// Redirect to the error page.
Response.Redirect ( "ErrorReportingPage.aspx" , false );
// You have to clear the error or it will go through the
// <customErrors> section.
Server.ClearError ( );
}
For console applications, all unhandled exceptions by any thread in your application are reported on a per-AppDomain basis through the AppDomain.UnhandledException event. A breaking change between .NET 1.1 and .NET 2.0 is that in .NET 2.0, unhandled exceptions on all threads terminate the application. In .NET 1.1, only an exception on the main thread ter-minates the application. Having your application continue on its merry way after a pool thread disappears was completely wrong, and the old behavior was a bug in .NET itself.
Even with the improved unhandled exception behavior in console applications, there’s still a small problem. If you have an unhandled exception in a pool thread or a finalizer thread, you get the standard crash message, which provides an opportunity to debug the application.
C04622027.fm Page 167 Monday, October 9, 2006 10:34 AM

168 Part I The Gestalt of Debugging
However, the main application thread is still running while the dialog is displayed, so your application can end before you get a chance to attach the debugger. I have no idea why pool threads and finalizer threads are treated this way, but I certainly hope that by the time the next version of the CLR ships, when one thread crashes, all threads will stop in unhandled excep-tion scenarios.
Windows Forms applications add another twist to the unhandled exception mix. For back-ground, pool, and finalizer threads, unhandled exceptions are reported through the AppDomain.UnhandledException event. As with the console application case, the main thread continues to run as you’re handling the event. If the unhandled exception is in the main thread, you’ll need to set the Application.ThreadException event in order to receive the notification. The good news is that setting the Application.ThreadException will disable the standard Windows Forms exception notification dialog box.
Since I’m talking about Windows Forms applications, instead of writing your own exception-reporting user interface, you should take a look at the Microsoft Exception Message Box, which is part of Feature Pack for Microsoft SQL Server 2005 - April 2006 and can be down-loaded from http://www.microsoft.com/downloads/details.aspx?FamilyID=df0ba5aa-b4bd-4705-aa0a-b477ba72a9cb&DisplayLang=en. If you’ve ever seen an error in any of the SQL Server 2005 graphical tools, this is the same message box but in a redistributable package. The message box supports copying all the exception data to the clipboard in addition to show-ing the detailed data about the assertion. You can find more information on the features and usage of the Microsoft Exception Message Box at http://msdn2.microsoft.com/en-us/library/ms166343.aspx.
If you control the computers and network your application is running on, you can simply log any unhandled exception information to a file or database in a shared location. How-ever, if you are providing software that runs outside your company, things get a little more interesting. You may want to develop with a Web service you can call with all the exception information from the user’s application. If you don’t have a server that can run your Web service, you may want to take a look at the Shareware Starter Kit that Microsoft put together to help shareware authors provide program registration, buy-now functionality, and, most importantly, a Web service to record your unhandled exceptions. You can find the source code and more information about the Shareware Software Starter Kit at http://sharewarestarterkit.com.
The last item I want to mention about unhandled exceptions is how you can send errors your users report to Microsoft. When the crash dialog box (which is in Figure 4-2, in case you’ve never seen it before) appears, the user can send the error information to Microsoft. To get all your company’s errors, all you have to do is register for Windows Error Reporting at http://msdn.microsoft.com/isv/resources/wer/default.aspx. The only cost to you is for the purchase of a digital certificate.
C04622027.fm Page 168 Monday, October 9, 2006 10:34 AM

Chapter 4 Common .NET Debugging Questions 169
Figure 4-2 Windows application error message
I’d strongly recommend that you sign up for Windows Error Reporting so you can get those crash reports. Even if you set up your logging to upload the data directly through a Web ser-vice right into your bug-tracking database, you never know when that interop problem will kill some memory inside the CLR and cause it to have a native crash. Although not everyone clicks the Send button, enough will for you to quickly see which errors are causing the most pain for end users.
When do I put a finalizer on my class?
Almost never. Finalization offers a way for a class to clean up resources before the object is gar-bage collected in memory. The idea was that if you were holding onto a native resource, such as a native Windows file handle, you'd have a method that allowed you to get the handle closed. The problem is that with C#, a finalizer method is denoted with a “~” in front of a method that’s the same name as the class.
It was a mistake to use “~,” because many developers coming from a C++ background thought that meant the method was a destructor and the object would be cleaned up when you set the object instance to null or when the reference goes out of scope. The garbage collector is a non-deterministic system, so you have no idea when the object is actually freed and its finalizer called. This can lead to situations in which you’re holding onto native resources far longer than you expect.
To alleviate the problems on developers inadvertently using finalizers, .NET 2.0 introduces the SafeHandle class in the System.Runtime.InteropServices namespace. If you have a native resource, you’ll wrap the native resource and only the native resource in a SafeHandle-derived class and override the abstract ReleaseHandle and IsInvalid get property. In those two methods, you’ll handle cleaning up your native resource and returning if the handle you’re wrapping is invalid. By using a SafeHandle-derived class, which is derived from CritialFinalizerObject class, you’re telling the runtime to pay extra attention to this class to ensure that it truly gets cleaned up.
C04622027.fm Page 169 Monday, October 9, 2006 10:34 AM

170 Part I The Gestalt of Debugging
Having seen numerous problems with finalizers, I wanted to make sure I mentioned what you need to be doing instead. In code reviews, I specifically look for finalizers on classes and flag them as errors so the developer can get rid of them. A good article by Steve Toub, “Keep Your Code Running with the Reliability Features of the .NET Framework,” in the October 2005 MSDN Magazine, discusses SafeHandle classes and reliability in more depth (http://msdn.microsoft.com/msdnmag/issues/05/10/Reliability/). A blog entry by Joe Duffy, “Never write a finalizer again (well, almost never),” also offers another discussion of the topic (http://www.bluebytesoftware.com/blog/PermaLink.aspx?guid=86c71425-57bc-4fcb-b34b-3262812f12cf).
Debugger QuestionsAlthough Chapter 5, “Advanced Debugger Usage with Visual Studio,” covers the amazing .NET debugger in Visual Studio, a few common questions fall outside the realm of pure .NET. I want to answer those questions here. Some of these are discussed in the Visual Studio doc-umentation but are scattered around, so many developers aren’t aware of the answers.
I need a debugger on a production system. Do I have to purchase an additional copy of Visual Studio for that machine?
The Visual Studio Express editions are free, but the Visual Web Developer edition does not support debugging inside Internet Information Services (IIS), so that doesn’t work. The good news is that the Framework SDK includes the Microsoft CLR Debugger (DBGCLR) as part of its installation. DBGCLR is essentially the Visual Studio main frame with nothing but the managed debugging packages, which means that the memory footprint is almost trivial when compared to the full version of Visual Studio. The Framework SDK is also free, and you can download it from http://msdn.microsoft.com/netframework/. When you install the Framework SDK, make sure to select Custom Installation, and install only the tools portion to get just what you need.
What is that VSHOST thing?
In Windows, process creation is a relatively slow operation. Consequently, for .NET 2.0, the debugger team took advantage of the fact that there’s no difference between EXEs and DLLs in the .NET world. The debugger keeps AppName.vshost.exe running as you’re developing, and when you start debugging, they communicate to it to load your actual EXE into a separate AppDomain and execute all your code there.
There’s a noticeable speed increase with the Vshost approach, and in almost all instances, you won’t have any problems running in the default scenario. However, if you rely on certain Framework APIs, such as AppDomain.CurrentsDomain.FriendlyName and Assembly.GetCalling-Assembly().FullName, which obviously return different values if you’re running under the AppName.vshosts.exe process. If your code absolutely relies on the running application, you
C04622027.fm Page 170 Monday, October 9, 2006 10:34 AM

Chapter 4 Common .NET Debugging Questions 171
can always resort to debugging the binary directly by going into the project properties, and on the Debug tab, clearing Enable The Visual Studio Hosting Process check box.
Can you debug SQL stored procedures by using Visual Studio?
Absolutely! You can debug all the SQL Server 2000 and SQL Server 2005 stored procedures you want by using Visual Studio because the support has been drastically improved. The one thing the documentation fails to mention is that you need to be a sysadmin for the SQL Server instances you’ll want to debug. SQL Server 2005 is ready for debugging automatically, but for SQL Server 2000, you’ll need to enable Visual Studio debugging each time it starts by execut-ing the following statement in SQL Analyzer: exec sp_sdidebug 'legacy_on'.
The Server Explorer tool window in Visual Studio is where you can create your data connec-tions to the particular database you want to use. Once you’ve established the connection, you can manipulate the database to your heart’s content. To execute or debug any stored proce-dure in the database, right-click the stored procedure, and then select either Execute or Step Into Stored Procedure as appropriate. If the stored procedure requires parameters, Visual Studio will prompt you for them.
Single-stepping stored procedures is just like debugging any other type of code you’d debug in Visual Studio, so to see parameters and locals, use the Locals and Watch windows. You won’t get to see temporary tables you create, but the convenience factor of using a single environ-ment is wonderful.
A known problem prevents you from stepping into stored procedures on some systems when you could do so on those systems in the past. To work around this bug, delete the database connections and re-create them. That should clear up the problem. While I’m talking about issues, I should mention that it’s an excellent idea not to use the Server Explorer default of always being shown on the left side of the IDE with auto-hide enabled. If you have an invalid data connection in Server Explorer, and you move your pointer over the Server Explorer tab, the IDE will refresh the window right before showing it. Because the connection to the server is done on the UI thread, the whole IDE will hang for a minute or more. By the way, the same UI hang on network access occurs with the Team Explorer window used to view your Team Foundation System servers.
In addition to stepping into stored procedures from Server Explorer, you can set up your projects so that you debug the stored procedures as your C# or Visual Basic code executes them. For console and Windows Forms applications, go into the project properties, and on the Debug tab at the bottom, select the Enable SQL Server Debugging check box. For ASP.NET projects, on the Web site menu, click Start Options, and in the Debuggers section of the Prop-erties dialog box, select the SQL Server check box. In all cases, you’ll need to open the stored procedure code from Server Explorer and set your breakpoints in the stored procedure before that stored procedure executes. Now you can step from your C# or Visual Basic code to the stored procedure and back.
C04622027.fm Page 171 Monday, October 9, 2006 10:34 AM

172 Part I The Gestalt of Debugging
How do you debug script by using Visual Studio?
Given the massive interest in all things AJAX, scripting with JavaScript and Microsoft Visual Basic, Scripting Edition (VBScript) are about to become quite important in your future. As is the case with SQL stored-procedure debugging, Visual Studio handles script debugging, but there are a few more twists along the way. Before debugging script in Microsoft Internet Explorer, you need to go into the Internet Options dialog box, and then on the Advanced tab, under the Browsing node, clear the Disable Script Debugging (Internet Explorer) check box. Note that if you want to debug scripts running with the HTML control in other applications, such as Microsoft Office Outlook, you’ll also need to clear the Disable Script Debugging (Other) check box.
In all ASP.NET scenarios, using the JavaScript debugger or VBScript Stop keywords will always break into the debugger. However, the danger is that you’ll accidentally check in the source code with the breaking keywords still there, which most development teams frown on. It’s much better to use the built-in script-debugging support in your ASP.NET projects if you can. However, the way you set your breakpoints depends on the type of page you’re working with.
If the page is an .html/.htm static HTML page, you can set your breakpoints in the <script> tags any time you like, and they will be hit. If the script is in an ASP.NET .aspx page, if you try to set a breakpoint, the IDE will complain that “This is not a valid location for a breakpoint.” Even if you start debugging and you see the .aspx page loaded, you still won’t be able to set a break-point. To solve this problem when you start debugging, on the Debug menu, click Windows, and then select Script Explorer to open the Script Explorer window. In the Script Explorer window, double-click the page that contains the script you want to debug. That will shift focus to the .aspx file, and you can set your breakpoints. One annoying problem with the ASP.NET script-debugging support is that none of the breakpoints you set in the script code is saved between debugging runs. That means that you’ll have to manually set the script breakpoints each time.
If you want to debug any client-side script running in an instance of Internet Explorer, on the Tools menu, click Attach to Process to open the Attach To Process dialog box. In the Available Process section at the bottom of the dialog box, you’ll select the instance of IExplore.exe you want to debug. If you leave the Attach To options set to Automatic, Visual Studio will assume that you want to debug script. After you click the Attach button, the Script Explorer window should appear. If it does not, on the Debug menu, click Windows, and then select Script Explorer. Double-click the script item in the Script Explorer window. The source opens, and now you can set breakpoints.
If you have to support a traditional ASP application, sometimes referred to as ASP.OLD, you’re in luck with Visual Studio 2005. There’s sufficient support in the script-debugging portion to make it relatively easy. All the steps are listed at http://msdn.microsoft.com/library/default.asp?url=/library/en-us/vsdebug/html/vxtskaspscriptdebugging.asp?frame=true. It’s a little convoluted to set up, but it keeps you from installing an older version of Visual Studio just for ASP.OLD debugging.
C04622027.fm Page 172 Monday, October 9, 2006 10:34 AM

Chapter 4 Common .NET Debugging Questions 173
For Windows Script Host (WSH) files and stand-alone .js and .vbs files, the JavaScript debugger or VBScript Stop keywords will break into the debugger. You can also start both wscript.exe and cscript.exe with the //X command-line option to trigger the script debugger so you can debug from the first executable line of script code.
How can I debug with a different Code Access Security (CAS) level?
Although you can debug across Windows accounts by starting the program in one account and running the debugger from an account with administrator privileges, debugging your code from the IDE running in a partially trusted zone, such as the Internet zone, was impossible until Visual Studio 2005. In .NET 1.1, you had to go to the CAS settings in the .NET Configuration Microsoft Management Console and manually change the process settings.
To play with your code in any CAS situation from the Visual Studio 2005 debugger, go into the project properties’ Security tab, and then select the Enable ClickOnce Security Settings check box. That will enable you to select the execution zone and grant or deny specific permissions. Figure 4-3 shows where I’ve set custom CAS settings to deny FileIOPermission for the process.
Figure 4-3 Setting the Code Access Security for the debuggee
Why do I sometimes get that annoying context switch deadlock exception when stopped in the debugger too long on Windows Forms applications? What are Managed Debugging Assistants?
Even though my friend Don Box likes to say, “Windows is the device driver,” it’s not quite to that point yet. We all have legacy C DLLs and COM/COM+ objects that we still need to use in our development. (By the way, am I the only one who thinks it odd that the COM specifica-tion reached only version 0.9? Does that mean that COM never made it to 1.0? Microsoft no
C04622027.fm Page 173 Monday, October 9, 2006 10:34 AM

174 Part I The Gestalt of Debugging
longer has the COM Specification document posted, but see http://www.sei.cmu.edu/str/descriptions/com_body.html for the version number.)
When Microsoft was planning .NET 2.0, they looked at all the areas where developers were having trouble in their .NET applications, and PInvoking to both C DLLs and COM/COM+ components was at the top of the list. To rectify that, they added a very nice feature to the CLR runtime called Managed Debugging Assistants (MDAs), which do extra checking on that PInvoke boundary to ensure that you’re not inadvertently causing yourself a major problem.
A perfect example of a seriously nasty problem to debug is if you pass a delegate to native code in order for the native code to be able to call back into your managed code. If, on the managed side, you release all references to the delegate, the delegate is eligible for garbage collection. However, the native code knows nothing about the garbage collector, so it’s holding onto the delegate to call it when necessary. You can probably guess that what’s going to happen is that a garbage collection is going to occur and clean up the actual delegate, and later, the native code will call the delegate, and you’ll crash spectacularly.
There are 42 MDAs to assist you, although some are for logging purposes. You can read all about the MDAs at http://msdn2.microsoft.com/en-us/library/d21c150d.aspx. Additionally, Steve Toub wrote an excellent article on using them at http://msdn.microsoft.com/msdnmag/issues/06/05/BugBash/. The one thing I do want to specifically address is why some MDA errors cause you to stop in the debugger.
In the Exception dialog box, accessible from the Debug menu, if you expand the Managed Debugging Assistants node, you’ll see that some items are selected by default, such as Call-backOnCollectedDelegate and ContextSwitchDeadlock. When running under a debugger, those selected MDAs cause the CLR to break into the debugger when one of those items trig-gers. Because the ContextSwitchDeadlock MDA is selected by default, you probably have seen the error when you have stopped in the debugger for longer than 60 seconds. Technically, the error reported by the ContextSwitchDeadlock MDA is a bug, but I wish it weren’t.
Because Microsoft obviously put so much work into the MDA architecture, and MDA reports such good bugs, I like to occasionally run my applications with all MDA options selected when under the debugger. That way I get the best checking possible. You can also turn on all the MDA checking when running outside the debugger by setting an environment variable, COMPLUS_MDA. You can also turn on MDA checking with a registry key, but that is global to all processes, and it’s better to set only the environment variable for specific processes.
If you set the COMPLUS_MDA to 1, the runtime will look for a file called AppName.exe.mda.config and read the settings you want for that program. The following shows an example file that turns on several interesting MDAs. I’ve discussed CallbackOnCollectedDelegate already. LoadFromContext tells you when the code calls Assembly.LoadFrom, which can lead to problems in serialization, casting, and dependency resolution because Assembly.LoadFrom does less proper checking than Assembly.Load. PInvokeStackImbalance checks that the native methods you are calling are properly declared and do not corrupt the stack. Finally,
C04622027.fm Page 174 Monday, October 9, 2006 10:34 AM

Chapter 4 Common .NET Debugging Questions 175
StreamWriterBufferDataLost looks for the case in which a Stream object is being garbage collected before you have closed the stream. Even though all the MDA names start with an upper case letter, you specify them in AppName.exe.mda.config with an initial lower case:
<?xml version="1.0" encoding="UTF-8" ?>
<mdaConfig>
<assistants>
<callbackOnCollectedDelegate />
<loadFromContext />
<pInvokeStackImbalance />
<streamWriterBufferedDataLost />
</assistants>
</mdaConfig>
So you don’t have to hand-write a configuration file every time, you can also set the COMPLUS_MDA environment variable to the MDA values you want to use. The following shows how to turn on the first two MDAs from the previous configuration file:
set COMPLUS_MDA=callbackOnCollectedDelegate;loadFromContext
Because the MDA checking is so important, I put a batch file in the code .\MDA\Ultimate-MDAEnv.CMD, which turns on all the error-checking MDA values. Now you can have your test environments running with a higher level of checking to find those errors before your customers do. What’s even better is that the MDA settings work with your release build code so you could use them to monitor production systems if you absolutely had to.
Debugging War StoryThe Garbage Collector Ate My Lunch
The BattleIn the middle of demonstrating the very cool SUPERASSERT.NET from Chapter 3, “Debugging During Coding,” to a group of people, I was showing how to create a mini-dump at the assertion when the DiagnosticHelper-i386.exe program failed and returned the error code: D000000D. After the shock of showing a bug to the world wore off, I did have to laugh at the error code because it sounds like something my 16-year-old nephew would say. I wasn’t laughing when I couldn’t find anything on the Web that said anything about code returning an error code of D000000D.
What turned out to be even odder was that I could see this error on only a single machine. I tried all sorts of combinations of physical and virtual machines, but I’d get the error only on that one machine and, as always, it wasn’t consistent. Just the kind of bug that screams that your life is going to be completely miserable for the next three days.
The error was occurring when SUPERASSERT.NET spawned the DiagnosticHelper-i386.exe program, so I left the assertion dialog box up and tried manually running Diag-nosticHelper-i386.exe from the command line to see if I could duplicate the behavior.
C04622027.fm Page 175 Monday, October 9, 2006 10:34 AM

176 Part I The Gestalt of Debugging
That’s when I found something very interesting. If I passed the -n process name option, I didn’t see any error, but if I used -p process id, I not only got the D000000D error, I was getting the standard Windows error message that a handle was invalid. Interestingly, when starting DiagnosticHelper-i386.exe from SUPERASSERT.NET, I saw the invalid handle error only once, and all the rest were D000000D. Another interesting find was that when D000000D was returned, a corrupt minidump file was left on the disk.
Obviously, the MiniDumpWriteDump Windows API call was failing, and seeing the invalid handle error was a major hint. MiniDumpWriteDump takes two handles, one for the process to write and the other for the file to write. One of the two was bad, but which one?
The OutcomeThis one turned out to be a whopper of a bug! I flipped a coin and decided to look at the process handle first. Inside Main, my code was calling Process.GetProcesses and iterating through the returned array looking for the Process object matching the process ID from the p command-line option. Once I found the Process object, I called Process.Handle to get the handle to the process. After creating the stream to write to and a few other set-up items, I passed that handle value to the native MiniDumpWriteDump API.
If a handle is invalid, that means that some code had to call CloseHandle on it somewhere along the chain. That closing had to occur between getting the handle in Main and the eventual call to MiniDumpWriteDump. Therefore, I started the process under the debugger and set a breakpoint on the code that called Process.Handle and the call to MiniDump-WriteDump. I checked the handle value at the first breakpoint and started Process Explorer, which I’ll discuss later in this chapter, and verified it was a valid handle. I ran to the breakpoint on MiniDumpWriteDump and was shocked to see that the handle value was no longer in Process Explorer’s handle view! No wonder I was getting those invalid handle return values.
My next step was to open the teller of all truth, Reflector, and look at the code for Process.Handle to see how it worked:
public IntPtr Handle
{
get
{
this.EnsureState(Process.State.Associated);
return this.OpenProcessHandle().DangerousGetHandle();
}
}
That DangerousGetHandle freaked me a bit when I read the following in the documenta-tion: “...if the handle has been marked as invalid with SetHandleAsInvalid, Dangerous-GetHandle still returns the original, potentially stale handle value. The returned handle can also be recycled at any point.” “... recycled at any point” screamed garbage collection!
C04622027.fm Page 176 Monday, October 9, 2006 10:34 AM

Chapter 4 Common .NET Debugging Questions 177
My hypothesis at this point was that the Process object I was calling Process.Handle on was being garbage collected and so the process handle I was using was invalid. Using the coolest debugger trick of all, Make Object ID, which I’ll discuss in the next chapter, I verified that that was indeed the case. Using WinDBG, discussed in Chapter 6, “WinDBG, SOS, and ADPlus,” I set a breakpoint on the CloseHandle API, looked up the parameter on the native stack, and verified that the handle value I got on the call to Process.Handle was passed to CloseHandle, and that was occurring before my code called MiniDumpWriteDump.
Because the Process class does not have a finalizer on it, the CloseHandle call wasn’t happening there. However, the process handle is stored in an internal class, ProcessSafe-Handle, so something in there was calling CloseHandle. I was just thrilled that I had a duplicatable case on a single machine so I could track the problem down.
I fixed the code by doing all the process-handle opening myself to ensure that the process handle wasn’t eaten by the garbage collector. You can see all the code in the .\DiagnosticHelper\NativeMethod.cs file. The other lesson I learned was to not trust the return value from Process.Handle at all.
Debugging Scenario QuestionsIn this section, I want to talk about some of those very cool tricks in my debugging arsenal that come in handy in specific scenarios. Some of these techniques appear in the documenta-tion, but they are so obscure that you may have never heard of them.
How do I debug assembles in the Global Assembly Cache (GAC)?
If you have a situation in which your assembly can reside only in the GAC, debugging can get a little interesting because getting PDB files loaded can be a pain. If you’re working on the machine on which the assembly was built, the embedded path in the binary will find the PDB file, but if you’re on a different machine, you may not find it. You could also go to the trouble of creating a mini Symbol Server, as I discussed in Chapter 2, in order to get the symbols. The good news is that there’s an easier way.
The technique is to use the DEVPATH environment variable. By enabling DEVPATH, you’re telling the assembly loader to look in the specified directory before looking at the GAC or the application directories. Additionally, although name, culture, public key token and processor architecture checking is done on the assembly, no version checking is done at all. This means that you can potentially have a situation in which the application runs differently on your development machine than in test or production. Interestingly, the lack of version checking can be valuable if you want to see how your application will work with a newer version of the assembly without having to remove the old one from the GAC.
C04622027.fm Page 177 Monday, October 9, 2006 10:34 AM

178 Part I The Gestalt of Debugging
Warning Note that this is only for development and test machines and should never be employed in production environments.
To enable DEVPATH, you must turn it on in the <runtime> section of Machine.Config, which you can find in %SystemRoot%\Microsoft.NET\Framework\versison\CONFIG. The following shows what you would add:
<configuration>
<runtime>
<developmentMode developerInstallation="true"/>
</runtime>
</configuration>
Once you have the <developmentMode> section set, you need to set the DEVPATH environ-ment variable to the drive and directory where you want the runtime to look first. For .NET 2.0, you can specify only a single directory in the DEVPATH environment variable. If you leave the PDB file for the assembly in the DEVPATH specified directory, the debugger will load the PDB file from that directory. For more information about DEVPATH, see Junfeng Zhang’s blog entry on DEVPATH at http://blogs.msdn.com/junfeng/archive/2005/12/13/503059.aspx.
How can I debug the startup code for a Windows service written in .NET?
Whereas you can easily attach to your service with Visual Studio once your Windows service is running and debug to your heart’s content, debugging the startup code is an adventure. Because the Service Control Manager (SCM) is what has to call the CreateProcess API to get the service started, you can’t start from the debugger. The traditional way of debugging service startup is through the Image File Execution Options registry key, and if your service is written in a managed language, you can still use the Image File Execution options.
The Image File Execution Options registry key (HKEY_LOCAL_MACHINE\SOFTWARE\Microsoft\Windows NT\CurrentVersion\Image File Execution Options) is where the oper-ating system reads special values for setting global flags in the process. Additionally, you can also set a debugger so that no matter how you start the application, it always starts under a debugger. Keep in mind that the instructions I’m about to discuss apply only to 32-bit Win-dows systems. The reason is that the debugger program I’ll show you in this trick is 32-bit only, so it can’t debug 64-bit programs.
If you’re feeling hard core and looking for adventure, you’ll manually go into the Image File Execution Options key and start adding the appropriate entries. If that thought scares you, you can do what us normal people do, use GFlags.exe, which comes with the Debugging Tools for Windows package. Since the Image File Execution Options key is in HKEY_LOCAL_MACHINE, you’ll have to run GFlags.exe from an account with administrator privileges.
C04622027.fm Page 178 Monday, October 9, 2006 10:34 AM

Chapter 4 Common .NET Debugging Questions 179
Before we go any further, I have to scream, You can make your machine unbootable and unusable with GFlags! When you start GFlags, the first two tabs, System Registry and Kernel Flags, will change system-wide settings you don’t want to change unless you work at Microsoft on the Windows kernel team and have full source code access. For you and me, as soon as you start GFlags, you want to click the Image File tab as fast as possible. In the Image File tab, you’ll be limited to screwing up just the individual process.
On the Image File tab, in the edit control next to the Image: (TAB to refresh) label, type in only the name of your service with no path. In other words, if your service were happyserv.exe, that’s exactly what you’d type. To enable the rest of the UI in Image File tab, press the Tab key after typing the name of your application. The Debugging Tools for Windows help file, Debug-ger.chm, documents all of the various check boxes for a process. As you can guess from the names of the fields, all of them are for native memory debugging.
For debugging your service startup, the two items of interest are the Debugger check box and text box. After selecting the Debugger check box, the text box becomes available, and you can specify the debugger you want to use. You won’t type Devenv.exe here (the Visual Studio program name), but you’ll type VsJITDebugger.exe, which is the Visual Studio Just-In-Time Debugger. There’s no need to specify the path because the debugger is installed into the %SystemRoot%\System32 directory. Figure 4-4 shows a properly filled out GFlags screen shot.
Figure 4-4 Setting the Image File Execution Options debugger value
When your service or any other program you specify starts, the operating system passes the program and any command-line arguments to VsJITDebugger.exe so you’ll see the usual Visual Studio Just-In-Time Debugger dialog box asking you which debugger to use on the process. What’s interesting about the undocumented behavior of VsJITDebugger.exe is that it sees your process is a managed process and enables mixed-mode (both managed and native) debugging.
C04622027.fm Page 179 Monday, October 9, 2006 10:34 AM
180 Part I The Gestalt of Debugging
As I mentioned, this trick won't work on x64 systems, so if you have to debug service startup on the wide bits, set the debugger to Windbg.exe. Because WinDBG is a native-only debugger and doesn’t support .NET debugging, you’ll have to use the SOS extension to debug your startup. Chapter 6 discusses WinDBG and SOS in detail. Although painful, it is doable but not something you want to do every day.
Even if you haven’t done Windows service development before, you’re probably aware that there’s a startup timeout when starting a service. If your service does not call back into the SCM within 30 seconds of starting, the SCM will terminate the service. This isn’t a lot of time to let Visual Studio start up and load all the symbols let alone for you to single-step through the service startup.
Fortunately, there’s another barely documented registry tweak in which we can set the time-out value: In the HKEY_LOCAL_MACHINE\SYSTEM\CurrentControlSet\Control key, create a new DWORD value called ServicesPipeTimeout, and set the number of milliseconds you want the SCM to wait for service startup. After you set this value, you’ll need to reboot the computer for the change to take effect. Obviously, you want to set the Services-PipeTimeout value on a production server because it’s global to all services.
My boss is sending me so much e-mail that I can’t get anything done. Is there any way I can slow down the dreaded PHB e-mail?
Although many of your bosses mean well, their incessant e-mail messages can become distracting and keep you from the real work you need to do. Fortunately, there’s a simple solu-tion that works quite well and will give you a week or so of wonderful peace so that you can work at hitting your deadlines. The less-technically proficient your boss and network admin-istrators are, the more time you’ll get.
In the previous section, I talked about the Image File Execution Options section of the registry and the fact that whenever you set a process’s Debugger value, that process automatically starts under that debugger. The trick to ending the PHB (pointy haired boss) mail is the following:
1. Walk into your boss’s office.
2. Open Regedit.exe. If your boss is currently in the office, explain that you need to run a utility on his machine so that he can access the XML Web services you’re building. (It doesn’t really matter whether you’re creating XML Web services—the buzzwords alone will cause your boss to readily let you mess with his machine.)
3. In the Image File Execution Options section, create a key called Outlook.exe. (Substitute the executable name of your e-mail program if you don’t use Outlook.) Tell your boss that you’re doing this to allow him to have e-mail access to XML Web services.
4. Create the Debugger value and set the string to Sol.exe. Indicate to your boss that Sol is to allow your XML Web services to access Sun Solaris machines, so it’s necessary for you use it.
C04622027.fm Page 180 Monday, October 9, 2006 10:34 AM

Chapter 4 Common .NET Debugging Questions 181
5. Close Regedit.
6. Tell your boss that he’s all set and can now start accessing XML Web services. The real trick at this point is to keep a straight face while walking out of your boss’s office.
Avoiding laughter during this experiment is much more difficult than it sounds, so you might want to practice these steps with a few coworkers first.
What you’ve just set up is a situation in which every time your boss starts Outlook, Solitaire runs instead. (Since most bosses spend their days playing Solitaire anyway, your boss will be sidetracked for a couple of games before he realizes that he meant to start Outlook.) Even-tually, he’ll continue to click the Outlook icon until so many copies of Solitaire are running that he’ll run out of virtual memory and have to reboot his machine. After a couple of days of this click-a-million-times-and-reboot cycle, your boss will eventually have a network admin-istrator come in and look at his machine.
The admin will get all excited because she has a problem that is a little more interesting than helping the folks in accounts receivable reset their passwords. The admin will play with the machine for at least a day in your boss’s office, thus keeping your boss from even being close to a machine. If anyone asks your opinion, the stock answer is, “I’ve heard of strange interac-tion problems between EJB and NTFS across the DCOM substrata architecture necessary to access the MFT using the binary least squares sort algorithm.” The admin will take your boss’s machine back to her office and continue to play with it for a couple of days. Eventually, the admin will repave the hard disk and reinstall everything on the machine, which will take another day or so. By the time your boss gets his machine back, he’ll have four days of e-mail to get through, so it will be at least a day before he gets out from under all that mail, and you can safely ignore those messages for another day or two. If the PHB mail starts getting thick again, simply repeat the steps.
Warning Use this technique at your own career-limiting risk.
What strategies do you have for debugging deadlocks?
Without a doubt, some of the hardest problems to solve in modern software development are deadlocks. In fact, I spend a considerable amount of time showing you how to find them in Chapter 6, and I even wrote Code Analysis/FxCop rules in Chapter 8, “Writing Code Analysis Rules,” to help ensure that you’re following proper multithreading in managed code. However, even if you think you can plan for every situation, your multithreaded appli-cation can stop dead when you least expect it. The biggest obstacle to debugging multi-threaded deadlocks is that by the time your application is deadlocked, it’s almost too late to start debugging.
As I’ve been emphasizing throughout this book, one of the keys to debugging is up-front plan-ning. With multithreaded programming, up-front planning is the only way you can avoid the
C04622027.fm Page 181 Monday, October 9, 2006 10:34 AM

182 Part I The Gestalt of Debugging
dreaded deadlocks. I break down the necessary planning for multithreaded applications into the following categories:
■ Don’t do it.
■ Don’t overdo it.
■ Multithread only small, discrete pieces.
■ Synchronize at the lowest level.
■ Review the code—and review the code again.
■ Test on multiprocessor machines.
Don’t Do It
This first tip might seem a little facetious, but I’m absolutely serious. Make sure there’s no other way you can structure your program before you decide to incorporate multithreading into your application. When you include multithreading in your application, you’re easily add-ing a minimum of an extra month of development and testing to your schedule.
If you’re coding thick-client applications and you need your program to do some lightweight background processing, check to see whether the work can be handled with a background periodic timer event. With a little creative thinking, you can probably find a way to avoid multithreading and the headaches that go with it.
Don't Overdo It
When it comes to server-based applications, you also have to be extremely careful not to create too many threads. One common mistake we’ve all seen is that some developers end up with a server application in which each connection runs on its own thread. The average develop-ment team is doing well to get 10 concurrent connections during their heaviest testing, and it looks like their code works fine. The code might work fine when first deployed, but as soon as business picks up, the server starts bogging down because it’s not scalable.
When working on server applications, you’ll definitely want to take advantage of the excellent support .NET has for thread pooling with the.ThreadPool class from the System.Threading namespace. If used properly, you can get some wonderful throughput in your application. However, it’s much easier to deadlock with misused thread pools than you can ever imagine. For more information on using the ThreadPool class, see Chapter 23, “Performing Asynchronous Operations,” in CLR via C#, 2nd Edition.
Multithread Only Small, Discrete Pieces
If you must multithread, try to keep it to small, discrete pieces. With thick-client applications, you should stick to small pieces of work that are generally devoid of any user interface (UI) elements. For example, printing in the background is a smart use of multithreading because your application’s UI will be able to accept input while data is printing.
C04622027.fm Page 182 Monday, October 9, 2006 10:34 AM

Chapter 4 Common .NET Debugging Questions 183
In server applications, it’s slightly different in that you need to judge whether the overhead of thread creation and work will actually speed up your application. Although threads are much more lightweight than processes, they still take quite a bit of overhead. Consequently, you’ll want to make sure that the benefit of cranking up that thread will be worth the effort. For example, many server applications have to transfer data back and forth between some type of database. The cost of waiting for the write to that database can potentially be high. If you have a situation in which you don’t need to do transactional recording, you can plop parts of the database write into a thread pool object and let it complete on its own time, and thus continue your processing. That way you’ll be more responsive to the calling process and get more work done.
Synchronize at the Lowest Level
In my travels, I’ve seen this rule broken almost more than the rule that says curly braces go below the if statement. In .NET, it’s trivial to use a lock statement on a field and grab it at the top of your method so you protect the whole method, when in reality; you need to protect just a single field access. Whenever you grab a lock or other synchronization object, you’re causing other threads to block when they try to access that object. Your job as a developer using multithreading is to keep your threads running as much as possible and never block. It’s far better to do three or four synchronization object grabs in a method instead of doing a single overall grab.
Review the Code—and Review the Code Again
If you really do need to multithread your application, you must allow plenty of time to walk through your multithreaded code in full code reviews. The trick is to assign one person to each thread in your code and one person to each synchronization object. In many ways, the code review in multithreaded programming is really a “multithreaded” review.
When you review the code, pretend that each thread is running at real-time priority on its own dedicated CPU and that the thread is never interrupted. Each “thread person” walks through the code, paying attention only to the particular code that his thread is supposed to be execut-ing. When the thread person is ready to acquire a synchronization object, the “object person” literally moves behind the thread person. When the thread person releases a synchronization object, the object person goes to a neutral corner of the room. In addition to the thread and object representatives, you should have some developers who are monitoring the overall thread activity so that they can assess the program’s flow and help determine the points at which different threads deadlock.
Test on Multiprocessor Machines
As I mentioned, a multithreaded application requires a much higher level of testing than a single-threaded one. The most important tip I have for testing your multithreaded application is to test it thoroughly on multiprocessor machines. And I don’t mean simply running your
C04622027.fm Page 183 Monday, October 9, 2006 10:34 AM

184 Part I The Gestalt of Debugging
application through a few paces; I mean continually testing your program in all possible sce-narios. Even if your application runs perfectly on single-processor machines, a multiprocessor machine will expose deadlocks you never thought possible.
The best approach to this kind of testing is to have the team’s developers run the application on multiprocessor machines every day. If you’re a manager and you don’t have any multipro-cessor machines in your shop, stop reading right now and immediately equip your developers and QA testers with multiprocessor machines! If you’re a developer without a multiprocessor machine, show this chapter to your manager and demand the proper equipment to do your job! Several people have written me and mentioned that showing this section really did help them get a multiprocessor machine, so don’t hesitate to tell your manager that John Robbins said the company owed you one.
How do you debug design-time assemblies? How do you debug add-ins?
No matter if you’re developing the world’s greatest ASP.NET component or the world’s best add-in, debugging those items is exactly the same. Anything loading into Visual Studio means that you’ll be debugging Visual Studio itself. For your assembly, go into the project properties, Debug tab, and then click Start External Program. In the text box, you’ll specify the path and directory to Devenv.exe. If Devenv.exe is in your PATH environment variable, which I would highly recommend, all you need to add is Devenv.
To debug your design-time components or add-ins, open the source file you want to debug and set a breakpoint. Whenever your assembly is loaded, Visual Studio will load the symbols and match up the source and line information from the breakpoint you’ve set. If it’s a valid breakpoint, you’ll break at the location.
To make it easier to set up debugging, the SettingsMaster add-in I discuss in Chapter 7, “Extending the Visual Studio IDE,” makes it trivial to set up a .SettingsMaster file with your common debugging settings so you can apply those settings with a click of the mouse.
How do you debug assembly-loading issues?
In the native C++ days, it was straightforward to find out why a LoadLibrary could not find a particular DLL. However, in the .NET world, things are a little bit different because we have things such as the GAC, satellite assemblies, <probing> elements, and <dependentAssembly> elements; it can become quite tricky to figure out exactly where an assembly is supposed to be loaded from when you’re staring at a FileLoadException. Fortunately, a mostly hidden utility that ships with the Framework SDK, the Assembly Binding Log Viewer, Fuslogvw.exe, can show you everything about assembly loading. The “Fus” in the program name stands for Fusion, which was the code name for the assembly loading portion of the CLR runtime.
C04622027.fm Page 184 Monday, October 9, 2006 10:34 AM

Chapter 4 Common .NET Debugging Questions 185
If you want to see assembly load details for any .NET program on a machine, start Fuslogvw.exe from an account with administrator rights and click the Settings button on the UI. One strange bug with Fuslogvw.exe is that unless you specify a custom logging directory, the log-ging won’t work. In the Settings dialog box, select the Enable Custom Path check box, and in the text box, specify a directory on the disk. The rest of the Settings dialog box lets you specify if you want to disable logging, log exception text, log binding failures, and log all binding. It’s quite eye-opening to look at how your application is going through the gyrations of loading assemblies, so I’d recommend that you click Log All Binds To Disk.
Once your application starts, you can double-click any of the entries in the main window to see exactly how and what the .NET runtime was doing to look for the assemblies your program loaded. In the entries, you’ll see exactly what was going on and where the runtime was looking for particular items so you can narrow down the assembly-loading problems.
How can I always get the source and line information in any unhandled exception?
You may have noticed that on your development machine when you’re running your applica-tion, the unhandled exception stack walk shows the source and line of all items on the stack. If you would like the same information on your production systems, and you control those machines, all you need to do is include the PDB files in the same directory as the binary, and the .NET StackWalk class will automatically pick them up.
As I described in Chapter 2, there are no secrets in NET PDB files like those in native code. They contain only the source and line information and the names of local variables. If you’re having trouble seeing exactly where an unhandled exception is coming from, dropping the PDB files into the same directory as the binary will give you the exact location where the exception is originating without giving up too much information.
What Tools Do You Use?When I do a presentation at a conference or a company, the most common question I get is: “What tools do you use?” As someone who’s spent a major portion of his career writing software development tools, everyone is interested in what I’m using. As a tool freak, I’m more than happy to share. I’ll use any tool that can save me five minutes because time is truly money.
Throughout this book, I’ve been discussing various tools as they come up in the discussion. In this portion of the chapter, I want to list some of the tools that I haven’t discussed or that require a more detailed explanation. If you’re looking for general documentation and usage tools, see Chapter 2. For add-ins and macros, see Chapter 7.
C04622027.fm Page 185 Monday, October 9, 2006 10:34 AM

186 Part I The Gestalt of Debugging
Everything from SysInternals!
All through the book, I’ve referred to particular tools from Bryce Cogswell and Mark Russinov-ich at www.sysinternals.com, but anything at the Web site will be a lifesaver. All the tools there are free, so the price is certainly right! While you might not have heard of Bryce before, you’ve definitely heard of Mark. He’s the coauthor, along with David Solomon, of Windows Internals, 4th Edition (Microsoft Press, 2005), the book on how Windows works. In addition to Mark’s writing, he’s the developer that broke the Sony rootkit story, which you can read about at http://www.sysinternals.com/blog/2005/10/sony-rootkits-and-digital-rights.html. As I was writing this book, both SysInternals and Winternals, Bryce and Mark’s commercial software companies, were acquired by Microsoft. Even with all that, Mark’s real claim to fame is that he used to be my neighbor in New Hampshire.
Process Explorer
Simply put, Process Explorer is what TaskManager hopes to be when it grows up. If you want to see anything about running processes on your computer, Process Explorer is the tool. In the “Know Where Your Assemblies Load” section in Chapter 2, I discussed the simple steps on how to use Process Explorer to view your relocated DLLs in your address space. Although that’s a great trick, there’s much more to Process Explorer that I want to cover here.
One of Process Explorer’s fortes is that it lets you look at the open handles for a process. In the upper window, select your process and press Ctrl+H to cause the lower window to show you all the handles. It can’t get much simpler than that. By default, Process Explorer shows you only the named handles. To see the unnamed handles, select Show Unnamed Handles And Mappings from the View menu. I will discuss why you want to name your handles and the strategies for doing so in the “The !handle Command” section of Chapter 6.
Because Process Explorer will update the Handle View as the process creates and deletes handles, you can see the exact state at any time. A great debugging trick is to sort by name in the Handle View by clicking on the Name column. If you see the same name repeatedly, you’re looking at a handle leak, and by naming your handles, you’ve made it trivial to find exactly which one is being leaked. I’ve found countless handle-leak problems in our clients’ applica-tions by using nothing more than the Handle View window in Process Explorer.
By double-clicking any handle in the Handle View, you can see the detailed information about that handle. For example, if the handle is an Event, you can see its type and signaled state. This information is invaluable for looking at your handle state and potentially looking at dead-locks based on synchronization handles. Right-clicking a handle will show two menu items, the Properties and Close Handle commands. When I asked Mark why he put that feature in, he said, “Because I could.” When I laughed and said that it was pretty dangerous, he said it was my job to come up with a reason for having it. The key reason for randomly closing handles in Process Explorer is so you can sneak into your manager’s office and close half the
C04622027.fm Page 186 Monday, October 9, 2006 10:34 AM

Chapter 4 Common .NET Debugging Questions 187
handles in Outlook to keep him from sending you annoying e-mail. I figure that’s a plenty good enough reason.
The upper window in Process Explorer, the Process View, is where you can see all sorts of very important information about the process itself. If you press the Delete key after highlighting a process, that is a true death kill. If you’ve ever run into the issue of which Task Manager won’t terminate a process, you’ll find that Process Explorer is the true process assassin and will kill any type of process you have rights to. Make sure that you have the Confirm Kill command on the Options menu selected so you don’t accidentally start terminating important processes, such as Csrss.exe (Client Server Runtime Subsystem) or Lsass.exe (Local Security Authority Service). Of course, if you kill either of those two processes, you’ll actually know about it because Windows will stop running.
Double-clicking a process or right-clicking and selecting Properties from the shortcut menu will get you the Properties dialog box for the process. The numerous tabs are self-explanatory, but I want to mention a couple highlights of which you might not be aware. The first is in the Performance Graph tab on which you see the process CPU utilization, Private Bytes history, and I/O Bytes history.
The CPU utilization and I/O Bytes history are self-explanatory, but Private Bytes deserves elaboration. The working set for a process, which is the Mem Usage column in the Processes tab in TaskManager, is all the physical memory the process needs at the current moment to execute. That’s a nice number, but it includes all the modules and files mapped into the address space along with all allocated memory. The Private Bytes are just the allocated mem-ory for the process. Thus, if you see the Private Bytes increasing over time, you may be looking at a memory leak. If Private Bytes, which is a standard performance counter, are increasing at the same rate as the .NET CLR memory counter # Bytes in All Heaps, the memory being used is .NET memory. If the Private Bytes are increasing at a sharper rate than the # Bytes in All Heaps, that’s a sign of a potential native code memory leak.
The Threads tab in the process Property page will show you the native call stacks for the threads in your process. However, to get the best call stacks, you’ll first need to tell Process Explorer about your Symbol Server. Select Configure Symbols from the Options menu, and in the Configure Symbols dialog box that pops up, the first text box, Dbghelp.dll path, needs to point to the latest version of Dbghelp.dll from your WinDBG installation. Make sure to point at the proper “bitness” and CPU version when specifying the location. In the Symbols Path text box, type the same value you set for the _NT_SYMBOL_PATH environment variable I discussed in “Set Up a Symbol Store” in Chapter 2.
What makes Process Explorer’s stack walking so interesting is that it will show you the call stack from user mode through to kernel mode. Without running a kernel debugger, Process Explorer is the only tool that shows you the real stack in your application. As with closing handles, the Threads tab in the process Properties dialog box allows you to kill a thread. I guess this is another one of those “because I can” moments for Mark.
C04622027.fm Page 187 Monday, October 9, 2006 10:34 AM

188 Part I The Gestalt of Debugging
One nice trick of the Process View is that it will place a background color on the process based on key information. If you go into the Configure Highlighting dialog box, you’ll see the legend for all the colors. I do want to point out that if you’re on a 64-bit machine, processes that contain .NET will be highlighted in the default yellow only if they are 64-bit processes. In other words, 32-bit processes, such as Visual Studio or those compiled as 32-bit, running in Windows on Windows (WoW), will not have the highlighting. However, if you select the process and look for MSCoree.dll in the DLL View, you can check if .NET is running in that process.
Have you ever tried to delete a file and received the dreaded message, “Error Deleting File or Folder, Cannot delete Foo: Access is denied. Make sure the disk is not full or write-protected”? You know you have access to the file, so it’s not a security error, but some process has the file open and you have no idea which one. Process Explorer comes to the rescue with the Process Explorer Search dialog box accessible by pressing Ctrl+F. In the dialog box, type in the partial name of the file you want to delete, and the Process Explorer Search dialog box will show you all DLLs and handles with that name. Select the handle, and the main Process Explorer win-dow will jump to show you that handle in the process that has it open. Right-click the handle in the main Process Explorer window and select Close Handle. Now you can delete the file. Of course, you may end up crashing the application that had it open, so alternatively, you can choose to kill the whole process instead.
Using the Process Explorer Search dialog box is also an easy way to see which of the many ASP.NET worker processes is hosting a particular ASP.NET site. Simply type in the name of the site in the Process Explorer Search dialog box, and you’ll find the instance immediately.
I’ve already mentioned a few hints for configuring Process Explorer, but the best new feature in the 10.0 version was the ability to set up column groups. Choosing Select Columns from the View menu brings up the dialog box in which you can select the columns that appear in the various list views in Process Explorer. The Process Image, Process Performance, and .NET tabs of the Select Columns dialog box are interesting because those contain the columns you can select for the Process View.
One weakness of Process Explorer is that there’s no way to export the column groups from one machine to the rest of your computers. Mark may add that feature in a future version, but a little poking around in the registry and a hint from Mark showed me where they were stored. In the .\ProcessExplorer\ ProcessExplorerColumnSets.reg file that installs with the book’s source code, are my column settings for Process Explorer. I’ve listed the column groups in Tables 4-1 and 4-2 so you can see the most important performance counters at a glance and why I have them turned on. Because Process Explorer sets up the column sets with accelerator keys, it’s trivial to switch between them. If you chose to use my .reg file, it will remove your first four existing column sets and replace them with mine.
Table 4-1 lists the columns I have turned on for Process Explorer Column Sets. Table 4-2 shows the unique values for each particular Column Set. Only the checked items are used; all other check-box items in the Select Column dialog tabs are clear.
C04622027.fm Page 188 Monday, October 9, 2006 10:34 AM

Chapter 4 Common .NET Debugging Questions 189
One major question I’ve gotten many times about Process Explorer is how a single binary manages to run natively on Windows 9x (yes, Mark still supports Windows 95!), 32-bit versions of Windows 2000, Windows XP, Windows Vista, and Windows Server 2003, and the x64 and IA64 versions of Windows XP, Windows Vista, and Windows Server 2003? When you consider that Process Explorer is loading a device driver, which has to be CPU specific, it’s obviously performing a little magic to get a single EXE to run without an installation.
The magic is all done through binary resources in the resources for the main binary. Procexp.exe is the 32-bit native application. When Procexp.exe runs on an x64 operating system, it detects
Table 4-1 Process Explorer Options for All Column Sets
Select Column Dialog Tab Checked Items
Process Image User Name
Description
Image Type (64 vs. 32 bit) if applicable on x64/IA64 systems
Integrity Level if applicable on Windows Vista systems
Process Performance CPU Usage
Table 4-2 Custom Column Sets for Process Explorer
Column Set Name DescriptionSelect Column Dialog BoxTab Checked Items
Private Bytes Used to monitor allocated memory in the process
Process Memory Private Bytes
Private Bytes History
Working Set Size
.NET GC Data To watch all garbage collection usage for .NET processes
.NET Gen 0 Collections
Gen 1 Collections
Gen 2 Collections
% Time in GC
Handle Data Looking for handle-based memory leaks
Process Performance Thread
Handle Count
Process Memory GDI Objects
USER Objects
I/O Data Looking for disk or other I/O hogs
Process Performance I/O Reads
I/O Writes
I/O Other
I/O History
C04622027.fm Page 189 Monday, October 9, 2006 10:34 AM

190 Part I The Gestalt of Debugging
the operating system and extracts from the 32-bit resources the x64 version of Process Explorer, called, appropriately enough, Procexpx64.exe. The x64 EXE is written to the disk, and Procexp.exe starts Procexpx64.exe. You can see this by looking at the Process Explorer Process View on an x64 machine. You’ll see the hierarchy of Procexp.exe starting Procexpx64.exe. As you can probably guess, the device driver Process Explorer uses is also embedded as a binary resource and is extracted and loaded when the appropriate bit version starts.
Process Monitor
For years, we’ve been using FileMon (http://www.sysinternals.com/utilities/filemon.html) and RegMon (http://www.sysinternals.com/utilities/regmon.html) from SysInternals to look at all the file and registry accesses on our computers. Mark and Bryce were looking at the state of their tools and decided to combine FileMon and RegMon and add more process-related activ-ity; thus Process Monitor was born. Like all SysInternals tools, it runs on all 32-bit and 64-bit based Windows operating systems from Windows 2000 forward.
What makes Process Monitor so interesting is that the filtering has taken a major jump in improvement. Prior tools did destructive filtering, which actually didn’t collect data when filters were applied, but Process Monitor keeps the data so you don’t lose what’s already been monitored. Additionally, the filters are drastically improved so you can narrow down the display on anything you want. My favorite filtering enhancement is that when creating filters, instead of relying on your typing the names for a process, the filters’ drop-down list will include all the processes currently running on the computer. Additionally, you can filter the output on items directly from the list view by right-clicking and selecting the item you want to filter on from the possible values.
Process Monitor allows you to save your particular filters so you can apply them again. This is incredibly convenient when you want to monitor multiple processes that make up a solution. The list of items that you can filter on contains all the different data items Process Monitor collects. If you want to filter on all RegRenameKey API calls, you can do so.
In addition to the great new filtering, another new feature I’m sure everyone will find useful is the ability to see the full stack on any of the events collected. As does Process Explorer, the Process Monitor call stacks show you both the user-mode and kernel-mode sides. It’s so trivial to see that your process is querying for a file or registry key over and over again that even a manager can figure out that doing that isn’t a good idea.
Reflector by Lutz Roeder
If it weren’t for Reflector (http://www.aisto.com/roeder/dotnet/), no one could do any .NET development at all. With this tool, we have the source code to the Framework Class Library (FCL) in addition to any other .NET code you want to look at. I’ve referred to Reflector all
C04622027.fm Page 190 Monday, October 9, 2006 10:34 AM

Chapter 4 Common .NET Debugging Questions 191
through the book because I used it to figure out all sorts of interesting problems, especially in Chapter 8, in which I used it to figure out how to write Code Analysis/FxCop rules even though rule development is completely undocumented.
What many people aren’t aware of is that Reflector offers a plug-in architecture so developers can extend its functionality. Lutz keeps a running list of new Reflector add-ins on his blog at http://www.aisto.com/roeder/Frontier/. There are lots of add-ins up there, including one to decompile to the Boo programming language if you’re feeling scary.
What I want to do is to show you the add-ins that I find most useful. Keep in mind that Lutz doesn’t worry too hard about backwards compatibility with add-ins, so if you get a new ver-sion of Reflector, your add-ins may break. You’ll want to keep the add-ins you rely on in your browser’s favorites list so you can check if an updated version that works with the latest and greatest Reflector has been released.
The first add-in is probably the most useful: Denis Bauer Reflector.FileDisassembler (http://www.denisbauer.com/NETTools/FileDisassembler.aspx). Whereas Reflector does a great job decompiling individual methods, what happens if you want to decompile a com-plete assembly? I guess you could manually copy and paste each method into a code editor, but by the time you finish, .NET will be out of style. With Reflector.FileDisassembler, you’ll select the assembly in Reflector’s tree control and then choose the File Disassembler from the View menu.
Reflector.FileDisassembler asks you which directory you want to decompile the assembly to and what project type it is. What makes Reflector.FileDisassembler so amazingly cool is that it will also produce a Visual Studio .NET 2003 project, which will open with a quick conversion in Visual Studio 2005, so you can compile the source directly.
Another add-in I like quite a bit is Reflector Diff AddIn by Sean Hederman at http://www.codingsanity.com/diff.htm. If you have two compiled assemblies you want to compare, this is the add-in for you. If you’ve ever experienced a situation in which you had a computer crash and you lost the source code for an assembly, this add-in will save your life (not that that’s happened to me)!
The final add-in I like is Kevin Dente’s Running Assembly Reflector Add-in from http://Weblogs.asp.net/kdente/articles/438539.aspx. It’s so nice to be able to select Open Running Assembly from the File menu and select directly an assembly from the application it is running in instead of wandering through a thousand directories.
The last point I want to address related to Reflector is protecting your intellectual property. Because you can see anything and everything with Reflector, your company managers and lawyers will twist themselves into knots if you show them Reflector. If you have intellectual property you need to protect, consider using an obfuscator. There are numerous obfuscators on
C04622027.fm Page 191 Monday, October 9, 2006 10:34 AM

192 Part I The Gestalt of Debugging
the market, but the one I like the best is Brent Rector’s Demeaner (http://www.wiseowl.com/). Don’t take my word for it—what do you think Lutz Roeder uses to protect Reflector?
When using an obfuscator, it’s a one-way street. Once you’ve obfuscated the Intermediate Language (IL), you can no longer debug the code because the binary no longer matches the PDB file. However, if you have a key algorithm you must protect, you have to do something. If you are going down the obfuscation route, you need to make sure that you’ve tested your application completely, because once it goes through the obfuscator, it’s a black box. Some obfuscators, such as Demeaner, offer tools to help with stack trace decoding, but there’s no way to load the obfuscated process into the debugger and start debugging.
Sells Brothers’ RegexDesigner.NET
Chris Sell’s RegexDesigner.NET (http://www.sellsbrothers.com/tools/#regexd) has saved me thousands of hours. As a regular expression aficionado, having an IDE to test all your regular expressions interactively is a wonderful thing. Additionally, once you finish the regular expres-sion, pressing Ctrl+G will generate the code you can paste into your application. You can find other regular expression testers on the Internet, but I find myself using RegexDesigner.NET far more than any of the others. In fact, several of the directories in the source code for the book contain .rep files for the regular expressions used in the code.
Regular expressions have always been one of the black art areas of software, but a single book, Mastering Regular Expressions, Third Edition (O’Reilly, 2006), by Jeffrey E. F. Friedl, will show you the way. It’s one of those books that every time I pick it up I learn something. You cer-tainly won’t learn anything about regular expressions from the Microsoft documentation, so you need this book.
To continue your learning about regular expressions, spend some quality time at the Regular Expression Library Web site (http://www.regexlib.com). There are many excellent examples of regular expressions that numerous people have contributed. Although you might not find the regular expression that does exactly what you need, you’ll probably find something quite close that you can tweak. Make sure to look at regular expressions contributed by Michael Ash and Steven Smith because they’ve both posted some quite complicated examples that show the real power of regular expressions.
Windows Installer XML (WiX)
Microsoft likes to say that .NET installations are outdated and we’ll all be doing XCOPY deployment from now on. I don’t know about you, but the only XCOPY deployment I’ve ever seen was HelloWorld.exe. You simply can’t copy real applications because there are database connections, registry settings, and all the pieces necessary to be a modern application. When I started the development for the book’s code, I wanted a good installation to handle the code in addition to all the add-ins and Visual Studio extensions that I had planned.
C04622027.fm Page 192 Monday, October 9, 2006 10:34 AM

Chapter 4 Common .NET Debugging Questions 193
After trying a few different tools, I settled on the Windows Installer XML (WiX), the free installer product from Microsoft available at http://wix.sourceforge.net. Having never built a modern installer before, I was able to architect the installation quite quickly with Gábor Deák Jahn’s excellent WiX tutorial at http://www.tramontana.co.hu/wix/. Additionally, I received answers to my few remaining questions as a result of subscribing to the WiX-Users mailing list. For searching the archive, use http://www.mail-archive.com/[email protected]/ because it’s better than the SourceForge mailing list viewer.
What I like so much about WiX is that it makes the developers responsible for installation by making the installation files themselves easy-to-edit XML files. You don’t need expensive licenses for special tools. Now if there’s a new file the developer needs to have installed, she simply adds it to the XML file. When I added a new directory to the book’s code, I could inte-grate it into the setup in about three minutes total. When I tried this with other tools, it was far more difficult than I felt it should have been.
You can look at the source code to see how I did the installation. The .\Install\MainInstall direc-tory contains the installation for the initial .msi file you’ll install to get the book’s code on your computer. Each top-level directory has a .wxs file that lists that directory’s files. The main install is built to include all the .wxs files that MSBUILD finds in the code directories minus those ded-icated to the WintellectToolsInstall.MSI. If you look at .\Install\MainInstall\Debugging.wxs, you’ll see the steps in comments to incorporate a new top-level directory into the main install.
To see a slightly more complicated installation, the .\Install\WintellectTools directory contains the installation code for WintellectToolsInstall.MSI. One of the advanced items I needed to perform in WintellectToolsInstall.MSI was to determine the version of Visual Studio installed. If the Visual Studio Team Developer or Visual Studio Team Suite is not on the machine, I disable the option to install the Code Analysis Rules. There are plenty of comments in the file, so you can see how it all fits together.
To give you an idea how powerful WiX is, consider that Microsoft Office, Visual Studio, SQL Server 2005, and almost everything else coming out of Microsoft these days is using WiX. It’s a great toolset and one you definitely want to get familiar with. The faster you push installa-tion tasks down to the developer level, the better install experience you will have for your applications.
Other Tools
Although there are numerous tools on my hard disk, as does any developer, I use some tools far more than others, so I want to give those tools their due here. One tool that I’m constantly using is the free Notepad2 from Florian Balmer (http://www.flos-freeware.ch/notepad2.html). With syn-tax highlighting supplied by the excellent Scintilla editing library (http://www.scintilla.org/), it starts up approximately a million times faster than Visual Studio. Of course it doesn’t have Microsoft IntelliSense or tooltips, but when you want to look at a source file quickly, it’s the perfect tool.
C04622027.fm Page 193 Monday, October 9, 2006 10:34 AM

194 Part I The Gestalt of Debugging
Because I started developing on PCs with Microsoft DOS 3.2 (I think I just showed my age!), the command line is part of my DNA. The default cmd.exe that comes with Windows is quite weak compared to JPSoft’s excellent 4NT (http://www.jpsoft.com). It’s a commercial product, but the time savings you get with its superb command line and extra commands will more than pay for itself within a month. Throw on the enhancements to the batch language and the batch file debugger, and you’ll wonder how you ever lived without it.
The new Windows PowerShell (http://www.microsoft.com/windowsserver2003/technologies/management/powershell/default.mspx) appears to be very interesting, but I haven’t fully gotten into it. The learning curve can be a bit steep, but it’s lacking some of the basic com-mand-line behaviors from 4NT and cmd.exe that I’m finding very hard to break. However, I’m willing to bet that by this time next year, I’ll be doing quite a bit of work in the PowerShell.
If your primary focus is ASP.NET applications or Web Services, seeing the data going back and forth between IIS and the browser is a great way to learn how things work. Additionally, some-times you want to change the data to test hard to test scenarios. To see every byte running across a system, there’s always WireShark (http://www.wireshark.org/), which is the complete network protocol analyzer. It’s simply amazing what you can see with WireShark.
Since most of us are interested in more the HTTP traffic with our ASP.NET applications, another tool, Fiddler (http://www.fiddlertool.com/fiddler/) is a HTTP Debugging Proxy. With Fiddler, you can change any of the HTTP data easily. There are many features in Fiddler to break on specific data and customize it extensively. My favorite feature of Fiddler is that you can export a .WebTest project directly from it so your logging can be played back with the Visual Studio testing tools.
The final tool I want to mention is one of those tools that looks like magic to me. I’ve written commercial profilers and looked extremely hard at the .NET Profiling API, but I can’t figure out how the incredible developers at SciTech were able to make their .NET Memory Profiler (http://memprofiler.com/) so amazingly fast. If you have ever wondered which object is in which garbage-collected generation, this is the tool for you.
You can look at your memory in almost any way you want and do it fast. It has overhead, but it’s lower than that of any of the other .NET memory-tracking tools. If you have an application that’s using a bit too much memory, now you can easily find exactly which objects are bub-bling up to generation 2 but being released. Since generation 2 garbage collections don’t come around that often, you can end up in situations in which you’re using more memory than you need, so you start paging and thrashing as memory is swapped in and out of the paging file.
My favorite view of all in .NET Memory Profiler is the real-time view. You can watch your mem-ory usage and see when garbage collections trigger certain operations. Add in comment calls to the .NET Memory Profiler API, and you’ll be able to see exactly who’s doing what to whom and what memory you’re using. The real-time view is worth the price of the entire tool!
C04622027.fm Page 194 Monday, October 9, 2006 10:34 AM

Chapter 4 Common .NET Debugging Questions 195
SummaryMy plan for this chapter was to provide answers to all those questions I’ve gotten from devel-opers over the last few years. Additionally, I wanted to prepare you for some of the upcoming chapters in which we’re going to dive deep into the debuggers and extend Visual Studio. I hope I was able to answer some of those questions about debugging and development float-ing around in your head.
Finally, don’t be afraid to ask questions of others. One of the big problems I’ve seen in my years of development is that many developers don’t want to ask questions because they feel it’s a sign of weakness that will prevent them from achieving Alpha Geek status. Nothing could be further from the truth! All the great developers I have ever worked with asked more questions than you could ever imagine. However, when they do ask a question, they first do their research and prepare in order to ask intelligent questions to not waste anyone’s time. Asking good questions is what makes a developer an Alpha Geek.
C04622027.fm Page 195 Monday, October 9, 2006 10:34 AM