chapter 5 cognitive, language, and literacy development … · literacy skills in immigrant school...
TRANSCRIPT
Chapter 5
Cognitive, Language, and Literacy Development
in Socio-culturally Vulnerable School Children –
The Case of Ethiopian Israeli Children
Michal Shany and Esther Geva
5.1 Introduction
Israel is an immigration country. New immigrants are faced with the challenges
of acculturation to new norms, values and expectations (Berry, 2003). This
chapter is concerned with the children of immigrants who came to Israel from
Ethiopia in the last two decades. According to official statistics of the Israeli
Municipalities (2006, 2007), children of Ethiopian families constitute 10% of
the immigrant children living in Israel. Various reports suggest that the school
dropout rates in this community is twice as high as in the general population.
The picture emerging from various reports (e.g., Levin et al., 2002) and from the
media (e.g., Yediot Axronot, January 1, 2008) is that the academic achievement
of children in this group is especially low, and that a disproportionate number
of children from this community are placed in special education programs
(Berhanu, 2005). Factors associated with different cultural norms and expecta-
tions (Levin-Rozalis & Shafran, 2003; Berhanu, 2005; Bar-Yosef, 2001), con-
formity to strongly entrenched traditional norms (for example, obedience to
elders of the family and the entire adult community, being quiet and respectful),
different patterns of socialization, and external locus of control, have been
offered as processes that contribute to the academic failure of individuals
from this group in the host country (Horowitz &Mosher, 1997; Korten, 1972).Concomitant with the absence of literacy skills in their home language, the
Ethiopian Israeli students need to develop their language and literacy skills in a
language (Hebrew) that is different from the language spoken at home (Amha-
ric). To date, most reports involving students from the Ethiopian immigrant
community have focused on gaps in general academic achievement between this
group and other immigrant groups, or in comparison to the general population
(e.g., Levin et al., 2002;Meitzav, 2006; Brookdale Institute, 2003). Indeed, there
is a growing body of research focusing on the language and literacy skills of
M. Shany (*)Department of Learning Disabilities, Faculty of Education, University of Haifa,Haifa, Israele-mail: [email protected]
M. Leikin et al. (eds.), Current Issues in Bilingualism, Literacy Studies 5,DOI 10.1007/978-94-007-2327-6_5, � Springer ScienceþBusiness Media B.V. 2012
77
various groups of immigrants, but this research has involved immigrants whoare literate to varying degrees in their first language (L1). To date, however, nostudies examined systematically, and in depth the development of componentsof language and literacy development in a large representative sample of Ethio-pian students. This chapter addresses this dearth.
Given global demographic immigration trends, a careful analysis of thesituation in the Ethiopian immigrant community in Israel is important becauseit likely mirrors other similar immigrant communities elsewhere. In particular,even though in the last decade the number of studies examining the develop-ment of language and literacy skills in second language (L2) learners hasmushroomed, very little is known about the development of language andliteracy skills in immigrant school children who are expected to transitionrapidly from an oral society to a Westernized, literate society. In this chapter,we report on research that targeted development in a number of relateddomains that underlie literacy development. In particular, the research focusedon the cultural, cognitive, language and literacy development of this vulnerablegroup of minority children, whose parents made an abrupt transition fromEthiopia to Israel in the 1980s and 1990s (Bender, 1985; Shenkut, 1991).
This cross-sectional study of Ethiopian Israeli children in grades one-to-sixprovides a window into development in the cognitive, linguistic, cultural, andliteracy domains. We compare the performance of the Ethiopian Israeli childrento that of their Non-Ethiopian peers, who live in the same poor communities, andattend the same classes. The following key questions are examined in this chapter:
1. Are there gaps between low SES Ethiopian Israeli and Non-Ethiopiangroups on cultural, cognitive, linguistic, and literacy dimensions?
2. In what domains do skill gaps that exist in the primary grades disappear inhigher grades?
3. In what domains do skills gaps persist or increase?
In order to better understand the issues facing the Ethiopian Israeli commu-nity it is essential to consider key aspects of the historical, socio-cultural,economic, and educational context of this community. It is also important todiscuss briefly the research literature concerning the development of languageand literacy skills in the societal language of children who speak a differentlanguage at home. Before we launch into a description of the study, we providein the next two sections an overview of these two areas.
5.1.1 The Ethiopian Israeli Community: The Socio-culturalContext
5.1.1.1 Transition from Ethiopia to Israel
Along with other groups, many Ethiopian Jews fled from Ethiopia to Sudan inthe 1970s due to a civil war and famine, and lived in refugee camps. Subse-quently, many Ethiopian Jews arrived in Israel in a number of waves in the
78 M. Shany and E. Geva
mid-1980s and 1990s. The migration experience was especially traumatic(Bar-Yosef, 2001) and arrival in Israel led to major changes in communityorganization (Berhanu, 2005). The bulk of this community was rural andthere is evidence that the communal, patriarchal and interconnected commu-nity structure already began to crumble with the transition to refugee camps.This process continued with the abrupt cultural changes that took place as aresult of contact with Israeli society (Ben-Ezer, 1992; Berhanu, 2005; Bodovski,David, & Eran, 1994; Kaplan, 1992). The majority of Ethiopian immigrantscame from a rural, oral tradition society, where over 90% of the communitymembers were illiterate (Bender, 1985; Shenkut, 1991). In Ethiopia they livedwithin a traditional structure, consisting of compounds of the larger kinshipgroup. The communities were led by elders and traditional priests who playedan important role in maintaining and transmitting communal-cultural know-ledge (Bodovski et al., 1994).
5.1.1.2 Employment, Education, Acculturation, and Language Proficiency
The declared policy of the Israeli government is to spread the immigrants fromEthiopia throughout the country. However, according to an official report ofthe Israeli Knesset (Parliament) in Israel (Vertsberger & Noyfeld, 2003), basedon the 2002 census, most congregate in a small number of towns in the Northand Center of Israel, and live in very poor neighborhoods. Most Ethiopianimmigrants are unskilled workers, and the unemployment rate among theEthiopian community living in Israel is higher than in the general population(Svirsky & Svirsky, 2002). Over 52% of Ethiopian families live below thepoverty line, in comparison with 16% in the general population (Bank of Israel,2006). Wide cultural, social, occupational, and literacy differences between thecommunity of Ethiopian origin and the host Israeli society persist (Bodovskiet al., 1994; Levin-Rozalis, 2000; Gaon, King, & Volda-Tzadik, 2006; Offer,2004). More recent statistics provide a more promising picture. Whereas in themid-90s, 55% of adults of Ethiopian origin ages 22–64 had no formal educa-tion, in recent years this rate has dropped to 42%. Another promising statistic isthe fact that the number of individuals who obtained at least high schooleducation has increased from 6% to 15% (Israel Statistical Municipalities,2006, 2007).
As might be expected in any group of immigrants, about 40% of the immi-grants who came in the 1980s and 1990s, and 60% of more recent immigrantsfrom Ethiopia indicate that they have only minimal command of Hebrew. Inaddition, 55% of the male adults cannot read or write Hebrew, and thispercentage is even higher among women (70%) (King, Effrati, & Netzer,2003). In comparison with other immigrant groups, the linguistic integrationof immigrants from Ethiopia has been alarmingly slow (Barkon & Avinor,1995, Bar-Yosef, 2001; Spolsky, 1996). Upon arrival to Israel, Ethiopian adultscould attend a 1-year intensive Hebrew language and literacy program, knownas Ulpan. In our sample about 35% of the mothers and fathers attended this
5 Cognitive, Language, and Literacy Development in Socio-culturally Vulnerable . . . 79
basic, Hebrew based, adult education program, and for many this was the firsttime they were exposed to written language of any sort.
In Ethiopian culture, the main responsibility of fathers is to ensure that theirchildren behave properly and respect the elders of the family (Berhanu, 2005;Horowitz & Mosher, 1997; Korten, 1972; Yediot Axronot, January 1, 2008).But in Israel the children speak Hebrew better than their parents, and as a resultthe balance of power in the home has shifted to other family members, and thefathers do not bare the same authority (Segal, 2006). Once their children beginto attend school Ethiopian Israeli parents tend to be less involved, since theyfeel that the school is an official authority that bears responsibility for theirchildren’s education. However, the schools interpret this lack of involvement aslack of interest (Bar-Yosef, 2001; Stravas & Olshtain, 2006). Most Ethiopianimmigrant families do not share with the Israeli school system a language orconcepts about the actual role that parents in other segments of Israeli societyare likely to undertake in the ‘‘education enterprise’’ of their children (Stravas &Olshtain, 2006).
In this regard, it is useful to borrow from sociology the ‘‘cultural capital’’framework (Bourdieu & Passeron, 1990). Cultural capital involves the mainte-nance and transmission of forms of knowledge, values, education, and expecta-tions, and includes the interplay of individual values and attributions, culturalgoods (e.g., books, computers), and educational institutions such as academiccredentials and diplomas. According to Bourdieu and Passeron (1990) disadvan-tages and inequalities are maintained from one generation to the next, partlythrough the educational system that reproduces social structures. Using thisframework, it is possible to see that the Ethiopian Israeli community does notpossess the cultural capital resources that would enable it to transmit to theirchildren the modes of language, literacy, and strategic skills that are crucial forfurther learning in a westernized culture. From a socio-cultural perspective, it isobvious that there is no ‘‘fit’’ between children’s home culture and the culture ofthe school and classroom. According to this view, poor academic performancedoes not necessarily reflect the negative influence of children’s home culturalcharacteristics on their learning, but rather, the inability of schools to adaptinstruction to relevant aspects of children’s home cultures (Rueda, August, &Goldenberg, 2006). In spite of various well-intentioned programs, it has beendifficult to bridge the difference between Ethiopian and Israeli cultural values,attributions, and expectations. The prevailing societal view is one of deficit, and asa result the community has been further alienated from the mainstream culture.
5.1.1.3 Academic Achievement
A recent, large scale, comprehensive study of academic achievement in mathe-matics and literacy skills compared the achievement of children of Ethiopianand Russian immigrants to that of non-immigrant Israeli students, in Grades 5,10 and 11 (Levin et al., 2002). In general, achievement scores in both immigrantgroups were lower than those of the non-immigrant comparison group.
80 M. Shany and E. Geva
However, the researchers found that the literacy skills of immigrant studentsfrom Russia catch up after 10–11 years of schooling in the societal language,and already by Grade 9 the gap is rather small. However, the performance ofyouth of Ethiopian origin is consistently lower than that of the Russian immi-grant and non-immigrant students, and the gaps in academic achievementcontinue to be rather large even for the 10% of Ethiopian students whocomplete their high school education (Levin et al., 2002). According to Barkonand Avinor (1995), young children growing up in Ethiopian families areexposed to oral Amharic at home, but immigrant adolescents have lost theirL1 (Amharic) skills, and they continue to have poor Hebrew languageproficiency.
Other research has shown that, over and above Socio-Economic Status(SES), parental education correlates with educational outcomes for immigrantchildren (Hooddinoot, Lethbridge, & Phipps, 2002; Willms, 2003). In addition,research has shown that both home-based and community-based variablesmediate language and literacy achievement and are significant predictors oflanguage and school achievement (Leseman & de Jong, 1998; Willms, 2003). Inthis regard, one would not expect perhaps that children of Ethiopian Israeliimmigrants who live in poverty should fare any better than children of othercommunities who live in poverty. However, as is evident from the discussionabove, in this community one notes the interaction of a number of familial andcommunity level risk factors, including the break-up of traditional institutions,and diminishing exposure to traditional modes of literacy (Segal, 2006). Otherinteracting factors include societal prejudice, lack of fit in cultural resourcesbetween the culture of origin and the host country, poverty and living in poorcommunities, and having parents who come from a culture that is predomi-nantly oral. Poverty interacts with societal power relations that prevent theminority group from ensuring that aspects of the curriculum, assessment, andteacher education reflect and acknowledge the values of the vulnerable com-munity and its modes of transmission (Cummins, in press). On the whole, thesefactors come together to create a challenging backdrop against which childrenof immigrants from Ethiopia need to develop language and literacy skills andachieve academically.
5.2 Theoretical Framework: L2 Literacy Development
Reading, writing and language skills are complex cognitive activities involvingsub-components that interact with each other and affect each other. Eventhough the Ethiopian Israeli children are known to be underachieving acade-mically, it is not known to what extent they underachieve on all aspects oflanguage and literacy, nor has their performance on various language andliteracy skill components been examined developmentally. The recent literatureon language and literacy development in second language (L2) learners is ofsome relevance in the present context.
5 Cognitive, Language, and Literacy Development in Socio-culturally Vulnerable . . . 81
5.2.1 Word Level Skills in L2 Learners
Some might expect that due to lack of language proficiency in the target lan-
guage, students learning to read in L2might have poorer word level reading skills
than monolingual (L1) students. However, the conclusions of a recent compre-
hensive systematic review conducted by the National Literacy Panel (NLP), that
focused on research on students who develop their language and literacy skills in
a language different from their home language (August & Shanahan, 2006), are
more nuanced. It appears that the difference between language-minority students
and their native-speaking counterparts on word level skills such as word recogni-
tion, decoding, and spelling is not very robust. This general conclusion is based
on studies involving immigrant children learning English (the societal language)
as their second language (ESL) with various home languages, including Punjabi
(Chiappe & Siegel, 1999), Urdu (Mumtaz & Humphreys, 2001), Italian
(D’Angiulli, Siegel, & Maggi, 2004), Portuguese (Da Fontoura & Siegel, 1995),
Spanish (Durgunoglu, Nagy, & Hancin-Bhatt, 1993; Lindsey, Manis, & Bailey,
2003) and from various otherESL backgrounds (Lesaux&Siegel, 2003; Chiappe,
Siegel, &Wade-Woolley, 2002; Geva, Yaghoub-Zadeh, & Schuster, 2000;Wade-
Woolley & Siegel, 1997). This conclusion has also been reached with regard to
other language combinations such as Turkish-Dutch (e.g., Verhoeven, 1990),
Arabic-English (Abu-Rabia&Siegel, 2002), English-Farsi (Arab-Moghaddam&
Senechal, 2001; Gholamain & Geva, 1999) and French-English, (Comeau,
Cormier, Grandmaison, & Lacroix, 1999; Lafrance & Gottardo, 2005). The
overall conclusion from these studies is that accurate word level skills are not
heavily dependent on oral language proficiency.Of particular relevance are a number of studies that focused on the word level
skills of English speaking children who were learning Hebrew in bilingual
English-Hebrew schools (Geva & Siegel, 2000; Geva & Wade-Woolley, 1998;
Geva, Wade-Woolley & Shany, 1997; Wade-Woolley & Geva, 2000). These
studies have shown that in spite of limited language proficiency in Hebrew,
these middle-class children can learn to decode and spell Hebrew words with
accuracy, and decode Hebrew words with efficiency. These outcomes can be
understood to some extent by considering typological differences in orthographic
and language features (Katz & Frost, 1992). Thanks to the simplicity of the
phonological structure of Hebrew (Ziegler & Goswami, 2005; Share, 2008), the
lexical outcome of assembling into words a series of matched grapheme-
phonemes in vowelled Hebrew is unequivocal, and can be accomplished with
accuracy even in the absence of linguistic proficiency. In this regard, Share (2008)
concludes in a recent review that ‘‘These findings converge on the conclusion that
both lexical and extra-lexical factors, such as syntax and vocabulary, are super-
fluous when spelling-sound relations are straightforward, but are indispensable
when the orthography is opaque.’’ This observation should apply to immigrant
children whose Hebrew language proficiency is underdeveloped, including the
Ethiopian Israeli children who were the focus of this study.
82 M. Shany and E. Geva
5.2.2 Reading Comprehension and L2 Learners
Successful reading comprehension requires the integration of various compo-
nent skills, including accurate and efficient word reading, reading fluency,
awareness of text features, language proficiency (including vocabulary, mor-
phological, grammatical, and pragmatic skills), background knowledge, and
various reading strategies (Deacon & Kirby, 2004; Muller & Brady, 2001;
Pressley, 1998; National Reading Panel, [NRP], 2000; RAND).Recent studies of language-minority students indicate that the reading com-
prehension performance of minority students falls well below that of their
native-speaking peers (Lesaux & Geva, 2006). As part of the NLP systematic
review, the authors of one of the chapters (Lesaux & Geva, 2006) conclude that
numerous variables at the individual level (e.g., L2 vocabulary, background
knowledge, motivation) and contextual level (e.g., familiarity with text struc-
ture conventions, home literacy, demographics) affect the second-language
reading comprehension of language-minority students.Various variables contribute to L2 reading comprehension, including word
level reading skills such as automatic word recognition and decoding skills
(Reese, Garnier, Gallimore, & Goldenberg, 2000; Verhoeven, 1990), metalin-
guistic awareness (Carlisle, Beeman, Davis, & Spharim, 1999), background and
cultural knowledge (Carlisle et al., 1999; Droop & Verhoeven, 2003; Lee &
Schallert, 1997), the use of cohesion markers and reading strategies (Padron &
Waxman, 1988), and language skills, including vocabulary, morphological and
syntactic knowledge (Droop & Verhoeven, 2003; Geva & Yaghoub-Zadeh,
2006; Nakamoto, Lindsey, & Manis, 2008; Proctor, Carlo, August, & Snow,
2005; Yaghoub Zadeh, Farnia, & Geva, 2011). As noted above, in spite of
poorer L2 language proficiency, L2 learners do not typically differ on basic
word-based skills such as word recognition, pseudoword decoding and spelling.
However, L2 oral language comprehension skills are strongly and consistently
related to text comprehension.As noted in the NLP systematic review, demographic factors such as
parental education and poverty indicators have also been consistently
shown to be related to reading comprehension of minority students (Lesaux
with Koda, Siegel, & Shanahan, 2006). In general, the more home literacy
experiences and opportunities children have, the more likely they are to do
well on literacy outcomes (Goldenberg et al., 2006). In addition, research on
the contributions of home practices has shown that the attitudes, literacy
related activities, and the degree of linguistic sophistication that children are
exposed to at home from an early age have a long lasting impact on later
academic achievement (August & Shanahan, 2006). However, for children
who come from cultures that do not promote written language literacy, there
may not be a fit between the language, learning and strategies that are
utilized and valued in the L2 environment and the skills and values fostered
at home.
5 Cognitive, Language, and Literacy Development in Socio-culturally Vulnerable . . . 83
According to the ‘‘Linguistic Interdependence Hypothesis’’ (Cummins,1991), reading skills in the native language (L1) will transfer to reading in theL2, provided that an adequate level proficiency in the L2 has been achieved. Aspart of the NLP review Dressler and Kamil (2006) conclude that there isevidence for cross-language transfer of reading comprehension ability in bilin-guals speaking different languages (e.g., Lee & Schallert, 1997; Reese et al.,2000; Royer & Carlo, 1991; Verhoeven, 1994). Indeed, transfer effect has beennoted in various studies involving minority language students. Importantly,Gersten (1999) cautions, however, that transfer of skills from the L1 to the L2will occur when well trained teachers deliver adequate L2 instruction. In thepresent context, where there is no systematic exposure to the language andliteracy skills of the home language and where the teachers are less likely to betrained in adequate L2 instruction, such transfer is less likely to occur.
5.2.3 Underlying Cognitive-Linguistic Processes in L1 and L2
Moving from contextual to intra-individual factors, studies examining underlyingprocessing skills have consistently found that cognitive skills such as phonologicalprocessing skills, including phonemic awareness, rapid lexical access, and phono-logical memory, predict word identification skills in English, the L2. (For moredetails see the conclusion of the NLP report, August & Shanahan, 2006).
Another body of research has examined cognitive and neurological processesthat underlie the reading process in spite of typological differences in the spokenlanguage or the orthography. The focus of these studies has been on examining‘‘universal’’ cross-linguistic commonalities and ‘‘typological’’ differences in therole processes such as phonemic awareness and rapid serial naming. Support foruniversal commonalities comes, for example, from studies comparing good andpoor readers across orthographies (e.g., Da Fontoura & Siegel, 1995; Katzir,Shaul, Breznitz, & Wolf, 2004). It suggest that regardless of the orthographiesinvolved, bilinguals or L2 learners who have decoding and spelling problems intheir native language will have difficulties in their L2 as well.
Evidence for typological effects comes from research on bilingual children(e.g., Geva & Siegel, 2000; Geva, Wade-Woolley & Shany, 1993; Mumtaz &Humphreys, 2001; Wang & Geva, 2003; Wade-Woolley & Geva, 2000). Thisresearch suggests that the type of reading and spelling errors observed in noviceL2 students reflects typological influences.On thewhole, this research suggests thatthe ‘‘typological’’ and ‘‘universal’’ frameworks are complementary (Geva, 2007).
In his review, Share (2008) argues that ‘‘accuracy. . .is largely a non-issue forthe majority of the worlds’ (alphabetic) orthographies in which performancelevels approach ceiling by the end of Grade 1 (Seymour, Aro, &Erskine, 2003)’’,and that ‘‘when accuracy asymptotes quickly, speed and fluency become thediscriminating measures of developmental and individual differences. . .’’. Infact, this point is more or less relevant also when ESL readers are compared tonon-ESL readers. For example, Geva andYaghoub-Zadeh (2006) examined the
84 M. Shany and E. Geva
extent to which ESL and monolingual English speakers are similar on various
aspects of reading fluency, and whether reading fluency in ESL and monolin-
gual children can be understood in terms of similar underlying processing
components. In spite of an oral language proficiency advantage in the English
monolingual group, they did not have an advantage on any of the cognitive and
reading measures. Two robust predictors of word reading fluency in both
language groups were rapid automatized naming (RAN) and phonological
awareness (PA), though oral sentence comprehension made a modest contribu-
tion as well. Of particular relevance here are two additional studies byGeva and
her colleagues (Geva et al., 1993, 1997). Geva et al. (1993) provide evidence that
phonemic awareness may play a more temporary role in learning to read
Hebrew than it does in English. In that study the authors found a correlation
of 0.62 between word reading and phonemic awareness in children’s L1 (Eng-
lish), but only 0.32 for Hebrew (the L2). Geva et al. (1997) found that reading
efficiency indices (based on accuracy and speed) of word recognition in L1
(English) and L2 (Hebrew) were very similar, though when it came to reading
simple narratives children were more efficient in English, their L1, than in
Hebrew, a language in which their language proficiency was minimal.On the whole then, it appears that processing components such as phonemic
awareness and rapid automatized naming (RAN) underlie word-based skills of
L2 learners of alphabetic languages, but language proficiency is important for
text fluency and text comprehension. There is ample evidence that rapid auto-
matized naming may be a strong(er) predictor of reading fluency in regular
writing systems such as Hebrew and Dutch (Breznitz, 2006; de Jong & van der
Leij, 2003;Wimmer, 1993) than in writing systems that are not as regular, such as
English. As for L2 children, there is evidence that ESL readers may be slower at
naming simple items than their L1 counterparts at the beginning of school, but
that RAN speed improves and catches up with their L1 peers (e.g., Gholamain &
Geva, 1999; Lesaux & Siegel, 2003; Geva & Yaghoub Zadeh, 2006). RAN
predicts reading accuracy and fluency in primary level ESL readers (Geva
et al., 2000; Geva & Yaghoub-Zadeh, 2006; Lesaux & Siegel, 2003).Given this literature, there is good reason to expect that the performance of
Ethiopian Israeli minority children whose Hebrew language skills are develop-
ing at school would improve at the same rate as their monolingual counterparts
on underlying cognitive processing components such as naming speed and
phonemic awareness. However, given the available literature it may be expected
that the performance of Ethiopian Israeli minority children on higher level,
more complex language and literacy tasks may fall increasingly behind. On the
whole, this brief literature review suggests that Ethiopian Israeli minority
children will not display serious difficulties on simple cognitive underlying skills
related to word-based reading skills, nor will they experience difficulties in
developed word-based reading skills. However, it is reasonable to hypothesize
that their Hebrew (L2) language skills will continue to be underdeveloped and
that, relatedly, they will be having difficulties with reading comprehension.
5 Cognitive, Language, and Literacy Development in Socio-culturally Vulnerable . . . 85
5.3 Method
5.3.1 Participants
5.3.1.1 Children
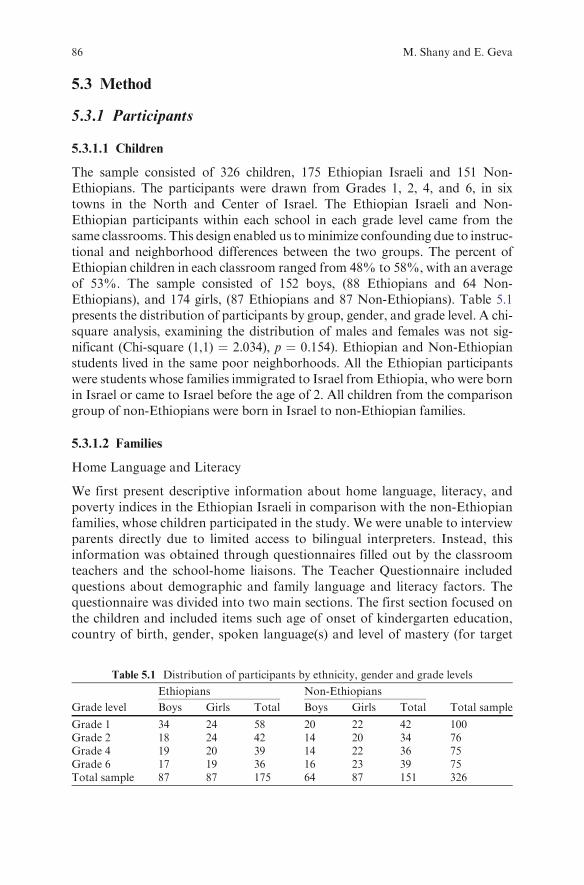
The sample consisted of 326 children, 175 Ethiopian Israeli and 151 Non-Ethiopians. The participants were drawn from Grades 1, 2, 4, and 6, in sixtowns in the North and Center of Israel. The Ethiopian Israeli and Non-Ethiopian participants within each school in each grade level came from thesame classrooms. This design enabled us tominimize confounding due to instruc-tional and neighborhood differences between the two groups. The percent ofEthiopian children in each classroom ranged from 48% to 58%, with an averageof 53%. The sample consisted of 152 boys, (88 Ethiopians and 64 Non-Ethiopians), and 174 girls, (87 Ethiopians and 87 Non-Ethiopians). Table 5.1presents the distribution of participants by group, gender, and grade level. A chi-square analysis, examining the distribution of males and females was not sig-nificant (Chi-square (1,1) ¼ 2.034), p ¼ 0.154). Ethiopian and Non-Ethiopianstudents lived in the same poor neighborhoods. All the Ethiopian participantswere students whose families immigrated to Israel from Ethiopia, who were bornin Israel or came to Israel before the age of 2. All children from the comparisongroup of non-Ethiopians were born in Israel to non-Ethiopian families.
5.3.1.2 Families
Home Language and Literacy
We first present descriptive information about home language, literacy, andpoverty indices in the Ethiopian Israeli in comparison with the non-Ethiopianfamilies, whose children participated in the study. We were unable to interviewparents directly due to limited access to bilingual interpreters. Instead, thisinformation was obtained through questionnaires filled out by the classroomteachers and the school-home liaisons. The Teacher Questionnaire includedquestions about demographic and family language and literacy factors. Thequestionnaire was divided into two main sections. The first section focused onthe children and included items such age of onset of kindergarten education,country of birth, gender, spoken language(s) and level of mastery (for target
Table 5.1 Distribution of participants by ethnicity, gender and grade levels
Ethiopians Non-Ethiopians
Grade level Boys Girls Total Boys Girls Total Total sample
Grade 1 34 24 58 20 22 42 100Grade 2 18 24 42 14 20 34 76Grade 4 19 20 39 14 22 36 75Grade 6 17 19 36 16 23 39 75Total sample 87 87 175 64 87 151 326
86 M. Shany and E. Geva
children and their parents). The second part focused on family variables such asparental occupation, number of children and other adults living with the family,number of rooms, and level of mastery of spoken and written language skills inHebrew and Amharic. It should be noted that since all participants were drawnfrom the same neighborhoods and schools, inspection of the questionnairesrevealed that the reported demographic data did not differ across grades.Therefore, we report the aggregate data for the whole sample.
Among the Ethiopian mothers, 1.1% spoke only Hebrew, 72.5% spoke amixture of Hebrew and Amharic, and 26.5% spoke only Amharic. Among thenon-Ethiopian mothers, 57.1% spoke only Hebrew at home and 42.9% spoke amixture of Hebrew and one of 9 other languages (including Russian, Kavkaz,followed byFrench, Persian,Kurdish, Romanian, Spanish, and Portuguese). Thedifference in distribution between the Ethiopian and non-Ethiopian groups interms of maternal literacy (in Hebrew and/or another language) was significant(Chi-square (3,1) 347.16, p< 0.0001). The patterns are highly similar for fathers,except that among Ethiopian fathers (in contrast with Ethiopian mothers),30.5% speak only Amharic, and have no proficiency in Hebrew. It was impos-sible to collect reliable information about parental education. Based on nationalsurveys, Gould, Lavy, and Paserman (2004) report that parents of Ethiopianchildren typically have 1 or 2 years of education, compared to an average of over11.5 years for parents of Israeli Jewish children. There is no reason to believe thatthese national patterns do not apply to the Non-Ethiopian parents in our sample.
Poverty
A series of t-tests was used to compare the groups on available poverty indicators.Significant differences between the Ethiopian and Non-Ethiopian groups werefound on: (a) mean number of rooms at home: M ¼ 3.45 (SD ¼ 0.90) in theEthiopian families versus M ¼ 4.09 (SD ¼ 1.28) in non-Ethiopian families(t (1, 315)¼ 5.07, p < 0.0001); (b) mean number of family members per house-hold: M ¼ 7.41 (SD ¼ 2.21) in the Ethiopian families versus M ¼ 5.54(SD ¼ 1.26) in non-Ethiopian families (t (1,172) ¼ �7.02, p < 0.0001); and(c) density (mean number of persons per room): M ¼ 4.50 (SD ¼ 2.23) in theEthiopian families versus M ¼ 2.33 (SD ¼ 1.51) in non-Ethiopian families(t (1, 165) ¼ �7.77, p < 0.0001). On all these indicators the Ethiopian familiesfared worse than the Non-Ethiopian families. Parent employment was ratedaccording to a three-level scale: 1¼ unemployed; 2¼ unskilled work; 3¼ skilledwork. The results indicated that the vocational training level of the Non-Ethiopians was significantly higher, M ¼ 2.27 (SD ¼ 0.63) versus M ¼ 1.83(SD¼ 0.69) among the Ethiopianworkers (t (1, 260)¼ 5.36, p< 0.0001). Overall,30.5%of the Ethiopian fathers and 54%of themothers were unemployed, versus5.9% of the non- Ethiopian fathers and 28% of the non-Ethiopian mothers.Again, these differences were significant for both fathers (Chi-square (6,6) 29.0p < 0.0001) and mothers (Chi-square (6,6) 36.05 p < 0.0001). These differencesare in line with various reports based on national surveys.
5 Cognitive, Language, and Literacy Development in Socio-culturally Vulnerable . . . 87
5.3.2 The Curriculum
The Ethiopian and Non-Ethiopian children learn the regular, centralized, curri-
culum, designed by the Ministry of Education (http://cms.education.gov.il). In
elementary schools in Israel, minority children do not receive any formal instruc-
tion in their home language.1 In another study based in the same dataset, Ben-
David (2005) reported that the Ethiopian children had very little proficiency in
Amharic and that very fewwere able to engage in simple conversation in Amharic.
Similar results were reported for Ethiopian children in kindergarten (Shany,
Geva, & Melech, 2010). In informal communication (Dec 26, 2007), Ministry of
Education supervisors indicated to us that various enrichment programs are
available, but implementation is not compulsory or systematic, and that it depends
on funding allocation by the municipality and local decisions at the school level.
Enrichment programs were more likely to be implemented in the early years
following immigration than it has been in more recent years. No formal follow-
up on these programs, their implementation and outcomes is available.
5.3.3 Measures
5.3.3.1 Cognitive
Non-verbal Ability
The Raven’s Matrices test (Raven & Court, 1976) was administered. This test is
designed to assess non-verbal intellectual and reasoning ability and the ability
to make sense of increasingly complex visually presented stimuli, to draw
meaning out of ambiguity and to perceive and think clearly. The test, consid-
ered by some to be relatively culture-free, consists of 5 subtests. Scores can
range from 0 to 36, and the analyses were based on raw scores because norms
for immigrant children are not available. Age in months was used to control for
developmental effects where relevant.
Rapid Automatized Naming (RAN)
Object Naming Speed (RAN-O): This subtest of the reading and writing diag-
nostic test ‘‘Alef Ad Taf’’ (Shany, Lachman, Shalem, Bahat, & Zeiger, 2006)
consists of pictures of 5 objects: flower, cat, book, watch and flag, each repeated
randomly 10 times. The 50 printed objects are printed on a sheet (10 items per
line) and the child is asked to name them out loud as fast as s/he can. Practice
items ensure that the child is familiar with the names of the objects. Results are
reported in terms of time (in seconds) to name the objects. Reliability
1 Beginning in Grade 7, some schools offer weekly, 2–3 h of instruction in the home language(http://cms.education.gov.il).
88 M. Shany and E. Geva
(correlation with Rapid Alternate Stimulus subtest, Shany et al., 2006) is
r ¼ 0.61 for Grade 2, r ¼ 0.59 for Grade 4, and r ¼ 0.63 for Grade 6.Digit Naming Speed (RAN-D): This subtest (Shany et al., 2006) consists of
5 digits: 1, 5, 9, 3 and 7. Each digit is repeated randomly 10 times. The 50digit, printed on a sheet (10 items per line) are presented to the child, who has
to name them as fast as s/he can. Practice items ensure that the child isfamiliar with the names of the digits. Results are reported in terms of time
(in seconds) to name the digits. Reliability (correlation with RAN-L subtest,
Shany et al., 2006) is r ¼ 0.74 for Grade 2, r ¼ 0.69 for Grade 4, and r ¼ 0.67for Grade 6.
Letter Naming Speed (RAN-L): This subtest (Shany et al., 2006) consists of 5
Hebrew letters: ס (/s/), ,א (/a/), ד /d/), ג (/g/) and ל /l/), each repeated randomly 10times. The 50 letters, printed on a sheet (10 items per line), are presented to the
child, who has to name them aloud as fast as s/he can. Practice items ensure thatthe child is familiar with the names of the digits. Results are reported in terms of
time (in seconds) to name all the letters. Reliability (correlation with RAN-D,
Shany et al., 2006) is r ¼ 0.74, r–0.69, and r ¼ 0.67 for Grades 2, 4, and 6respectively.
Working Memory
This subtest (Shany et al., 2006) was adapted from Daneman and Carpenter(1980). In this test the participant hears sentences, is asked to complete the
missing word in each, and then repeat the missing words to all the sentences inthe same sequence. For example: The hens lay ___(eggs); An airplane flies in
the ___(sky). In this example, the child has to provide the words ‘‘eggs’’ and
‘‘sky’’ and then repeat these two words. The number of items in sets increasesgradually from 2 to 6. The child receives one point for each correctly repeated
word and an extra point for repeating all the words in each set in the correctsequence. The Cronbach Alpha for this test is 0.81.
5.3.3.2 Cultural Literacy
Faces and Places
This subtest is taken from the standardized Hebrew version of the K-ABC
(Fraser, Shimrovski, Wolf, & Hazani, 1994). The subtest includes 33 picturesinvolving ‘‘faces and places’’ that have to be named by the participants. The
faces and places include famous objects (e.g., Noah’s ark), figures in famousstories (e. g., Pinocchio, Little Red Riding Hood), famous monuments (e.g., the
WailingWall), and symbols (e.g., the Star of David). Scores can range from 0 to
33, and raw scores were used in the analyses. The split-half reliability of thisnormed test is r ¼ 0.70.
5 Cognitive, Language, and Literacy Development in Socio-culturally Vulnerable . . . 89
5.3.3.3 Language Skills
Phonetic Discrimination
This subtest was taken from the Diagnostic Battery for Reading Processes inHebrew (Lachman& Shalem, 1998). Fifteen items were randomly taken from theoriginal test which consists of 30 word pairs. Four items consist of identical pairsand 11 of different pairs. The items may differ on the first, second or the finalconsonant (e.g., ‘‘safar’’ – tzafar (counted – honked), ‘‘kibel’’ —‘‘kipel’’ (received-folded). The tester says each pair one at a time and the child has to say whetherthe words are ‘‘the same’’ or, ‘‘not the same’’. Scores range from 0 to 15.2
Phonemic Awareness
Phonemic awareness was assessed with a subtest of the standardized Alef AdTaf test (Shany et al., 2006). This subtest focuses on children’s ability to segmentspoken real words into phonemes (e.g., ‘‘Say xatul (cat)’’. ‘‘Now say it withoutthe /x/’’ (response: /atul/). This is a more demanding task as the correct responsebegins with the vowel /a/). None of the outcomes of this phoneme level wordmanipulation is a real word in Hebrew. National norms are available for thistask (Shany et al., 2006). Scores can range from 0 to 16, and Alpha-Cronbach is0.87 in Grades 2 and 4, and 0.86 in Grade 6.
Receptive Vocabulary
Children’s command of Hebrew receptive vocabulary was assessed with astandardized Hebrew adaptation of the Peabody Picture Vocabulary Test(PPVT, Dunn, 1965) (Solberg & Nevo, 1979). In this test the child hears aword, is shown four pictures, and is asked to point to the picture that matchesthe word heard. There are 110 items on the test and testing is stopped when thechild makes 6 consecutive errors. National norms are available for this task(Solberg & Nevo, 1979). Split-half reliability for the Hebrew version is 0.90.
Syntactic Skills
TheTest ofReceptiveOralGrammar (TROG;Bishop, 1989), adapted toHebrewfrom English is a receptive task of syntactic skills. Children listen to progressivelylonger and increasingly more complex sentences, presented one at a time, and foreach item are asked to point to one of four pictures that matches the sentence.Foils include syntactic and semantic distracters. There are 4 items testing each of20 syntactic categories such as negatives (e.g., ‘‘the boy is not running’’); passives(e.g., ‘‘the elephant is pushed by the child’’); x but not y (e.g., ‘‘The box but not thechair is red’’); and complex sentences (e.g., ‘‘The circle in which there is a star is
2 The authors of this test do not report on reliability.
90 M. Shany and E. Geva
red’’). Unless all the items within a category are correct, the whole category isdiscounted. Each correct category receives a score of 1, and test scores can rangefrom 0 to 20. The Cronbach alpha for this test is 0.70.
5.3.3.4 Hebrew Reading and Spelling
Word Reading
Word reading was assessed with a subtest of the standardized Alef Ad Taf test(Shany et al., 2006). This subtest focuses on children’s ability to read 38 isolatedwords, representing various morphological structures, and arranged accordingto length and frequency. Measures of rate (WPM) and accuracy (% of errors)are calculated. Alpha-Cronbach is 0.90 in Grade 2, 0.85 in Grade 4, and 0.75 inGrade 6. Alpha-Cronbach and test norms are unavailable for Grade 1.
Spelling
This test was developed specifically for the present research and has no nationalnorms. In this task the child has to write 48 dictated words. Each word ispresented orally in isolation, in context (within a sentence) and again in isola-tion. The testers are instructed not to stress homophones (such as the phoneme /X/ in the word ‘‘xalav’’ (translation: milk). The overall Alpha-Cronbach is 0.87.
Listening Comprehension
This test, developed by Shatil (2002), requires participants to listen to a recordedstory about a little boy and his dog. After having heard the story the child hears aseries 12 statements related to the story, each presented twice, and has to respond‘‘correct’’ or ‘‘incorrect’’ to each item. Test-retest reliability is 0.72.
Reading Comprehension
In this experimental task, six texts were developed altogether, 2 for each gradelevel (2, 4, and 6).3 For each grade level one text describes how to prepare apopular Ethiopian dish (Injara) and the other describes how to prepare a MiddleEastern dish (Cousous). While the content of the texts is identical across gradelevels, the texts become more complex from grade to grade in terms of range ofvocabulary and syntactic complexity. Ten questions that address four levels ofcomprehension follow each text. The items assess vocabulary, main idea in eachparagraph, main idea and application of the knowledge and syntactic structures.Two experts (linguists) rated the texts and confirmed the increasing level oflinguistic complexity of the stories. The Cronbach alpha was low in Grade 2(0.42,) but acceptable 0.67, and 0.63, for Grades 4, and 6, respectively.
3 In Israel reading comprehension is not evaluated in Grade 1, and listening comprehension isevaluated instead.
5 Cognitive, Language, and Literacy Development in Socio-culturally Vulnerable . . . 91
5.3.4 Procedures
Data collection took place towards the end of the school year, between Apriland June. Tasks were administered individually, by trained graduate students ofeducation. In Grades 1 and 2 the tasks were administered over two sessions,lasting 75 min each. A 1-week interval separated the two sessions. In Grades 4and 6 the tasks were administered in one, 2-h, session. The cognitive measureswere administered first, followed by the language and literacy measures.
5.4 Results
5.4.1 Do Cognitive, Cultural, Language, and Literacy SkillsCorrelate with SES?
Even though all the participating schools were ranked as low SES, as discussedabove, there were significant differences between the Ethiopian and Non-Ethiopian samples on various demographic variables. Ethiopian children arerarely exposed to Hebrew at home. Instead, they are exposed to Amharic or amixture of Hebrew and Amharic, and only about a third of their parents arereported to be literate in Hebrew. In addition, Ethiopian Israeli parents who areemployed are more likely to hold less skilled jobs, and housing density is higherin Ethiopian families than in non-Ethiopian.
We first examinedwhether differences between poverty and ‘‘extreme’’ povertymight be related in a systematic manner to various cognitive, language andliteracy skills. Correlations indicated that housing density and parental occupa-tion rank correlated significantly with group (r ¼ 0.49, p < 0.01) and with eachother (r¼ 0.31, p< 0.01), indicating that in the Ethiopian groupmore people livein each household than in the Non-Ethiopian group. These correlations suggestthat, in contrast with the Non-Ethiopian group, Ethiopian parents were morelikely to be unemployed or to be unskilled laborers than skilled workers. Finally,with two exceptions (Faces and Places, and PhonemicAwareness), neither house-hold density nor parental occupation correlated with any of the child-levelmeasures. The correlation of occupation rank with Phonemic Awareness andFaces and Places was low butt significant (r ¼ 0.13, p < 0.05, and r ¼ 0.12,p< 0.05, respectively). That is, in both groups a relatively higher occupation rankwas associated with somewhat better performance on these two child-level mea-sures. In other words, in this study, ethnicity, poverty indicators, and culturaldifferences appear to form one complex cluster, but the variance on the availablepoverty and low SES indicators did not correlate in a systematic and directmanner with the bulk of child level cognitive, language, and literacy measures.
A multiple analysis of variance (MANOVA) was run on the cognitive andlanguage measures. Another MANOVA was run with the literacy measures. Inthese analyses, the effects of grade and group and the interaction of grade bygroup were examined. Where a significant interaction was found, a Bonferroni
92 M. Shany and E. Geva
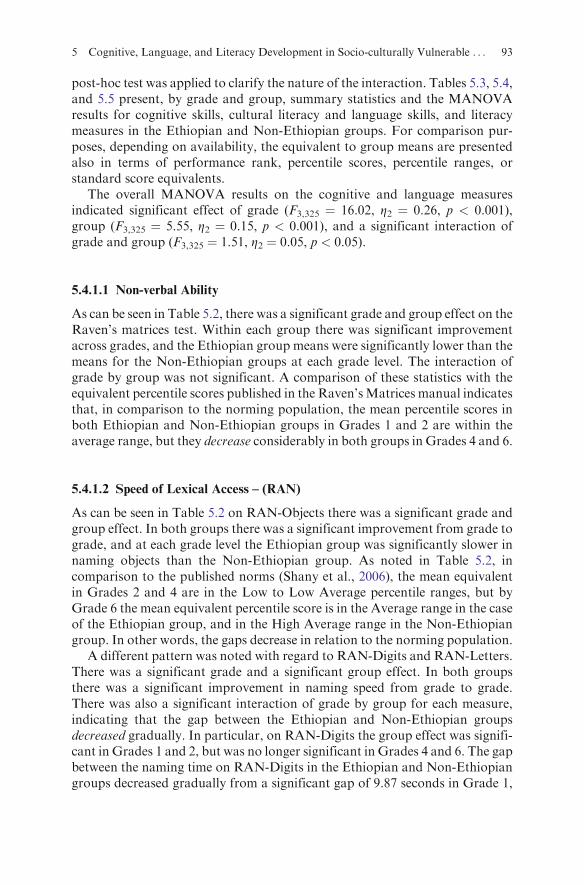
post-hoc test was applied to clarify the nature of the interaction. Tables 5.3, 5.4,and 5.5 present, by grade and group, summary statistics and the MANOVAresults for cognitive skills, cultural literacy and language skills, and literacymeasures in the Ethiopian and Non-Ethiopian groups. For comparison pur-poses, depending on availability, the equivalent to group means are presentedalso in terms of performance rank, percentile scores, percentile ranges, orstandard score equivalents.
The overall MANOVA results on the cognitive and language measuresindicated significant effect of grade (F3,325 ¼ 16.02, Z2 ¼ 0.26, p < 0.001),group (F3,325 ¼ 5.55, Z2 ¼ 0.15, p < 0.001), and a significant interaction ofgrade and group (F3,325 ¼ 1.51, Z2 ¼ 0.05, p < 0.05).
5.4.1.1 Non-verbal Ability
As can be seen in Table 5.2, there was a significant grade and group effect on theRaven’s matrices test. Within each group there was significant improvementacross grades, and the Ethiopian group means were significantly lower than themeans for the Non-Ethiopian groups at each grade level. The interaction ofgrade by group was not significant. A comparison of these statistics with theequivalent percentile scores published in the Raven’sMatrices manual indicatesthat, in comparison to the norming population, the mean percentile scores inboth Ethiopian and Non-Ethiopian groups in Grades 1 and 2 are within theaverage range, but they decrease considerably in both groups in Grades 4 and 6.
5.4.1.2 Speed of Lexical Access – (RAN)
As can be seen in Table 5.2 on RAN-Objects there was a significant grade andgroup effect. In both groups there was a significant improvement from grade tograde, and at each grade level the Ethiopian group was significantly slower innaming objects than the Non-Ethiopian group. As noted in Table 5.2, incomparison to the published norms (Shany et al., 2006), the mean equivalentin Grades 2 and 4 are in the Low to Low Average percentile ranges, but byGrade 6 the mean equivalent percentile score is in the Average range in the caseof the Ethiopian group, and in the High Average range in the Non-Ethiopiangroup. In other words, the gaps decrease in relation to the norming population.
A different pattern was noted with regard to RAN-Digits and RAN-Letters.There was a significant grade and a significant group effect. In both groupsthere was a significant improvement in naming speed from grade to grade.There was also a significant interaction of grade by group for each measure,indicating that the gap between the Ethiopian and Non-Ethiopian groupsdecreased gradually. In particular, on RAN-Digits the group effect was signifi-cant in Grades 1 and 2, but was no longer significant in Grades 4 and 6. The gapbetween the naming time on RAN-Digits in the Ethiopian and Non-Ethiopiangroups decreased gradually from a significant gap of 9.87 seconds in Grade 1,
5 Cognitive, Language, and Literacy Development in Socio-culturally Vulnerable . . . 93
Table
5.2
Perform
ance
ofEthiopianandnon-Ethiopianchildrenin
grades
1,2,4,and6oncognitivecomponents:Descriptivestatisticsand
MANOVA
results G
rade1
Grade2
Grade4
Grade6
Tasks
Eth
(n¼
58)
NEth
(n¼
42)
Eth
(n¼
42)
NEth
(n¼
34)
Eth
(n¼
39)
NEth
(n¼
36)
Eth
(n¼
36)
NEth
(n¼
39)
Gradeeffect
F(3,323)
Groupeffect
F(1,325)
Grade�
group
F(3,322)
Raven’s(0–36)a
17.34
(4.64)
19.67
(4.89)
20.62
(5.01)
21.85
(4.11)
24.46
(4.94)
26.08
(5.01)
26.03
(4.82)
29.12
(4.72)
60.26***
Z 2¼
0.36
14.85***
Z 2¼
0.05
0.550
Percentiles
37
67
44
50
22
30
13
22
RAN–O
(sec.)
68.41
(13.99)
58.74
(13.07)
61.19
(11.23)
54.94
(11.21)
49.46
(10.77)
46.25
(7.18)
42.22
(10.96)
37.41
(7.47)
73.66***
Z 2¼
0.41
22.62***
Z 2¼
0.07
1.31
PercentilesRange
NA
NA
16.1–25
35.1–65
25.1–35
35.1–65
35.1–65
65.1–80
Perform
ance
Rank
Low
Average
Lowav.
Average
Average
Highav.
RAN–D
(sec.)
50.32
(15.05)
40.45
(8.61)
40.84
(11.10)
32.88
(6.25)
28.79
(7.50)
28.11
(5.09)
24.44
(5.27)
21.97
(5.62)
93.37***
Z 2¼
0.47
25.31***
Z 2¼
0.07
4.57**
Z 2¼
0.04
PercentilesRange
NA
NA
7.1–16
16.1–25
16.1–25
25.1–35
35.1–65
65.1–80
Perform
ance
Rank
VeryLow
Low
Low
Lowav.
Average
Highav.
RAN–L(sec.)
60.66
(20.51)
48.90
(10.66)
49.90
(16.14)
42.50
(8.70)
35.51
(8.48)
34.00
(5.88)
28.75
(5.56)
27.38
(5.76)
78.85***
Z 2¼
0.43
16.00***
Z 2¼
0.05
3.58*
Z 2¼
0.03
PercentileRange
NA
NA
25.1–35
16.1–25
7.1–16
16.1–25
35.1–65
35.1–65
Perform
ance
Rank
Lowav.
Low
VeryLow
Low
Average
Average
WorkingMem
ory
b
(0–45)a
8.22
(5.52)
(n¼
55)
9.58
(6.81)
(n¼
38)
9.66
(4.78)
(n¼
29)
14.71
(7.39)
(n¼
21)
15.85
(6.30)
(n¼
26)
17.06
(8.25)
(n¼
35)
18.87
(9.04)
(n¼
15)
20.67
(7.33)
(n¼
9)
24.08***
5.28*
0.96
PercentilesRange
NA
NA
35.1–65
80.1–90
65.1–80
65.1–80
65.1–80
80.1–90
Perform
ance
Rank
Average
High
Highav.
Highav.
Highav.
High
aRangeofscores;
bA
separate
ANOVA
dueto
missingdata
onthismeasure
–F(3,228);***p<
0.001;**p<
0.01;*p<
0.05
94 M. Shany and E. Geva
to a non-significant difference of 0.98 and 2/47 seconds in Grades 4 and 6,respectively. As for a comparison to the norms published by Shany et al. (2006)one notes in Table 5.2 that whereas the mean equivalent scores were in the VeryLow to Low percentile ranges in Grades 2 and 4, by Grade 6, the equivalentpercentile scores were in the Average to High Average ranges.
Likewise, on RAN-Letters the mean gap between Ethiopian and Non-Ethiopian groups decreased from a significant difference in favor of the Non-Ethiopian group in Grades 1 and 2 to a non-significant difference in Grades 4and 6. Relatedly, with regard to the published norms (Shany et al., 2006),whereas the mean equivalent scores were in the Very Low to Low percentileranges in Grades 2 and 4, by Grade 6, the equivalent scores were in the Averagepercentile ranges.
5.4.1.3 Working Memory
On Working Memory there was a significant grade and group effect, and theinteraction of group by grade was not significant. Performance improved sig-nificantly from grade to grade, and at each grade level the Ethiopian group wasconsistently lower than the Non-Ethiopian group. In comparison to the pub-lished norms (Shany et al., 2006), the performance of the Ethiopian and Non-Ethiopian groups is not lower than in the norming population, and the equiva-lents of the mean percentages vary from Average to High.
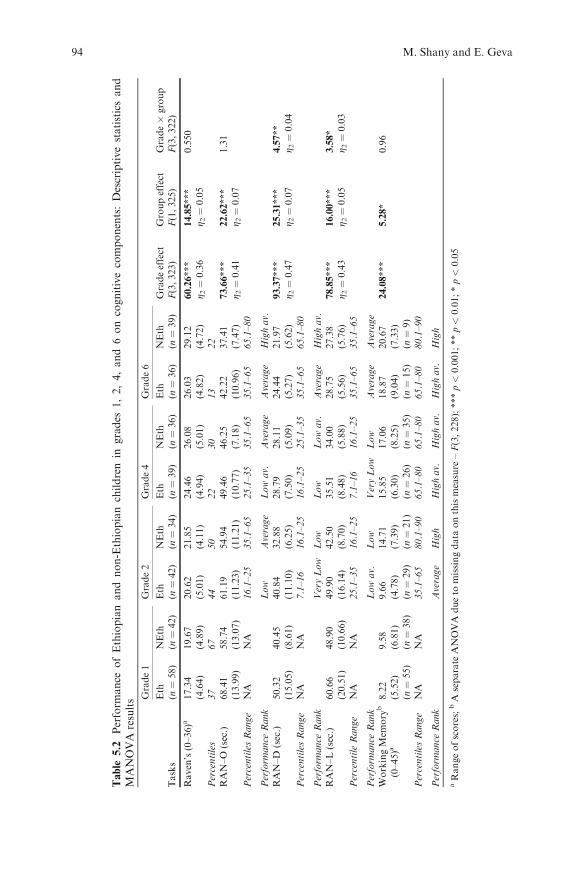
5.4.1.4 Cultural Literacy
As can be seen in Table 5.3, there was a significant grade and group effect onthis measure. Mean scores increased significantly from grade to grade, and theEthiopian group performed consistently below the Non-Ethiopian group ateach grade level. The means on the K-ABC for the Ethiopian group were 1standard deviation below the normed mean at each grade level, whereas in theNon-Ethiopian group the standard score equivalents at each grade level were0.5 standard deviations below the normed mean.
5.4.2 The Development of Language Skills
5.4.2.1 Phoneme Discrimination
On Phone Discrimination there was a significant grade effect. Students in bothgroups improved significantly their performance from grade to grade. Neitherthe effect of group nor the interaction of grade by group were significant. Incomparison with a large study (Lachman& Shalem, 1998) it appears that thetwo groups performed within developmental norms.
5 Cognitive, Language, and Literacy Development in Socio-culturally Vulnerable . . . 95
Table5.3
Perform
ance
ofEthiopianandnon-Ethiopianchildrenin
grades
1,2,4,and6onculturalandlanguagecomponents:Descriptivestatistics
andMANOVA
results
Grade1
Grade2
Grade4
Grade6
Tasks
Eth
(n¼
58)
NEth
(n¼
42)
Eth
(n¼
42)
NEth
(n¼
34)
Eth
(n¼
39)
NEth
(n¼
36)
Eth
(n¼
36)
NEth
(n¼
39)
Gradeeffect
F(3,323)
Groupeffect
F(1,325)
Grade�
group
F(3,322)
CulturalLiteracy
FacesandPlaces:
KAB-C
(0–33)a
6.98
(2.98)
8.28
(2.68)
8.44
(3.39)
9.73
(3.26)
11.44
(3.44)
13.72
(3.02)
15.14
(3.79)
18.05
(4.44)
113.41***
Z 2¼
0.52
26.23***
Z 2¼
0.08
1.09
Standard
Scores
Equivalent
88
92
85
92
84
93
86
93
LanguageSkills
Phonem
eDiscrim
inationb
No.correct(0–15)a
11.88
(1.94)
(n¼
57)
11.80
(2.22)
(n¼
41)
12.56
(2.07)
(n¼
41)
12.73
(1.84)
(n¼
33)
12.72
(2.11)
(n¼
39)
13.50
(1.08)
(n¼
36)
13.58
(1.38)
(n¼
36)
13.51
(1.25)
(n¼
39)
13.94***
Z 2¼
0.12
0.975
0.970
Percentile
Scoresare
equivalentto
percentile30-40
Phonem
icAwarenessNo.
Errors
(0–16)a
10.24
(4.22)
10.12
(3.95)
9.72
(3.71)
8.60
(3.12)
7.02
(4.10)
6.25
(4.26)
4.62
(4.14)
4.30
(3.68)
34.98***
Z 2¼
0.25
1.75
0.26
PercentilesRange
35.1–65
35.1–65
16.1–25
25.1–35
35.1–65
35.1–65
Perform
ance
Rank
Average
Average
Low-av.
Low-av.
Average
Average
Vocabulary:PPVT
(0–110)a
49.77
(8.52)
52.36
(7.42)
52.26
(11.45)
52.44
(12.61)
59.69
(11.52)
63.78
(10.26)
66.61
(10.38)
78.79
(11.78)
73.34***
Z 2¼
0.41
16.46***
Z 2¼
0.05
4.72**
Z 2¼
0.05
Standard
Scores
Equivalent
63
65
51
51
45
50
45
58
Grammaticalskills
TROG
(0–20)a
12.83
(3.69)
14.21
(3.75)
13.79
(3.63)
14.24
(1.97)
15.97
(1.94)
17.00
(1.59)
17.22
(1.91)
17.28
(3.16)
31.51***
Z 2¼
0.23
4.89*
Z 2¼
0.02
0.84
Percentile
25
38
25
38
25
38
25
25
aRangeofscores;
bA
separate
ANOVA
dueto
missingdata
onthismeasure;***p<
0.001;**p<
0.01;*p<
0.05
96 M. Shany and E. Geva
5.4.2.2 Phonemic Awareness
There was a significant grade effect on this task. Performance improved sig-nificantly between Grade 2 and Grade 4, and between Grade 4 and Grade 6, inboth groups. The group and interaction effects were not significant. Theequivalents of the means in the Ethiopian group are in the Average range inGrade 2, in the Low-Average range in Grade 4, and again in the Average rangein Grade 6. The equivalents of the means in the Non-Ethiopian group areidentical to those noted in the Ethiopian samples (Shany et al., 2006) (Compar-ison statistics are unavailable for Grade 1).
5.4.2.3 Vocabulary
As can be seen in Table 5.3, there was a significant grade effect on the vocabu-lary test. Post-hoc tests indicated that there was no significant differencebetween Grades 1 and 2, but the increase from Grade 2 to Grade 4 and fromGrade 4 to Grade 6 was significant. There was also group effect, and a sig-nificant grade by group effect. The mean in the Ethiopian group was signifi-cantly lower than in the Non-Ethiopian group only in Grade 6. Notably, inrelation to the norming population, the mean equivalent vocabulary standardscores decrease over time in both groups.
5.4.2.4 Grammatical Skills
As can be seen in Table 5.3, there was a significant grade effect. Growth fromGrade 2 to 4 was statistically significant, but the mean differences in the numberof blocks mastered in Grades 1 vs. 2 and in Grades 4 vs. 6 were not statisticallydifferent from each other within each group. At each grade level the mean in theEthiopian group was statistically lower than in the Non-Ethiopian group. Theequivalent blocks in the norming population are 15, 16, 18, and 18 in Grades 1,2, 3, and 6, respectively. That is, performance in both groups is below thecomparable published norms for these age groups, and in fact, relative to thepopulation, level of performance is constant in the Ethiopian group, anddecreases in the Non-Ethiopian group.
5.4.3 The Development of Reading and Writing Skills
5.4.3.1 Word Reading Accuracy
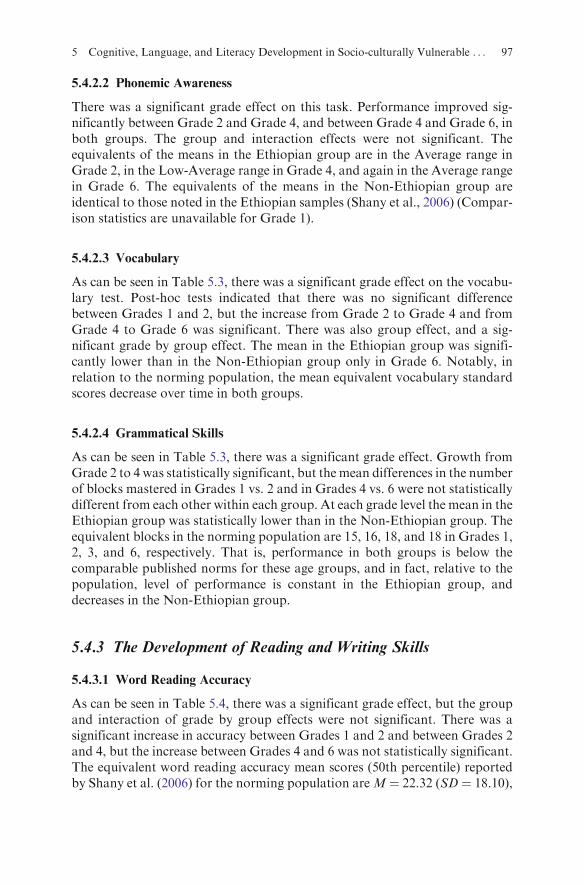
As can be seen in Table 5.4, there was a significant grade effect, but the groupand interaction of grade by group effects were not significant. There was asignificant increase in accuracy between Grades 1 and 2 and between Grades 2and 4, but the increase between Grades 4 and 6 was not statistically significant.The equivalent word reading accuracy mean scores (50th percentile) reportedby Shany et al. (2006) for the norming population areM ¼ 22.32 (SD¼ 18.10),
5 Cognitive, Language, and Literacy Development in Socio-culturally Vulnerable . . . 97
Table
5.4
Perform
ance
ofEthiopianchildrenandnon-Ethiopianchildrenin
grades
1,2,4,and6onword
level
readingcomponents:Descriptive
statisticsandMANOVA
results
Grade1
Grade2
Grade4
Grade6
Tasks
Eth
(n¼
58)
NEth
(n¼
42)
Eth
(n¼
42)
NEth
(n¼
34)
Eth
(n¼
39)
NEth
(n¼
36)
Eth
(n¼
36)
NEth
(n¼
39)
Gradeeffect
F(3,323)
Groupeffect
F(1,325)
Grade�
group
F(3,322)
Words–WPM
(38words)
16.93
(8.48)
20.25
(12.28)
26.07
(15.21)
36.27
(20.03)
48.88
(24.21)
43.33
(15.55)
60.71
(17.12)
67.91
(22.00)
111.15***
Z 2¼
0.51
3.94*
Z 2¼
0.01
3.01*
Z 2¼
0.03
PercentilesRange
NA
NA
25.1–35
65.1–80
35.1–65
25.1–35
35.1–65
35.1–65
Perform
ance
Rank
NA
NA
Low-average
High-average
Average
Low-average
Average
Average
Words–Accuracy
%Errors
43.26
(27.39)
33.99
(22.86)
32.78
(23.31)
34.44
(24.09)
25.44
(21.09)
19.66
(13.17)
16.45
(12.46)
14.04
(13.54)
20.86***
Z 2¼
0.16
2.78
1.04
PercentilesRange
Nonorm
sNonorm
s25.1–35
16.1–25
7.1–16
16.1–25
16.1–25
16.1–25
Perform
ance
Rank
Nonorm
sNonorm
sLow-average
low
Very-Low
low
low
low
Spelling(0–48)#
correcta
20.52
(3.30)
27.92
(11.06)
32.06
(12.10)
37.25
(8.59)
40.78
(8.52)
42.81
(5.08)
45.33
(5.27)
44.69
(5.74)
79.89***
Z 2¼
0.43
10.48***
Z 2¼
0.03
2.81*
Z 2¼
0.03
Discourse/
Reading
Comprehensiona
10.18
(1.90)
10.62
(1.40)
6.93
(3.70)
7.14
(3.62)
17.41
(6.37)
19.48
(6.16)
17.14
(3.63)
19.53
(4.02)
F¼
1.50;(1,93),
p¼
0.223
F¼
0.565;(1,63),p<
0.555
F¼
1.89;(1,69),
p<
0.174
F¼
7.16;(1,74),
p<
0.009
aRangeofscores;***p<
0.001;*p<
0.05
98 M. Shany and E. Geva
M ¼ 14.14 (SD ¼ 12.94), and M ¼ 10.02 (SD ¼ 8.93) for Grades 2, 4 and 6,respectively. (Comparison statistics are not available for Grade 1). As can beseen in Table 5.3, both groups perform consistently in the low range at eachgrade level.
5.4.3.2 Word Reading Rate
As can be seen in Table 5.4, there was a significant grade effect, a significantgroup effect, and a significant interaction of grade by group. Increase in wordreading rate was significant from grade to grade in both groups. In addition, thegroup difference in word reading rate was significant only in Grade 2. (Com-parison statistics are not available for Grade 1). In comparison to the normingpopulation, performance in both the Ethiopian and Non-Ethiopian groups ateach grade level was in the average range.
5.4.3.3 Spelling
As noted in Table 5.4, there was a significant grade effect, a significant groupeffect, and a significant grade by group effect. The increase from Grade 1 to 2and from Grade 2 to 4 was significant, but Grades 4 and 6 were not statisticallydifferent from each other. The Ethiopian group was lower than the Non-Ethiopian group in Grades 1 and 2, but not in Grades 4 and 6.
5.4.3.4 Discourse Comprehension
Listening Comprehension
Data for this task are available only for Grade 1. A one-way ANOVA indicatedthat the groups did not differ from each other. The group means are equivalentto the 75th percentile, as reported by Shatil (2002) in a large representativesample (n ¼ 349).
Reading Comprehension
There is no standardized reading comprehension test in Hebrew. As notedabove, the content of the tests remained constant across grade levels, but thetexts administered in Grades 2, 4, and 6 varied as a function of length, vocabu-lary, and language complexity. One-way ANOVAs, with group as the indepen-dent variables (summarized in Table 5.4), revealed that in Grades 2 and 4 thegroups did not differ from each other, but by Grade 6, the Non-Ethiopiangroup outperformed the Ethiopian group.
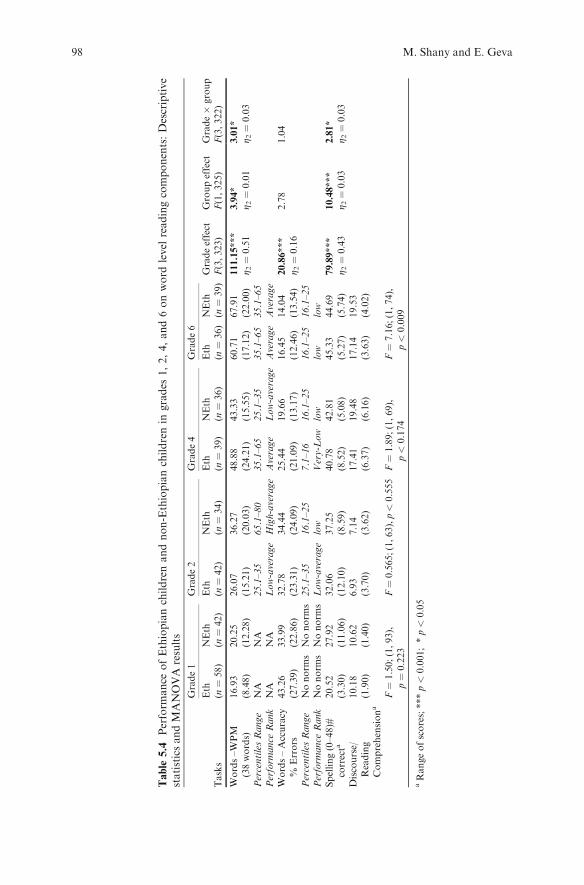
Table 5.5 summarizes the general trends that emerged in the results shown inTable 5.4. The columns on the left summarize the group comparisons and thecolumns on the right summarize comparisons with various norming popula-tions. These trends are addressed in the Discussion section below.
5 Cognitive, Language, and Literacy Development in Socio-culturally Vulnerable . . . 99
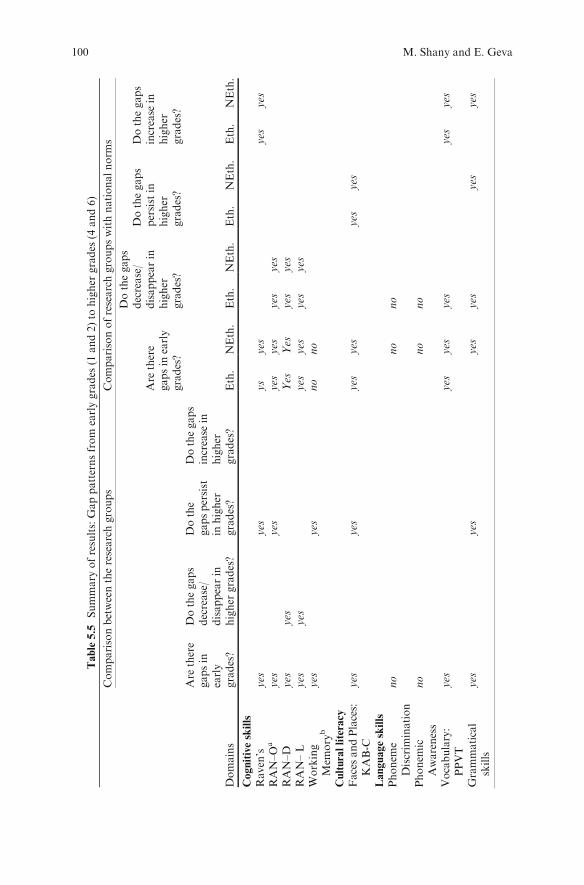
Table5.5
Summary
ofresults:Gappatternsfrom
earlygrades
(1and2)to
higher
grades
(4and6)
Comparisonbetweentheresearchgroups
Comparisonofresearchgroupswithnationalnorm
s
Are
there
gapsin
early
grades?
Dothegaps
decrease/
disappearin
higher
grades?
Dothegaps
persistin
higher
grades?
Dothegaps
increase
inhigher
grades?
Domains
Are
there
gapsin
early
grades?
Dothegaps
decrease/
disappearin
higher
grades?
Dothe
gapspersist
inhigher
grades?
Dothegaps
increase
inhigher
grades?
Eth.
NEth.
Eth.
NEth.
Eth.
NEth.
Eth.
NEth.
Cognitiveskills
Raven’s
yes
yes
ys
yes
yes
yes
RAN–O
ayes
yes
yes
yes
yes
yes
RAN–D
yes
yes
Yes
Yes
yes
yes
RAN–L
yes
yes
yes
yes
yes
yes
Working
Mem
ory
byes
yes
no
no
Culturalliteracy
FacesandPlaces:
KAB-C
yes
yes
yes
yes
yes
yes
Languageskills
Phonem
eDiscrim
ination
no
no
no
Phonem
icAwareness
no
no
no
Vocabulary:
PPVT
yes
yes
yes
yes
yes
yes
Grammatical
skills
yes
yes
yes
yes
yes
yes
100 M. Shany and E. Geva
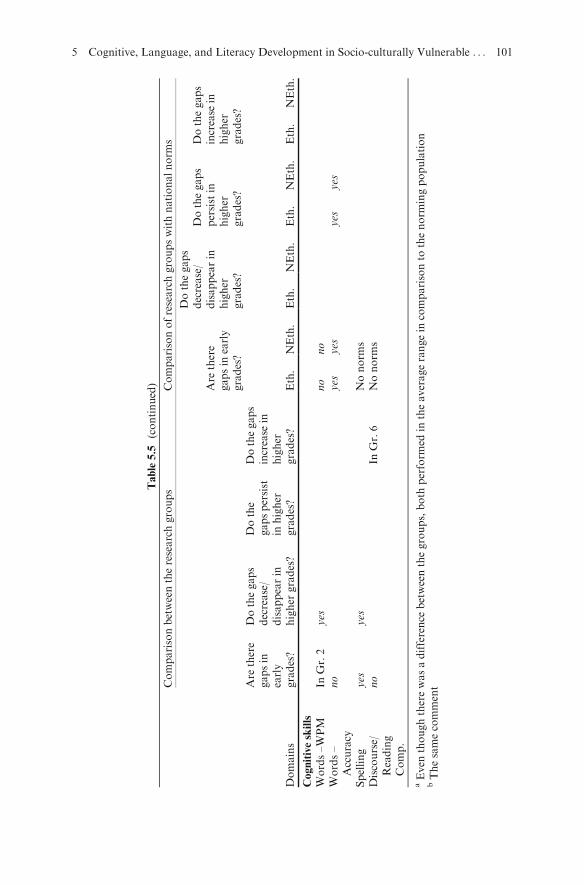
Table5.5
(continued)
Comparisonbetweentheresearchgroups
Comparisonofresearchgroupswithnationalnorm
s
Are
there
gapsin
early
grades?
Dothegaps
decrease/
disappearin
higher
grades?
Dothegaps
persistin
higher
grades?
Dothegaps
increase
inhigher
grades?
Domains
Are
there
gapsin
early
grades?
Dothegaps
decrease/
disappearin
higher
grades?
Dothe
gapspersist
inhigher
grades?
Dothegaps
increase
inhigher
grades?
Eth.
NEth.
Eth.
NEth.
Eth.
NEth.
Eth.
NEth.
Cognitiveskills
Words–WPM
InGr.2
yes
no
no
Words–
Accuracy
no
yes
yes
yes
yes
Spelling
yes
yes
Nonorm
sDiscourse/
Reading
Comp.
no
InGr.6
Nonorm
s
aEven
thoughtherewasadifference
betweenthegroups,both
perform
edin
theaveragerangein
comparisonto
thenorm
ingpopulation
bThesamecomment
5 Cognitive, Language, and Literacy Development in Socio-culturally Vulnerable . . . 101
5.5 Discussion
To date, most of the official and non-official available reports on Ethiopian
Israeli children that focused on academic achievement focused on older lear-ners. These reports consistently highlighted gaps between the performance ofthese students and other immigrant groups and the general population. The
present research examined in depth various component processes that underlieacademic achievement of Ethiopian children and compared their performanceto that of their Non-Ethiopian peers, who live in the same poor communities,
attend the same classes, and are exposed to the same national curriculum. Onegeneral observation that emerges from the current study is that the Ethiopian
children are not consistently low on all aspects of cognitive, language andliteracy skills; on some components they are not different from their counter-parts, and on some they begin with very low skills but they close the gaps over
time. Importantly, in spite of linguistic, economic, and cultural differences, oncertain components children of Ethiopian families are inherently similar to the
general population. At the same time, on certain components of language andliteracy the gaps increase over time. In what follows we discuss these varioustrends.
The two levels of comparison shown in Table 5.5 are highly informative: the
Ethiopian and non-Ethiopian groups, coming from a number of towns andschools in Israel, all lived in depressed neighborhoods, and in each case theEthiopian and non-Ethiopian students received identical instruction. The com-
parison between Ethiopian and non-Ethiopian students therefore underscoresthe cultural differences that exert their effect over and above the influence ofwhat happens, at least formally, at school. The comparison with the general
norms, on the other hand, underscores the effects of living in poor neighbor-hoods in relation to general population trends.
5.5.1 No Gaps Between the Ethiopian and Non-Ethiopian Groups
Beginning in Grade 1, the Ethiopian and Non-Ethiopian groups did not differfrom each other on phoneme discrimination and on phonemic awareness. In
addition, overall, both groups were not different from each other or from thegeneral population on these skills. In this regard, it is interesting to note that in astudy that compared Ethiopian and Non-Ethiopian children in kindergarten
(based on the same sample), Shany et al. (2010) found differences between thegroups on phoneme awareness and phoneme discrimination. In other words,
with the onset of formal education and learning to read Hebrew, the differencesbetween the Ethiopian and Non-Ethiopian children on these basic processingskills gradually disappeared. As noted in Table 5.5, even though their perfor-
mance inGrade 4 is better than inGrade 2, the rate of improvement of phonemeawareness in the Ethiopian group is not as steep as in the general population.
102 M. Shany and E. Geva
On word reading accuracy there were no differences between the groupsacross grades. However, in comparison with the norming sample, both groupsperformed consistently in the low range. This finding is in line with numerousother studies involving L2 students that have shown that with the onset offormal education, there are no differences between L1 and ESL learners onphonemic awareness and word level reading skills. At the same time, theseobservations suggest that regardless of home language, the performance ofchildren who come from low SES backgrounds may lag behind the generalpopulation (Oller & Eilers, 2002; Willms, 2003). In line with the general litera-ture concerning the development of word-level skills in ESL learners, this lagmay be attributed therefore less to home language than to insufficient exposureto extended reading and rich language and literacy contexts, as reflected in thelow familiarity of children in both groups with popular children’s books (Facesand Places).
On another basic underlying cognitive measure, working memory, whilethere was a difference between the two groups, in fact, both performed withinthe average range in relation to the norming population. It appears that on basicunderlying cognitive measures that are less susceptible to cultural, linguistic, oreducational influences, the Ethiopian group was not inherently different fromthe general population (nor was the comparison group of Non-Ethiopianchildren).
5.5.2 Closing Gaps Between the Ethiopian and Non-EthiopianGroups
On certain measures gaps existed between the Ethiopian and Non-Ethiopianstudents in the early school years (Grades 1 and 2), but disappeared byGrade 4.This trend was noted with regard to alphanumeric naming speed (letter anddigits), word reading rate, and spelling. Moreover, when the gaps close betweenthe Ethiopian and Non-Ethiopian groups on these basic processing compo-nents, both groups become similar to the norming population.
The reduction over time of gaps between language minority children andtheir L1 counterparts on tests of speed of lexical retrieval of basic units such asdigits and letters is well documented in the literature (Gholamain &Geva, 1999;Lesaux & Siegel, 2003; Geva & Yaghoub-Zadeh, 2006). The interesting ques-tion we need to explain is why in this study the gap in object naming persists,even though it disappears on the alphanumeric naming tasks. A possibleexplanation comes from the developmental literature on naming tasks. Forexample, cognitive researchers have shown that object naming is slower thanletter and digit naming, and have explained that object naming is semanticallymore complex, and involves higher level retrieval processes than letter or digitnaming, probably because it involves an open and less rehearsed class (Wolf &Goodglass, 1986; Southwood & Chatterjee, 1999, 2000). In this respect it isuseful to consider the results in the Ehtiopian and Non-Ethiopian groups in
5 Cognitive, Language, and Literacy Development in Socio-culturally Vulnerable . . . 103
comparison to the norming data. Up to Grade 4, both the Ehtiopian and Non-Ethiopian groups are slower in alphanumeric naming tasks than the normingpopulation, and one would argue that this might be a consequence of their lowSES (Lucchese & Tamis-LeMonda, 2007). However, on object naming, up toGrade 4 only the Ethiopian children are slower in comparison to the norms. It ispossible that this pattern reflects generally less developed semantic networks.According to the literature (Hedden, Lautenschlager, & Park, 2005; Salthouse,1993), the object naming speed task is related to language proficiency, specifi-cally, to vocabulary size, an-area on which Ethiopian children are lower incomparison to Non-Ethiopians. Even though in Grade 6 Ethiopian childrenperformed on the object naming task within the average range, a significant gapin comparison to the Non-Ethiopian group was still apparent. In other words,as in the general literature, it is possible that the pattern noted on rapid objectnaming is related more generally to language development. However, as theymove to higher grades, the Ethiopian Israeli children are not slower, relativeto their counterparts, on rapid naming of simple alphanumeric items suchas letters and digits that have been shown to be related to decoding skills(Sunseth & Bowers, 2002). These tasks are not related to vocabulary knowledgein L2 learners either (Geva, 2006). In line with this literature, the performanceof the Ethiopian group on the alphanumeric tasks is not problematic in either ofthe groups targeted in this study.
The results regarding spelling show that the Grade 1 gaps between theEthiopian and Non-Ethiopian groups disappear by Grade 2. Similarly, otherresearch has shown that the spelling gaps between monolingual and ESLlearners coming from somewhat economically less challenged neighborhoodseither close over time (Fashola, Drum, Mayer, & Kang, 1996; Wang & Geva,2003) or are non-existent (Geva & Lafrance, 2011). These results are in line withthe general argument that decoding and spelling skills are less susceptible to theinfluences of language proficiency, and that once the basic tools of spelling havebeen acquired, the L2 or minority learners do not necessarily lag in terms oftheir spelling skills (Geva & Lafrance, 2011; Wade-Woolley & Siegel, 1997).
5.5.3 Persistent Gaps Between the Ethiopian and Non-EthiopianGroups
Gaps persisted between the groups across grades on non-verbal ability, culturalknowledge, and grammatical skills. Even though the Ethiopian and Non-Ethiopian groups alike can be considered as low SES, the gap between themon non-verbal ability persists. Moreover, the gap between both groups and thenational norms also increases systematically across grades. Even though theRaven’s test used in this study to evaluate non-verbal ability is considered to bea relatively culture-free task, we concur with Kozulin (1999) and Tzuriel andKaufman (1994) who maintain that poor performance on such a task doesreflect cultural differences, lack of exposure, and lack of opportunities to
104 M. Shany and E. Geva
develop the underlying problem solving skills needed to do well on this task.Indeed, there is scientific evidence (e.g., Kozulin, 1999; Tzuriel & Kaufman,1994) that it is possible to improve the performance of Ethiopian children on theRaven’s Matrices with intensive and targeted intervention. We would arguethat at least in regard to the Ethiopian sample, the Raven’s Matrices should beseen as reflecting to some extent cultural knowledge and experience, rather thanintellectual, problem-solving ability. King et al. (2003) report that 60% ofEthiopian homes do not have any toys or books, and in another 20–25% ofthe families, up to 5 toys and 10 books were found on average. Ethiopianchildren have very few opportunities to play with puzzles, and there is often adearth of toys in their homes. This supports the conjecture that at least to someextent their poor performance on the non-verbal task reflects lack of exposureand opportunities to develop relevant skills involving the manipulation ofvisual arrays that are not necessarily representational. In a similar vein, thegap between the Ethiopian and Non-Ethiopian groups persisted on Faces andPlaces, a task that also captures cultural knowledge and exposure.
Another area in which the differences between the groups persist involvedgrammatical skills. Our results indicated that the relative position in relation tothe population norms is constant in the Ethiopian group (25th percentile), andthat it decreases in the Non-Ethiopian group (from the 35th to the 25thpercentile). The low performance of both groups on this aspect of oral languageproficiency is again likely related to their low socio-economic status (SES), andmore specifically to insufficient exposure to rich language in oral and writtencontexts. Ample studies have shown that low SES is associated with fewerlanguage-promoting experiences during the preschool years, and the latter,in turn, are related to lower receptive language abilities (Arriaga, Fenson,Cronan, & Pethick, 1998; Hart & Risley, 1995; Walker, Greenwood, Hart, &Carta, 1994). From a deficit perspective, some might attribute this persistentgap between the Ethiopian children and the Non-Ethiopians to low parentalcommand of Hebrew. However, research on bilingual children has shown thatchildren exposed simultaneously to two languages may, in fact, have cognitiveadvantages thanks to the fact that they are exposed to two linguistic systems(Bialystok, 2001). Children can actually develop high levels of competencewhen they are exposed to the L1 and L2 in formal educational contexts(Genoz & Genessee, 1998) that consider bilingualism as additive and not assubtractive (Cummins, 1989). The key here is the extent to which the L2 and L1are valued, and fostered within rich language and literacy contexts in bothlanguages (Schwartz, Leikin, & Share, 2005). In studies conducted withinadditive contexts, Bialystok and Feng (2011) did not find evidence for bilingualdeficits on various cognitive tasks, even though consistently the bilinguals hadlower vocabulary scores than their monolingual counterparts. Clearly, earlylanguage development is rooted in the interactions children have with theirparents and other care takers, and these interactions both foster developinglanguage skills and provide a vital foundation for children’s academic perfor-mance (Lucchese & Tamis-LeMonda, 2007).What maymatter is not merely the
5 Cognitive, Language, and Literacy Development in Socio-culturally Vulnerable . . . 105
fact that the parents either do not speak Hebrew (the societal language) or donot speak it well, but that the parents have very low written language literacyskills in either language, and that the range and quality of language used athome, whether in Hebrew or Amharic, does not prepare the children for thelanguage and concepts that are needed to excel in Israeli schools. It is importantalso to acknowledge that the school curriculum does not address adequatelyand early enough these differences and needs and that it treats children’sexposure to the home language within a subtractive framework which dis-courages the development of skills in both the societal and the home language.
5.5.4 Gaps Between the Ethiopian and Non-Ethiopian GroupsThat Increase
An alarming finding is the observation that in the case of vocabulary andreading comprehension the gaps between Ethiopian and Non-Ethiopian Israelichildren increased by Grade 6.4 In addition, and as reflected in the standardscores equivalents of the vocabulary test, across grades, the vocabulary size ofboth groups is below population norms. As many researchers have noted,semantic knowledge develops through exposure to both oral and written lan-guage, and ample research indicates the serious risk that factors such as povertyand low parental education pose to children’s early language development(Hoff, 2003; Walker et al., 1994). The findings indicate however, that fromthe onset children in the Ethiopian group achieve even worse than the compar-ison group. In other words, the results suggest that while some improvementtakes place in the Non-Ethiopian group, in the Ethiopian group there may notbe much improvement.
The significant interaction between groups and grades on vocabularydeserves attention by policy makers and educators. Why does the gap betweenthe Ethiopian Israeli children and their counterparts increase significantly byGrade 6? It might be suggested that this increase is associated with restrictedand low quality of interactions in the Hebrew language which children from theEthiopian community experience with their parents, their peers, and theirteachers. Moreover, from the ‘‘cultural capital’’ perspective (Bourdieu &Passeron, 1990), it seems that disadvantages are maintained from one genera-tion to the next. In that respect, the low linguistic performance of the Ethiopianchildren on both vocabulary (and grammatical skills), might reflect the failureof schools to adapt instruction to the needs of this population (Rueda et al.,2006). Citing the National Reading Panel (2000) Biemiller (2006) wrote that‘‘Current reading instruction is apparently premised on the view that children
4 We checked to see whether the increase in the gaps in Grade 6 relates to sampling issues –however, in Grade 6 the gap between Ethiopian and Non-Ethiopian samples on the Raven’sdoes not increase, and on some indices, such as phonological discrimination, the gapdisappears.
106 M. Shany and E. Geva
can build the vocabulary they need after learning to read (decode) fluently, as
little or no vocabulary instruction occurs during the primary grades’’ (p. 44).
Indeed, according to Israel Ministry of Education supervisors (personal com-
munication, December 26, 2007), language enrichment programs are more
likely to be implemented in the early years, following immigration and less
likely to occur in higher grades.Vocabulary is a powerful predictor of reading comprehension (Biemiller,
2006), and a direct link seems to exists between an increase in the gap between
the groups on vocabulary and on reading comprehension. Chall and colleagues
(Chall, Jacobs, & Baldwin, 1990) have shown that in the lower grades the focus of
instruction is on learning to read, and that regardless of SES (monolingual)
children are less likely to be challenged by unfamiliar vocabulary and therefore
the gap in language and reading skills in the lower grades is not as striking.
However, many children coming from low SES families experience a ‘‘slump’’ in
reading comprehension in grade 4, caused by below-grade vocabulary levels, and,
while word recognition appears to be a major hurdle in the primary grades, word
meaning becomes a major hurdle in Grade 4 and above (Chall, 1987). Studies
focusing on minority students learning to read in the societal language demon-
strate likewise that the reading comprehension of minority students falls wellbelow that of their native-speaking peers (for a systematic review, see Lesaux &
Geva, 2006). L2 students who have better developed L2 oral language
comprehension skills are better able to comprehend texts (e.g., August, Carlo,
Dressler, & Snow, 2005; Royer & Carlo, 1991). Of relevance here is the study of
Proctor et al. (2005) who tested a structural equation model of second language
(English as L2) reading comprehension and found that over and above adequate
L2 decoding ability, L2 vocabulary knowledge is crucial for improved English
reading comprehension outcomes for children of Spanish-speaking immigrants.
5.5.5 Language and Literacy Skills Among Children of EthiopianImmigrants – What Develops?
Overall, the results presented in this chapter indicate that on relatively simple
language components, such as auditory discrimination and phonemic awareness,
the Ethiopian and Non-Ethiopian groups perform in a similar way. On such
simple language components, there is steady development from year to year andeven though in the early years the group means are in the low-average by
comparison to population mean, the gaps between the group means and the
populationmean appear to be closing sometime betweenGrades 4 and 6. In other
words, the basic language components of children who come from low SES
backgrounds emerge slowly, but with schooling and learning to read and write
they master these basic components, and by the time they reach middle school
these groups are not different from what one might expect in the population at
large.While in and of itself thismay be an encouraging trend, this slow emergence
5 Cognitive, Language, and Literacy Development in Socio-culturally Vulnerable . . . 107
may have negative effects on the development of more complex and more
demanding aspects of language, literacy, and academic achievement.A different picture emerges, however, with regards tomore complex aspects of
language skills, and in particular vocabulary and grammar. Three observations
are particularly noteworthy with regard to vocabulary skills. First, the gap
between the Ethiopian andNon-Ethiopian groups increases in the upper elemen-
tary years, even though the two groups are not that different from each other in
the lower grades. Second, the performance of both groups is considerably below
the national norms at each grade level, with a gap of at least 3 standard devia-
tions. Third, the vocabulary skills of the Ethiopian group slide further away in
relation to national norms. It may be argued that comparing the performance of
the Ethiopian group to the national norms is inappropriate due to their different
home language background. This may be a legitimate argument but it is less
relevant in this context, as this study shows that regardless of home language, the
vocabulary skills of school children who live in very poor neighborhoods are
extremely poor and that they do not develop at an acceptable rate. This observa-
tion has been made in other linguistic contexts (e.g., Hart & Risley, 1995). The
fact that with time the Ethiopian Israeli children fall further behind is especially
worrisome. Theoretically, without a special intervention program one would
expect a steady rate of growth over time. That is, one would expect that the
relative standing of the Ethiopian Israeli group would be maintained relative to
the population or at least in relation to the Non-Ethiopian comparison group
consisting of children who attend the same schools and live in the same poor
neighbourhoods. The fact that the Ethiopian Israeli children fall even further
behind suggests that their language skills do not develop at a steady rate. This
may not be attributed merely to their second language status, as studies of
vocabulary development in L2 learners (e.g., Farnia & Geva, 2011) have shown
that even after 6 years of instruction in the societal language, the vocabulary skills
of ESL children do not catch up with those of their first language (L1) counter-
parts, but that in the ESL group there is steeper growth in vocabulary learning in
the early school years than in the non ESL group. However, in this project,
instead of seeing an upward trajectory we see a downwards trajectory.Vocabulary knowledge is strongly related to reading comprehension in both
monolingual and L2 learners, but is not as strongly implicated in word-level
skills (Bialystok & Feng, 2011; Geva, 2006). This is also the case in this study of
Ethiopian Israeli children. Even though these children have rather limited
vocabulary knowledge, their phonological awareness, rapid naming, and
word-level skills are acceptable. That is – they have the cognitive underpinnings
needed to learn to read and achieve academically. As has been shown elsewhere
and in this study, large language and vocabulary differences and different
developmental trajectories distinguish low and middle class children even
before kindergarten (Hart & Risley, 1995, 1999, 2003). These differences are
probably compounded by current school practices that allow further widening
of vocabulary gaps during the primary years (Biemiller & Slonim, 2001).
108 M. Shany and E. Geva
In sum, the children of Ethiopian immigrants are born into a culture ofpoverty, profound cultural differences, and lack of fit between home practiceand beliefs on the one hand and the school system on the other. Our datasuggest that less complex skills develop appropriately, as perhaps these skills areless susceptible to the cumulative effects of SES, cultural and school practices..On these skills the Ethiopian Israeli children are not different from their non-Ethiopian counterparts. However, on more complex skills, these children arenot thriving because, in spite of their cognitive potential, they do not havesustained instructional and environmental exposure to cultural experiences thatare needed in order to become more attuned to what it takes to become goodreaders, good writers, and sophisticated users of the language.
5.5.6 Summary and Implications
Several trends and conclusions, relevant to the education of children of othergroups migrating from non-literate to ‘‘developed’’ societies, should be stressed:
Children who come from low SES backgrounds, from an oral tradition, andwhose parents are illiterate in their L1 have more challenges in acquiring higherlevel language and literacy skills than low SES children whose parents are havegained some literacy skills. When families and/or a community have differentcultural capital resources, they are limited in their ability to prepare and supporttheir children in academic domains. In addition, when parents are not literate intheir first language, their children cannot draw on their home language and L1literacy in order to develop language skills. This is especially the case when thecultural institutions of the country of origin are not sustained in the new country.
With development and schooling, gaps involving language and literacycomponents that are cognitively less complex and modularized (e.g., rapidretrieval of visual stimulus and phonological abilities) and word-based skillssuch as decoding, word reading efficiency, and spelling diminish or disappear.On the other hand the gaps persist or increase on more complex cognitivecomponents that become increasingly more strategic and multi-componential,including non-verbal problem solving skills, language components such asvocabulary and grammatical knowledge, familiarity with the cultural symbolsof the new country, and reading comprehension.
As to the question of when can one expect low SES groups to perform morepoorly than the population mean, four trends emerge. The first two trendscharacterize simple language and processing components: (a) when gaps do notexist between the two low SES groups beyond Grade 2, no gaps are notedbetween these groups and typical performance in the norming populationeither; (b) when gaps between the Ethiopian and Non-Ethiopian groupsdecrease, the gaps with national norms either decrease or stay stable. As formore complex aspects of language and literacy skills two trends appear: (c) whenthe gaps between the Ethiopian and Non-Ethiopian groups increase, bothgroups also decrease relative to the national norms; and d) when the gaps
5 Cognitive, Language, and Literacy Development in Socio-culturally Vulnerable . . . 109
between the Ethiopian and Non-Ethiopian groups are stable, both groups
either decrease relative to norm or they maintain their relative position.The comparison of the mean performance in the Ethiopian and Non-
Ethiopian groups with national norms underscores the joint effects of homeand community factors associated with low SES and lack of cultural fit on
various cognitive, linguistic and literacy skills.5 It is evident that low SES andcultural differences are associated with a wide array of cognitive and academicoutcomes, with long term effects. These differences emerge early and areamplified in later years (Bradley & Corwyn, 2002).
These trends underscore the need for the introduction of sustained national
policies concerning the introduction of very early prevention programs targetingchildren, families and the training of educators. Countries where immigrants dowell have well-established language support programs in early childhood educa-tion and primary school, with clearly defined goals, standards and evaluation
systems (CERI, 2006). Countries where immigrant and minority children do notdo well should develop and undertake policies such as the recent introduction ofthe ‘‘Early Years’’ policy in Ontario and translate these recommendations into
specific policy priorities, professional training, curriculum development, andfollow up research. The Ontario plan – With Our Best Future in Mind: Imple-menting Early Learning in Ontario (Ontario Government, June 2009) – is a
totally integrated pre-natal to 12 years plan that when fully implemented, willprovide a universal platform for healthy child and family development.
Acknowledgements The research reported in this paper was partially supported by a grantfrom the Ministry of Education, Chief Scientist’s Office, Israel.
References
Abu-Rabia, S., & Siegel, L. S. (2002). Reading, syntactic, orthographic, and working memoryskills of bilingual Arabic-English speaking Canadian children. Journal of PsycholinguisticResearch, 31, 661–678.
Arab-Moghaddam, N., & Senechal, M. (2001). Orthographic and phonological processingskills in reading and spelling in Persian/English bilinguals. International Journal of Beha-vioral Development, 25, 140–147.
Arriaga, R. I., Fenson, L., Cronan, T., & Pethick, S. J. (1998). Scores on the MacArthurcommunicative development inventory of children from low- and middle-income families.Applied Psycholinguistics, 19, 209–223.
August, D., Carlo, M., Dressler, C., & Snow, C. (2005). The critical role of vocabularydevelopment for English language learners. Learning Disabilities Research & Practice,20, 50–57.
August, D., & Shanahan, T. (2006). Developing literacy in second-language learners: A reportof the National Literacy Panel on language-minority children and youth. Mahwah, NJ:Erlbaum.
5 In the present research there was no control group of middle class and we used nationalnorms.
110 M. Shany and E. Geva
Bank of Israel. (2006). Annual Report (2007). Cited in the Ethiopian immigrants in the labormarket: A report of the Israeli Association of Ethiopian Jews.
Barkon, E., & Avinor, A. (1995). Academic difficulties and early literacy deprivation: Thecase of Ethiopians in Israel. Language, Culture and Curriculum, 8, 201–210.
Bar-Yosef, R. (2001). Children of two cultures: Immigrant children from Ethiopia in Israel.Journal of Comparative Family Studies, 32, 231–246.
Ben-David, I. (2005). The level of achievement among Ethiopian children from Grades 1 & 2 inAmharic and Hebrew: Oral language awareness and the contribution of this level to theacquisition of the Hebrew written language. An M.A Thesis submitted to the Faculty ofEducation, University of Haifa.
Bender, M. L. (1985). Ethiopian language policy 1974–1981. Anthropological Linguistics, 27,273–279.
Ben-Ezer, G. (1992). Like a light in the vessel: The immigration and the absorption of EthiopianJews. Jerusalem: Rueben Mass Publishers.
Berhanu, G. (2005). Normality, deviance, identity, cultural tracking and school achievement:The case of Ethiopian Jews in Israel. Scandinavian Journal of Educational Research, 49(1),51–82. Retrieved from http://www.informaworld.com/smpp/title�content=t713445993�db=all�tab=issueslist�branches49 -v49
Berry, J.W. (2003). Conceptual approaches to acculturation. InK.M.Chun, P. B.Organista,&G. Marin (Eds.), Acculturation: Advances in theory, measurement, and applied research(pp. 17–37). Washington, DC: American Psychological Association.
Bialystok, E. (2001). Bilingualism in development: Language, literacy, and cognition. NewYork: Cambridge University Press.
Bialystok, E., & Feng, X. (2011). Language proficiency and its implications for monolingualand bilingual children. In A. Durgunoglu & C. Goldenberg (Eds.), Language and literacydevelopment in bilingual settings (pp. 121–138). New York: Guilford Press.
Biemiller, A. (2006).Vocabulary: The missing link between reading and literacy. A lecture givenat the World Congress on literacy. Budapest, Hungary, August 10.
Biemiller, A., & Slonim, N. (2001). Estimating root word vocabulary growth in normative andadvantaged populations: Evidence for a common sequence of vocabulary acquisition.Journal of Educational Psychology, 93, 498–520.
Bishop, D. V. M. (1989). Receptive oral grammar test T.R.O.G. manual (2nd ed.). London:Medical Research Council.
Bodovski, D., David, J., & Eran, Y. (1994). Issues in the treatment of families from differentcultures. Jerusalem, Beithachin.
Bourdieu, P., & Passeron, J. C. (1990).Reproduction in education, society and culture (R. Nice,Trans.). London: Sage.
Bradley, R. H., & Corwyn, R. F. (2002). Socioeconomic status and child development.AnnualReview of Psychology, 53, 371–399.
Breznitz, Z. (2006). Fluency in reading: Synchronization of processes.Mahwah, NJ: LawrenceErlbaum and Associates.
Brookdale Institute. (2003). The immersion of the Ethiopian community in education andemployment: New findings. brookdale.jdc.org.il/_. . ./22es-ethiopianemployment-eng.pd
Carlisle, J. F., Beeman, M., Davis, Y. H., & Spharim, G. (1999). Relationship of metalinguis-tic capabilities and reading achievement for children who are becoming bilingual. AppliedPsycholinguistics, 20, 459–478.
Centre for Educational Research and Innovation (CERI). (2006). Where immigrant studentssucceed – A comparative review of performance and engagement in PISA – Programme forInternational Student Assessment (PISA 2003). OECD’s Media Division. Accessiblethrough the website. Release date: 15 May 2006 – ISBN 91-64-023607 (downloaded,December 23, 2007).
5 Cognitive, Language, and Literacy Development in Socio-culturally Vulnerable . . . 111
Chall, J. S. (1987). Two vocabularies for reading: Recognition and meaning. InM. G. McKeown & M. E. Curtise (Eds.), The nature of vocabulary acquisition (pp. 7–17).Hillsdale, NJ: Lawrence Erlbaum Associates.
Chall, J. S., Jacobs, V. A., & Baldwin, L. C. (1990). The reading crisis: Why poor children fallbehind. Cambridge, MA: Harvard University Press.
Chiappe, P., & Siegel, L. S. (1999). Phonological awareness and reading acquisition inEnglish-and Punjabi-speaking Canadian children. Journal of Educational Psychology,91, 20–28.
Chiappe, P., Siegel, L. S., & Wade-Woolley, L. (2002). Linguistic diversity and the develop-ment of reading skills: A longitudinal study. Scientific Studies of Reading, 6, 369–400.
Comeau, L., Cormier, P., Grandmaison, E., & Lacroix, D. (1999). A longitudinal study ofphonological processing skills in children learning to read in a second language. Journal ofEducational Psychology, 91, 29–43.
Cummins, J. (1989). Empowerment of minority children. Sacramento, CA: California Associa-tion for Bilingual Education.
Cummins, J. (1991). Interdependence of first and second-language proficiency in bilingualchildren. In E. Bialystok (Ed.), Language processing in bilingual children (pp. 70–89). UK:Cambridge University Press.
Cummins, J. (in press). The intersection of cognitive and sociocultural factors in the develop-ment of reading comprehension among immigrant students. In X. Chen & E. Geva (Ed.),Reading and writing – Special issue 2: Socio-cultural factors.
Da Fontoura, H. A., & Siegel, L. S. (1995). Reading, syntactic, and working memory skills ofbilingual Portuguese-English Canadian children. Reading and Writing, 7(1), 139–153.
D’Angiulli, A., Siegel, L. S., &Maggi, S. (2004). Literacy instruction, SES, and word-readingachievement in English-language learners and children with English as a first language:A longitudinal study. Learning Disabilities Research & Practice, 19(4), 202–213.
Daneman, M., & Carpenter, P. A. (1980). Individual differences in working memory andreading. Journal of Verbal Learning and Verbal Behavior, 19, 450–466.
de Jong, P. F., & van der Leij, A. (2003). Developmental changes in the manifestation of aphonological deficit in dyslexic children learning to read a regular orthography. Journal ofEducational Psychology, 95, 22–40.
Deacon, S. H., & Kirby, J. R. (2004). Morphological awareness: Just ‘‘more phonological’’?The roles of morphological and phonological awareness in reading development. AppliedPsycholinguistics, 25, 223–238.
Dressler, C., & Kamil, M. (2006). First-and second-language literacy. In D. August &T. Shanahan (Eds.), Developing literacy in second-language learners: A report of theNational Literacy Panel on language-minority children and youth (pp. 197–238). Mahwah,NJ: Erlbaum.
Droop, M., & Verhoeven, L. (2003). Language proficiency and reading ability in first- andsecond-language learners. Reading Research Quarterly, 38, 78–103.
Dunn, L. M. (1965). Peabody picture vocabulary test. Minnesota: American Guidance.Durgunoglu, A. Y., Nagy, W. E., & Hancin-Bhatt, B. J. (1993). Cross language transfer of
phonological awareness. Journal of Educational Psychology, 85, 453–465.Farnia, F., & Geva, E. (2011). Cognitive correlates of vocabulary growth in English language
learners. Applied Psycholinguistics, 32(4), 711–738.Fashola, O. S., Drum, P. A., Mayer, R. E., & Kang, J. S. (1996). A cognitive theory of
orthographic transitioning: Predictable errors in how Spanish-speaking children spellEnglish words. American Educational Research Journal, 33, 825–843.
Fraser, M., Shimrovski, G., Wolf, N., & Hazani, A. (1994). The Kaufman assessment batteryfor children – K-ABC (Hebrew version). Jerusalem: Ministry of Education, Psychologicaland Counseling Service (SHEFI) and Henrietta Szold Institute.
112 M. Shany and E. Geva
Gaon, D., King, Y., & Volda-Tzadik, A. (2006). Populations which do not participate in thelabor market: Characteristics, and programs to enhance them. A report submitted to“TABAT” (pp. 1–100). Jerusalem: Myers-JDC-Brookdale Institute.
Genoz, J., & Genessee, F. (1998). Psycholinguistic perspectives on multilingualism and multi-lingual education. In J. Genoz & F. Genesee (Eds.), Beyond bilingualism: Multilingualismand multilingual education (pp. 16–32). Clevedon: Multilingual Matters.
Gersten, R. (1999). Lost opportunities: Challenges confronting four teachers of English-language learners. The Elementary School Journal, 100, 37–56.
Geva, E. (2006). Second-language oral proficiency and second-language literacy. InD. August &T. Shanahan (Eds.),Developing literacy in second-language learners: AReportof the National Literacy Panel on language-minority children and youth (pp. 123–139).Mahwah, NJ: Erlbaum.
Geva, E. (2007). Facets of metalinguistic awareness related to reading acquisition in Hebrew:Evidence from monolingual and bilingual children. In K. Koda & A. Zehler (Eds.),Learning to read across languages (pp. 154–187). New York: Routledge.
Geva, E., & Lafrance, L. (2011). Linguistic and cognitive processes in the development ofspelling in ELLs: L1 transfer, language proficiency, or cognitive processes? In A. Durgu-noglu & C. Goldenberg (Eds.), Language and literacy development in bilingual settings(pp. 245–279). Guilford.
Geva, E., & Siegel, L. S. (2000). Orthographic and cognitive factors in the concurrentdevelopment of basic reading skills in two languages. Reading and Writing, 12(1–2), 1–30.
Geva, E., & Wade-Woolley, L. (1998). Component processes in becoming English-Hebrewbi-literate. In A. Y. Durgunoglu & L. Verhoeven (Eds.), Literacy development in a multi-lingual context: Cross-cultural (pp. 85–110). Mahwah, NJ: Lawrence Erlbaum Associates.
Geva, E., Wade-Woolley, L., & Shany, M. (1993). The concurrent development of spellingand decoding in two different orthographies. Journal of Reading Behavior, 25(4), 383–405.
Geva, E., Wade-Woolley, L., & Shany, M. (1997). Development of reading efficiency in firstand second language. Scientific Studies of Reading, 1(2), 119–144.
Geva, E., & Yaghoub-Zadeh, Z. (2006). Reading efficiency in native English-speaking andEnglish-as-a-second-language children: The role of oral proficiency and underlyingcognitive-linguistic processes. Scientific Studies of Reading, 10(1), 31–57.
Geva, E., Yaghoub-Zadeh, Z., & Schuster, B. (2000). Part IV: Reading and foreign languagelearning: Individual differences in word recognition skills of ESL children. Annals ofDyslexia, 50, 121–154.
Gholamain, M., & Geva, E. (1999). Orthographic and cognitive factors in the concurrentdevelopmentofbasic reading skills inEnglishandPersian.LanguageLearning, 49(2), 83–217.
Goldenberg, C., Rueda, R., & August, D. (2006). Socio-cultural influences on literacyattainment of language-minority children and youth. In D. August & T. Shanahan,(Eds.), Developing literacy in second-language learners: A report of the National LiteracyPanel on language-minority children and youth (pp. 269–318). Mahway, NJ: Erlbaum.
Gould, E.D., Lavy, V., & Paserman, M. D. (2004). Immigrating to opportunity: Estimatingthe effects of school quality using a natural experiment on Ethiopians in Israel. QuarterlyJournal of Economics, 119, 489–526.
Hart, B., & Risley, T. R. (1995). Meaningful differences in the everyday experience of youngAmerican children. ERIC #:ED387210. Baltimore, MD: Brookes Publishing Company.
Hart, B., &Risley, T. (1999).The social world of children learning to talk. Baltimore,MD: PaulBrookes Publishing Co.
Hart, B., & Risley, T. R. (2003). The early catastrophe: The 30 million word gap by age 3 – all8 versions. Retrieved September 23, 2005, from http://www.aft.org/american_educator/index.html
Hedden, T., Lautenschlager, G., & Park, D. (2005). Contributions of processing ability andknowledge to verbal memory tasks across the adult life-span. The Quarterly Journal ofExperimental Psychology, 58(1), 169–190.
5 Cognitive, Language, and Literacy Development in Socio-culturally Vulnerable . . . 113
Hoff, E. (2003). The specificity of environmental influence: Socioeconomic status affects earlyvocabulary development via maternal speech. Child Development, 74(5), 1368–1378.
Hooddinoot, J., Lethbridge, L., & Phipps, S. (2002). Is history destiny? Resources, transitionsand child education attainment in Canada. Ottawa: Human Resources DevelopmentCanada, Applied Research Branch. Retrieved from www.drhc-hrdc.gc.ca/spps/arb.dgra/publicatins/research/2002.docs
Horowitz, T. R., & Mosher, N. (1997). Achievement motivation and level of aspiration:Adolescent Ethiopian immigrants in the Israeli education system.Adolescence, 32, 169–180.
Kaplan, R. (1992). The psychological benefits of nearby nature. In D. Relf (Ed.), The roleof horticulture in human well-being and social development: A national symposium(pp. 125–133). Portland, OR: Timber Press.
Katz, L., & Frost, R. (1992). The reading process is different for different orthographies: Theorthographic depth hypothesis. Advances in Psychology, 94, 67–84.
Katzir, T., Shaul, S., Breznitz, Z., & Wolf, M. (2004). The Universal and the unique indyslexia: A cross-linguistic investigation of reading and reading fluency in Hebrew-andEnglish-speaking children with reading disorders. Reading and Writing, 17, 739–768.
King, J., Effrati, R., & Netzer, N. (2003). Select findings of surveys of Ethiopian immigrants ineight urban communities in Israel. Meyers – JDC – Brookdale Institute and the AbsorptionMinistry, State of Israel. Retrieved from www.jdc.org.il/brookdale
Korten, F. F. (1972). The influence of culture and sex on the perception of persons. Interna-tional Journal of Psychology, 9, 31–44. Retrieved from http://www.informaworld.com/smpp/title�content=t713659663�db=all�tab=issueslist�branches=9 - v9
Kozulin, A. (1999). Cognitive learning in younger and older immigrant students. SchoolPsychology International, 20, 177–190.
Lachman, D., & Shalem, T. (1998). A battery for the diagnoses of reading disability. Tel-Aviv:Nitzan Organization.
Lafrance, A., & Gottardo, A. (2005). A longitudinal study of phonological processing skillsand reading in bilingual children. Applied Psycholinguistics, 26, 559–578.
Lee, J. W., & Schallert, L. S. (1997). The relative contribution of L2 language proficiency andL1 reading ability to L2 reading performance: A test of the threshold hypothesis in an EFLcontext. TESOL Quarterly, 31, 713–739.
Lesaux, N. K., & Geva, E. (2006). Synthesis: Development of literacy in language minoritylearners. In D. L. August & T. Shanahan (Eds.), Developing literacy in a second language:Report of the national literacy panel (pp. 53–74). Mahwah, NJ: Lawrence ErlbaumAssociates.
Lesaux, N. K., with Koda, K., Siegel, L. S., & Shanahan, T. (2006). Development of literacyof language minority learners. In D. L. August & T. Shanahan (Eds.), Developing literacyin a second language: Report of the national literacy panel (pp.75–122). Mahwah, NJ:Lawrence Erlbaum Associates.
Lesaux, N. K., & Siegel, L. S. (2003). The development of reading in children who speakEnglish as a second language. Developmental Psychology, 39, 1005–1019.
Leseman, P. P. M., & de Jong, P. F. (1998). Home literacy: Opportunity, instruction,cooperation and social-emotional quality predicting early reading achievement. ReadingResearch Quarterly, 33, 294–318.
Levin, T., Shohamy A., Spolsky, D., Levi-Keren, M., Inbar, I., & Shemesh, M. (2002).Educational status of immigrant students. Report to the Chief Scientist of the Ministry ofEducation. School of Education, University of Tel-Aviv.
Levin-Rozalis, M. (2000). Social representations as emerging from social structure: The caseof the Ethiopian immigrants to Israel. Papers on Social Representations, 9, 1–22.
Levin-Rozalis, M., & Shafran, N. (2003). A sense of belonging: A tracer study of ALMAYA’sparents cooperative kindergarten, Israel. Early childhood development: Practice andreflections. Bernard van Leer Foundation. Retrieved December 20, 2007, from http://www.bernardvanleer.org
114 M. Shany and E. Geva
Lindsey, K. A., Manis, F., & Bailey, C. (2003). Development of reading in grades K–2 inSpanish-speaking English-language learners. Learning Disabilities Research & Practice,19, 214–224.
Lucchese, F., & Tamis-LeMonda, C. S. (2007). Fostering language development in childrenfrom disadvantaged backgrounds. In Encyclopedia of language and literacy development(pp. 1–11). London, ON: Canadian Language and Literacy Research Network. RetrievedDecember 2007, from http://www.literacyencyclopedia.ca/pdfs/topic.php?topId¼229
Meitzav. (2006). Retrieved December 22, 2007, from http://cms.education.gov.il/EducationCMS/Units/Rama/MivchaneiHameitzavKlali/DochotMeitzav1.
Muller, K., & Brady, S. (2001). Correlates of early reading performance in a transparentorthography. Reading and Writing, 14(7–8), 757–799.
Mumtaz, S., & Humphreys, G. W. (2001). The effects of bilingualism on learning to readEnglish: Evidence from the contrast between Urdu-English bilingual and English mono-lingual children. Journal of Research in Reading, 24, 113–134.
Nakamoto, J., Lindsey, K. A., & Manis, F. R. (2008). A cross-linguistic investigation ofEnglish language learners’ reading comprehension in English and Spanish. ScientificStudies of Reading, 12, 351–371.
NationalReading Panel. (2000).Report of theNational ReadingPanel: Teaching children to read:An evidence-based assessment of the scientific research literature on reading and its implicationsfor reading instruction. Washington, DC: National Institutes of Child Health. & HumanDevelopment. Retrieved form http://www.nichd.nih.gov/publications/nrp/small book.pdf
Offer, S. (2004). The socio-economic integration of the Ethiopian community in Israel.International Migration, 42, 29–55.
Oller, D. K., & Eilers, R. E. (2002). Language and literacy in bilingual children. Clevedon, UK:Multilingual Matters.
Ontario Government. (2009). Retrieved from http://www.ontario.ca/en/initiatives/early_learning/ONT06_018865
Padron, Y. M., & Waxman, C. (1988). The effect of ESL students’ perceptions of theircognitive strategies on reading achievement. TESOL Quarterly, 22(1), 146–150.
Pressley,M. (1998).Reading instruction that works: The case for balanced teaching. NewYork:Guilford Press.
Proctor, C. P., Carlo, M., August, D., & Snow, C. (2005). Native Spanish-speaking childrenreading in English: Toward amodel of comprehension. Journal of Educational Psychology,97(2), 246–256.
Raven, J., & Court, J. (1976). Raven’s progressive matrices test. Oxford: I.C. Raven Ltd.,Oxford Psychologists Press.
Reese, L., Garnier, H., Gallimore, R., & Goldenberg, C. (2000). Longitudinal analysis of theantecedents of emergent Spanish literacy and middle-school English reading achievementof Spanish-speaking students. American Educational Research Journal, 37, 633–662.
Royer, J. M., & Carlo, M. S. (1991). Transfer of comprehension skills from native to secondlanguage. Journal of Reading, 34(6), 450–455.
Rueda, R. S., August, D., & Goldenberg, C. (2006). The social context in which childrenacquire literacy. In D. August & T. Shanahan (Eds.), Developing literacy in second-language learners: A report of the National Literacy Panel on language-minority childrenand youth (pp. 319–330). Mahwah, NJ: Erlbaum.
Salthouse, T. A. (1993). Speed mediation of adult age differences in cognition.DevelopmentalPsychology, 29(4), 722–738.
Schwartz, M., Leikin, M., & Share, D. L. (2005). Bi-literate bilingualism versus mono-literatebilingualism: A longitudinal study of reading acquisition in Hebrew (L2) among Russian-speaking (L1) children. Written Language and Literacy, 8, 179–206.
Segal, B. (2006). Literacy indices in Ethiopian families in Israel and their contribution to theliteracy development of their children. UnpublishedM.A thesis, submitted to the Faculty ofEducation, University of Haifa.
5 Cognitive, Language, and Literacy Development in Socio-culturally Vulnerable . . . 115
Seymour, P. H. K., Aro, M., & Erskine, J. M. (2003). Foundation literacy acquisition inEuropean orthographies. British Journal of Psychology, 94(2), 143–174.
Shany, M., Geva, E., &Melech, L. (2010). Emergent literacy in children of immigrants comingfrom a primarily oral literacy culture. Journal of Written Language and Literacy, 13, 24–60.
Shany, M., Lachman, D., Shalem, Z., Bahat, A., & Zeiger, T. (2006). ‘‘Aleph – Taph’’ – Anassessment system for reading and writing disabilities. Tel Aviv: Yesod Publishing.
Share, D. (2008). On the Anglocentricities of current reading research and practice: The perilsof overreliance on an ‘‘outlier’’ orthography. Psychological Bulletin, 134, 584–615.
Shatil, E. (2002). Shatil test to the assessment of at risk preschool children. Haifa: AchPublishing.
Shenkut, M. K. (1991). Mobilizing for literacy: The Ethiopian experience. L’Alphabetisationet la Formation des Adults, 5(3), 12–16.
Solberg,A., &Nevo, B. (1979). ThePeabody picture vocabulary test (PPVT). (Hebrew version).Southwood, M. H., & Chatterjee, A. (1999). Simultaneous activation of reading mechanisms:
Evidence from a case of deep dyslexia. Brain and Language, 67, 1–29.Southwood, M. H & Chatterjee, A. (2000). The interaction of multiple routes in oral reading:
Evidence from dissociations in naming and oral reading in phonological dyslexia. Brainand language, 72, 14–39.
Spolsky, B. (1996). Multilingualism in Israel. Annual Review of Applied Linguistics, 17,William Grabe (Ed.).
Stravas, A., &Olshtain, E. (2006).Literacy patterns in bilingual Ethiopian immigrant parents inIsrael: A developmental perspective. Poster presentation at the BAL conference, May 2006,Toronto.
Sunseth, K., & Bowers, P. G. (2002). Rapid naming and phonemic awareness: Contributionsto reading, spelling, and orthographic knowledge. Scientific Studies of Reading, 6,401–429.
Svirsky, S., & Svirsky, B. (2002). The Ethiopian Jews in Israel: Housing, employment andeducation. In ‘‘Meida al Shivion’’ 11, Edva Center, Israel.
The Israeli Municipalities. (2006, 2007). Physical data. Jerusalem, Israel.Tzuriel, D., & Kaufman, R. (1994). Mediated learning and cognitive modifiability: Dynamic
assessment of young Ethiopian immigrant children to Israel. Journal of Cross-CulturalPsychology, 30, 359–380.
Verhoeven, L. T. (1990). Acquisition of reading in a second language. Reading ResearchQuarterly, 25(2), 90–114.
Verhoeven, L. T. (1994). Transfer in bilingual development: The linguistic interdependencehypothesis revisited. Language Learning, 44, 381–415.
Vertsberger, R., & Noyfeld, D. (2003). The Ethiopian community in Israel. A report to theKnesset, Israel.
Wade-Woolley, L., & Geva, E. (2000). Processing novel phonemic contrasts in the acquisitionof L2 word reading. Scientific Studies of Reading, 4, 295–311.
Wade-Woolley, L., & Siegel, L. S. (1997). The spelling performance of ESL and nativespeakers of English as a function of reading skill.Reading andWriting: An InterdisciplinaryJournal, 9, 387–406.
Walker, D., Greenwood, C., Hart, B., & Carta, J. (1994). Prediction of school outcomes basedon early language production and socioeconomic factors. Child Development, 65(2),606–621.
Wang, M., & Geva, E. (2003). Spelling acquisition of novel English phonemes in Chinesechildren. Reading and Writing: An Interdisciplinary Journal, 16, 325–348.
Willms, J. D. (2003). Ten hypotheses about socioeconomic gradients and community differencesin children’s developmental outcomes. Final Report, Applied Research Branch, StrategicPolicy, Human Resources Development, Canada.
Wimmer, H. (1993). Characteristics of developmental dyslexia in a regular writing system.Applied Psycholinguistics, 14, 1–13.
116 M. Shany and E. Geva
Wolf, M., & Goodglass, H. (1986). Dyslexia, dysnomia, and lexical retrieval: A longitudinalinvestigation. Brain and language, 28, 154–168.
Yaghoub Zadeh, Z., Farnia, F., & Geva, E. (2011). Toward modeling reading development inyoung English as second language learners. Reading and Writing: An InterdisciplinaryJournal. doi:10.1007/s11145-010-9252-0.
Yediot Axronot, January 1, 2008.Ziegler, J. C., & Goswami, U. (2005). Reading acquisition, developmental Dyslexia, and
skilled reading across languages: A psycholinguistic grain size theory. PsychologicalBulletin, 131, 3–29.
5 Cognitive, Language, and Literacy Development in Socio-culturally Vulnerable . . . 117