chapter - 5 · many analgesics also have marked anti-inflammatory actions and therefore are used...
TRANSCRIPT
PHARMACOLOGICAL
EVALUATION
CHAPTER - 5
Chapter-5 Pharmacological Evaluation
~~~~~~~~~~~~~~~~~~~~~~~~~~~~~~~~~~~~~~~~~~~~
~~~~~~~~~~~~~~~~~~~~~~~~~~~~~~~~~~~~~~~~~~~~ 103
BIOLOGICAL ACTIVITY
Infectious diseases are one of the main causes of high morbidity
and mortality in human beings around the world, especially in
developing countries [1]. Infections such as food poisoning, rheumatic,
salmonellosis and diarrhea caused by multidrug-resistant gram-positive
and gram-negative pathogens such as Staphylococcus aureus,
Streptococcus pyogenes, Salmonella typhimurium and Escherichia coli.
These pathogens are responsible for significant morbidity and mortality
in both the hospital [2] and community settings [3-5]. Millions of people
in the subtropical regions of the world are infected and 20,000 deaths
occur every year due to these parasitic bacterial infections. Amoxicillin,
norfloxacin, ciprofloxacin are the principal drugs of the choice in the
treatment of bacterial infection since they are effective against intestinal
infection [6]. The leading drugs have been shown to have both mutagenic
effects in bacteria and carcinogenic effect in rodents [7]. These drugs
also show severe side effects (nausea, metallic taste, dizziness,
hypertension, etc.) as well as resistance to these drugs has been
reported [8]. The ideal treatment for these diseases does not exist and
therefore, new agents are required.
ACUTE TOXICITY STUDY
In screening drugs, determination of the LD50 (the dose which has
proved to be lethal (causing death) to 50% of the tested group of animals)
is usually an initial step in the assessment and evaluation of the toxic
characteristics of a substance. It is an initial assessment of toxic
manifestations and is one of the initial screening experiments performed
with all compounds.
Data from the acute study may: (a) Serve as the basis for
classification and labeling; (b) Provide initial information on the mode of
toxic action of a substance; (c) To help in arriving at a dose of a new
compound; (d) Help in dose determination in animal studies; (e) Help to
Chapter-5 Pharmacological Evaluation
~~~~~~~~~~~~~~~~~~~~~~~~~~~~~~~~~~~~~~~~~~~~
~~~~~~~~~~~~~~~~~~~~~~~~~~~~~~~~~~~~~~~~~~~~ 104
determine LD50 values that provide many indices of potential types of
drug activity.
ANALGESIC, ANTIPYRETIC AND ANTI-INFLAMMATORY
ACTIVITIES
The drugs are heterogeneous compounds, often chemically
distinct, but nevertheless share certain therapeutic actions and side
effects. In most of the textbook, these compounds are referred as
aspirin-like drugs [9]. More frequently they are recognized as non-
steroidal anti-inflammatory drugs (NSAIDs). All NSAIDs are antipyretic,
analgesic, and anti-inflammatory, but there might be some differences in
their individual activities.
There is no definite classification of analgesic/antipyretics drugs.
Most of the textbooks classify them depending on their efficacy. These
are divided into two groups; Non-narcotic analgesics (for the mild to
moderate pain, some of which may also have antipyretic actions) [10],
and narcotic/opioid analgesic (which are principally used in the relief of
severe pain). Many analgesics also have marked anti-inflammatory
actions and therefore are used for the treatment of arthritis and other
inflammatory conditions. Most of them exhibit their effect, at least in
part, by the inhibition of prostaglandin synthesis.
At the primary healthcare level, non-narcotic analgesics are of
major concern because of their wide use. Analgesics drugs are used to
relieve pain. Pain is one of the most common symptoms, and one of the
most frequent reasons why people seek medical care. Antipyretic activity
results in lowering the temperature (approximate near normal body
temperature), and is considered to involve the hypothalamus. Normal
body temperature varies according to the individual’s age, sex, level of
physical and emotional stress, the environmental temperature, time of
the day, and the anatomical site at which the temperature is measured.
Body temperature may be measured at rectal, axillary, oral, or tympanic
(ear canal) sites. The method used to measure the temperature should

Chapter-5 Pharmacological Evaluation
~~~~~~~~~~~~~~~~~~~~~~~~~~~~~~~~~~~~~~~~~~~~
~~~~~~~~~~~~~~~~~~~~~~~~~~~~~~~~~~~~~~~~~~~~ 105
be indicated on the reported patient’s temperature. Paracetamol, aspirin,
and ibuprofen have similar antipyretic activity. Product selection should
be based primarily on patient acceptance, the side effects of each agent,
concurrent diseases that may prohibit the use of each agent,
convenience of administration, and cost of therapy.
Anti-inflammatory agents are drugs that alleviate symptoms of
inflammation, but do not necessarily deal with the cause. NSAIDs are
one kind of therapeutics, widely used in the world because of their high
efficacy in reducing pain and inhibiting inflammation [11, 12]. NSAIDs
drugs can inhibit the enzyme cyclooxygenase (COX-1 and COX-2) [13,
14], which catalyze the biotransformation of arachidonic acid to
prostaglandins (PGs) and to Thromboxane A2 [15-19]. These are the
mediators of pain, inflammation, fever, stimulates platelet aggregation
and leading to the formation of blood clots [20-22]. NSAIDs have been
shown to be as effective as aspirin, but not superior than it.
PHARMACOKINETICS STUDY
Pharmacokinetics is the study of the movement of drugs into,
within, and out of the body. It involves the factors affecting that or, more
simply, what the body does to the drug. Knowledge of pharmacokinetics
enables drugs to be used rationally and doses tailored to the individual
object.
Principles of First – Order Kinetics
Pharmacokinetics may be defined as the quantitation of the course
of time of a drug and its metabolites in the body or body fluids, and the
development of appropriate models to describe observations and to
predict the outcomes in other situations [23]. The science of kinetics
deals with the mathematical description of rate processes or reactions.
Typical examples of naturally occurring processes of pharmaceutical
interest which confirm to first-order kinetics are radioactive decay of
materials and the absorption, distribution, metabolism, and excretion

Chapter-5 Pharmacological Evaluation
~~~~~~~~~~~~~~~~~~~~~~~~~~~~~~~~~~~~~~~~~~~~
~~~~~~~~~~~~~~~~~~~~~~~~~~~~~~~~~~~~~~~~~~~~ 106
[ADME], of drugs in the body. The Pharmacokinetic rate constants are
dependent on the concentration or amount of only one component of the
system. The kinetics follows first-order or pseudo first-order processes
due to the fact that all other components of the system or model except
the drug concentration are constant. In vivo drug processes, the [ADME]
follow pseudo first-order or first order processes [24].
Pharmacokinetics Working Equations
In mathematical terms, the rate law for a first-order process can
be expressed in terms of an infinitesimal small change in concentration
(dC) over an infinitesimal small time interval (dt) as;
Rate = dC/dt = -kC …………... [5.1]
where, k is the first - order rate constant. This is the differential rate
expression of a first – order process. Upon integration, this yields,
ln C = ln Co – kt ……………….. [5.2]
But ln X = 2.303 Log X,
Log C = Log Co – kt/2.303
Equation 5.2 is the integrated form of the first – order rate law which is
linear.
The exponential form of the rate equation for a first-order process is
expressed as;
C = Co e–kt …………..… [5.3]
Taking the natural logarithms on both sides of Equation [5.3] yields;
ln C = ln Co – kt
This is the same as Equation [5.2]. Multiplying both sides of Equation
[5.3] by V, the total volume of distribution;
VC = VCo e–kt
A = Dose e–kt ………….. [5.4]
Rearranging this equation yields;
A/Dose = e–kt
Chapter-5 Pharmacological Evaluation
~~~~~~~~~~~~~~~~~~~~~~~~~~~~~~~~~~~~~~~~~~~~
~~~~~~~~~~~~~~~~~~~~~~~~~~~~~~~~~~~~~~~~~~~~ 107
The above equation is the fraction of the dose remaining at time t.
where A, is the amount of drug in the body at time t, V is the total
volume of distribution, C is the plasma concentration at time t and Co is
the initial plasma concentration at time to.
Half-life (t1/2)
The time required for the plasma concentration (C), to fall to half
the original plasma concentration, (C/2), is called the half – life (t½). For
a first – order process, this parameter is constant. Theoretically, a first
order process never reaches completion since even the lowest
concentration would only fall to half its value in one half – life. For most
practical purposes, a first order process may be deemed “complete” if it
is 95% or more complete. It has been established that to attain this level
of completion at least five half – lives must elapse [25]. In urinary
analysis, total urine collection is effected or deemed complete after at
least five half – lives of collection period. The relationship between half –
life (t1/2) and rate constant k, is also a very useful working
pharmacokinetics equation and is expressed as;
t1/2 = 0.693/k
Volume of distribution (V)
The volume of plasma into which a drug distributes in the body at
equilibrium is called the total volume of distribution, V. However, the
apparent volume into which a drug distributes in the body at
equilibrium is referred to as the apparent volume of distribution, Vd.
Thus, the concentration (C) of drug in plasma is achieved after
distribution at equilibrium. The total distribution is a function of the
amount of drug in the body, A (or dose) and the extent of distribution of
drug into the tissues, V. Mathematically, this is expressed as;
V = A/C
Vd = Dose / Co
Chapter-5 Pharmacological Evaluation
~~~~~~~~~~~~~~~~~~~~~~~~~~~~~~~~~~~~~~~~~~~~
~~~~~~~~~~~~~~~~~~~~~~~~~~~~~~~~~~~~~~~~~~~~ 108
where, Co is the initial plasma concentration at zero time (to).
The total volume of distribution V, may also be defined as the
proportionality constant between the plasma concentration C, and the
amount of drug in the body, A.
Clearance (CL)
Clearance is the proportionality factor or conversion factor which
relates the plasma concentration, C, to the rate of drug elimination,
dA/dt.
Thus, Rate of elimination, dA /dt = CL C
Mathematically, total clearance is expressed as;
CLT = k V
Plasma CL is usually determined from the area under the Cp
versus time curve (AUC), after IV administration. The AUC is determined
by using the ‘Trapezoidal rule’.
After IV dosing CL = Dose / AUC,
After oral dosing CL/F = Dose / AUC, where, F = oral availability
Bioavailability
Bioavailability refers to the rate and extent of absorption of a drug
from its dosage form into the systemic circulation. It is usually assessed
by the maximum drug plasma concentration (Cmax), time to reach Cmax
(Tmax), and the area under the plasma concentration-time curve (AUC).
Absolute bioavailability compares the AUC of a drug following non-
intravenous administration with the AUC of the same drug following
intravenous administration. Relative bioavailability compares the AUCs
of a drug when administered via different routes or formulations or
standard and test. Absolute bioavailability is usually less than one, but
relative bioavailability can be larger than one. The calculation for
bioavailability can be corrected for dose and clearance.
Absolute bioavaibility (F) = AUCOral /AUCintravenous
Relative bioavaibility (F) = AUCTest/AUCReference
Chapter-5 Pharmacological Evaluation
~~~~~~~~~~~~~~~~~~~~~~~~~~~~~~~~~~~~~~~~~~~~
~~~~~~~~~~~~~~~~~~~~~~~~~~~~~~~~~~~~~~~~~~~~ 109
PHARMACOKINETICS MODELS
Drug processes which often occur simultaneously within the body
are in a dynamic state. In order to describe such a complex biological
system, a hypothesis or model which is based on simple assumptions is
conceived using mathematical terms. These are a concise means of
expressing the quantitative relationship concerning the movement or
concentrations of drugs in the body. Various mathematical models can
be devised to simulate the rate processes of drug absorption,
distribution, and elimination. Meanwhile, it is possible to develop
equations to describe drug concentrations in the body as a function of
time [25].
Pharmacokinetics models may be classified into two main
categories, namely, compartmental/non – compartmental on one hand
and physiologic or physiologically – based pharmacokinetic [PB-PK]
models on the other hand.
Compartmental Models
Compartmental models are based on assumptions of using linear
differential equations. A compartmental model provides a simple way of
grouping all the tissues, (that have similar blood flow and drug affinity),
into one or two compartments where drugs move to and from the central
or plasma compartment. The compartmental models are particularly
useful when there is little information about the tissues.
One – Compartment Open Model
After intravascular administration (intravenous (i.v.) bolus), a drug
may distribute into all the accessible regions instantly. Instant
distribution of drugs in the body may lead to the consideration of the
body as a homogeneous container for the drug and the disposition
kinetics may be described as a one compartment open model. The time
course of a drug which follows a one – compartment open model
depends upon the initial concentration administered into the body Co
Chapter-5 Pharmacological Evaluation
~~~~~~~~~~~~~~~~~~~~~~~~~~~~~~~~~~~~~~~~~~~~
~~~~~~~~~~~~~~~~~~~~~~~~~~~~~~~~~~~~~~~~~~~~ 110
and the elimination rate constant, Kel. It must be recalled that e–Kel. It is
the fraction of the dose remaining in the body of time t.
C = Co. e–Kel. t
Where, C is the concentration of the drug in the plasma at time t. Taking
natural log on both sides of the above expression yields [Equation 5.2].
ln C = ln Co – Kel . t
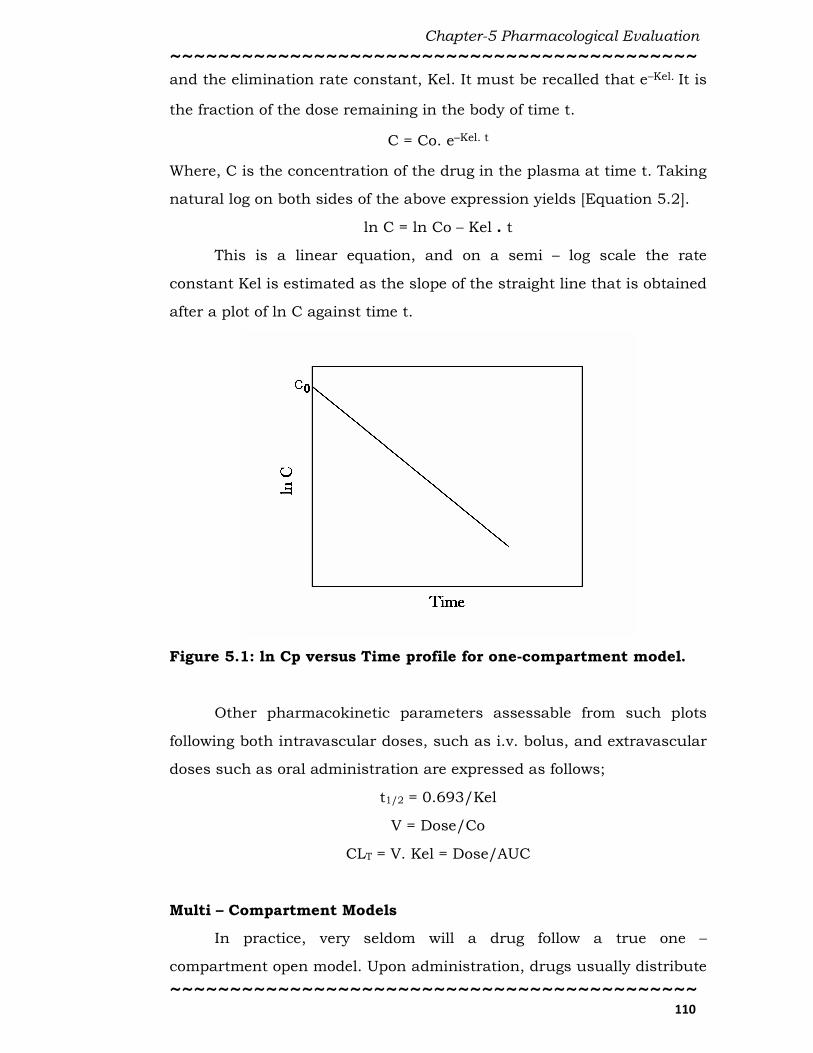
This is a linear equation, and on a semi – log scale the rate
constant Kel is estimated as the slope of the straight line that is obtained
after a plot of ln C against time t.
Figure 5.1: ln Cp versus Time profile for one-compartment model.
Other pharmacokinetic parameters assessable from such plots
following both intravascular doses, such as i.v. bolus, and extravascular
doses such as oral administration are expressed as follows;
t1/2 = 0.693/Kel
V = Dose/Co
CLT = V. Kel = Dose/AUC
Multi – Compartment Models
In practice, very seldom will a drug follow a true one –
compartment open model. Upon administration, drugs usually distribute
Chapter-5 Pharmacological Evaluation
~~~~~~~~~~~~~~~~~~~~~~~~~~~~~~~~~~~~~~~~~~~~
~~~~~~~~~~~~~~~~~~~~~~~~~~~~~~~~~~~~~~~~~~~~ 111
into the vascular space and some readily accessible peripheral spaces in
a much faster rate than into deeper tissues. In a multi – compartment
model, besides elimination, there are distribution processes that are also
involved in removing the drug out of the vascular spaces. Consequently,
-dC/dt depends upon more than one single first – order processes. On a
semi – log scale, the sum of more than one straight line will be linear
curve. The equation describing a multi – compartment open model will
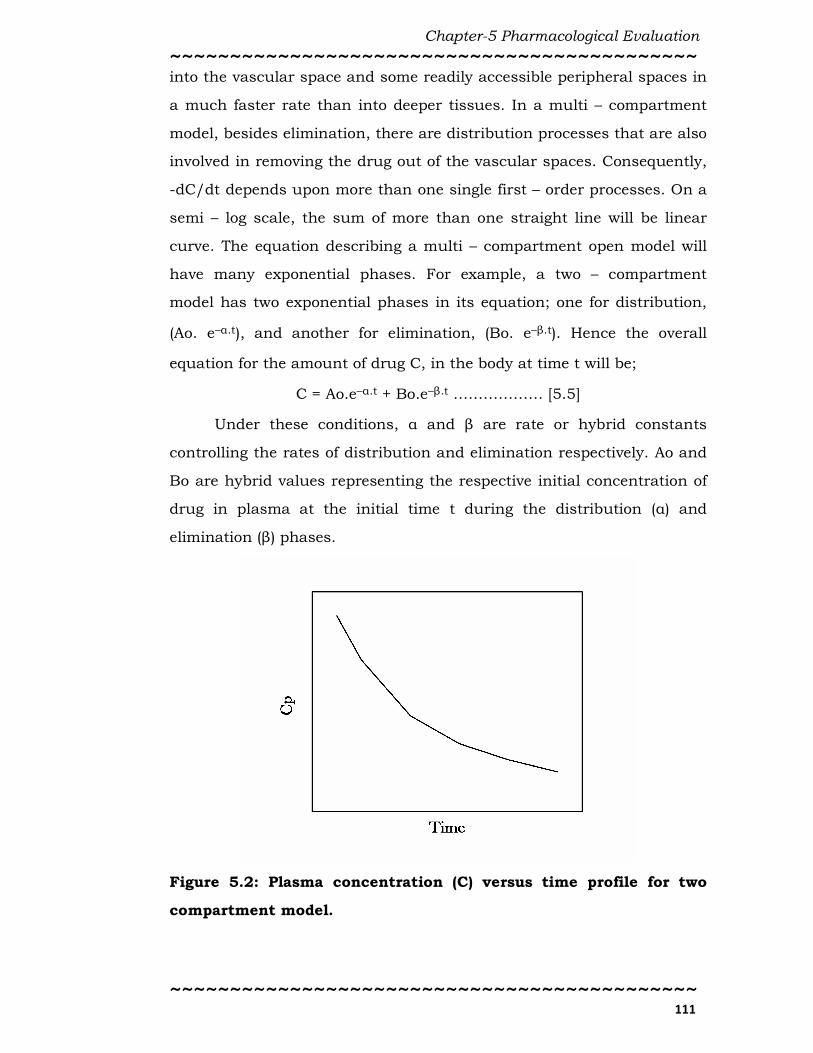
have many exponential phases. For example, a two – compartment
model has two exponential phases in its equation; one for distribution,
(Ao. e–α.t), and another for elimination, (Bo. e–β.t). Hence the overall
equation for the amount of drug C, in the body at time t will be;
C = Ao.e–α.t + Bo.e–β.t ……………… [5.5]
Under these conditions, α and β are rate or hybrid constants
controlling the rates of distribution and elimination respectively. Ao and
Bo are hybrid values representing the respective initial concentration of
drug in plasma at the initial time t during the distribution (α) and
elimination (β) phases.
Figure 5.2: Plasma concentration (C) versus time profile for two
compartment model.
Chapter-5 Pharmacological Evaluation
~~~~~~~~~~~~~~~~~~~~~~~~~~~~~~~~~~~~~~~~~~~~
~~~~~~~~~~~~~~~~~~~~~~~~~~~~~~~~~~~~~~~~~~~~ 112
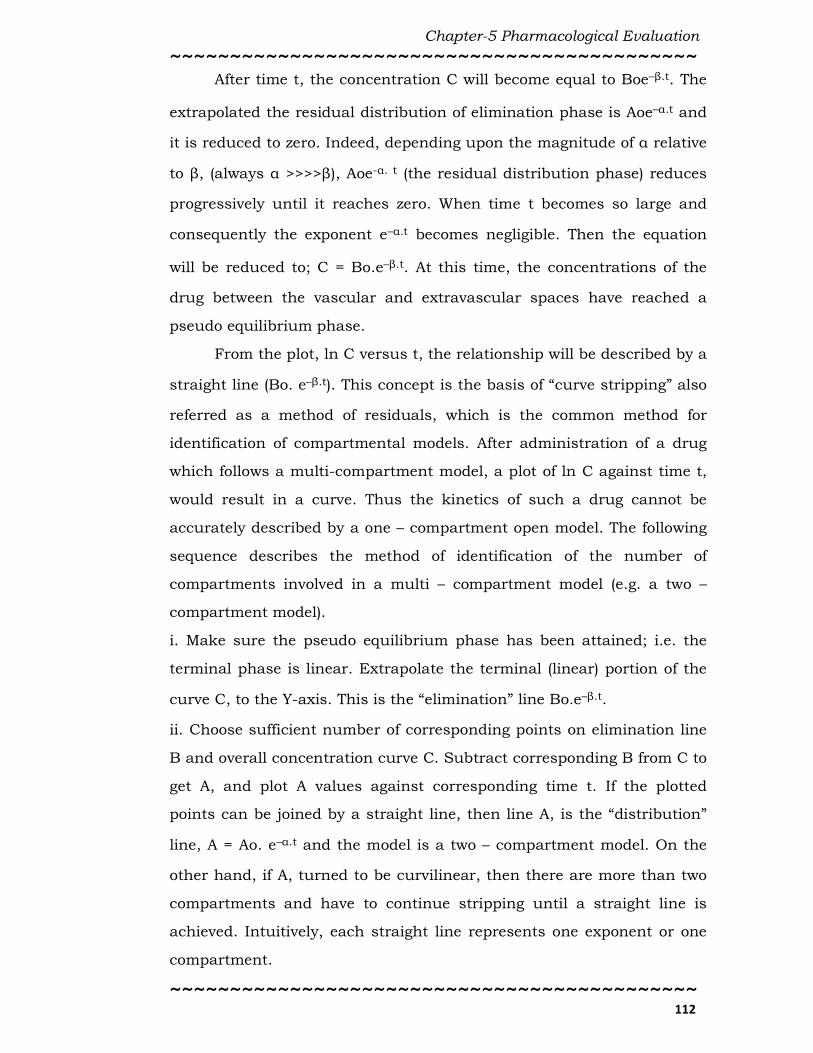
After time t, the concentration C will become equal to Boe–β.t. The
extrapolated the residual distribution of elimination phase is Aoe–α.t and
it is reduced to zero. Indeed, depending upon the magnitude of α relative
to β, (always α >>>>β), Aoe-α. t (the residual distribution phase) reduces
progressively until it reaches zero. When time t becomes so large and
consequently the exponent e–α.t becomes negligible. Then the equation
will be reduced to; C = Bo.e–β.t. At this time, the concentrations of the
drug between the vascular and extravascular spaces have reached a
pseudo equilibrium phase.
From the plot, ln C versus t, the relationship will be described by a
straight line (Bo. e–β.t). This concept is the basis of “curve stripping” also
referred as a method of residuals, which is the common method for
identification of compartmental models. After administration of a drug
which follows a multi-compartment model, a plot of ln C against time t,
would result in a curve. Thus the kinetics of such a drug cannot be
accurately described by a one – compartment open model. The following
sequence describes the method of identification of the number of
compartments involved in a multi – compartment model (e.g. a two –
compartment model).
i. Make sure the pseudo equilibrium phase has been attained; i.e. the
terminal phase is linear. Extrapolate the terminal (linear) portion of the
curve C, to the Y-axis. This is the “elimination” line Bo.e–β.t.
ii. Choose sufficient number of corresponding points on elimination line
B and overall concentration curve C. Subtract corresponding B from C to
get A, and plot A values against corresponding time t. If the plotted
points can be joined by a straight line, then line A, is the “distribution”
line, A = Ao. e–α.t and the model is a two – compartment model. On the
other hand, if A, turned to be curvilinear, then there are more than two
compartments and have to continue stripping until a straight line is
achieved. Intuitively, each straight line represents one exponent or one
compartment.

Chapter-5 Pharmacological Evaluation
~~~~~~~~~~~~~~~~~~~~~~~~~~~~~~~~~~~~~~~~~~~~
~~~~~~~~~~~~~~~~~~~~~~~~~~~~~~~~~~~~~~~~~~~~ 113
Non – Compartmental Models
Non – compartmental models offer a fast and easy way to compute
graph and analyze the most commonly used pharmacokinetics
parameters associated with blood (plasma and serum) concentration –
time data. Routes of administration may be oral, rectal, epidermal, or
intravenous. Non-compartmental models are also applicable in the
urinary data analysis.
The equations involved in these analyses are referred as non –
compartmental because they do not require curve-fitting or make any
assumptions concerning compartmental models. In non –
compartmental modeling, the calculation of pharmacokinetics
parameters are based on the analyses of two standard methods;
a. Curve – stripping, or feathering, or method of residuals, to derive the
exponential terms that describe the blood level curve, and;
b. Area under the blood level – time curve (AUC), calculations; [the linear
and trapezoidal methods] [26].
Physiologic /Physiologically – based Pharmacokinetics (PB-PK) Models
These are models which are based on known anatomic and
physiological data. The drug concentrations in tissue and drug binding
in tissue are known in physiological pharmacokinetics models. These
models are based on actual tissues and blood flow, describe the data
more realistically.
Physiologically based - pharmacokinetics (PB – PK) models are
frequently used in describing drug distribution in animals, because
tissue samples are readily and easily available for assay.
In physiological models, the size or mass of each tissue
compartment is determined physiologically rather than by mathematical
estimation. The concentration of drug in the tissue is determined by the
ability of the tissue to accumulate drug as well as by the rate of blood
perfusion to the tissue [25].
Chapter-5 Pharmacological Evaluation
~~~~~~~~~~~~~~~~~~~~~~~~~~~~~~~~~~~~~~~~~~~~
~~~~~~~~~~~~~~~~~~~~~~~~~~~~~~~~~~~~~~~~~~~~ 114
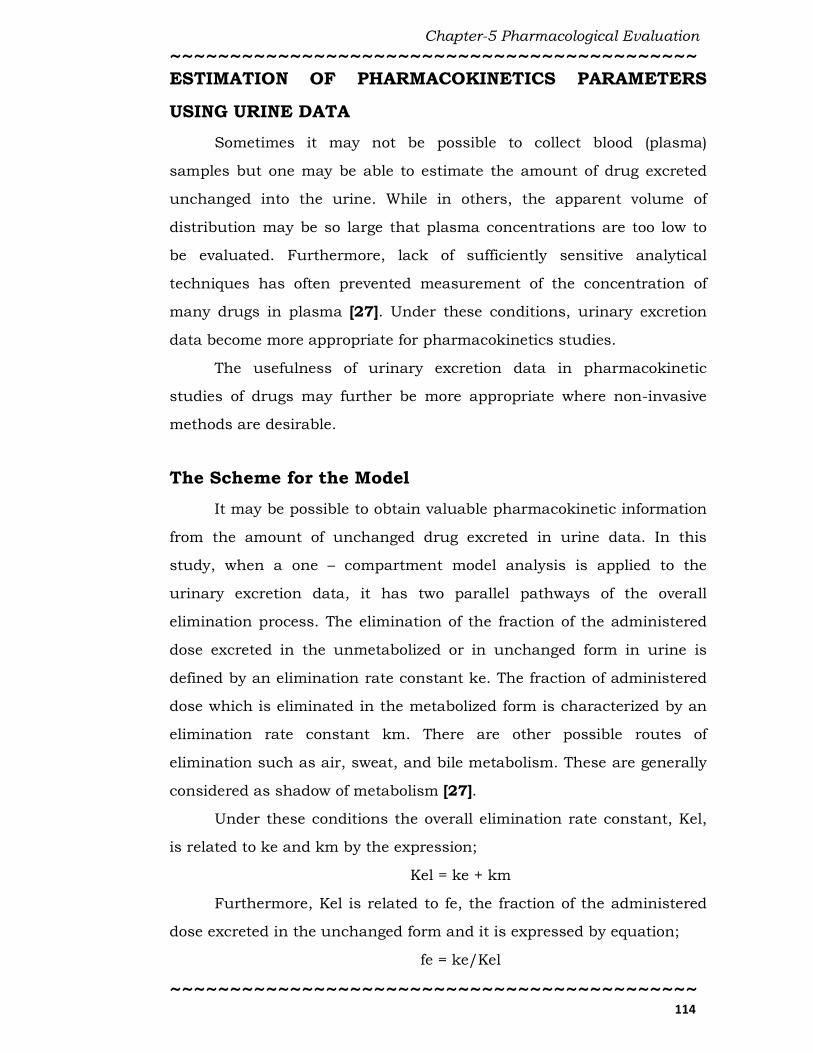
ESTIMATION OF PHARMACOKINETICS PARAMETERS
USING URINE DATA
Sometimes it may not be possible to collect blood (plasma)
samples but one may be able to estimate the amount of drug excreted
unchanged into the urine. While in others, the apparent volume of
distribution may be so large that plasma concentrations are too low to
be evaluated. Furthermore, lack of sufficiently sensitive analytical
techniques has often prevented measurement of the concentration of
many drugs in plasma [27]. Under these conditions, urinary excretion
data become more appropriate for pharmacokinetics studies.
The usefulness of urinary excretion data in pharmacokinetic
studies of drugs may further be more appropriate where non-invasive
methods are desirable.
The Scheme for the Model
It may be possible to obtain valuable pharmacokinetic information
from the amount of unchanged drug excreted in urine data. In this
study, when a one – compartment model analysis is applied to the
urinary excretion data, it has two parallel pathways of the overall
elimination process. The elimination of the fraction of the administered
dose excreted in the unmetabolized or in unchanged form in urine is
defined by an elimination rate constant ke. The fraction of administered
dose which is eliminated in the metabolized form is characterized by an
elimination rate constant km. There are other possible routes of
elimination such as air, sweat, and bile metabolism. These are generally
considered as shadow of metabolism [27].
Under these conditions the overall elimination rate constant, Kel,
is related to ke and km by the expression;
Kel = ke + km
Furthermore, Kel is related to fe, the fraction of the administered
dose excreted in the unchanged form and it is expressed by equation;
fe = ke/Kel

Chapter-5 Pharmacological Evaluation
~~~~~~~~~~~~~~~~~~~~~~~~~~~~~~~~~~~~~~~~~~~~
~~~~~~~~~~~~~~~~~~~~~~~~~~~~~~~~~~~~~~~~~~~~ 115
The Rate of Excretion of Unchanged Drug Eliminated in
Urine (du/dt)
The cumulative amount of unmetabolized drug excreted into urine
is U. The rate of excretion of an infinitesimal amount of unchanged drug
is du, over an infinitesimal time dt, (du/dt) may be expressed in terms of
ke or CLR, as;
du/dt = ke.V.Cp
From the equation CLR = ke.V
du/dt = CLR.Cp
Where, ke is the excretion rate constant for the fraction of
administered dose that is eliminated in unmetabolized/unchanged form
in urine. Substituting for Cp = Cpo .e–Kel.t in the above equation;
du/dt = ke.V.Cpo.e–Kel.t
From the equation, V = Dose/ Cp0
du/dt = ke.Dose.e–Kel.t …………… [5.6]
Taking natural logs on both sides of this equation yields;
ln (du/dt) = ln ke.Dose – Kel .t …………… [5.7]
This is the rate of excretion equation of unchanged drug eliminated in
urine.
Cumulative Amount Excreted as Unchanged Drug (U)
The rate of excretion equation-5.6 is expressed as;
du/dt = ke.Dose. e–Kel.t
du= ke.Dose.e–Kel.t dt
Integrating this equation between the time limits zero and t;
U = ke/Kel.Dose . [e–Kel.t]0 – ke/Kel.Dose . [e–Kel.t]t
U = ke/Kel.Dose . [1 – e–Kel.t]
But ke/Kel = fe; hence substituting yields;
U = fe.Dose [1 – e-Kel.t] …………………. [5.8]
This is the cumulative excretion equation in the urinary data analysis.
Chapter-5 Pharmacological Evaluation
~~~~~~~~~~~~~~~~~~~~~~~~~~~~~~~~~~~~~~~~~~~~
~~~~~~~~~~~~~~~~~~~~~~~~~~~~~~~~~~~~~~~~~~~~ 116
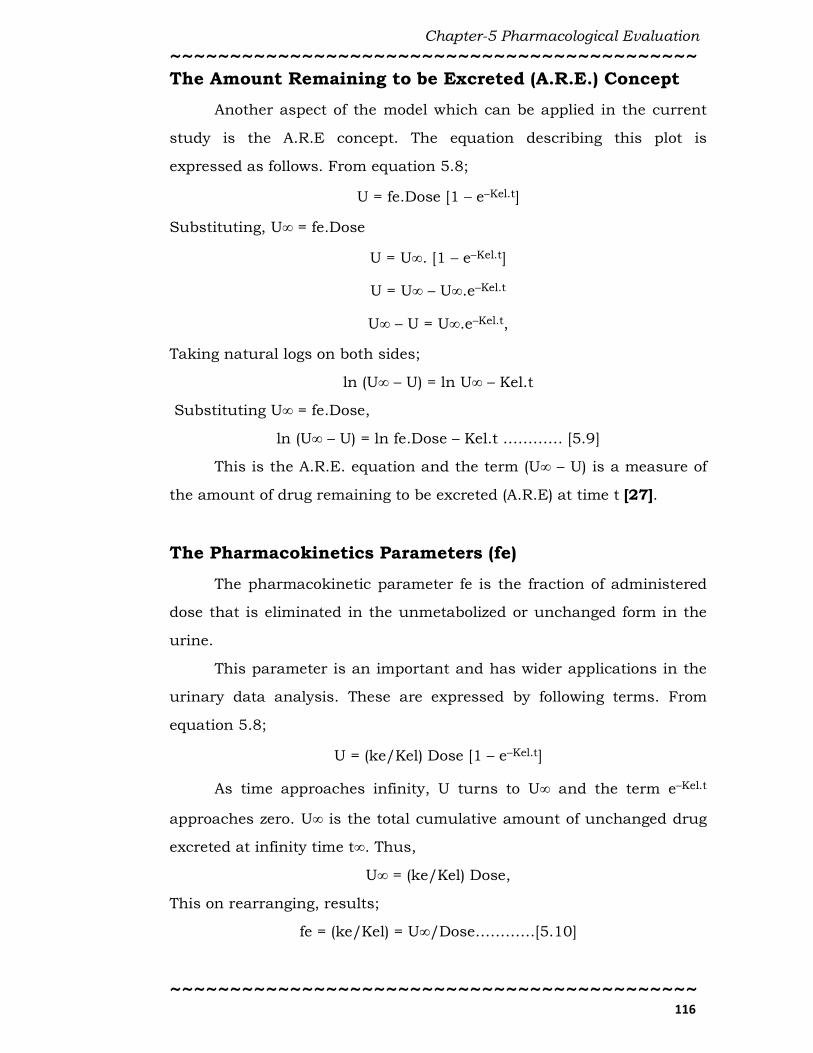
The Amount Remaining to be Excreted (A.R.E.) Concept
Another aspect of the model which can be applied in the current
study is the A.R.E concept. The equation describing this plot is
expressed as follows. From equation 5.8;
U = fe.Dose [1 – e–Kel.t]
Substituting, U∞ = fe.Dose
U = U∞. [1 – e–Kel.t]
U = U∞ – U∞.e–Kel.t
U∞ – U = U∞.e–Kel.t,
Taking natural logs on both sides;
ln (U∞ – U) = ln U∞ – Kel.t
Substituting U∞ = fe.Dose,
ln (U∞ – U) = ln fe.Dose – Kel.t ………… [5.9]
This is the A.R.E. equation and the term (U∞ – U) is a measure of
the amount of drug remaining to be excreted (A.R.E) at time t [27].
The Pharmacokinetics Parameters (fe)
The pharmacokinetic parameter fe is the fraction of administered
dose that is eliminated in the unmetabolized or unchanged form in the
urine.
This parameter is an important and has wider applications in the
urinary data analysis. These are expressed by following terms. From
equation 5.8;
U = (ke/Kel) Dose [1 – e–Kel.t]
As time approaches infinity, U turns to U∞ and the term e–Kel.t
approaches zero. U∞ is the total cumulative amount of unchanged drug
excreted at infinity time t∞. Thus,
U∞ = (ke/Kel) Dose,
This on rearranging, results;
fe = (ke/Kel) = U∞/Dose…………[5.10]

Chapter-5 Pharmacological Evaluation
~~~~~~~~~~~~~~~~~~~~~~~~~~~~~~~~~~~~~~~~~~~~
~~~~~~~~~~~~~~~~~~~~~~~~~~~~~~~~~~~~~~~~~~~~ 117
Thus, the parameter fe, can be readily estimated from the urinary
excretion data.
Urinary Excretion - Time Plots
Following a fit and subsequent analysis of a one – compartment
model to the urinary excretion data, three main analytical plots can be
obtained. The plots are the cumulative excretion, the rate of excretion,
and the amount remaining to be excreted, (A.R.E.) [27]. After
administration of the drug, urine is collected over finite time intervals
and assayed for drug content. Data collected include the volume of urine
voided, a time interval of collection and the amount of unchanged drug
excreted. The data are treated to calculate the following variables; the
cumulative amount excreted U, the amount remaining to be excreted
(A.R.E), and the rate of excretion du/dt. Variables so obtained are used
to complete the urinary data table which is subjected to further analyses
to derive useful pharmacokinetic information.
The Cumulative Excretion Plot (U versus T Plot)
One convenient way of representing the urine data is by a plot of U
versus time t. It is called the cumulative excretion plot. The equation for
this plot, [equation-5.8] is expressed as;
U = Dose . fe [1 – e–Kel.t]
The cumulative excretion-time plot is a mirror image of the
amount of the drug lost from the body. As the drug gets eliminated from
the body, it will appear in the urine. U versus t plot is fairly qualitative
and often difficult to get quantitative results directly.
As the cumulative excretion time approaches infinity t∞, the
cumulative amount excreted value levels off to U∞, which is equal to the
product of the dose and fe; (fe . Dose). Generally, the plot shows U
rapidly increasing at initially and then approaches a plateau which is
U∞. It must be ensured that total urine is collected. Urine collection
must be made for a sufficient period of time to gain an accurate or good
Chapter-5 Pharmacological Evaluation
~~~~~~~~~~~~~~~~~~~~~~~~~~~~~~~~~~~~~~~~~~~~
~~~~~~~~~~~~~~~~~~~~~~~~~~~~~~~~~~~~~~~~~~~~ 118
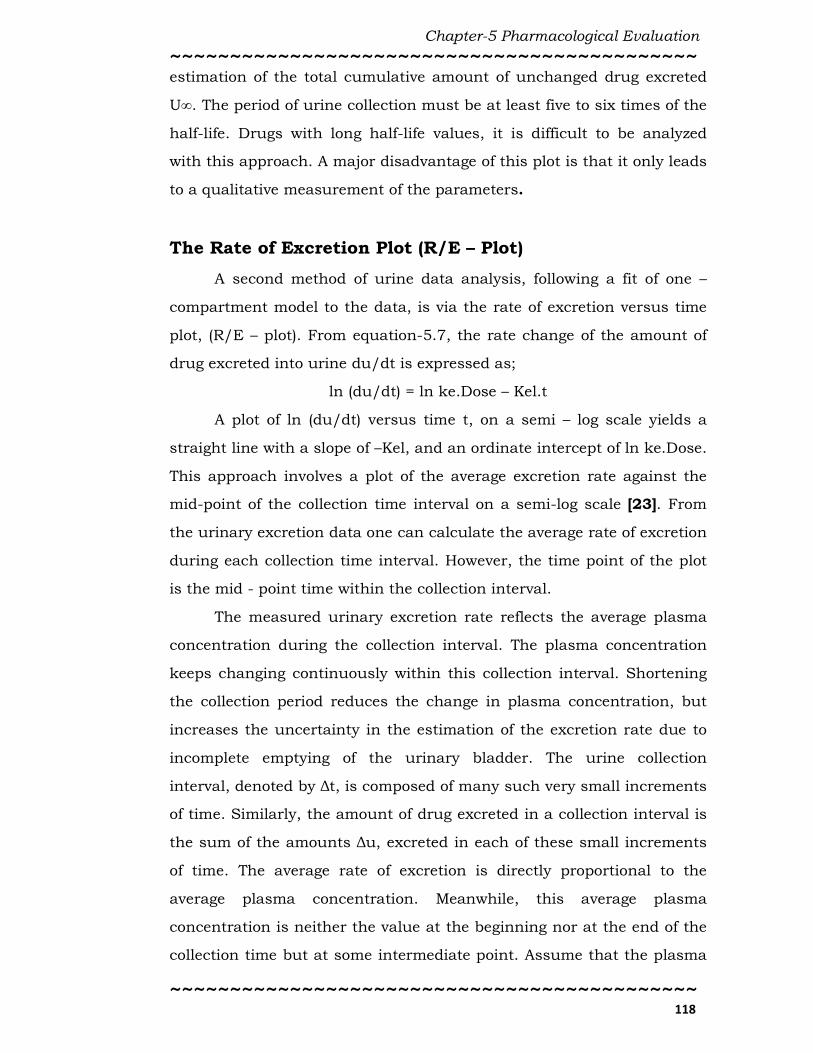
estimation of the total cumulative amount of unchanged drug excreted
U∞. The period of urine collection must be at least five to six times of the
half-life. Drugs with long half-life values, it is difficult to be analyzed
with this approach. A major disadvantage of this plot is that it only leads
to a qualitative measurement of the parameters.
The Rate of Excretion Plot (R/E – Plot)
A second method of urine data analysis, following a fit of one –
compartment model to the data, is via the rate of excretion versus time
plot, (R/E – plot). From equation-5.7, the rate change of the amount of
drug excreted into urine du/dt is expressed as;
ln (du/dt) = ln ke.Dose – Kel.t
A plot of ln (du/dt) versus time t, on a semi – log scale yields a
straight line with a slope of –Kel, and an ordinate intercept of ln ke.Dose.
This approach involves a plot of the average excretion rate against the
mid-point of the collection time interval on a semi-log scale [23]. From
the urinary excretion data one can calculate the average rate of excretion
during each collection time interval. However, the time point of the plot
is the mid - point time within the collection interval.
The measured urinary excretion rate reflects the average plasma
concentration during the collection interval. The plasma concentration
keeps changing continuously within this collection interval. Shortening
the collection period reduces the change in plasma concentration, but
increases the uncertainty in the estimation of the excretion rate due to
incomplete emptying of the urinary bladder. The urine collection
interval, denoted by ∆t, is composed of many such very small increments
of time. Similarly, the amount of drug excreted in a collection interval is
the sum of the amounts ∆u, excreted in each of these small increments
of time. The average rate of excretion is directly proportional to the
average plasma concentration. Meanwhile, this average plasma
concentration is neither the value at the beginning nor at the end of the
collection time but at some intermediate point. Assume that the plasma
Chapter-5 Pharmacological Evaluation
~~~~~~~~~~~~~~~~~~~~~~~~~~~~~~~~~~~~~~~~~~~~
~~~~~~~~~~~~~~~~~~~~~~~~~~~~~~~~~~~~~~~~~~~~ 119
concentration changes linearly with time and the appropriate
concentration is obtained at the mid - point of the collection interval.
Since the plasma concentration of the drug changes exponentially with
time, this assumption of linear change is reasonable only when loss
during the interval is small. Practically, this interval should be less than
the elimination half-life of the drug [23]. A major disadvantage of the
procedure is difficult to collect urine sample at accurate time. The
difficulty in collection of urine samples is pronounced, especially when
the elimination half-life is small. Incomplete emptying of the urinary
bladder within the collection time interval is another source of limitation.
Furthermore, the error present in “real” data can obscure the straight
line and lead to results which lack precision in the rate analysis.
The Amount Remaining to be Excreted Plot (A.R.E. - Plot)
A third analysis of the urinary excretion data which involves a fit
of one – compartment model is the amount remaining to be excreted
(A.R.E.) plot. The equation, [equation-5.9] for this plot is expressed as;
ln (U∞ – U) = ln fe.Dose – Kel.t
The A.R.E. equation is linear; hence a plot of ln (U∞ – U) against
time t, on a semi log – scale results in a straight line of slope, -Kel, and
an ordinate intercept of ln fe.Dose. The term (U∞ – U) is the amount
remaining drug to be excreted at time t. If one subtracts U from U∞ at
each time point, one would be calculating A.R.E at that time.
A major disadvantage of this method of urinary excretion data
analysis is that the total urine collection is a necessity. Thereby difficulty
is encountered in analysis of drugs with long half-lives by this method.
Another disadvantage of this approach is that the errors are cumulative,
with each collection interval. Hence the total error is incorporated into
the U∞ value and therefore into each A.R.E value. Moreover, one missed
or lost sample means errors in all calculated results.
For this reason, absorption kinetics are difficult to estimate using
urine samples, especially when the absorption half - life is relatively low.

Chapter-5 Pharmacological Evaluation
~~~~~~~~~~~~~~~~~~~~~~~~~~~~~~~~~~~~~~~~~~~~
~~~~~~~~~~~~~~~~~~~~~~~~~~~~~~~~~~~~~~~~~~~~ 120
In such a case, absorption would have been completed even before the
very first urine sample is voided.
Non–Compartmental Model Analysis of Excretion Rate-
Time Data
Occasionally, it may not be possible to adequately analyze a
urinary excretion rate data with a fit of one – compartment model. Under
these circumstances a non – compartment model analysis is employed to
calculate the required parameters. According to food and drug
administration (FDA) non – compartmental analysis of urinary rate data
are Rmax, and Tmax. Rmax is the maximal rate of urinary excretion,
and Tmax is the time of maximal urinary excretion. These parameters
are readily obtainable from excretion rate plots [27].
Assuming that renal clearance is constant, and then the urinary
excretion rate is proportional to the plasma concentration. Hence a plot
of average urinary excretion rate against the mid - point time simulates a
plot of plasma concentration against time. The urinary excretion rate
reflects the average plasma concentration during the collection interval.
The excretion rate data can therefore be treated in a manner analogous
to that of plasma data and estimation of pharmacokinetic parameters
can be conveniently calculated from it [23]. If the excretion rate time
course gives some clue about the absorption rate then one can describe
the drug absorption process. If a first order input (e.g. oral) is simulated,
one can estimate the absorption rate constant ka [28]. The absorption
rate constant ka may be estimated by the method of residual approach.
The overall or terminal elimination rate constant Kel may also be
obtained by log-linear regression of the terminal phase of the curve.
Chapter-5 Pharmacological Evaluation
~~~~~~~~~~~~~~~~~~~~~~~~~~~~~~~~~~~~~~~~~~~~
~~~~~~~~~~~~~~~~~~~~~~~~~~~~~~~~~~~~~~~~~~~~ 121
RENAL ELIMINATION KINETICS (URINARY ANALYSIS)
Physiological Basis of Renal Excretion
The major organ for excretion of drugs is the kidney and the basic
or fundamental unit of the kidney is nephron. Three major eliminating
processes within the nephron are the glomerular filtration (which occurs
in the Bowman’s capsule), tubular secretion (which occurs primarily in
the proximal section), and tubular reabsorption, which occurs all along
the nephron. Active reabsorption if present usually occurs in the
proximal section while passive reabsorption is restricted to the distal
portion. The net process from the combined three eliminating processes
determines the total renal excretion of the drug by the kidney [23].
Renal Clearance (CLr)
One of the methods of quantitatively describing the renal excretion
of drugs is by means of the renal clearance value, CLR for the drug.
Renal clearance can be estimated as part of the total body clearance of a
particular drug and can also be used to investigate the mechanism of
drug excretion. If the drug is exclusively filtered, but not secreted nor re-
absorbed, then the renal clearance will be about, 120 mL min-1 in
normal subjects. This is the creatinine clearance value and indication of
the glomerular filtration rate (GFR). If the renal clearance value is less
than 120 mL min-1, then one can assume that at least two processes are
in operation; glomerular filtration and tubular reabsorption. However, if
the renal clearance is greater than 120 mL min-1, then tubular secretion
must be contributing to the overall excretion process. It is also possible
that all the three eliminating processes are occurring simultaneously
[29].
In mathematical terms,
Excretion rate = CLR . Cp
Where, Cp is the plasma concentration at time t.
This implies that, CLR = Excretion rate / Cp …………… [5.11]
Chapter-5 Pharmacological Evaluation
~~~~~~~~~~~~~~~~~~~~~~~~~~~~~~~~~~~~~~~~~~~~
~~~~~~~~~~~~~~~~~~~~~~~~~~~~~~~~~~~~~~~~~~~~ 122
Analogous to the above series of processes within the kidney
(nephron), where the net renal excretion rate is determined by the
combined three eliminating processes;
CLR = (Filtration rate + Secretion rate + Re – absorption rate) / Cp
For most of the drugs which are excreted in the unchanged /
unmetabolized form, it has been established that there is a good
correlation between creatinine clearance and the drug’s clearance or its
observed elimination rate constant, Kel [30].
Renal clearance can be estimated by various methods depending
on the available resources and conditions. Some of these methods are
briefly enumerated below.
a. Renal clearance may be calculated using the pharmacokinetics
parameters ke and V as;
CLR = ke.V …………… [5.12]
b. Renal clearance can also be calculated by measuring the total amount
of drug excreted du, over time interval dt. Dividing the excretion rate,
(du/dt), by the plasma concentration Cp, measured at the mid – point of
the time of collection interval results in CLR value (i.e. Equation 5.11).
This is particularly useful in urine sampling/data analysis. Thus,
Renal clearance = Rate of excretion (R) / Plasma concentration, Cp
CLR = (du/dt) / Cp
CLR = R/Cp
c. Renal clearance can also be estimated as the product of the extraction
ratio E and the plasma or blood flow rate Q to the eliminating organ.
CLR = E.Q……… [5.13]
d. Clearance can also be calculated as the fraction of the total dose
administered to the total AUC. This data is only for those systems, which
are non – model dependent. Thus;
CLR = Dose/AUC……….. [5.14]
Chapter-5 Pharmacological Evaluation
~~~~~~~~~~~~~~~~~~~~~~~~~~~~~~~~~~~~~~~~~~~~
~~~~~~~~~~~~~~~~~~~~~~~~~~~~~~~~~~~~~~~~~~~~ 123
EXPERIMENTAL
BIOLOGICAL ACTIVITY
Generally there are two methods of testing for MIC
(i) Broth dilution method
(ii) Agar dilution method
In the present work Minimum Inhibition Concentration (MIC) was
determined by Broth dilution method [31].
Determination of Minimum Inhibition Concentration (MIC) by Broth
Dilution Method
All synthesized compounds were evaluated for antimicrobial test
procedure. All the necessary controls like drug control, vehicle control,
agar control, organism control and known antibacterial drug control
were used. Sterile graduated pipettes of 10 mL, 5 mL, 2 mL and 1 mL,
sterile capped 7.5 × 1.3 cm tubes, small screw-capped bottles, Pasteur
pipettes, over night broth culture of test and control organisms were
used for antimicrobial study. All MTCC cultures were tested against
synthesized compounds and reference drugs. Mueller Hinton Broth was
used as nutrient medium to grow and dilute the drug suspension for the
test bacterial. Sabourand Dextrose Broth was used for fungal nutrition.
Inoculum size for test strain was adjusted to 108 CFU (Colony Forming
Unit) per milliliter by comparing the turbidity. Serial dilutions of
synthesized compounds were prepared in primary and secondary
screening.
Following common standard strains were used for screening of
antibacterial and antifungal activities. The strains were procured from
Institute of Microbial Technology, Chandigarh.
• Staphylococcus aureus MTCC 96 (Gram positive),
• Bacillus subtilis MTCC 441 (Gram positive),
• Escherichia coli MTCC 443 (Gram negative)
• Enterobacter aerogenes MTCC 111 (Gram negative)
• Penicillium chrysogenum MTCC 5108 (Fungus),

Chapter-5 Pharmacological Evaluation
~~~~~~~~~~~~~~~~~~~~~~~~~~~~~~~~~~~~~~~~~~~~
~~~~~~~~~~~~~~~~~~~~~~~~~~~~~~~~~~~~~~~~~~~~ 124
• Aspergillus niger MTCC 282 (Fungus)
• Candida albicans MTCC 227 (Fungus).
DMSO was used as diluents / vehicle to get desired concentration
of synthesized compounds and reference drugs to test against standard
microbial strains.
Minimum Inhibitory Concentration (MIC)
1. Serial dilutions were prepared in primary and secondary screening.
Each synthesized compounds was diluted to obtain 2000 µg mL-1
concentration, as a stock solution.
Primary screen: In primary screening, 500 µg mL-1, 250 µg mL-1 and
150 µg mL-1 concentrations of the synthesized compounds were taken.
The active synthesized compounds founds in this primary screening
were further tested in a second set of dilution against all
microorganisms.
Secondary screen: The synthesized compounds found active in primary
screening were similarly, diluted to obtain 100 µg mL-1, 50 µg mL-1, 40
µg mL-1, 30 µg mL-1, 10 µg mL-1, 5 µg mL-1 and 1 µg mL-1 concentrations.
2. Mueller Hinton Broth was used as nutrient medium for bacteria and
Sabourand Dextrose Broth for fungal to grow. Inoculums size for test
strains was adjusted to 108 CFU per mL by comparing the turbidity
with McFarland standards.
3. Prepared stock solution of antibiotics of concentrations 2000 mg L-1,
as required. Arrange micro well plate 8 × 12 well of sterile well in the
rack.
4. In a sterile 30 mL universal screw capped bottle, prepared 8.0 mL of
broth containing the concentration of antibiotic required for the first
tube in each raw from the appropriate stock solution already made.
Mix the contents of the universal bottle using a micropipette and
transfer 80 µL to the first well in each row. Using a fresh
Micropipette, add 20 µL of broth to the remaining 20 µL to the second
well in each row. Continue preparing dilutions in this way.
Chapter-5 Pharmacological Evaluation
~~~~~~~~~~~~~~~~~~~~~~~~~~~~~~~~~~~~~~~~~~~~
~~~~~~~~~~~~~~~~~~~~~~~~~~~~~~~~~~~~~~~~~~~~ 125
5. Incubate at 37 ˚C for 24 hrs for bacteria and 22 ˚C for 74 hrs for
fungal.
6. MIC is expressed as the lowest dilution, which inhibited growth
judged by lack of turbidity in the tube. Thus, the lowest
concentration inhibiting growth of the organism is recorded as the
MIC.
7. The amount of growth from the control tube before incubation which
represents the original inoculum is compared.
Determination of zone of inhibition:
Agar Cup method (Kirby-Bauer Technique) to determine zone of
inhibition
The antibacterial and antifungal activities of synthesized
compounds (DPMK, APSA, DPAAPA, PPQC) were determined by Agar
Cup method [32]. The synthesized compounds DPMK, APSA, DPAAPA
and PPQC were dissolved in dimethyl sulphoxide (DMSO) in the
concentration of 500, 150, 30, 100 µg mL-1 respectively. DMSO is use as
control. The primary literature survey revealed that DMSO does not
inhibit the growth of bacteria [33].
Preparation of plate and microbial assay:
In vitro antibacterial activity was carried out against 24 hr old
cultures of bacterial strains. In the present work, Staphylococcus aureus
MTCC 96 (Sa), Bacillus subtilis MTCC 441 (Bs), Escherichia coli MTCC 443
(Ec) and Enterobacter aerogenes MTCC 111 (Ea) were used to investigate
the antibacterial activity. 20 mL of sterilized agar media was poured into
each pre-sterilized petri dish. Excess of suspension was decanted and
plates were dried in an incubator at 37 °C for an hour. About 60 µL of 24
hr old culture suspension was poured and neatly swabbed with the pre-
sterilized cotton swabs. 6 mm diameter sterile cork borer was used to
punch carefully in well and 30 µL of test solutions of each compound
(DPMK, APSA, DPAAPA, PPQC) was added into each labeled well. The
plates were incubated for 24 hr at 37 °C. Each inhibition zone that

Chapter-5 Pharmacological Evaluation
~~~~~~~~~~~~~~~~~~~~~~~~~~~~~~~~~~~~~~~~~~~~
~~~~~~~~~~~~~~~~~~~~~~~~~~~~~~~~~~~~~~~~~~~~ 126
appeared after 24 hr, around the well in each plate was measured as a
zone of inhibition. An experiment was carried out in triplicate.
Antifungal activity of synthesized compounds DPMK, APSA,
DPAAPA and PPQC were carried out against Penicillium chrysogenum
MTCC 5108 (Pc), Aspergillus niger MTCC 1344 (An) and Candida albicans
MTCC 227 (Ca). Sabourands agar media were prepared by dissolving
peptone (10.0 g), D-glucose (40.0 g) and agar (20.0 g) in double distilled
water (1000 mL) and pH was adjusted to 5.7. Normal saline (0.9% w/v
NaCl) was used to make a suspension of spore of fungal strains for
lawning. A loopful of particular fungal strain was transferred to 3 mL
saline to get a suspension of corresponding species. 20 mL of agar media
was poured into each petri dish. Excess of suspension was decanted and
plates were dried by placing in an incubator at 37 °C for 1 hr. A sterile
cork borer (6 mm diameter) was used to punch carefully in well. The test
solution (30 µL) of compounds DPMK, APSA, DPAAPA and PPQC were
added in each labeled well. DMSO was used as a control. The petri
dishes were prepared in triplicate and maintained at 22 °C for 74 hr.
Antifungal activity was determined by measuring the diameter of
inhibition zone.
Antibacterial and antifungal activity of each compound was
compared with streptomycin and fluconazole as a standard drug
respectively [34]. Zones of inhibition and percentage of relative inhibition
zone diameter (% RIZD) were determined for compounds DPMK, APSA,
DPAAPA and PPQC [35]. The percentage of relative inhibition zone
diameter (% RIZD) was calculated in term of inhibition zone obtained for
control as compared to zone of inhibition obtained from the standard at
the same concentration. The antimicrobial activity was calculated by
applying the following formula,
% RIZD = ______________________________IZD sample - IZD control
IZD standard×100 %
where, RIZD is the percentage of relative inhibition zone diameter. IZD is
the inhibition zone diameter (mm).
Chapter-5 Pharmacological Evaluation
~~~~~~~~~~~~~~~~~~~~~~~~~~~~~~~~~~~~~~~~~~~~
~~~~~~~~~~~~~~~~~~~~~~~~~~~~~~~~~~~~~~~~~~~~ 127
PHARMACOLOGICAL ACTIVITY
Animals Used
Adult Wistar albino rats weighing between 150–200 g were used
for the pharmacological studies of synthesized compounds. The animals
were maintained under normal laboratory condition and kept in
standard polypropylene cages at 30 ± 2 °C temperature and 60 to 65%
relative humidity. These rats were provided standard diet and water ad
libitum. The set of rules followed for animal experiment were approved by
the Institutional Animal Ethical Committee (VBT/IAEC/10/12/40).
Acute Oral Toxicity Study
Acute oral toxicity [36] of each synthesized compound (DPMK,
APSA, DPAAPA, and PPQC) was performed by the OECD guideline 423
using Wistar albino rat animals. Different drug doses (50-6000 mg kg-1
as per body weight of the animal) were prepared in aqueous suspensions
of acacia gum and administered orally. The dose at which 50% animals
were dying, that dose was selected as the lethal dose (LD50). 1/10th part
of lethal dose (LD50) was selected as an effective dose (ED50). The
screenings of pharmacological activities of the synthesized compounds
were carried out at ED50 dose.
Analgesic Activity
Analgesic activity [37] was carried out by hot plate and tail
immersion methods. In both methods, rats were taken in six groups.
Each group consists of six rats. All the animals were fasted for 18 hrs
before the beginning of the experiment and water given ad libitum. The
animals of group I were treated with 2.0% acacia suspension prepared in
distilled water served as a control. The animals of group II were given
paracetamol (562 mg kg-1, orally) served as a reference standard [38].
The animals of group III, IV, V and VI were orally administered with the
synthesized compounds such as, DPMK (500 mg kg-1), APSA (600 mg kg-
1), DPAAPA (100 mg kg-1) and PPQC (600 mg kg-1) respectively.
Chapter-5 Pharmacological Evaluation
~~~~~~~~~~~~~~~~~~~~~~~~~~~~~~~~~~~~~~~~~~~~
~~~~~~~~~~~~~~~~~~~~~~~~~~~~~~~~~~~~~~~~~~~~ 128
Hot plate and tail immersion method
In case of hot plate method, rat was placed on the hot plate of
Analgesiometer maintained at a temperature of 55.0 ± 0.5 ºC. The
latency to flick the paw or lick or jump from the hot plate was noted as
the reaction time. The reaction time was noted in triplicate at the time
interval of 0, 15, 30, 45, 60, 90 and 120 min. The cut off time was
considered as 30 second for each measurement.
In case of tail immersion method, the distal 2-3 cm portion of rat
tail was immersed in hot water maintained at 55.0 ± 1 ºC. The time
taken by the rat to withdraw the tail from hot water bath was noted as
reaction time. This experiment was repeated three times at a time
interval of 0, 15, 30, 45, 60, 90 and 120 minute. The percent analgesic
activity (PAA) was calculated by the following formula,
Where, T1 is the reaction time (second) before treatment, T2 is the
reaction time (second) after treatment.
Antipyretic Activity
An antipyretic activity [39, 40] was screened by the Yeast induced
pyrexia method. Animals were fasted for 24 hr before inducing pyrexia.
Pyrexia was induced by administration of 15.0% w/v aqueous
suspension of Brewer’s yeast subcutaneously below the nape of the neck
at the dose of 20 mL kg-1 of body weight. Immediately after yeast
administration, food was withdrawn. The compounds DPMK, APSA,
DPAAPA, PPQC and standard drug were dissolved in aqueous
suspension of 2.0% gum acacia. After 18 hr of yeast injection, the dose
of paracetamol as a standard drug (562 mg kg-1body weight) and the
doses of synthesized compounds; DPMK (500 mg kg-1), APSA (600 mg kg-
1), DPAAPA (100 mg kg-1) and PPQC (600 mg kg-1) were given orally. The
control group received only an aqueous suspension of 2.0% gum acacia
at the dose of 100 mg kg-1 body weight. Rectal temperature was
× 100PAA =T2 - T1
T2
Chapter-5 Pharmacological Evaluation
~~~~~~~~~~~~~~~~~~~~~~~~~~~~~~~~~~~~~~~~~~~~
~~~~~~~~~~~~~~~~~~~~~~~~~~~~~~~~~~~~~~~~~~~~ 129
determined by introducing a clinical thermometer 1 inch into the rectum
of rat and keeping it inside for 1 minute before and 18 hrs after Brewer’s
yeast injection at a time interval of 30, 60, 90, 120 and 180 minutes.
Percentage reduction in rectal temperature was calculated by the
following formula,
Temp. 18 hrs after yeast - Temp. after drug at different hrs
Temp.18 hrs after yeast - normal rectal temp. prior to yeast administration% reduction =
× 100
Anti-inflammatory Activity
Anti-inflammatory activity [41] of synthesized compounds DPMK,
APSA, DPAAPA and PPQC was evaluated by carrageenan induced rat
hind paw edema method. Animals were fasted overnight with free access
to water before the experiment. In control, test and standard groups of
animals, acute inflammation were produced by sub-planter injection of
0.1 mL of freshly prepared 1.0% suspension of Carrageenan (in normal
saline) in the right hind paw of the rats. The solutions of synthesized
compounds DPMK (500 mg kg-1), APSA (600 mg kg-1), DPAAPA (100 mg
kg-1) and PPQC (600 mg kg-1) and standard drug diclofenac sodium (100
mg kg-1) were prepared in 2.0% aqueous suspension of acacia gum and
administered orally, 1 hr before carrageenan injection. The control group
received only vehicle (2 mL kg-1). Paw volume was measured
plethysmometrically between 0 to 4 hr after carrageenan injection.
Percentage inhibition of paw volume was calculated by following formula,
% inhibition of edema = [ ] 1 -Vt
Vc× 100
Where, Vt = mean paw volume of the test group, Vc = mean paw volume
of the control group.
All the data for the pharmacological activities were expressed as
Mean ± SEM (n=6). Statistical analysis was performed by using one way
(ANOVA) followed by Student’s t-test. (*) for P < 0.05, (**) for P < 0.01 and
(***) for P < 0.001 were considered as significant relative to control
values.
Chapter-5 Pharmacological Evaluation
~~~~~~~~~~~~~~~~~~~~~~~~~~~~~~~~~~~~~~~~~~~~
~~~~~~~~~~~~~~~~~~~~~~~~~~~~~~~~~~~~~~~~~~~~ 130
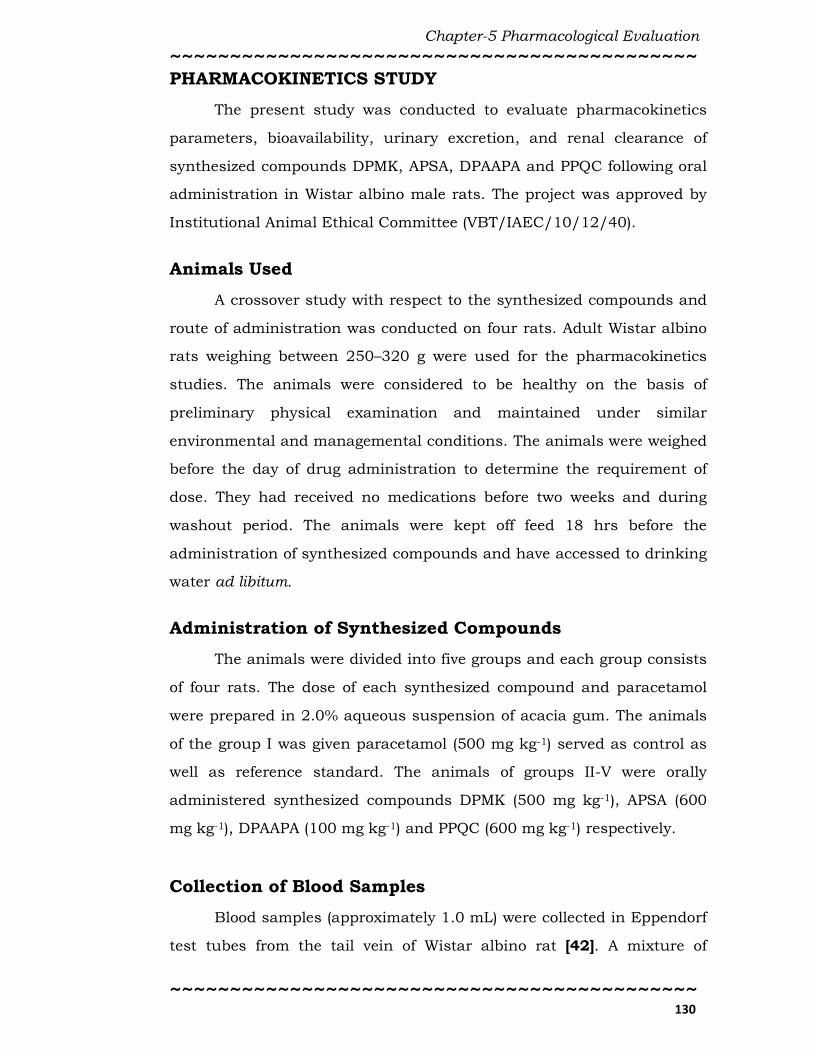
PHARMACOKINETICS STUDY
The present study was conducted to evaluate pharmacokinetics
parameters, bioavailability, urinary excretion, and renal clearance of
synthesized compounds DPMK, APSA, DPAAPA and PPQC following oral
administration in Wistar albino male rats. The project was approved by
Institutional Animal Ethical Committee (VBT/IAEC/10/12/40).
Animals Used
A crossover study with respect to the synthesized compounds and
route of administration was conducted on four rats. Adult Wistar albino
rats weighing between 250–320 g were used for the pharmacokinetics
studies. The animals were considered to be healthy on the basis of
preliminary physical examination and maintained under similar
environmental and managemental conditions. The animals were weighed
before the day of drug administration to determine the requirement of
dose. They had received no medications before two weeks and during
washout period. The animals were kept off feed 18 hrs before the
administration of synthesized compounds and have accessed to drinking
water ad libitum.
Administration of Synthesized Compounds
The animals were divided into five groups and each group consists
of four rats. The dose of each synthesized compound and paracetamol
were prepared in 2.0% aqueous suspension of acacia gum. The animals
of the group I was given paracetamol (500 mg kg-1) served as control as
well as reference standard. The animals of groups II-V were orally
administered synthesized compounds DPMK (500 mg kg-1), APSA (600
mg kg-1), DPAAPA (100 mg kg-1) and PPQC (600 mg kg-1) respectively.
Collection of Blood Samples
Blood samples (approximately 1.0 mL) were collected in Eppendorf
test tubes from the tail vein of Wistar albino rat [42]. A mixture of

Chapter-5 Pharmacological Evaluation
~~~~~~~~~~~~~~~~~~~~~~~~~~~~~~~~~~~~~~~~~~~~
~~~~~~~~~~~~~~~~~~~~~~~~~~~~~~~~~~~~~~~~~~~~ 131
methanol and ethyl acetate (1:2) was previously added in an Eppendorf
test tube. The synthesized compounds DPMK (500 mg kg-1), APSA (600
mg kg-1), DPAAPA (100 mg kg-1) and PPQC (600 mg kg-1) were
administered orally to the rat and blood samples were withdrawn at the
time intervals of 0.0, 0.5, 1, 1.5, 2, 3, 4, 5, 6, 10, 12, and 24 hr.
Immediately, a blood sample and the mixture of methanol and ethyl
acetate (1:2) was shaken for 5 minute by hand until the contents were
properly mixed. Then after, the tubes were shaken for 5 minute on a
vertex mixture and centrifuged at 2000 rpm for 5 minute at room
temperature. Blood supernatants were separated and after necessary
labeling stored at –20 °C until assayed.
Collection of Urine Samples
In all experiments, a blank urine sample was collected before
administration of the drug. In this study, urine samples (1.0 mL) were
collected at the time intervals of 0, 6, 12, 24, 36, 48, 60, 72 and 84 hrs
and the volume was measured. 1.0 mL urine was diluted up to 100 mL
with double distilled water. Diluted urine samples were stored at -20°C
until the analysis.
UV-Visible Spectrophotometric Method
Assay Method for Paracetamol
Blood supernatants and diluted urine samples of paracetamol
were measured by spectrophotometrically [43]. After treatment, 0.2 mL
of blood supernatant or 1.0 mL of diluted urine sample was mixed with
1.0 mL of 1.0 M hydrochloric acid and 2.0 mL of 1.0 mM ferric sulphate.
The resulting solution was heated at 100 ºC in water bath for 10 min.
Then after adding 2.0 mL of 1.0 mM potassium ferricyanide and was
diluted up to 10 mL with distilled water. The resulting samples were
analyzed by spectrophotometrically at λmax 700 nm, after 24 min. A
calibration curve was constructed (concentration range between 0.2-2.0
µg mL-1) by spiking drug-free rat blood and urine in duplicate with a
standard solution of paracetamol (100.0 µg mL-1).

Chapter-5 Pharmacological Evaluation
~~~~~~~~~~~~~~~~~~~~~~~~~~~~~~~~~~~~~~~~~~~~
~~~~~~~~~~~~~~~~~~~~~~~~~~~~~~~~~~~~~~~~~~~~ 132
Assay Method for the Synthesized Compounds
0.2 mL of blood supernatant and 1.0 ml of diluted urine samples
were used for the pharmacokinetic study to determine the concentration
of synthesized compounds by assay method. The assay method for
synthesized compounds DPMK, APSA, DPAAPA and PPQC are described
in chapter 6. The calibration curves of spiked synthesized compounds in
blood and urine samples were constructed and are illustrated in chapter
6. The regression equation and calibration curves are used to determine
the concentration of synthesized compounds from blood and urine
sample which were collected from the Wistar albino rats.
CALCULATIONS
Pharmacokinetics
Pharmacokinetic parameters were calculated by non-
compartmental analysis, according to the standard method with the use
of MS-Excel. Maximum drug concentration (Cmax) and corresponding
time (Tmax) were measured directly from the drug-concentration vs. time
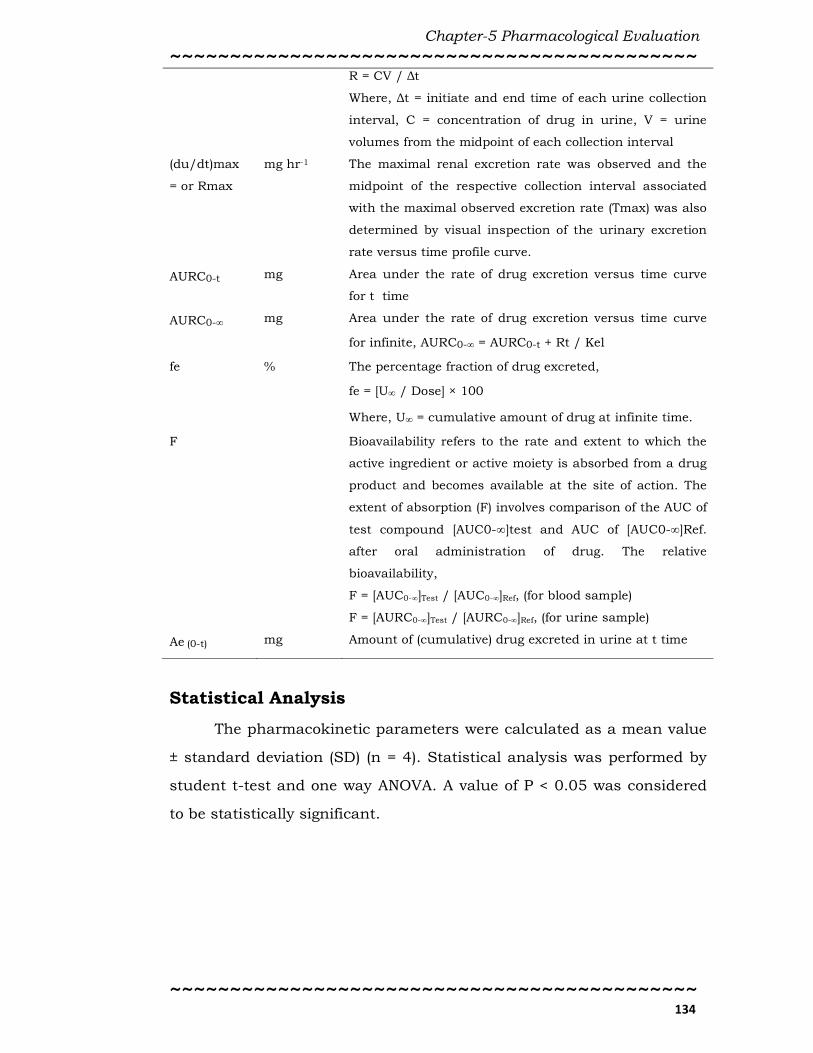
plot. The definition and formula of kinetic parameters are given in Table
5.1.
Table 5.1: Definitions and formula of kinetic parameters [44-47].
Kinetic
Parameter
Unit Formula
Cmax µg mL-1 The peak blood concentration of a drug after oral
administration.
Tmax hr Time to reach Cmax (for blood sample) or Rmax (for urine
sample)
AUC0-t µg hr mL-1 Area under curve calculate using Trapezoidal rule from 0
to the last drug concentration
AUC0-t Σ(ti+1 - ti) (Ci + Ci+1)
2=
n-1
i=0
where, n= numbers of data points
AUC0-∞ µg hr mL-1 AUC from 0 to infinity time drug concentration
AUC0 - ∞ = AUC0-t +Cp last
K'

Chapter-5 Pharmacological Evaluation
~~~~~~~~~~~~~~~~~~~~~~~~~~~~~~~~~~~~~~~~~~~~
~~~~~~~~~~~~~~~~~~~~~~~~~~~~~~~~~~~~~~~~~~~~ 133
Where, K’ is terminal slope of curve Cp vs. t
AUMC0-t
µg hr2 mL-1 Area under the first moment curve from 0 to the last drug
concentration
AUMC0 -t Σ(ti+1 - ti) (Citi + Ci+1ti+1)
2=
n-1
i=0
AUMCt-∞ µg hr2 mL-1 Area under the first moment curve from t to the infinity
time drug concentration
= +Cp last
K'2AUMCt - ∞
Cp last tlast
K'
_______
AUMC0-∞ µg hr2 mL-1 Area under the first moment curve from 0 to the infinity
time drug concentration
= AUMC0 - t +AUMC0 - ∞AUMCt - ∞
Kel hr-1 The first order elimination rate at which drugs are
removed from the body. In case of blood sample,
elimination rate constant was determined from the slope
of the elimination part of the drug-concentration time
plot.
In case of urine sample, first order elimination rate
constant was calculated from the curve of amount of drug
remaining to be excreted at a time (t) versus endpoint
time.
t1/2 hr Elimination of half life means time required for the
concentration of the drug to reach half of its original
value.
t1/2 = 0.693 / Kel
MRT hr Mean residence time is the average time a molecule stays
in the body.
MRT = AUMC0-∞ / AUC0-∞
CL/F L hr-1 kg-1 Total body clearance is the volume of blood or plasma that
is totally cleared of its content of drug per unit time and
body weight.
CL/F = Dose / AUC0-∞ , where F= Oral availability of drug
Vss/F L kg-1 The volume into which a drug appears to be distributed
with a concentration equal to that of plasma. The
apparent volume distribution at equilibrium,
Vss/F = Dose × AUC0-∞ / AUMC0-∞ , where, F= Oral
availability of drug
du/dt = R mg hr-1 The renal excretion rate for each interval
Chapter-5 Pharmacological Evaluation
~~~~~~~~~~~~~~~~~~~~~~~~~~~~~~~~~~~~~~~~~~~~
~~~~~~~~~~~~~~~~~~~~~~~~~~~~~~~~~~~~~~~~~~~~ 134
R = CV / ∆t
Where, ∆t = initiate and end time of each urine collection
interval, C = concentration of drug in urine, V = urine
volumes from the midpoint of each collection interval
(du/dt)max
= or Rmax
mg hr-1 The maximal renal excretion rate was observed and the
midpoint of the respective collection interval associated
with the maximal observed excretion rate (Tmax) was also
determined by visual inspection of the urinary excretion
rate versus time profile curve.
AURC0-t mg Area under the rate of drug excretion versus time curve
for t time
AURC0-∞ mg Area under the rate of drug excretion versus time curve
for infinite, AURC0-∞ = AURC0-t + Rt / Kel
fe % The percentage fraction of drug excreted,
fe = [U∞ / Dose] × 100
Where, U∞ = cumulative amount of drug at infinite time.
F Bioavailability refers to the rate and extent to which the
active ingredient or active moiety is absorbed from a drug
product and becomes available at the site of action. The
extent of absorption (F) involves comparison of the AUC of
test compound [AUC0-∞]test and AUC of [AUC0-∞]Ref.
after oral administration of drug. The relative
bioavailability,
F = [AUC0-∞]Test / [AUC0-∞]Ref, (for blood sample)
F = [AURC0-∞]Test / [AURC0-∞]Ref, (for urine sample)
Ae (0-t) mg Amount of (cumulative) drug excreted in urine at t time
Statistical Analysis
The pharmacokinetic parameters were calculated as a mean value
± standard deviation (SD) (n = 4). Statistical analysis was performed by
student t-test and one way ANOVA. A value of P < 0.05 was considered
to be statistically significant.

Chapter-5 Pharmacological Evaluation
~~~~~~~~~~~~~~~~~~~~~~~~~~~~~~~~~~~~~~~~~~~~
~~~~~~~~~~~~~~~~~~~~~~~~~~~~~~~~~~~~~~~~~~~~ 135
REFERENCES
1. Waldvegel FA. Infectious diseases in the 21st century: Old
challenges and new opportunities International. J. Infect. Dis.
2004, 8, 5-12.
2. Pfaller MA, Jones NR, Doern VG, Sader SH, Kugler CK, Beach LM.
Survey of blood stream infections attributable to gram-positive
cocci: frequency of occurrence and antimicrobial susceptibility of
isolates collected in 1997 in the United States, Canada, and Latin
America from the SENTRY antimicrobial surveillance program.
Diagn. Microbiol. Infect. Dis. 1999, 33, 283-297.
3. Abi-Hanna P, Frank LA, Quinn PJ, Kellkar S, Schreckenberger CP,
Hayden KM, Marcinak JF. Clonal Features of community-acquired
methicilliin-resistant Staphylococcus aureus in children. Clin.
Infect. Dis. 2000, 30, 630-1.
4. Collignon P. Increased incidence of methicillin-resistant strains of
Staphylococcus aureus in the community. J. Infect. Dis. 1999,
179, 1592.
5. Merlino J, Leroi M, Bradbury R, Veal D, Harbour C. New
chromogenic identification and detection of Staphylococcus aureus
and methicillin-resistant S. aureus. J. Clin. Microbiol. 2000, 38,
2378-80.
6. Johnson PJ. Metronidazole and drug resistance. Parasitol. Today
1993, 9, 183-186.
7. Alauddin M, Martin-Smith M. Biological activity in steroids
possessing nitrogen atoms. I. Synthetic nitrogenous steroids. J.
Pham. Phamacol. 1962, 14, 325-49.
8. Parihar JA, Ramana MWV. A new and convenient synthesis of 13,
16-diazaestrone analogs. Tetrahedron Lett. 2003, 44, 1843-1845.
9. Rainsford KD. Aspirin and the salicylates. Butterworth &
Company, London, 1984.
10. Brune K. The early history of non-opioid analgesics. Acute Pain
1997, 1, 33–40.

Chapter-5 Pharmacological Evaluation
~~~~~~~~~~~~~~~~~~~~~~~~~~~~~~~~~~~~~~~~~~~~
~~~~~~~~~~~~~~~~~~~~~~~~~~~~~~~~~~~~~~~~~~~~ 136
11. Fiorucci S, Meli R, Bucci M, Cirino G. Dual inhibitors of
cyclooxygenase and 5-lipooxygenase. A new avenue in anti-
inflammatory therapy. Biochem. Pharmacol. 2001, 62, 1433-8.
12. Paulose-Ram R, Hirsch R, Dillon C, Gu Q. Frequent monthly use
of selected non-prescription and prescription non-narcotic
analgesic among U.S. adults. Pharmacoepidemiol. Drug Saf. 2005,
14, 257-66.
13. Dannhardt G, Kiefer W, Krämer G, Maehrlein S, Nowe U, Fiebich
B. The pyrrole moiety as a template for COX-1/COX-2 inhibitors.
Eur. J. Med. Chem. 2000, 35, 499-510.
14. Dubost JJ, Soubrier M, Sauvezie B. Treatment of rheumatoid
polyarthritis: evolution of concepts and strategies. Rev. Med.
Interne 1999, 20, 171-8.
15. Vane JR. Inhibition of prostaglandin synthesis as a mechanism of
action for aspirin-like drugs. Nat. New Biol. 1971, 231, 232-5.
16. Vane JR, Botting RM. Mechanism of action of anti-inflammatory
drugs. Int. J. Tissue React. 1998, 20, 3-15.
17. FitzGerald GA, Patrono CN. The coxibs, selective inhibitors of
cyclooxygenase-2. Eng. J. Med. 2001, 345, 433-42.
18. Fries S, Grosser T, Price TS, Lawson JA, Kapoor S, DeMarco S,
Pletcher MT, Wiltshire T, FitzGerald GA. Marked interindividual
variability in the response to selective inhibitors of cyclooxygenase-
2. Gastroenterology 2006, 130, 55-64.
19. FitzGerald GA. Coxibs and cardiovascular disease. N. Engl. J. Med.
2004, 351, 1709-11.
20. Smith WL, DeWitt DL. Prostaglandin endoperoxide H synthases-1
and -2. Adv. Immunol. 1996, 62, 167-215.
21. Herschman HR. Prostaglandin sythase 2. Biochim. Biophys. Acta.
1996, 1299, 125-40.
22. Seibert K, Zhang Y, Leahy K, Hauser S, Masferrer J, Perkins W,
Lee L, Isakson P. Pharmacological and biochemical demonstration

Chapter-5 Pharmacological Evaluation
~~~~~~~~~~~~~~~~~~~~~~~~~~~~~~~~~~~~~~~~~~~~
~~~~~~~~~~~~~~~~~~~~~~~~~~~~~~~~~~~~~~~~~~~~ 137
of the role of cyclooxygenase 2 in inflammation and pain. Proc.
Natl. Acad. Sci. U.S.A. 1994, 91, 12013-7.
23. Roland M, Tozer TN. Clinical Pharmacokinetics – Concepts and
Applications. 2nd ed., Lea & Febiger, Malvern, Philadelphia, 1989.
24. Banker GS, Rhodes CT. Modern Pharmaceutics. 2nd ed., Marcel
Dekker Inc. 1990, pp 210 – 215.
25. Andrew BC, Leon S. Applied Biopharmaceutics and
Pharmacokinetics. 3rd ed., Henry Kimpton Publishers, London,
1981, pp 33 – 44.
26. www.summitPK.com/equations/equation.htm, 2006, 12-August.
27. www.fda.gov/cder/Guidance/5523fnl.pdf, 2007, 16-Septermber.
28. www.umanitoba.ca/pharmacy/outlines/2008/pharm3500, 2009 ,
10-March.
29. www.boomer.org/c/pl/ch05/ch0503,0506/html, 2007, 3-
February.
30. Winter ME. Basic Clinical Pharmacokinetics. 2nd ed., Mack
Publishing Company, Vancouver, WA, 1988, pp. 310-315.
31. Mackie, Mc Cartney. Practical Medical Microbiology, 13th ed., J. G.
Collee, J. P. Duguid, A. G. Fraser, B. P. Marmion (Eds.), 1989, pp.
600.
32. Bauer AW, Kirby WMM, Sherris JC, Turck CK. Amer. J. Clin. Path.
1966, 45, 493.
33. Olaleye MT, Rocha BT. Acetaminophen-induced liver damage in
mice: effects of some medicinal plants on the oxidative defense
system. Exp. Toxicol. Pathol. 2008, 59, 319-327.
34. Vijesh AM, Isloor AM, Telkar S, Peethambar SK, Rai S, Isloor N.
Synthesis, Characterization and antimicrobial studies of some new
pyrazolo incorporated imidazole derivatives. Eur. J. Med. Chem.
2011, 46, 3531-3536.
35. Soni LK, Narsinghani T, Sethi A. Anti-microbial Benzimidazole
derivatives: synthesis and in vitro biological evaluation. Med.
Chem. Res. 2012, 1-5.
Chapter-5 Pharmacological Evaluation
~~~~~~~~~~~~~~~~~~~~~~~~~~~~~~~~~~~~~~~~~~~~
~~~~~~~~~~~~~~~~~~~~~~~~~~~~~~~~~~~~~~~~~~~~ 138
36. OECD/OCDE, OECD guideline for testing of chemicals-423, 2001,
1-14.
37. Turner RA. Screening Methods in Pharmacology. Academic Press,
New York, 1971, 100-113.
38. Granados-soto V, Flores-murrieta FJ, Lopez-munoz FJ, Salazar
LA, Villarreal JE, Gilberto CH. Relationship between Paracetamol
Plasma Levels and its Analgesic Effect in the Rat. J. Pharm.
Pharmacol. 1992, 44, 741-744.
39. Biswal S. Prostaglandin mediated antipyretic effects of the
aqueous and alcoholic extracts of the seeds of Trigonella foenum-
graecum in albino rat. Int. J. Pharm. Res. Develop. 2011, 3, 47-50.
40. Patil VV, Bhaungale SC, Narkhede SB, Jawle NM, Patil VR.
Analgesic and antipyretic activities of Ficus Bengalensis Bark. Int.
J. Pharm. Res. 2010, 2, 16-20.
41. Jayakumar Swamy BHM, Praveen Y, Pramod N, Shivkumar B,
shivkumar H, Nagendra Rao R. Synthesis, characterization and
anti-inflammatory activity of 3-formyl 2-hydroxy quinoline
thiosemicarbazides. J. Pharm. Res. 2012, 5, 2735-2737.
42. Fajdetic A, Vinter A, Paljetak HC, Padovan J, Jakopovic IP, Kapic
S, Alihodzic S, Filic Darko, Modric M, Kosutic-Hulita N, Antolovic
R, Schoenfeld ZI, Mutak S, Haber VE, Spaventi R. Synthesis,
activity and pharmacokinetics of novel antibacterial 15-membered
ring macrolones. Eur. J. Med. Chem. 2011, 46, 3388-3397.
43. Issa MM, Nejem RM, EL-Abadla NS, AL-Kholy M, Saleh AA. Novel
atomic absorption spectrophometric and rapid spectrophotometric
methods for the quantitative of paracetamol in saliva: application
to pharmacokinetic studies. Indian J. Pharm. Sci. 2008, 70, 344-
350.
44. Gibaldi M, Perrier D. Pharmacokinetics. 2nd ed., New York, Marcel-
Dekker, 1982, pp. 121-123.
45. Ashik Ullah Md, Mohammad AKA, Sultana R, Eva RK, A. H. M.
Chapter-5 Pharmacological Evaluation
~~~~~~~~~~~~~~~~~~~~~~~~~~~~~~~~~~~~~~~~~~~~
~~~~~~~~~~~~~~~~~~~~~~~~~~~~~~~~~~~~~~~~~~~~ 139
Mahbub Latif AHM, Hasnat A. Pharmacokinetic Study of
Amoxicillin Capsule in Healthy Bangladeshi Subjects using
Urinary Excretion Data. Dhaka Univ. J. Pharm. Sci. 2009, 8, 53-
59.
46. PHAR 7633 Basic Pharmacokinetics, Chapter 20, Non
Compartmental Analysis, 2012, pp. 1-10.
47. Sova P, Mistr A, Kroutil A, Semerád M, Chlubnová H, Hrusková V,
Chládková J, Chládek J. A comparative study of
pharmacokinetics, urinary excretion and tissue distribution of
platinum in rats following a single dose oral administration of two
platinum (IV) complexes LA-12(OC-6-43)-bis(acetato)(1-
adamantylamine)amminedichloroplatinum (IV) and satraplatin
(OC-6-43)-bis(acetato) amminedichloro (cyclohexylamine) platinum
(IV). Cancer Chemotherapy and Pharmacology 2010, 67, 1247-
1256.