chapter 5 noise
DESCRIPTION
TRANSCRIPT
Chapter 5: Noise
BENT 3113: Communication Principles
82
Chapter 5: Noise
Learning Outcomes
At the end of this chapter, the student should be able to:
1. Explain and differentiate several types or sources of noise available in
communication system.
2. Analyse the noise parameters such as signal-to-noise ratio, noise figure and noise
factor.
3. Explain and analyse the communication system performances in the presence of
noise.
4. Describe the use of preemphasis and deemphasis network in improving the signal-
to-noise ratio of communication signal.
Chapter 5: Noise
BENT 3113: Communication Principles
83
Chapter 5: Noise
5.1 Noise – Representation, Types and Sources
Electrical noise is defined as any undesirable electrical energy that falls within the passband
of the signal.
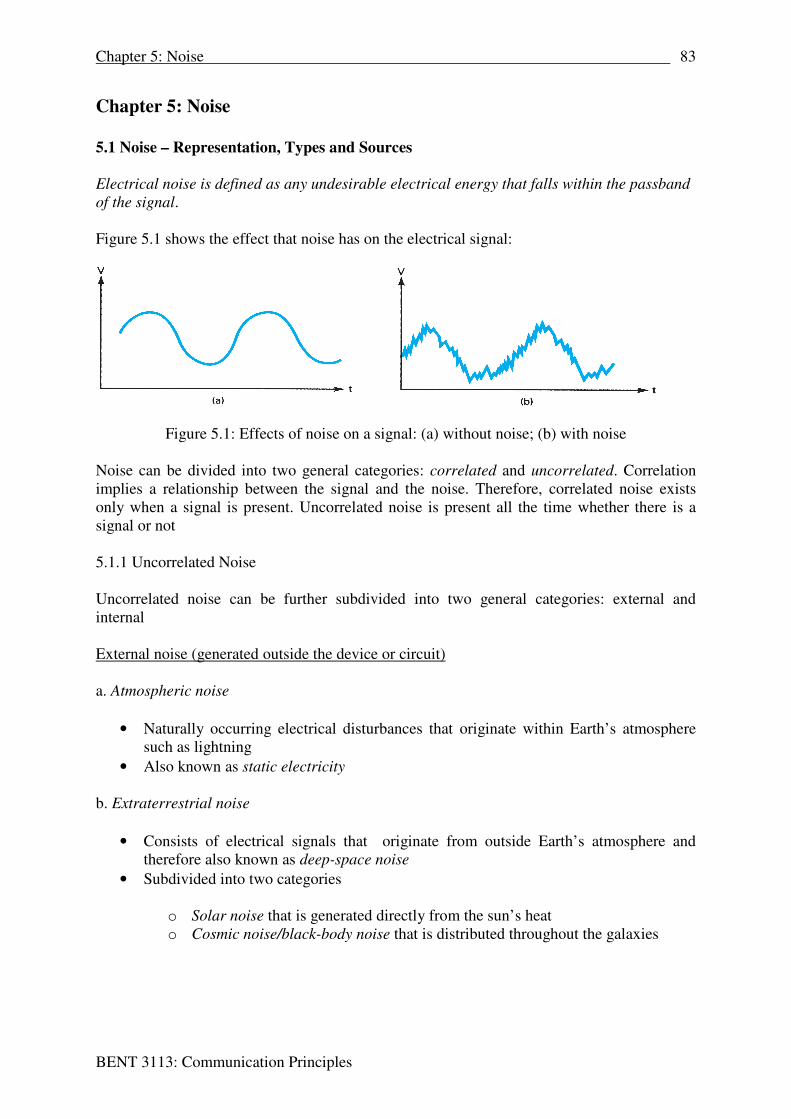
Figure 5.1 shows the effect that noise has on the electrical signal:
Figure 5.1: Effects of noise on a signal: (a) without noise; (b) with noise
Noise can be divided into two general categories: correlated and uncorrelated. Correlation
implies a relationship between the signal and the noise. Therefore, correlated noise exists
only when a signal is present. Uncorrelated noise is present all the time whether there is a
signal or not
5.1.1 Uncorrelated Noise
Uncorrelated noise can be further subdivided into two general categories: external and
internal
External noise (generated outside the device or circuit)
a. Atmospheric noise
• Naturally occurring electrical disturbances that originate within Earth’s atmosphere
such as lightning
• Also known as static electricity
b. Extraterrestrial noise
• Consists of electrical signals that originate from outside Earth’s atmosphere and
therefore also known as deep-space noise
• Subdivided into two categories
o Solar noise that is generated directly from the sun’s heat
o Cosmic noise/black-body noise that is distributed throughout the galaxies

Chapter 5: Noise
BENT 3113: Communication Principles
84
c. Man-made noise
• Noise that is produced by mankind
• The predominant sources of this noise are spark-producing mechanism, such as
commutators in electric motors, automobile ignition systems, ac power-generating
and switching equipment and fluorescent lights
• Sometimes known as industrial noise
Internal noise (generated within a device or circuit)
a. Shot noise
• Caused by the random arrival of carriers (holes and electrons) at the output element of
an electronic device
• Shot noise is randomly varying and is superimposed onto any signal present
b. Transit-time noise
• Irregular, random variation due to any modification to a stream of carriers as they
pass from the input to the output of a device
• This noise become noticeable when the time delay takes for a carrier to propagate
through a device is excessive
c. Thermal/random noise
• Associated with the rapid and random movement of electrons within a conductor due
to thermal agitation
• Also known as Brownian noise, Johnson noise and white noise
• Uniformly distributed across the entire electromagnetic spectrum
• A form of additive noise, meaning that it cannot be eliminated, and it increases in
intensity with the number of devices and with circuit length
• The most significant of all noise sources
• Thermal noise power
KTBN = (5.1)
N = noise power (watts), B = bandwidth (hertz), T = absolute temperature (kelvin)
K = Boltzmann’s constant ( 231038.1 −× joules/kelvin)
Note: 00 273+= CT
The following figure shows the equivalent circuit for a thermal noise source when the internal
resistance of the source IR is in series with the rms noise voltage NV

Chapter 5: Noise
BENT 3113: Communication Principles
85
Figure 5.2: Noise source equivalent circuit
For worst-case condition and maximum transfer of noise power, the load resistance R is made
equal to internal resistance. Thus the noise power developed across the load resistor:
R
V
R
VKTBN NN
4
)2/( 22
===
Thus RKTBVN 4= (5.2)
5.1.2 Correlated Noise
Correlated noise is a form of internal noise that is correlated to the signal and cannot be
present in a circuit unless there is a signal. It is produced by nonlinear amplification resulting
in nonlinear distortion. There are two types of nonlinear distortion that create unwanted
frequencies that interfere with the signal and degrade performance:
a. Harmonic distortion
• Occurs when unwanted harmonics of a signal are produced through nonlinear
amplification
• Harmonics are integer multiples of the original signal. The original signal is the first
harmonic (fundamental frequency). A frequency two times the fundamental frequency
is the second harmonic, three times is the third harmonic, and so on
• Distortion measurements
o Nth harmonic distortion = ratio of the rms amplitude of Nth harmonic to the
rms amplitude of the fundamental
o Total harmonic distortion (THD)
% THD = 100×
lfundamenta
higher
v
v (5.3)
Notes: 22
4
2
3
2
2 ..... nhigher vvvvv ++++= and all in rms values

Chapter 5: Noise
BENT 3113: Communication Principles
86
b. Intermodulation distortion
• Intermodulation distortion is the generation of unwanted sum and difference
frequencies produced when two or more signal mix in a nonlinear device (called cross
products)
• The emphasis here is on the word unwanted because in communication circuits it is
often desirable to produce harmonics or to mix two or more signals to produce sum
and difference frequencies
Figure 5.3 shows both forms of correlated noise
Figure 5.3: Correlated noise: (a) Harmonic distortion; (b) Intermodulation distortion
5.1.3 Other Noise Types
a. Impulse noise
• Characterized by high-amplitude peaks of short duration (sudden burst of irregularly
shaped pulses) in the total noise spectrum
• Common sources of impulse noise: transients produced from electromechanical
switches (relays and solenoids), electric motors, appliances, electric lights, power
lines, poor-quality solder joints and lightning
b. Interference
• Electrical interference occurs when information signals from one source produce
frequencies that fall outside their allocated bandwidth and interfere with information
signals from another source
• Most occurs in the radio-frequency spectrum
Chapter 5: Noise
BENT 3113: Communication Principles
87
5.2 Noise Parameters
5.2.1 Signal-to-Noise Power Ratio
Signal-to-noise power ratio (S/N) is the ratio of the signal power level to the noise power
level and can be expressed as
n
s
P
P
N
S= (5.4)
In logarithmic function n
s
P
PdB
N
Slog10)( = (5.5)
It can also be expressed in terms of voltages and resistance
=
outn
ins
RV
RVdB
N
S
/
/log10)(
2
2
(5.6)
If the input and output resistances are equal, Equation (5.6) can be reduced to
n
s
V
VdB
N
Slog20)( = (5.7)
5.2.2 Noise Factor and Noise Figure
Noise factor is the ratio of input signal-to noise ratio to output signal-to-noise ratio
out
in
NS
NSF
)/(
)/(= (5.8)
Noise figure is the noise factor stated in dB and is a parameter to indicate the quality of a
receiver
==
out
in
NS
NSFNF
)/(
)/(log10log10 (5.9)
Noise Figure in Ideal and Nonideal Amplifiers
An electronic circuit amplifies signals and noise within its passband equally well. Therefore,
if the amplifier is ideal and noiseless, the input signal and noise are amplified the same and
the signal-to-noise ratio at the output will equal the signal-to-noise ratio at the input. In
reality, amplifiers are not ideal. Therefore, the amplifier adds internally generated noise to the
waveform, reducing the overall signal-to-noise ratio
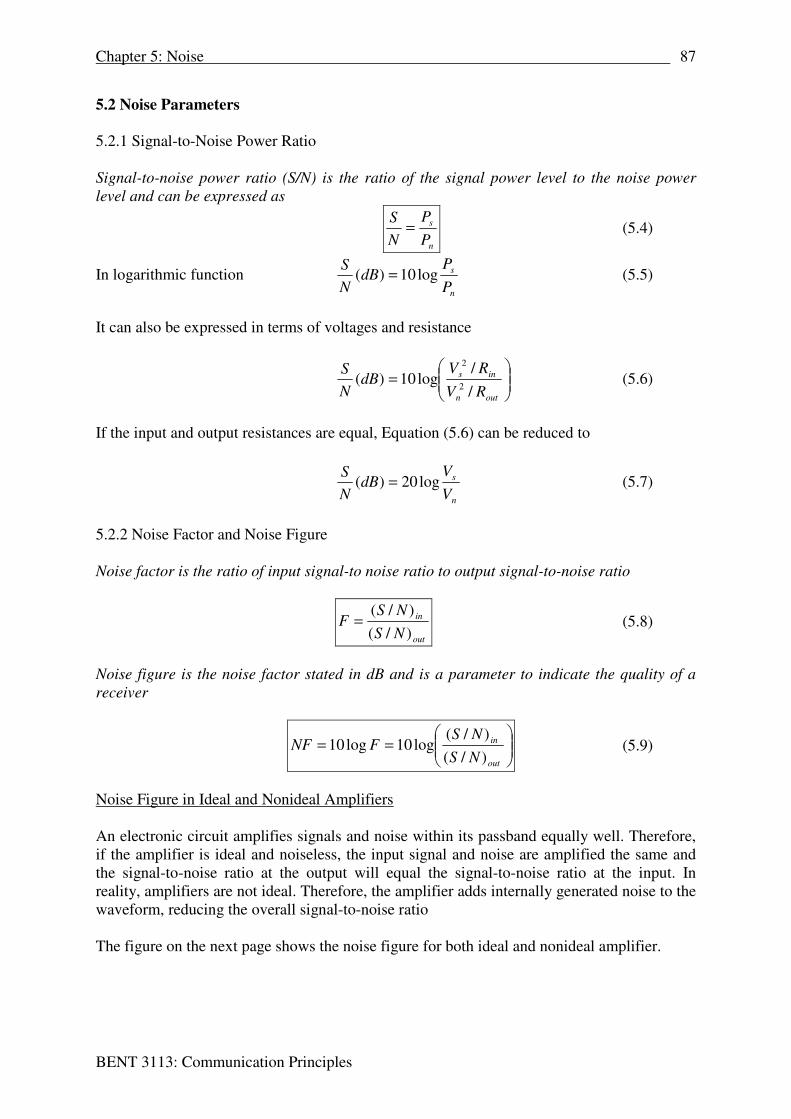
The figure on the next page shows the noise figure for both ideal and nonideal amplifier.
Chapter 5: Noise
BENT 3113: Communication Principles
88
Figure 5.4: Noise figure: (a) ideal, noiseless amplifier; (b) nonideal amplifier
• For Figure 5.4 (a), the input and output S/N ratios are equal
• For Figure 5.4 (b), the circuit adds the internally generated noise dN to the waveform.
Consequently, the output signal-to-noise ratio is less than the ratio at the input
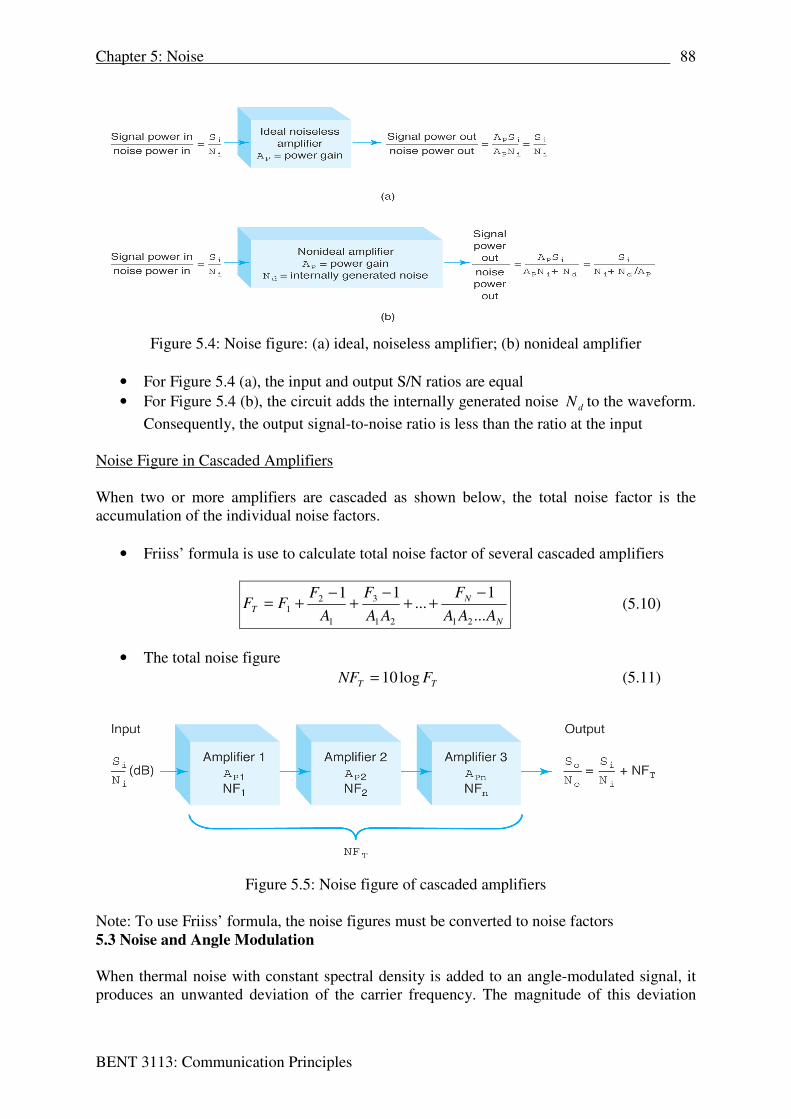
Noise Figure in Cascaded Amplifiers
When two or more amplifiers are cascaded as shown below, the total noise factor is the
accumulation of the individual noise factors.
• Friiss’ formula is use to calculate total noise factor of several cascaded amplifiers
N
N
TAAA
F
AA
F
A
FFF
...
1...
11
2121
3
1
21
−++
−+
−+= (5.10)
• The total noise figure
TT FNF log10= (5.11)
Figure 5.5: Noise figure of cascaded amplifiers
Note: To use Friiss’ formula, the noise figures must be converted to noise factors
5.3 Noise and Angle Modulation
When thermal noise with constant spectral density is added to an angle-modulated signal, it
produces an unwanted deviation of the carrier frequency. The magnitude of this deviation

Chapter 5: Noise
BENT 3113: Communication Principles
89
depends on the relative amplitude of the noise with respect to the carrier. Consider one
interfering noise signal with amplitude nV and frequency nf
• For PM, the unwanted peak phase deviation due to this interfering noise signal is
given by
c
n
peakV
V≈∆θ rad (5.12)
• For FM, when nc VV > , the unwanted instantaneous phase deviation is approximately
)sin()( nn
c
n tV
Vt θωθ += rad (5.13)
Taking derivative, we obtain
)cos()( nnn
c
n tV
Vt θωωω +=∆ rad/s
Therefore, the unwanted peak frequency deviation is
n
c
n
peakV
Vωω =∆ rad/s, n
c
n
peak fV
Vf =∆ Hz (5.14)
When this unwanted carrier deviation is demodulated, it becomes noise.
• The frequency of the demodulated noise signal is equal to the difference between the
carrier frequency and the interfering signal frequency )( nc ff −
• The signal-to-noise ratio at the output demodulator due to unwanted frequency
deviation from an interfering signal is the ratio of the peak frequency deviation due to
the information signal to the peak frequency deviation due to the interfering signal
noise
signal
f
f
N
S
∆
∆= (5.15)
The spectral shape of the demodulated noise depends on whether an FM or a PM
demodulator is used as shown in Figure 5.6
• The noise voltage at the output of PM demodulator is constant with frequency
• The noise voltage at the output of FM demodulator increases linearly with frequency
Chapter 5: Noise
BENT 3113: Communication Principles
90
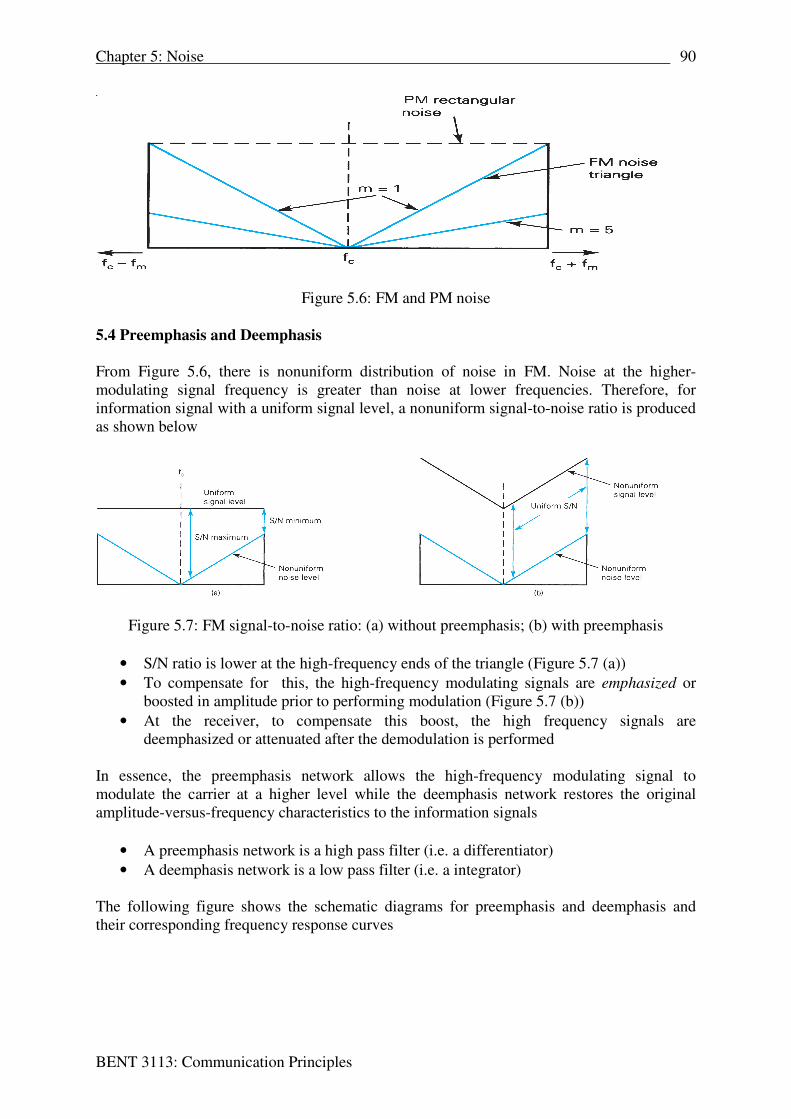
Figure 5.6: FM and PM noise
5.4 Preemphasis and Deemphasis
From Figure 5.6, there is nonuniform distribution of noise in FM. Noise at the higher-
modulating signal frequency is greater than noise at lower frequencies. Therefore, for
information signal with a uniform signal level, a nonuniform signal-to-noise ratio is produced
as shown below
Figure 5.7: FM signal-to-noise ratio: (a) without preemphasis; (b) with preemphasis
• S/N ratio is lower at the high-frequency ends of the triangle (Figure 5.7 (a))
• To compensate for this, the high-frequency modulating signals are emphasized or
boosted in amplitude prior to performing modulation (Figure 5.7 (b))
• At the receiver, to compensate this boost, the high frequency signals are
deemphasized or attenuated after the demodulation is performed
In essence, the preemphasis network allows the high-frequency modulating signal to
modulate the carrier at a higher level while the deemphasis network restores the original
amplitude-versus-frequency characteristics to the information signals
• A preemphasis network is a high pass filter (i.e. a differentiator)
• A deemphasis network is a low pass filter (i.e. a integrator)
The following figure shows the schematic diagrams for preemphasis and deemphasis and
their corresponding frequency response curves

Chapter 5: Noise
BENT 3113: Communication Principles
91
Figure 5.8: Preemphasis and deemphasis: (a) schematic diagrams, (b) frequency-response
• The break frequency (the frequency where pre- and deemphasis begins) is determined
by the RC or L/R time constant of the network
RLRCfb
/2
1
2
1
ππ== (5.16)
• The networks shown are for the FM broadcast band, which uses a 75-µs time
constant. Therefore the break frequency is approximately 2.12 kHz
From the preceding explanation and Figure 5.8, it can be seen that the output amplitude from
a preemphasis network increases with frequency for frequencies above break frequency
• From Equation (4.13), if changes in mf produce corresponding changes in mV , the
modulation index m remains constant
o This is the characteristic of phase modulation (modulation index independent
of frequency)
o I.e. for frequencies below 2.12 kHz produces FM, and frequencies above 2.12
kHz produce PM