chapter 5 safety and traffic operations - home | federal highway
TRANSCRIPT

V-1
CHAPTER 5
SAFETY AND TRAFFIC OPERATIONS
INTRODUCTION
Safety was a primary consideration evaluated in this Study, which responds to the Department’senhanced priority on safety -- its preeminent goal -- as well as the considerable public concernabout mixing larger trucks with passenger cars on our highways. The TS&W policies directlyinfluence the stability and control characteristics of trucks when they operate at or near establishedsize and/or weight limits. These characteristics influence how easily a truck driver can maintaincontrol should operating conditions become challenging or regain control should it be lost inresponse to a precipitous event. Although to date safety has not been an explicit objective ofTS&W policy in the United States, safety can be significantly affected either positively ornegatively by changes in truck design features that result from policy changes. Table V-1 showsqualitatively the relative positive and negative effects of increases in dimensions, weights andloading conditions, and operations on crashes involving trucks and certain vehicle stability andcontrol measures.
TRENDS IN MEDIUM TO HEAVY TRUCK CRASH EXPERIENCES
Medium to heavy trucks account for approximately 3 percent of vehicles in use on the Nation'shighways and accumulate 7 percent of all the vehicle miles of travel (VMT), while being involvedin 8 percent of all fatal crashes and 3 percent of all crashes (fatal, injury-producing, and property-damage-only crashes). Medium weight trucks have GVW ratings between 10,000 and 26,000pounds, while heavy trucks weigh in excess of 26,000 pounds. The relative involvement ofmedium to heavy trucks in fatal crashes has decreased over the past 8 to 10 years.
In 1995, 4,903 people were killed (see Table V- 2) and 119,000 injured in crashes involvingmedium to heavy trucks, the majority (78 percent) of those killed were occupants of other vehiclesinvolved in collisions with medium to heavy trucks. Most fatal crashes occur on rural roads (66percent) and involve single-trailer combinations (68 percent ) (see Figure V-1).

V-2
Table V-1Safety Impacts of TS&W Limits and Truck Operation
Vehicle Features Crash Occurrence Vehicle Stability Vehicle Control
Likelihood
Severity Static Dynamic Braking Low SpeedOfftracking
High SpeedOfftracking
Size Length - e -- + E + E -- - E + E
Width - e -- + E + E -- - e + e
Height -- -- - E - E -- -- - e
Design Number ofUnits
- e - E -- - E - e + E - E
Type ofHitching
-- + e + E + E + e + e + E
Number ofAxles
-- -- + e + e + E + e + e
Loading GVW - e - E - e - E - E -- - E
WeightDistribution
- e - e - e - E - E -- - e
Center ofGravityHeight
- e - e - E - E - E -- - e
Operation Speed - E + E - e - E - E + E - E
Steering Input
- e - e - e - E - E - E - E
+ / - As parameter increases, the effect is positive or negative. E = Large Effect. e = Small Effect. -- = No Effect.
Collisions between medium to heavy trucks and other, smaller vehicles (principally passengercars and light trucks and minivans) can be particularly lethal to the occupants of the smallervehicle, principally because of the difference in weight (mass) between the two vehicles, andfor head-on collisions, the high vehicle closing speeds typically involved. In total, collisions withmedium to heavy trucks account for 22 percent of all passenger car and light truck/van occupantfatalities sustained in collisions with other motor vehicles (see Figure V-2). Most fatal collisions(80 percent) involving a medium to heavy truck occur on non-Interstate roads, many of which areundivided roads and have comparatively high posted speed limits. Nevertheless, on aproportional basis, the number of other vehicle occupants killed in collisions with medium toheavy trucks, is significantly higher on Interstate highways (46 percent in rural settings,

1 M. Copenhaver and T. Wilkinson; Heavy Truck Occupant Restraint Use, U.S. DOT Report Number HS 807 752,August 1991.
V-3
28 percent in urban settings) than on other roadway types -- an indication, in many cases, of therelatively high proportion of medium to heavy trucks in the overall traffic flow on of these roads.
Table V-2 Fatalities and Injuries in Medium to Heavy Truck Crashes - 1995
TraumaOutcome
Occupant ofOther VehicleInvolved inCollision
Truck Occupant Pedestrian,Cyclist, Other
Total
Fatalities 3,835 644 424 4,903
Injuries 83,000 30,000 6,000 119,000 Source: FARS and GES, 1995
Both the number of people killed per year in medium to heavy truck crashes, and the crash fatalityrate, have decreased markedly over the past 17 years. Figure V-3 depicts the trend in the annualnumber of fatalities occurring in crashes involving all medium to heavy trucks and, separately, forthe two principal subclasses, single units and combinations, over the past 17 years. The patternsare distinctly different, with fatalities resulting from single-unit truck crashes virtually constantwhile those involving combination trucks have significantly decreased.
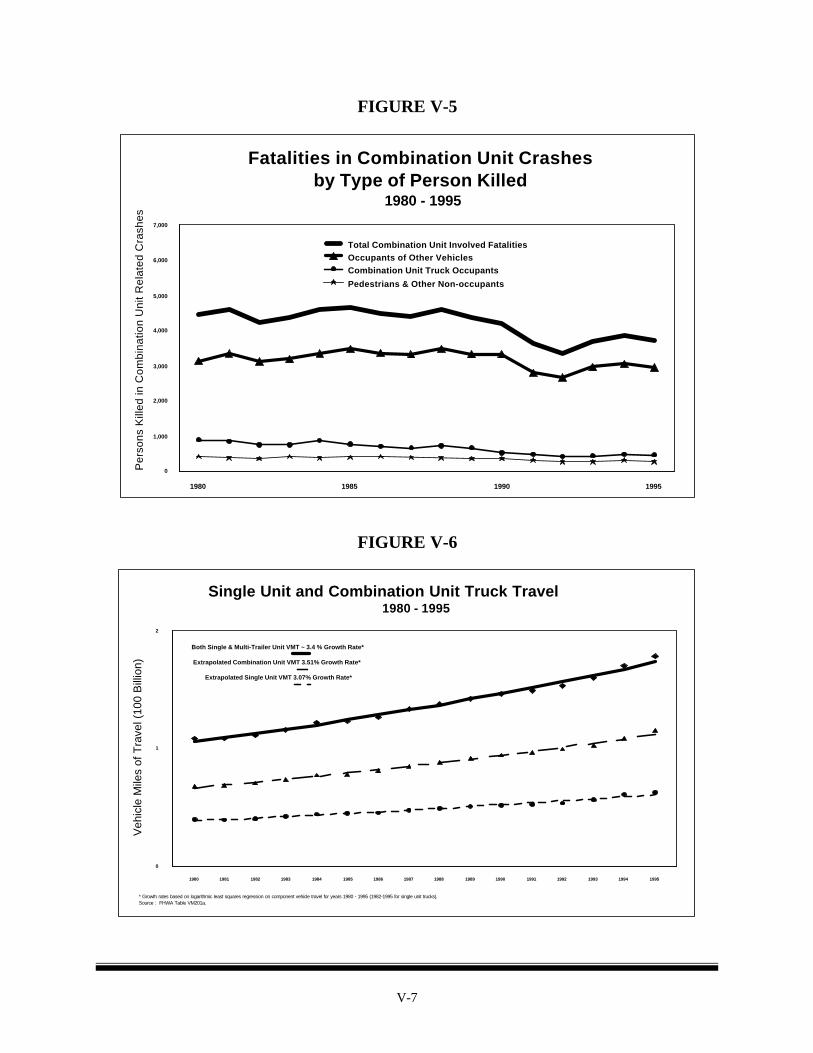
When these fatality trends are viewed in more detail, showing separately the fatality trends forother vehicle occupants and pedestrians, distinctly different patterns can be observed, especiallywhen considering single-unit and combination trucks separately. Proportionally, there was agreater reduction in the annualized number of truck occupants fatally injured (nearly 5 percent peryear reduction in the case of combinations and 4 percent per year reduction for single-unit trucks)than there were for occupants of other vehicles involved in collisions with heavy trucks (seeFigure V-4 and Figure V-5). During that time period, seat belt use among heavy truck driversincreased significantly from a low of 6 percent in 1982 to 55 percent in 1991.1
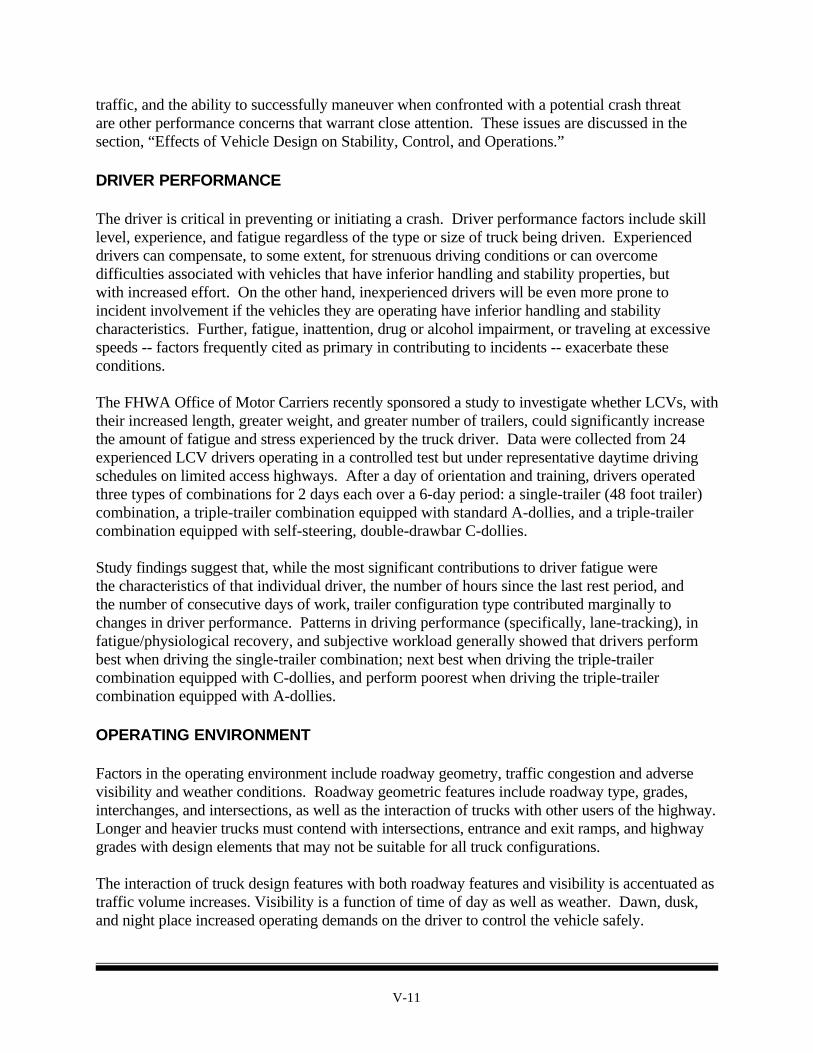
When the fatality trend data are normalized for exposure (VMT), the trends in fatality ratereduction are also impressive. Figure V-6 depicts the travel mileage growth pattern of medium toheavy trucks over the past 17 years. Single-unit truck travel increased at an annual rate of 3.1 percent, while the comparable growth rate for combination trucks was 3.5 percent. These dataresult in the fatality rate trend data for all medium to heavy trucks, and for the two principalsubclasses, as shown in Figure V-7. A strongly positive decreasing trend was evident until 1992,but since then, it has leveled off and remained essentially unchanged for the last 5 years.

V-4
Single Units
3,02623.4%
Single Trailer9,257
71.6%
Multi-Trailer640
5.0%
Rural - 66% of M/H Truck Involved Fatal Crashes
Single Units2,26433.8%
Single Trailer
4,16862.2%
Multi-Trailer269
4.0%
Urban - 34% of M/H Truck Involved Fatal Crashes
Fatal Crashes InvolvingMedium/Heavy Trucks
1991 - 1995
FIGURE V-1

V-5
4,186
27,124
20,539
7,843
20,695
6,647
Rual InterstateOther Rural Arterials
Other Rural Roads Urban I, F & E'sOther Urban Arterials
Other Urban Roads
0
5
10
15
20
25
30
Thou
sand
s
Num
ber
of P
erso
ns K
illed
Occupants killed in collisions not involving M/H trucks
Occupants killed in collisions involving M/H trucks
* Percent M/H truck involved.** Occupants of all other motor vehicles, except M/H truck occupants.
Other Motor Vehicle** Occupant FatalitiesResulting From Multi-Vehicle Collisions
1991 - 199546
%*
29%
*
15%
*
28%
* 15%
*
10%
*
Overall 22% M/HTruck Involved
FIGURE V-2

V-6
1980 1985 1990 1995
0
1,000
2,000
3,000
4,000
5,000
6,000
7,000
8,000
Per
sons
Kill
ed in
Med
ium
/Hea
vy T
ruck
Rel
ated
Cra
shes
Total Combination and Single Unit Involved Fatalities
Single Unit Involved Fatalities
Combination Unit Involved Fatalities
¹ Includes truck occupants, occupants of other vehicles colliding with trucks, and pedestrians killed in truck crashes
Medium/Heavy Truck Related Fatalities1980 - 1995
FIGURE V-3
1980 1985 1990 1995
0
500
1,000
1,500
2,000
Per
sons
Kill
ed in
Sin
gle
Uni
t Rel
ated
Cra
shes
Total Single Unit Involved FatalitiesOccupants of Other Vehicles
Single Unit Truck OccupantsPedestrians & Other Non-occupants
Fatalities in Single Unit Truck Crashesby Type of Person Killed
1980 - 1995
FIGURE V-4
V-7
1980 1985 1990 1995
0
1,000
2,000
3,000
4,000
5,000
6,000
7,000
Per
sons
Kill
ed in
Com
bina
tion
Uni
t Rel
ated
Cra
shes
Total Combination Unit Involved FatalitiesOccupants of Other VehiclesCombination Unit Truck Occupants
Pedestrians & Other Non-occupants
Fatalities in Combination Unit Crashesby Type of Person Killed
1980 - 1995
FIGURE V-5
1980 1981 1982 1983 1984 1985 1986 1987 1988 1989 1990 1991 1992 1993 1994 1995
0
1
2
Veh
icle
Mile
s of
Tra
vel (
100
Bill
ion)
Both Single & Multi-Trailer Unit VMT ~ 3.4 % Growth Rate*
Extrapolated Combination Unit VMT 3.51% Growth Rate*
Extrapolated Single Unit VMT 3.07% Growth Rate*
* Growth rates based on logarithmic least squares regression on component vehicle travel for years 1980 - 1995 (1982-1995 for single unit trucks).Source : FHWA Table VM201a.
Single Unit and Combination Unit Truck Travel1980 - 1995
FIGURE V-6

V-8
1980 1981 1982 1983 1984 1985 1986 1987 1988 1989 1990 1991 1992 1993 1994 1995
0
1
2
3
4
5
6
7
Fata
lties
¹ p
er 1
00 M
illio
n M
iles
of M
/H T
ruck
Tra
vel
Single Unit Trucks
Combination Unit Trucks
Composite All M/H Trucks
¹ Includes truck occupants, occupants of other vehicles colliding with trucks, and pedestrians killed in truck crashesSource : FHWA Table VM201a and NHTSA FARS data files.
Medium/Heavy Truck Fatality¹ Rates1980 - 1995
FIGURE V-7
In summary, overall commercial truck safety has improved markedly in the past 17 years, a periodduring which the following motor carrier and vehicle safety initiatives have been implemented inthe States.
* Introduction of uniform truck driver licensing and tracking of drivers' traffic violations andaccident experiences under the Federal/State Commercial Driver's License Program;
* Increased Federal and State driver and vehicle inspections and motor carrier safety auditsperformed under the Motor Carrier Safety Assistance Program (MCSAP);
* Increased driving skill levels and safety awareness among truck drivers as a result ofupgraded training received at institutions which adhere to the guidelines published by theindustry-sponsored Professional Truck Driver Training Institute;
* Increased safety management effort and professionalism among motor carriers, and;* Increased safety technology in truck designs, for example, improved seat belt designs and
other truck occupant crash protection features, antilock braking systems, rear underrideguards, and conspicuity treatment (reflecting tape) on trailers.

V-9
TRUCK CRASH CAUSATION AND SEVERITY FACTORS
Variables that influence the overall crash risk may be grouped into three broad categories: vehicleand equipment, driver performance, and operating environment (roadway and weather conditions). Figure V-8 illustrates the complex interrelationship of these variables as they contribute to truckcrashes. Driver errors typically trigger crashes, and therefore, are overwhelmingly cited as theirprincipal causes. Equipment considerations, which include vehicle size and weight andmechanical or operational failures, also play a role, but they are difficult to isolate. Operatingenvironment and vehicle-related factors can diminish safety either by predisposing drivers tocommit errors, or by preventing them from compensating or recovering from errors they commit. Thus, it is important to address all the contributing factors to crashes.
Figure V-8Interrelationship of Truck Crash Factors
Source: “Heavy Truck Safety Study,” U.S. DOT (HS 807 109), March 1987.
Another way of looking at the relationship of these various factors is to examine a hypotheticalcrash causation chain (see Figure V-9). The chain begins with predisposing conditions that, whencombined with situational characteristics, create an opportunity for a crash. In other words, thereis a set of factors that either predisposes or enables a crash to occur.

2 Includes static roll stability, rearward amplification and load transfer ratio. These concepts are defined in asubsequent section.
V-10
Figure V-9Heavy Truck Crash Causation "Chain"
PredisposingConditions
! SituationalCharacteristics
! “Trigger”Event
! “Crash” ! Outcome
! Driver - Poor Vision - Ill Trained - Poor Judgement
!Driver - Fatigued
!Driver - Inattentive, Swerves to Avoid Car Abruptly Stopping Ahead
!Jackknife/ Rollover
!Driver Killed - Total Loss/Cargo and Vehicle
!Vehicle - Low Roll Stability Threshold
!Vehicle - Maladjusted Brakes - Imbalanced Cargo!Highway/Environment - Wet Road
!Highway/Environment - Blind Curve - Frequent Intersections
!Management/ Operating Practices - Pushing Driver to Meet Short Delivery Time Schedule
!Management/ Operating Practices
!No Safety Program - “Run-To-Failure” Maintenance Policy
Source: “Heavy Truck Safety Study,” U.S. DOT (HS 807 109), March 1987.
VEHICLE AND EQUIPMENT
Vehicle factors include physical characteristics, such as the number of trailers in a combination,trailer length, and weight capacity; the dynamic performance2 of the vehicle under various loadedconditions; and mechanical systems such as brakes and engine characteristics.
The braking capability of combination trucks is particularly important. Braking capabilityrelates to achieving a safe stopping distance and maintaining vehicle control and stability duringbraking. It is influenced by a number of factors including weight and the number of wheels on thevehicle. Additionally, rollover propensity, the ability to negotiate turns and maneuver in
V-11
traffic, and the ability to successfully maneuver when confronted with a potential crash threatare other performance concerns that warrant close attention. These issues are discussed in thesection, “Effects of Vehicle Design on Stability, Control, and Operations.”
DRIVER PERFORMANCE
The driver is critical in preventing or initiating a crash. Driver performance factors include skilllevel, experience, and fatigue regardless of the type or size of truck being driven. Experienceddrivers can compensate, to some extent, for strenuous driving conditions or can overcomedifficulties associated with vehicles that have inferior handling and stability properties, butwith increased effort. On the other hand, inexperienced drivers will be even more prone toincident involvement if the vehicles they are operating have inferior handling and stabilitycharacteristics. Further, fatigue, inattention, drug or alcohol impairment, or traveling at excessivespeeds -- factors frequently cited as primary in contributing to incidents -- exacerbate theseconditions.
The FHWA Office of Motor Carriers recently sponsored a study to investigate whether LCVs, withtheir increased length, greater weight, and greater number of trailers, could significantly increasethe amount of fatigue and stress experienced by the truck driver. Data were collected from 24experienced LCV drivers operating in a controlled test but under representative daytime drivingschedules on limited access highways. After a day of orientation and training, drivers operatedthree types of combinations for 2 days each over a 6-day period: a single-trailer (48 foot trailer)combination, a triple-trailer combination equipped with standard A-dollies, and a triple-trailercombination equipped with self-steering, double-drawbar C-dollies.
Study findings suggest that, while the most significant contributions to driver fatigue werethe characteristics of that individual driver, the number of hours since the last rest period, andthe number of consecutive days of work, trailer configuration type contributed marginally tochanges in driver performance. Patterns in driving performance (specifically, lane-tracking), infatigue/physiological recovery, and subjective workload generally showed that drivers performbest when driving the single-trailer combination; next best when driving the triple-trailercombination equipped with C-dollies, and perform poorest when driving the triple-trailercombination equipped with A-dollies.
OPERATING ENVIRONMENT
Factors in the operating environment include roadway geometry, traffic congestion and adversevisibility and weather conditions. Roadway geometric features include roadway type, grades,interchanges, and intersections, as well as the interaction of trucks with other users of the highway. Longer and heavier trucks must contend with intersections, entrance and exit ramps, and highwaygrades with design elements that may not be suitable for all truck configurations.
The interaction of truck design features with both roadway features and visibility is accentuated astraffic volume increases. Visibility is a function of time of day as well as weather. Dawn, dusk,and night place increased operating demands on the driver to control the vehicle safely.

V-12
Crash profiles illustrated in Table V-3 show that approximately 35 percent of fatal crashes andabout 26 percent of nonfatal crashes occur in visibility conditions other than normal daylight. Inclement weather, such as rain, sleet, snow, and ice, creates road conditions that challenge thestability and control of vehicles during turning and braking maneuvers.
Table V-3Large Truck or Bus Crashes by Weather, Road Surface,
And Light Conditions
WeatherConditions
Fatal Non-Fatal
Road SurfaceConditions
Fatal Non-Fatal
LightConditions
Fatal Non-Fatal
No AdverseConditions
84.6 70.1 Dry 79.2 72.8 Daylight 64.3 73.7
Rain 9.5 17.0 Wet 15.1 11.4 Dark 22.7 14.5
Sleet 0.6 5.2 Snow/Slush 2.4 1.4 Dark/Lighted 8.9 7.3
Snow 2.6 6.0 Ice 2.8 5.7 Dawn 2.7 2.4
Fog 2.0 0.2 Sand, Oil, or Dirt 0.1 1.5 Dusk 1.4 1.4
INTERACTION OF CONTRIBUTORY FACTORS
These variables, and their contribution to truck crashes, are not entirely separable. Further,crash data records do not typically delineate cause in terms of the three categories. Also, theboundary between environmental and roadway conditions is not always clear, since one mayinfluence the other. The result is that, although several truck crash data analysis reports werereviewed (see Appendix A) to assess their validity for establishing differential crash rates forLCVs and non-LCVs, none were identified as having applicability.
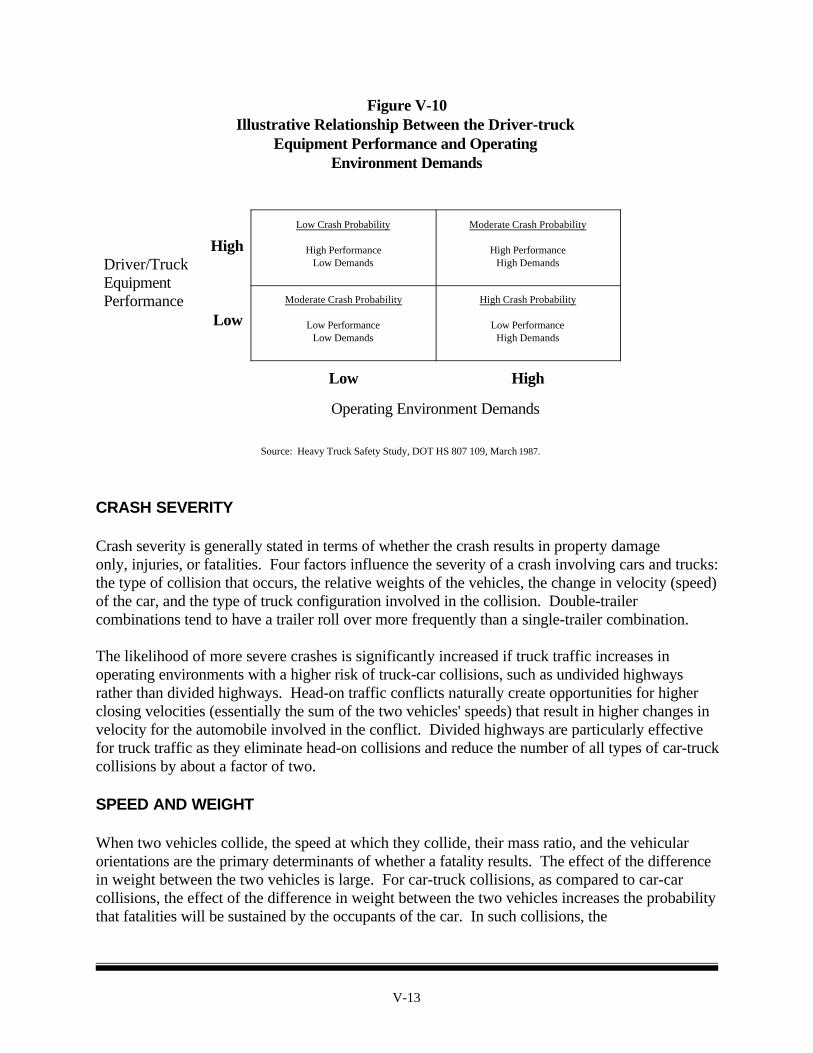
Figure V-10 illustrates the driver-truck equipment performance-operating environmentdemands relationship. Simply stated, as the operating environment performance demands(roadway, traffic, and weather conditions) increase, driver-truck equipment performance must alsoincrease to neutralize incident impacts. As indicated earlier, conditions of poor visibility result inincreased operating demands on the truck driver. Sight distance, decision distances, and the timeavailable for corrective or evasive action are all reduced, resulting in a need for closer control ofthe vehicle.
V-13
Figure V-10Illustrative Relationship Between the Driver-truck
Equipment Performance and Operating Environment Demands
HighDriver/TruckEquipmentPerformance
Low
Low Crash Probability
High PerformanceLow Demands
Moderate Crash Probability
High PerformanceHigh Demands
Moderate Crash Probability
Low PerformanceLow Demands
High Crash Probability
Low PerformanceHigh Demands
Low High
Operating Environment Demands
Source: Heavy Truck Safety Study, DOT HS 807 109, March 1987.
CRASH SEVERITY
Crash severity is generally stated in terms of whether the crash results in property damageonly, injuries, or fatalities. Four factors influence the severity of a crash involving cars and trucks: the type of collision that occurs, the relative weights of the vehicles, the change in velocity (speed)of the car, and the type of truck configuration involved in the collision. Double-trailercombinations tend to have a trailer roll over more frequently than a single-trailer combination.
The likelihood of more severe crashes is significantly increased if truck traffic increases inoperating environments with a higher risk of truck-car collisions, such as undivided highwaysrather than divided highways. Head-on traffic conflicts naturally create opportunities for higherclosing velocities (essentially the sum of the two vehicles' speeds) that result in higher changes invelocity for the automobile involved in the conflict. Divided highways are particularly effectivefor truck traffic as they eliminate head-on collisions and reduce the number of all types of car-truckcollisions by about a factor of two.
SPEED AND WEIGHT
When two vehicles collide, the speed at which they collide, their mass ratio, and the vehicularorientations are the primary determinants of whether a fatality results. The effect of the differencein weight between the two vehicles is large. For car-truck collisions, as compared to car-carcollisions, the effect of the difference in weight between the two vehicles increases the probabilitythat fatalities will be sustained by the occupants of the car. In such collisions, the
V-14
problem is aggravated by vehicle geometric and structural stiffness mismatches. The relativeclosing speed at impact is the single largest predictor of the likelihood that a given crash will havea fatal outcome.
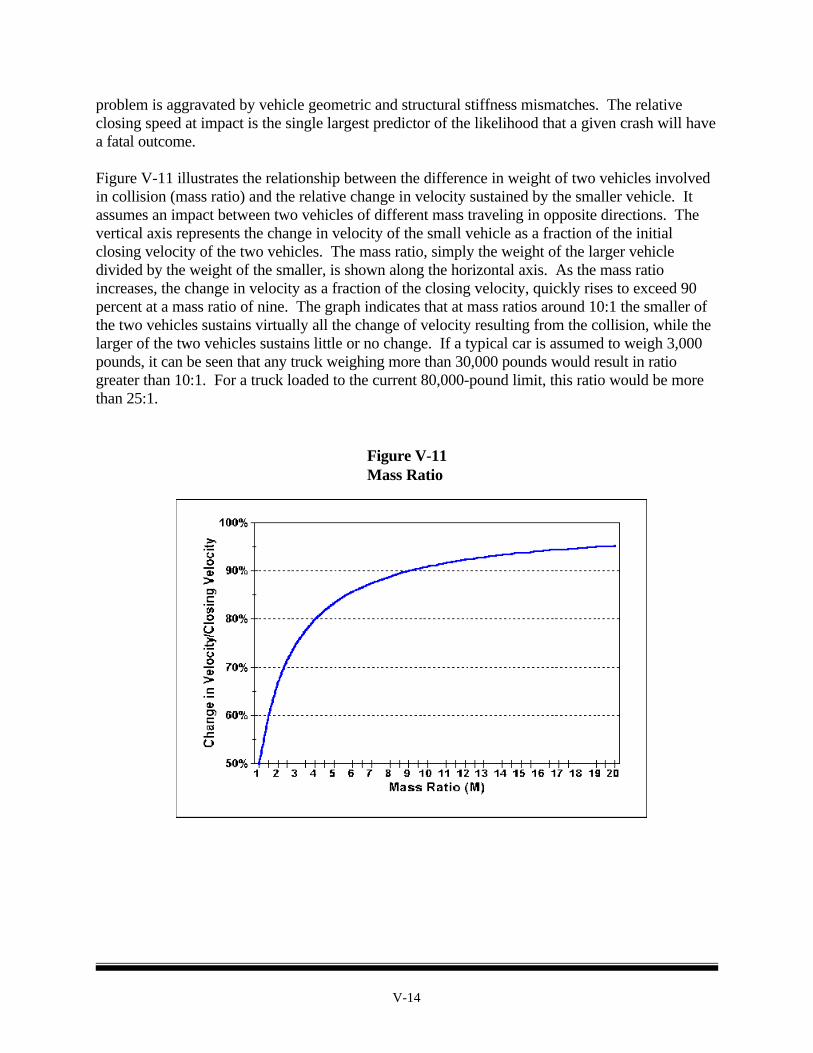
Figure V-11 illustrates the relationship between the difference in weight of two vehicles involvedin collision (mass ratio) and the relative change in velocity sustained by the smaller vehicle. Itassumes an impact between two vehicles of different mass traveling in opposite directions. Thevertical axis represents the change in velocity of the small vehicle as a fraction of the initialclosing velocity of the two vehicles. The mass ratio, simply the weight of the larger vehicledivided by the weight of the smaller, is shown along the horizontal axis. As the mass ratioincreases, the change in velocity as a fraction of the closing velocity, quickly rises to exceed 90percent at a mass ratio of nine. The graph indicates that at mass ratios around 10:1 the smaller ofthe two vehicles sustains virtually all the change of velocity resulting from the collision, while thelarger of the two vehicles sustains little or no change. If a typical car is assumed to weigh 3,000pounds, it can be seen that any truck weighing more than 30,000 pounds would result in ratiogreater than 10:1. For a truck loaded to the current 80,000-pound limit, this ratio would be morethan 25:1.
Figure V-11Mass Ratio

V-15
The significance of the change in velocity becomes more apparent as it is related to fatality rates incar-truck crashes. The fatality data shown in Figure V-12 indicates the likelihood of a fatality as afunction of the change in velocity of the vehicle. As can be seen in the figure, the data areapproximated by an exponential curve that estimates 100 percent fatalities for changes of velocitythat exceed approximately 65 miles per hour. These data demonstrate why, when a car and aheavy truck are involved in a head-on collision at speeds above 45 miles per hour, car occupantsare highly likely to be fatally injured.
Figure V-12Chance of Fatality as a Function of Change in Velocity
AUTO AND TRUCK DRIVER OBSERVATIONS
Twelve focus group meetings were held in 1996 to assess the perceptions, concerns, and reactionsof the auto driving public and over-the-road truck drivers to operations in mixed auto
3 FHWA Focus Groups with Auto Drivers and Truck Drivers on Size and Weight Issues, Draft Final Report (Focusgroup findings are documented in Apogee Research, Inc., February 24, 1997).
V-16
and truck traffic.3 The focus group discussions were intended to increase the understanding ofsafety practices, experiences, and perceptions among auto and truck drivers and to explore andassess how these groups are likely to react to possible changes in TS&W limits.
AUTO DRIVER CONCERNS
Auto drivers reported that they constantly worry about their safety when they are on the highway.They perceive the greatest threat as coming from other auto drivers -- people who are impatient,aggressive, reckless, intoxicated, or simply inattentive. They also consistently cited largecommercial trucks among their top three or four highway safety concerns.
SHARING THE ROAD
Many of the focus group participants believed that truckers drive too fast, too far, and for too manyhours to be safe. Truck speed and driver fatigue were among the greatest sources of auto driverconcern. The focus group participants said that when they see or hear examples of a truck crash orunsafe driving by truck drivers, they begin to worry about the type of person behind the wheel. Motorists tended to attribute the truck safety problem to two sources: (1) drivers withbad attitudes, and (2) economic forces in the trucking industry that create incentives for cuttingcorners by inadvertently rewarding unsafe practices or placing too much pressure on drivers.
ROAD CONDITIONS
Auto drivers also cited increased traffic congestion, bad weather and the mixing of truck and autotraffic under congested or inclement conditions as factors of concern.
TS&W
Many auto drivers indicated that they feel outmatched by the size and weight of large commercialtrucks. They indicated having seen or experienced dangerous and frightening interactions withlarge trucks on the highway, as well as news media reports of fatal truck crashes that stuck in theirminds and reinforced their safety concerns.

V-17
CHANGES TO TS&W LIMITS
The vast majority of participants said they preferred the status quo regarding Federal TS&Wstandards or -- if changes were actually made -- a return to greater restrictions. At the sametime, motorists suggested that it made little difference whether truck weights were increased ordecreased because in either case they were not likely to survive a collision with a truck.
Participants said they were opposed to allowing longer trucks and trailers because they perceivedsuch trucks to be less safe and harder to see or maneuver around. They commented that trucklength is visible, and therefore, they can observe its impact on safety. With respect to LCVs, many participants said that they would not believe that doubles or triples can be operated safely. Others said doubles and triples should be used, but only under very strict limits and conditions.
Finally, the responding auto drivers doubted that they would realize any economic benefits fromincreased truck dimensions and felt that policy decisions would be based on narrow political oreconomic pressures and would undermine highway safety. Further, they indicated that they sawlittle evidence to suggest that current regulations were being adequately enforced, noting that theyrarely saw trucks being inspected or pulled over for speeding.
TRUCK DRIVER CONCERNS
The truck drivers who participated in the focus groups generally felt that their jobs werepotentially dangerous and required that they be constantly vigilant regarding external threats totheir safety.
SHARING THE ROAD
The truck drivers cited automobile drivers as their biggest complaint. They indicated that, fromtheir perspective, auto drivers are increasingly unpredictable. Further, increased traffic and trafficcongestion have made potential safety problems worse, particularly around urban areas. The truckdrivers indicated that better driver education -- for automobile drivers -- might improve thesituation.
ROAD CONDITIONS
Truck drivers felt that traffic congestion is getting worse. They also perceived that the highwaysare less able to accommodate their larger, heavier trucks, which creates more potential hazards. Road design, highway conditions, and construction practices were seen as challengingmaneuverability and safe operations.
V-18
TRUCK DRIVER EXPERIENCE AND TRAINING
Truck drivers place a high premium on skill and experience. This makes veteran truck driversleery of new drivers whom they feel are being rushed through training that they -- experienceddrivers -- perceive to be inadequate because it focuses on preparing them to obtain a commercialdriver's license and not necessarily to be a safer driver.
TS&W
Weight was considered a key variable in truck safety; it was seen as determining a driver's abilityto maintain control under different conditions. However, according to the driver, a heavier truckis not necessarily a less safe truck. Trailers were reported as being too long for many city streets,and even for some ramps and access roads along Interstate highways.
Truck drivers felt that experienced, responsible drivers are safely operating heavy trucks, butsafe operation may be threatened by shippers, dispatchers, and companies that tend not to allowsufficient time for deliveries. Economics was seen as the most fundamental determinant of trucksafety, because it is such a dominant factor in influencing driving conditions -- truck weight,operating speed, and driver fatigue.
CHANGES TO CURRENT TS&W LIMITS
The drivers said, with considerable pride, that they could operate “anything” and confidentlyindicated that they could handle any increase in TS&W that might occur. However, they wereskeptical about the need for or desirability of allowing longer or heavier trucks on the highways. They said that maintaining safety would require changes in highway conditions, training,equipment, and economic incentives. Truck drivers were skeptical that the necessary changeswould be implemented.
Truck drivers generally opposed changing the TS&W standards. The majority preferred tomaintain the status quo or return to a more restrictive set of standards, particularly if the latterwould make the rules more uniform from State to State. Keeping up with the different, and evencontradictory, rules was reported as a time-consuming distraction. Further, nonuniformity wasreported as adding to stress, fatigue, and costs. Truck drivers also reported that, to ensurehighway safety, special restrictions should be required in LCV operations.
If the regulations were made less restrictive, the drivers said, more skill, experience, effort, andtime would be required to maintain safety on the highway. The drivers were doubtful that theserequirements would be met, given the problems they had previously cited.

V-19
EFFECTS OF VEHICLE DESIGN ON STABILITY, CONTROLAND OPERATION
Differing TS&W policies can affect the safety and traffic operations characteristics of heavy trucksas they lead carriers to choose particular vehicle design features and configurations for theiroperations. The vehicle dynamic properties of rollover, maneuverability, and the ability to avoidunanticipated crash threats are directly affected by truck (especially for long and heavy trucks)weight, dimensions (including the height of the loaded truck’s center of gravity, number of axles,and number of articulation points in combination trucks. The relevant design features andspecifications include:
• Overall vehicle length and wheelbase;• Vehicle track width;• Overall vehicle weight;• Individual axle weights;• Number of axles and tires on vehicle;• Number of units in a combination vehicle; and• Number of articulation points in a combination vehicle.
Important vehicle equipment specifications also include the types of tires and braking andsuspension systems.
In some cases, these vehicle design features and equipment limit vehicle performance in traffic,which reduces the driver’s ability to successfully execute abrupt or extreme maneuvers. Unlessother compensatory changes in driver performance and operating environment demands aremade to counteract the effects of vehicle performance differences, crash likelihoods and trafficdisruption effects increase somewhat.
Rollovers account for 8 to 12 percent of all combination truck crashes, but are involved inapproximately 60 percent of crashes fatal to heavy truck occupants. They greatly disrupt trafficwhen they occur in urban environments, particularly when hazardous materials are involved. Rollovers can be reduced by making vehicles more roll stable through design changes such aslower deck heights, more axles, and stiffer suspensions. Another solution would be for driversnever to exceed posted or reasonable speeds when traversing curves or exit ramps. There arethree performance measures that have evolved as being the principal indicators of crash risk due tovehicle design changes: static roll stability, rearward amplification, and load transfer ratio. All three describe aspects of a vehicle's basic or inherent propensity to roll over when turns orout-of-the-ordinary crash avoidance maneuvers are attempted.
BRAKING PERFORMANCE
Braking performance is a general concern that applies to all trucks and is not particularlyinfluenced by changes in TS&Ws, if the requisite number of axles and brakes are added as the

4 “Improved Brake Systems for Commercial Vehicles,” U.S. DOT (HS 807 706), April 1991.
V-20
vehicle's weight increases and all the vehicle's brakes are well-maintained. Antilock brakingsystems, now required on all trucks, will greatly enhance their braking performance and will beespecially beneficial to multitrailer combinations.
The most straightforward metric of brake system performance is the distance required to stopthe vehicle when fully loaded. Obviously, shorter distances are better in this regard. However,brakes must also be able to absorb and dissipate large amounts of kinetic energy when a fullyloaded truck descends a grade. Also, trucks need to be able to stop in a stable manner, withoutjack knifing or otherwise losing directional control due to wheels locking and skidding. Studieshave indicated that brake system performance plays a contributing role in approximately one-thirdof all medium-to-heavy truck crashes.4
The ability to stop in short distances mostly depends on the size and number of brakes on thevehicle, their adjustment and state of maintenance, and tire properties. If the vehicle's brakes areadequately sized -- and virtually all are as a result of Federal regulatory requirements -- they arecapable of generating enough force to lock most wheels on the vehicle when it is fully loaded. However, inadequately maintained or maladjusted brakes cannot generate needed braking power,which leads to longer stopping distances. Improper brake balance can cause downhill runawaysand braking instability. Furthermore, adding more load to a given vehicle without adding axlesand brakes degrades stopping performance.
HIGH-SPEED OFFTRACKING
When a combination vehicle negotiates a sweeping (long radius of curvature) high-speed curve, asit would at some interchanges between freeways, the rearmost trailer axle can track outsidethe path of the tractor steering axle. For most truck configurations analyzed, this offtracking is1 foot or less at 55 miles per hour. This tendency is reduced on superelevated curves. Conceivably, if the trailer wheels were to strike any outside curb during negotiation of the curve, arollover could occur, but this performance attribute has not been linked to any appreciable numberof truck crashes. High-speed offtracking is related to a vehicle's rearward amplificationtendencies and is indirectly addressed when rearward amplification is addressed.
TRAFFIC OPERATIONS EFFECTS
There are other measures of a vehicle's ability to negotiate turns or otherwise "fit" within thedimensions of the existing highway system. The principle metric is low-speed offtracking,however, there is little, if any, link between this performance attribute and the likelihood ofserious crashes (fatal or injury-producing), although excessive offtracking can disrupt traffic flowand damage infrastructure. This latter impact is discussed in Chapter 6, Highway Infrastructure.

V-21
Acceleration performance determines a truck's basic ability to blend well with other vehiclessharing the roadway with it; for example, hill climbing and acceleration ability, time to pass or bepassed on a two lane road, merging at interchanges, which can be incrementally degraded as trucksincrease in size or weight and, therefore, need to be addressed as well when considering theability of a given segment of roadway to safely accommodate longer and heavier trucks.
LOW-SPEED OFFTRACKING
When a combination vehicle makes a low-speed turn -- for example at a 90-degreeintersection -- the wheels of the rearmost trailer axle follow a path several feet inboard of the pathof the steering axle. If excessive, this phenomenon (low-speed offtracking) may force the driver, when executing a turn, to swing wide into adjacent lanes to avoid climbing inside curbsor striking curbside objects. Excessive offtracking can disrupt traffic operations or result inshoulder or inside curb damage at intersections and interchange ramp terminals that are designedlike intersections if they are heavily used by trucks.
Low-speed offtracking is affected primarily by the distance from the tractor kingpin to the center ofthe trailer’s rear axle or axle group. For a semitrailer, this distance is its effective wheelbase. Inthe case of a multitrailer combination, the effective wheelbases of all the trailers in thecombination, along with the tracking characteristics of the converter dollies, affect offtracking. Ingeneral, longer wheelbases worsen low-speed offtracking. Chapter 6 provides data on the extentof offtracking for a variety of truck configurations and trailer lengths.
Standard STAA double (two 28-foot trailers) and triple (three 28-foot trailers) combinationsofftrack less than the standard tractor and 53-foot semitrailer combination, as they havemore articulation points in the vehicle combination and use trailers with shorter wheelbases. Low-speed offtracking is a readily measured and/or calculated metric.
VEHICLE ACCELERATION AND SPEED MAINTENANCE
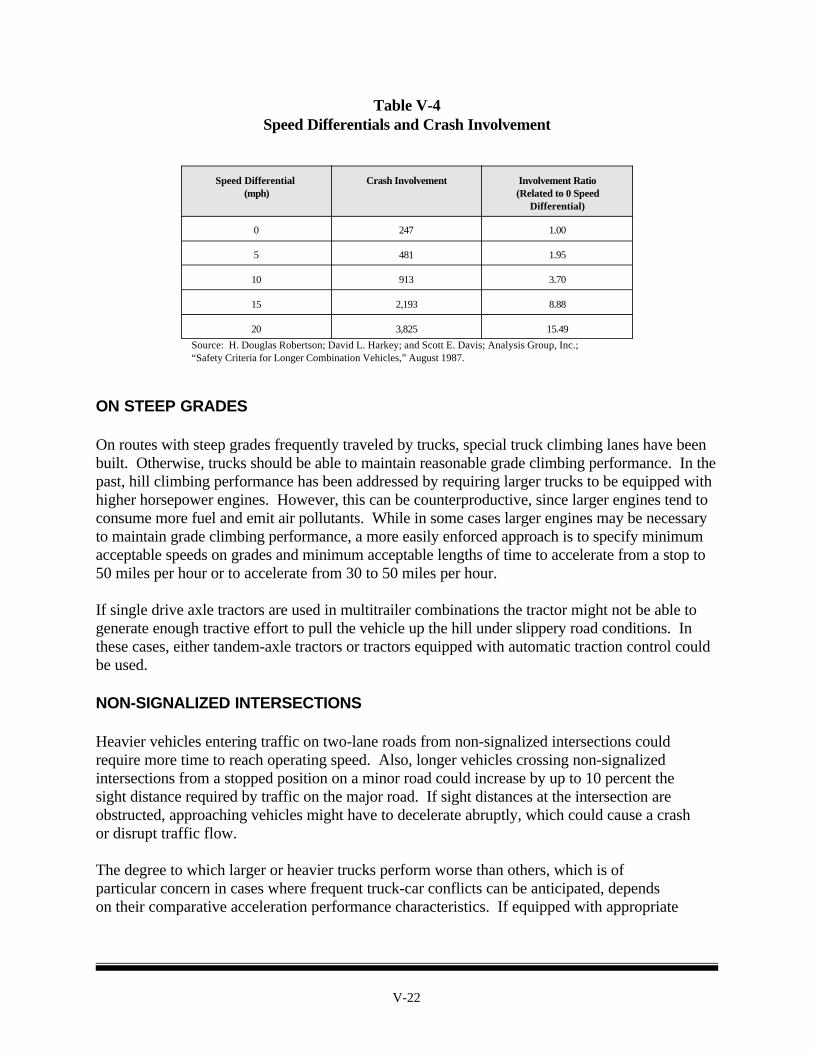
As a vehicle's weight increases, its ability to accelerate quickly and to climb hills at prevailingtraffic speeds is degraded, unless larger engines or different gearing arrangements are used. Pooracceleration is a concern when it results in large speed differentials between vehicles in traffic ascrash risks increase significantly with increasing speed differential. Table V-4 indicates that crashinvolvement may be from 15 to 16 times more likely at a speed differential of 20 miles per hour.
V-22
Table V-4Speed Differentials and Crash Involvement
Speed Differential (mph)
Crash Involvement Involvement Ratio(Related to 0 Speed
Differential)
0 247 1.00
5 481 1.95
10 913 3.70
15 2,193 8.88
20 3,825 15.49
Source: H. Douglas Robertson; David L. Harkey; and Scott E. Davis; Analysis Group, Inc.; “Safety Criteria for Longer Combination Vehicles,” August 1987.
ON STEEP GRADES
On routes with steep grades frequently traveled by trucks, special truck climbing lanes have beenbuilt. Otherwise, trucks should be able to maintain reasonable grade climbing performance. In thepast, hill climbing performance has been addressed by requiring larger trucks to be equipped withhigher horsepower engines. However, this can be counterproductive, since larger engines tend toconsume more fuel and emit air pollutants. While in some cases larger engines may be necessaryto maintain grade climbing performance, a more easily enforced approach is to specify minimumacceptable speeds on grades and minimum acceptable lengths of time to accelerate from a stop to50 miles per hour or to accelerate from 30 to 50 miles per hour.
If single drive axle tractors are used in multitrailer combinations the tractor might not be able togenerate enough tractive effort to pull the vehicle up the hill under slippery road conditions. Inthese cases, either tandem-axle tractors or tractors equipped with automatic traction control couldbe used.
NON-SIGNALIZED INTERSECTIONS
Heavier vehicles entering traffic on two-lane roads from non-signalized intersections couldrequire more time to reach operating speed. Also, longer vehicles crossing non-signalizedintersections from a stopped position on a minor road could increase by up to 10 percent thesight distance required by traffic on the major road. If sight distances at the intersection areobstructed, approaching vehicles might have to decelerate abruptly, which could cause a crashor disrupt traffic flow.
The degree to which larger or heavier trucks perform worse than others, which is ofparticular concern in cases where frequent truck-car conflicts can be anticipated, dependson their comparative acceleration performance characteristics. If equipped with appropriate

V-23
powertrains that ensure adequate acceleration performance, or if routes were screened forsuitability, these concerns would be minimized, regardless of the vehicle size or configuration.
AERODYNAMIC EFFECTS
Truck-generated splash and spray is sensitive to vehicle aerodynamics. Another aerodynamiceffect is the buffeting of adjacent vehicles from air turbulence. Air turbulence around trucks is notincreased with truck length or weight. Rather, the front of the truck and gaps between the tractorand the semitrailer(s) it tows can be the source of a transient disturbance to adjacent vehicles,especially if they are operating in substantial crosswinds. Double-trailer combinations have twoof these gaps, while triple-trailer combinations have three.
Efforts to improve truck aerodynamics are continual, since the fuel economy benefits that result aresubstantial. Both buffeting and splash and spray effects will be reduced as market-driven productdevelopment proceeds.
SUMMARY
Notwithstanding driver, roadway, and weather effects, only in cases of component failure doesvehicle performance directly cause a crash to occur. Importantly however, marginal or inferiorstability and control performance can make it difficult, if not impossible for a driver to recoverfrom an error, or avoid an unforseen conflict. Multitrailer combinations without compensatingdesign features have inferior performance capabilities compared to single-trailer combinationsand these differences, especially if frequently challenged in traffic conflict situations, result inincrementally higher crash likelihoods.
PERFORMANCE-BASED APPROACH TO TS&W REGULATION
Some countries allow more productive trucks under a performance-based approach to ensurethat these trucks would, under certain restrictions, enhance highway safety, that is, decrease thelikelihood of a crash. The ultimate approach to TS&W regulation would be based on how avehicle performs, that is, its roll stability when turning or making an evasive maneuver, the amountof wear it imposes on pavements and bridges, and how it fits on the highway system relative tointersections and sharp curves. This is in contrast to regulation of the physical characteristics(such as weight and dimension specifications -- TS&W limits) with which a vehicle must complybefore it may be operated. For example, TS&W regulations could require that a vehicle: (1)deflect a pavement no more than a certain accumulated amount, (2) cause a bridge to be stressedno more than a certain level, (3) offtrack no more than a certain distance, or (4) have a tendency toroll over no greater than a given level.

5"Applicability of Performance-Based Standards to Truck Size and Weight Regulation in the United States,”James York and Tom Maze, in Road Transport Technology -- 4: Proceedings of the Fourth InternationalSymposium on Heavy Vehicle Weights and Dimensions, June 25-29, 1995. Ed. Christopher B. Winkler.pp. 37-142.
V-24
For ease of regulatory compliance and enforcement, traditionally, TS&W limits have beenset so that a vehicle complying with these limits is determined to perform within acceptable limits. Historically, in the United States, vehicle performance has been of concern relative to pavementand bridge consumption and low-speed offtracking. However, other concerns have arisenregarding: (1) acceleration ability for climbing steep grades, entering freeway traffic, and clearingintersections; (2) the time required to pass or be passed by other vehicles, which is a function ofvehicle speeds and overall lengths; and (3) vehicle stability when making tight turns such as onfreeway interchange ramps or when making high-speed evasive maneuvers. Current FederalTS&W limits have not been based on these latter performance concerns, although they have beenconsidered in the evaluation of potential changes to the current limits such as for this Study.
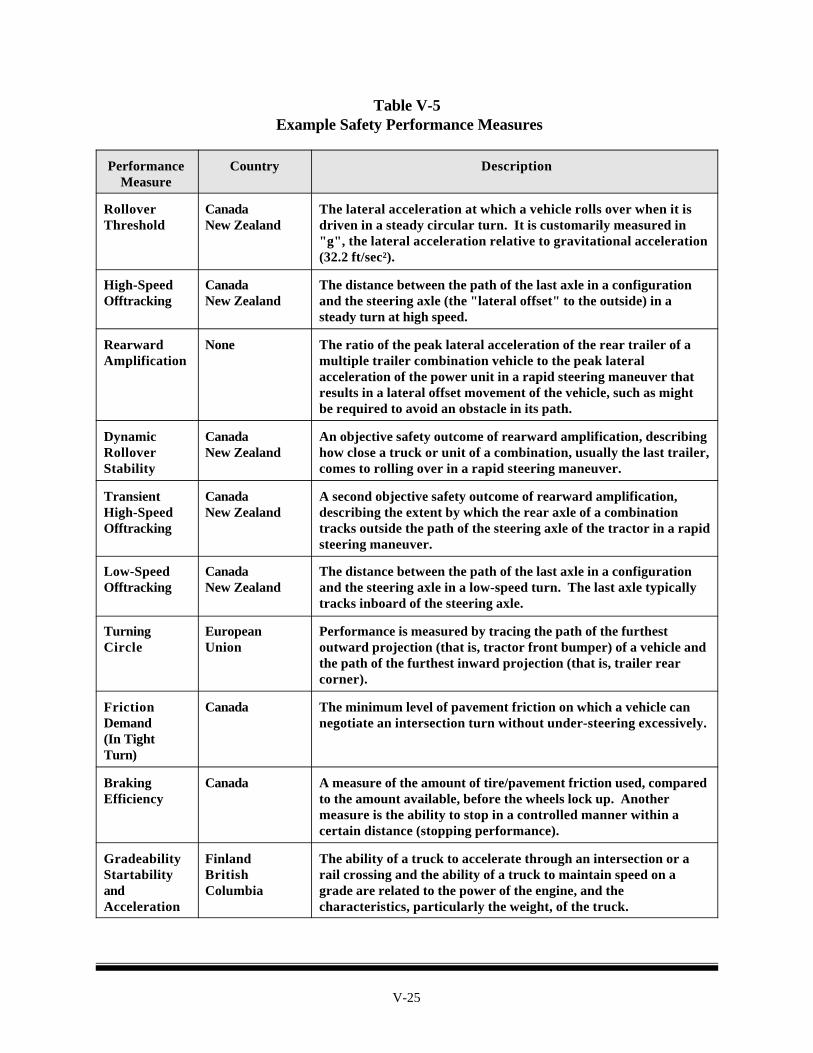
Experience under the current regime of Federal TS&W law and regulation has shown thattrucks, though being in compliance with regulatory limits, perform outside intended standards,especially for bridge stress levels. This results from the simple specification of the currentregulations, which nevertheless, provide for easier compliance and enforcement. Severalcountries employ various forms of a performance-based approach to TS&W regulation, and amongthese countries a broad range of limits are specified. A recent study5 examined TS&W regulationsin approximately 30 industrialized countries and found that the greatest disparity among countrieswas in the gross weights allowed, which ranged from 61,700 pounds in Switzerland to 110,200pounds in Norway for a 5-axle semitrailer combination. Further, authorities use differentperformance criteria to regulate vehicles, such as, dynamic stability, turning abilities, and abilityto maintain speed. Table V-5 describes various performance measures, most of which are ineffect in various countries.
ALTERNATIVE APPROACHES
There are two basic methods for implementing performance based regulations: (1) vehicletype certification with the certification shown for enforcement purposes by a placard on thevehicle or vehicle unit or by a permit in the power unit, and (2) the “envelope vehicle” approachwith weight and dimension specifications depending on the type of truck configuration: single-unittruck, single-trailer combination, and multitrailer combination (see Exhibit V-20). The remainingperformance-based approach discussion primarily focuses on performance criteria that measure avehicle’s tendency to avoid rolling over, that is, its stability when turning (especially in tight turnsat low speeds) and making evasive maneuvers at high speeds.
V-25
Table V-5 Example Safety Performance Measures
PerformanceMeasure
Country Description
RolloverThreshold
CanadaNew Zealand
The lateral acceleration at which a vehicle rolls over when it isdriven in a steady circular turn. It is customarily measured in"g", the lateral acceleration relative to gravitational acceleration(32.2 ft/sec²).
High-SpeedOfftracking
CanadaNew Zealand
The distance between the path of the last axle in a configurationand the steering axle (the "lateral offset" to the outside) in asteady turn at high speed.
RearwardAmplification
None The ratio of the peak lateral acceleration of the rear trailer of amultiple trailer combination vehicle to the peak lateralacceleration of the power unit in a rapid steering maneuver thatresults in a lateral offset movement of the vehicle, such as mightbe required to avoid an obstacle in its path.
DynamicRolloverStability
CanadaNew Zealand
An objective safety outcome of rearward amplification, describinghow close a truck or unit of a combination, usually the last trailer,comes to rolling over in a rapid steering maneuver.
Transient High-SpeedOfftracking
CanadaNew Zealand
A second objective safety outcome of rearward amplification,describing the extent by which the rear axle of a combinationtracks outside the path of the steering axle of the tractor in a rapidsteering maneuver.
Low-SpeedOfftracking
CanadaNew Zealand
The distance between the path of the last axle in a configurationand the steering axle in a low-speed turn. The last axle typicallytracks inboard of the steering axle.
TurningCircle
European Union
Performance is measured by tracing the path of the furthestoutward projection (that is, tractor front bumper) of a vehicle andthe path of the furthest inward projection (that is, trailer rearcorner).
FrictionDemand (In TightTurn)
Canada The minimum level of pavement friction on which a vehicle cannegotiate an intersection turn without under-steering excessively.
BrakingEfficiency
Canada A measure of the amount of tire/pavement friction used, comparedto the amount available, before the wheels lock up. Anothermeasure is the ability to stop in a controlled manner within acertain distance (stopping performance).
GradeabilityStartabilityandAcceleration
Finland BritishColumbia
The ability of a truck to accelerate through an intersection or arail crossing and the ability of a truck to maintain speed on agrade are related to the power of the engine, and thecharacteristics, particularly the weight, of the truck.
V-26
Regarding the implementation of the vehicle type certification approach in particular, thegeneral consensus of opinion expressed in interviews of State officials during this Study isthat any assessment of the institutional feasibility of a performance-based approach has to betentative unless or until it is decided what aspects of performance are included, how theseattributes can be measured, and how truck performance can be tested by those responsible forTS&W regulation. Canadian and New Zealand experiences with these approaches follow.
CANADA
The Canadian experience with performance-based standards for trucks and truck combinationsevolved out of a study conducted by the Road Transport Association of Canada (RTAC) inthe early 1980's. The RTAC process studied many of the performance measures outlined in TableV-6 and based on those analyses established truck configurations that were known to meet thefollowing criteria: (1) interact acceptably with the highway infrastructure; (2) have higher safetyperformance properties than existing configurations; and (3) increase productivity for industry.
However, Canada did not specify its regulations in performance terms. After evaluating thevehicle stability and control (VS&C) performance, it determined the vehicle weights anddimensions required to ensure that performance standards would be met for each of several truck configurations. This is the “envelope vehicle” approach. It differs from the U.S. Federalapproach in two ways: (1) VS&C performance was explicitly considered along with pavement andbridge wear considerations, and (2) weights and dimensions are specified by truck configurationtype.
A list of the acceptable configurations was developed to achieve a degree of uniformity in size andweight limits among the Provinces. Benefits evolving from the application of the RTAC approachincluded expansion in the use of the tridem-axle group in Canada, and improvements in stabilityand control of larger combinations through the use of B-train doubles with additional weight. In1989 the Provinces and Territories agreed to implement recommendations from the RTAC Studythrough a Memorandum of Understanding on Vehicle Weights and Dimensions.
V-27
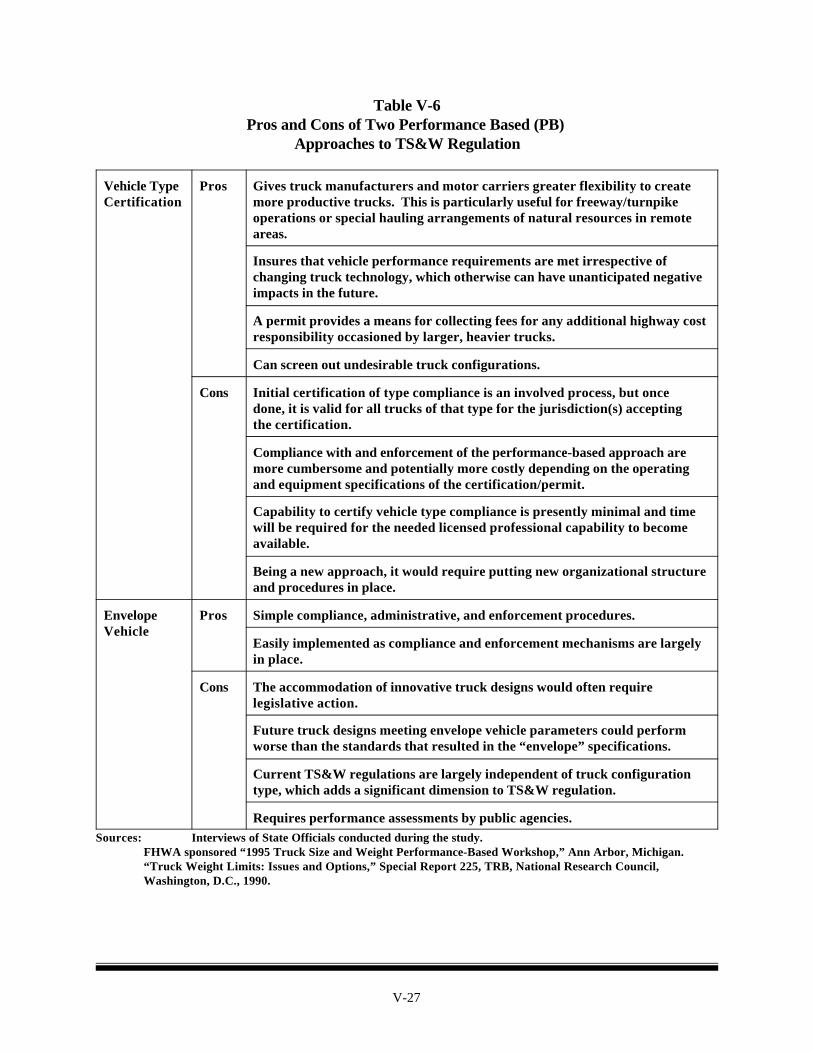
Table V-6Pros and Cons of Two Performance Based (PB)
Approaches to TS&W Regulation
Vehicle TypeCertification
Pros Gives truck manufacturers and motor carriers greater flexibility to createmore productive trucks. This is particularly useful for freeway/turnpikeoperations or special hauling arrangements of natural resources in remoteareas.
Insures that vehicle performance requirements are met irrespective ofchanging truck technology, which otherwise can have unanticipated negativeimpacts in the future.
A permit provides a means for collecting fees for any additional highway costresponsibility occasioned by larger, heavier trucks.
Can screen out undesirable truck configurations.
Cons Initial certification of type compliance is an involved process, but once done, it is valid for all trucks of that type for the jurisdiction(s) acceptingthe certification.
Compliance with and enforcement of the performance-based approach aremore cumbersome and potentially more costly depending on the operatingand equipment specifications of the certification/permit.
Capability to certify vehicle type compliance is presently minimal and timewill be required for the needed licensed professional capability to becomeavailable.
Being a new approach, it would require putting new organizational structureand procedures in place.
EnvelopeVehicle
Pros Simple compliance, administrative, and enforcement procedures.
Easily implemented as compliance and enforcement mechanisms are largelyin place.
Cons The accommodation of innovative truck designs would often requirelegislative action.
Future truck designs meeting envelope vehicle parameters could performworse than the standards that resulted in the “envelope” specifications.
Current TS&W regulations are largely independent of truck configurationtype, which adds a significant dimension to TS&W regulation.
Requires performance assessments by public agencies. Sources: Interviews of State Officials conducted during the study.
FHWA sponsored “1995 Truck Size and Weight Performance-Based Workshop,” Ann Arbor, Michigan.“Truck Weight Limits: Issues and Options,” Special Report 225, TRB, National Research Council,Washington, D.C., 1990.

6 "Regulating Heavy Vehicle Safety in New Zealand Using Performance Standards,” John Edgar, LTSA,New Zealand. In Road Transport Technology -- 4: Proceedings of the Fourth International Symposium onHeavy Vehicle Weights and Dimensions, June 25-29, 1995. Ed. Christopher B. Winkler. pp. 115-119.
V-28
NEW ZEALAND6
The New Zealand performance-based approach (vehicle type certification) requires evidenceof a productivity improvement and no reduction in safety levels from the existing condition. Theregulations are guided by performance and service principles established by the Land TransportSafety Authority (LTSA), a Crown entity that is controlled by a Board of Directors selected fromindustry. The LTSA serves as advisor to the government on land transport safety issues. Proof ofno reduction in safety levels is the demonstration of vehicle dynamic performance using computersimulation models.
Among the restrictive conditions to ensure that safety is not compromised are: (1) the design of thevehicles must be such that the simulated loading conditions cannot be exceeded, assuming thehighest density product for which the approval is valid (has the effect of being limited to enclosedtrailers, such as van and tank trailers); (2) no tolerances shall be applied to the vehicle weightsprescribed (design capacity must not exceed the approved weight for the approved commodity);(3) maximum speed capability shall be controlled to 90 kilometers per hour; (4) an approvedtachograph or electronic speed-time recording device shall be fitted and used at all times and theoutput made available to any enforcement officer on request; and (5) the stability levels specifiedshall be achieved by every unit of the combination.
An 88,000-pound, A-train double-trailer combination policy for milk trucks was the firstregulation developed under the process, and any A-train combination that meets the performancestandards under all loading conditions can be considered for approval. This approval requiredcompliance with three stability performance measures: (1) static roll threshold of 0.45 g’s orgreater; (2) dynamic load transfer ratio of 0.6 or less; and (3) high speed transient offtracking of0.5 meters or less.
This process has resulted in significant costs and related difficulties for industry. It was found thatonly one organization existed in New Zealand with the capability of conducting the simulationtesting. Additional difficulty arose from the lack of data needed for testing vehicles andcomponents. Consequently, the performance standards were revised through negotiations betweenthe LTSA and industry. Since only twenty vehicles have been qualified and are operating underthe A-train double-trailer policy, the policy is considered a limited success.
V-29
REFERENCES
Baas, Peter H.; White, David M. 1989. “Safety Improvements for Increased Weights andDimensions in New Zealand,” Proceedings of Second International Symposium on HeavyVehicle Weights and Dimensions, Kelowna, British Columbia.
Billing, J.R. 1995. “Implementation of Vehicle Weight and Dimension Regulations.” In RoadTransport Technology - 4, Proceedings of the Fourth International Symposium on HeavyVehicle Weights and Dimensions. Ann Arbor, Michigan, June 25-29, 1995. pp. 107-114.
Billing, J.R. 1992. “A Discussion of Performance Standards for Configurations of Heavy Trucks,”Heavy Vehicles and Roads: Technology, Safety and Policy. Third International Symposium onHeavy Vehicle Weights and Dimensions. Cambridge U.K. Eds. D. Cebon & C.G.B. Mitchell.Thomas Telford Services Ltd, London. pp. 278-283.
Canroad Transportation Research Corporation. 1986. Vehicle Weights and Dimension Study:Technical Steering Committee Report, RTAC, Ottawa, Ontario, Canada.
Edgar, John. 1995. “Regulating Heavy Vehicle Safety in New Zealand Using PerformanceStandards,” In Road Transport Technology - 4, Proceedings of the Fourth InternationalSymposium on Heavy Vehicle Weights and Dimensions. Ann Arbor, Michigan, June 25-29, 1995. pp. 115-119.
El-Gindy, M. 1992. “The Use of Heavy Vehicle Performance Measures for Design andRegulation,” Transportation Systems - 1992, DSC-Volume 44, The American Society ofMechanical Engineers, New York, N.Y.
TRB. 1990a. Truck Weight Limits: Issues and Options, Special Report 225, National ResearchCouncil, Washington, D.C.
TRB. 1990b. New Trucks For Greater Productivity and Less Road Wear: An Evaluation of theTurner Proposal, Special Report 227, National Research Council, Washington, D.C.
UMTRI. 1995. Road Transport Technology--4, Proceedings of the Fourth InternationalSymposium on Heavy Vehicle Weights and Dimensions. Edited by Christopher B. Winkler.Winkler, C.B.; Fancher, P.S.; Bareket, Z.; Bogard, S.; Johnson, G.; Karamihas, S.; and Mink, C. 1992. Heavy Vehicle Size and Weight -- Test Procedures for Minimum SafetyPerformance Standards, Report Number DOT HS 807 855. U.S. DOT, NHTSA, Washington, D.C.

V-30
APPENDIX A
SUMMARY OF TRUCK CRASH RATE ESTIMATES FROM SELECTEDSTUDIES
Table V-7 lists crash rate estimates compiled through the review of seven sources (listed inTable V-8). As can be seen in the Table, a variety of quantities are presented depending on thespecific source. One might compare the crash rates of different truck configurations withina single study, however, there is no assurance that a different study with a different populationwould agree with the findings of another study. No data set presently available contains both crashand exposure information on all of these aspects of LCVs or non-LCVs in sufficient detail to fullyaddress questions as to the differences in their comparative crash involvement histories.
Table V-7 Crash Rates from Past Studies
(Per MVMT)
TruckConfiguration
Source
A B C D E F G
Single-Unit 0.369 Fatal 0.009
All 0.86
Semitrailer Local 1.51
Intercity0.812
All6.79
Casualty1.51
0.486 Interstate 3.83
Other Hwys 28.45
Locals 15.65
Fatal 0.035
All1.38
Fatal0.0244
Fatal0.0298
Truck-Trailer Local 0.981
Intercity0.833
All5.69
Casualty 1.61
0.584 Interstate3.52
Other Hwys18.8
Locals9.96
STAA Double 0.458 Fatal0.043
All1.39
Fatal0.0208
Fatal0.0346
RMD
TurnpikeDouble

V-31
Table V-8 Sources For Information in Table V-7
A “Comparison of Accident Characteristics and Rates for Combination Vehicles with One or TwoTrailers,” Thipatai Chirachavala and James O’Day, UMTRI Report UM-HSRI-81-41, August 1981.
B “Differential Truck Accident Rates for Michigan,” Richard W. Lyles; Kenneth L. Campbell;Daniel F. Blower, and Polichronis Stamatiadis, Transportation Research Record 1322.
C “Analysis of Accident Rates of Heavy-Duty Vehicles,” Kenneth L. Campbell, Daniel F. Blower;R. Guy Gattis, and Arthur C. Wolfe, UMTRI Report, April 1988.
D “Comparison of Accident Rates for Two Truck Configurations,” Paul P. Jovanis; Hsin-LiChang; and Ibrahim Zabaneh, Transportation Research Record 1249.
E “Truck Accidents by Classification,” V.D. Graf and K. Arculeta, CALTRANS, FHWA/CA/TE-85.
F “Larger Dimensioned Vehicle Study, Final Report” FHWA, September 1993.
G “Comparison of California Accident Rates for Single and Double Tractor-Trailer CombinationTrucks,” C.S. Yoo; Martin L. Reiss; and Hugh W McGee; BioTechnology Incorporated, March1978.