chapter 5 shape memory alloy based vibration...
TRANSCRIPT
54
CHAPTER 5
SHAPE MEMORY ALLOY BASED VIBRATION CONTROL
5.1 INTRODUCTION
This chapter focuses on development of a smart structure for active
vibration suppression by using a Shape Memory Alloy (SMA) wire actuator
called FLEXINOL. Also, experimental setup used in the research work and the
methodology are discussed briefly in this chapter. The influence of parameters
such as, input current, volume fraction of SMA, wire diameter and various
excitation frequencies over the different ply orientations of GFRP composite and
Aluminium cantilever structures are studied. Moreover, timing and actuation
circuit and displacement feedback controller is developed to take care of the
supply to SMA wire.
5.2 SHAPE MEMORY ALLOY
In 1965, SMA derived from Nickel and Titanium (NITINOL) was
first patented by Buehler and Wiley in Naval Ordnance Laboratory, USA.
Shape Memory Alloys (SMA) has the composition at the range of 53-55% of
applications including smart structures, biomedical devices, and robotics.
When an SMA is cold, or below its transformation temperature, it has a very
low yield strength and can be deformed quite easily into any new shape which
will retain. However, when the material is heated above its transformation
temperature, it undergoes a change in crystal structure which causes it to
return
55
to its original shape. If the SMA encounters any resistance during this
transformation, it can generate extremely large forces. This phenomenon
provides a unique mechanism for remote actuation.
SMA has very good electrical and mechanical properties, long
fatigue life, and high corrosion resistance. As an actuator, it is capable of upto
5% strain recovery and 345 MPa restoration stress after many cycles.
For example, a NITINOL wire 0.50mm in diameter can lift as much as 7.25kg.
The variation in strain of SMA with change in temperature is shown in
Figure 5.1. NITINOL also has the resistance properties, which enable it to be
actuated electrically by joule heating. When an electric current is passed
directly through the wire, it can generate enough heat to cause the phase
transformation. In most cases, the transition temperature of the SMA is chosen
such that room temperature is well below the transformation point of the
material. Only with the intentional addition of heat, the SMA can exhibit
actuation. In essence, NITINOL is an actuator, sensor, and heater all in one
material. Shape memory alloy, however, is not for all applications.
One must take into account that the forces, displacements, temperature
conditions, and cycle rates are required for a particular actuator.
The advantages of NITINOL become more pronounced as the size
of the application decreases. Large mechanisms may find solenoids, motors,
and electromagnets to be more appropriate. But in applications where such
actuators cannot be used, shape memory alloy provides an excellent
alternative. There are few actuating mechanisms which produce more useful
work per unit volume than NITINOL. It is available in the form of wire, rod
and bar stock, and thin film. The electrical and mechanical properties of SMA
wires supplied by the manufacturer are used in this study shown in Tables 5.1
& 5.2 respectively.

56
Figure 5.1 Variation in strain with change in temperature
(www.dynalloy.com)
Table 5.1 Electrical properties of SMA wire
Wire diameter
size (in)
Resistance
inch)
Maximum pull force
(g)
App. current at room
temperature (mA)
Off time 70°C wire (s)
Off time 90°C wire (s)
0.001 45 7 20 0.1 0.06
0.0015 21 17 30 0.25 0.09
0.002 12 35 50 0.3 0.1
0.003 5 80 100 0.5 0.2
0.004 3 150 180 0.8 0.4
0.005 1.8 230 250 1.6 0.9
0.006 1.3 330 400 2 1.2
0.008 0.8 590 610 3.5 2.2
0.010 0.5 930 1000 5.5 3.5
0.012 0.33 1250 1750 8 6
0.015 0.2 2000 3000 13 10
0.020 0.020 3560 4000 17 15

57
Table 5.2 Mechanical properties of SMA wire
Property Parameter LT alloy HT alloy
Thermal
Austenite Start Temperature (oC) 68 88 Austenite Finish Temperature (oC) 78 98 Martensite Start Temperature (oC) 52 72 Martensite Finish Temperature (oC) 42 62 Annealing temperature (oC) 300 300 Melting Point (oC) 1300 1300
Material
Density (g/cc) 6.45 Maximum Recovery Force (MPa) 600 Recommended deformation force (MPa) 35
Breaking Strength (MPa) 1000
Phase related
0.33 Parameter Martensite Austenite
28 85 Thermal conductivity (W/cm0 C) 0.08 0.18 Resistivity 76 82
5.3 DETERMINATION OF PROPERITIES OF SMA
In lieu considerations of the dynamics of SMA, the Y
of SMA (ESMA) is obtained accordingly as Equation 5.1. (Tanaka KA 1986,
Baz et al 2000)
(5.1)
where EA =Y
EM = Y
58
The elastic modulus of the composite lamina can be calculated by the
rule of mixtures given in Equation 5.2
(5.2)
where EC,ESMA and VSMA are the elastic modulus of smart beam, elastic modulus
of SMA wire and the volume fraction of the SMA respectively.
Also, based on the concept of classical composite-beam theory, the
equivalent bending stiffness of the smart beam can be easily approximated.
Moreover, the stiffness of a composite beam and attached discrete SMA fibers
can be given by the rule of mixtures.
According to the classical composite-beam theory the equivalent
bending stiffness EI for smart beam with SMA wires can be obtained. They are
given as Equations 5.3 and 5.4.
` (5.3)
(5.4)
In which b and h are the width and thickness of a beam, respectively. D is the
diameter of SMA wires; EC is the elastic modulus of GFRP beam and ES is the
elastic modulus of a lamina composed of a GFRP attached to SMA fibers.
The variation in Y
temperature from martensite to austenite is shown in Figure 5.2.
59
Figure 5.2 change in temperature
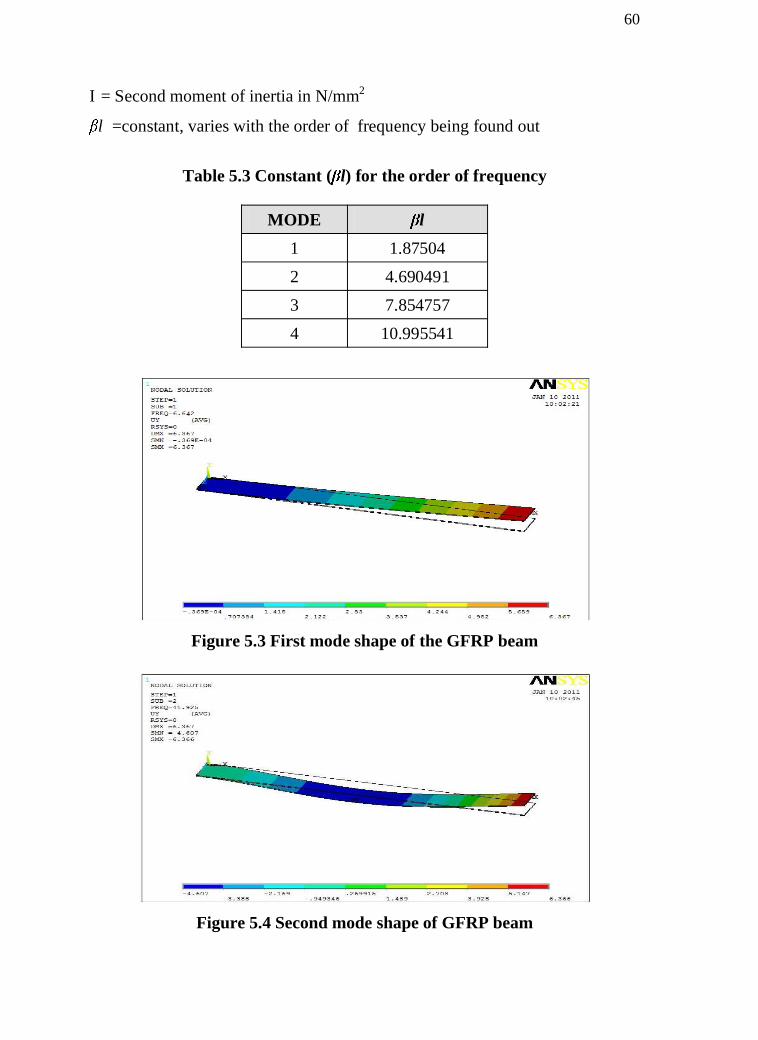
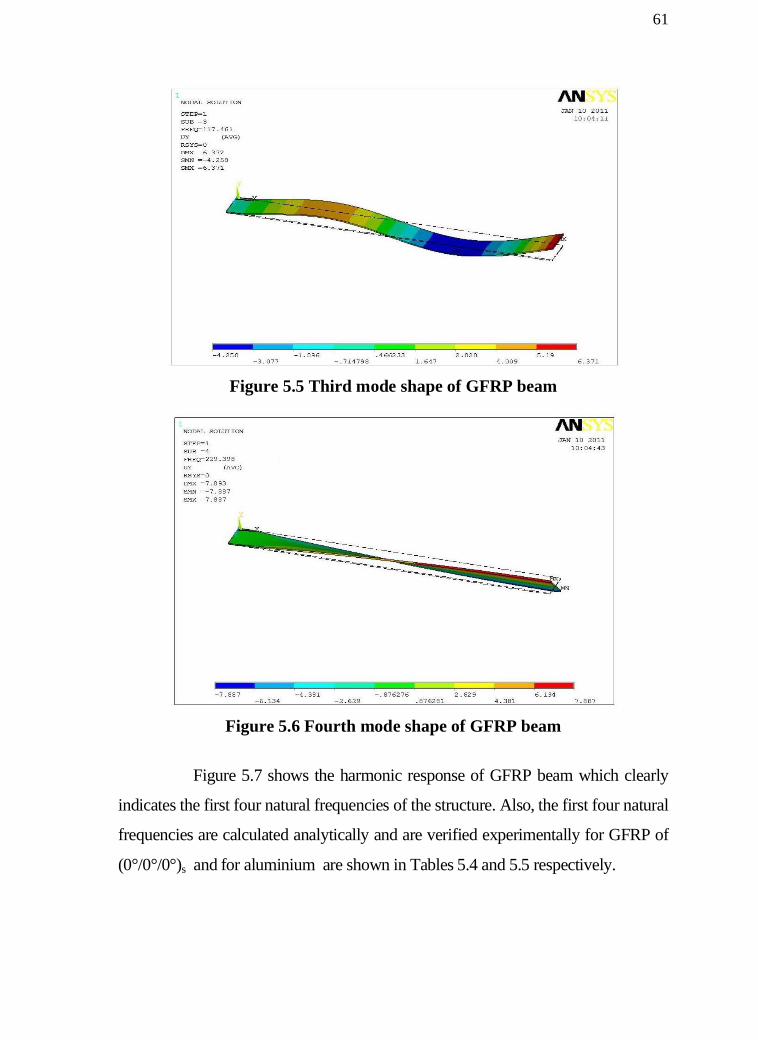
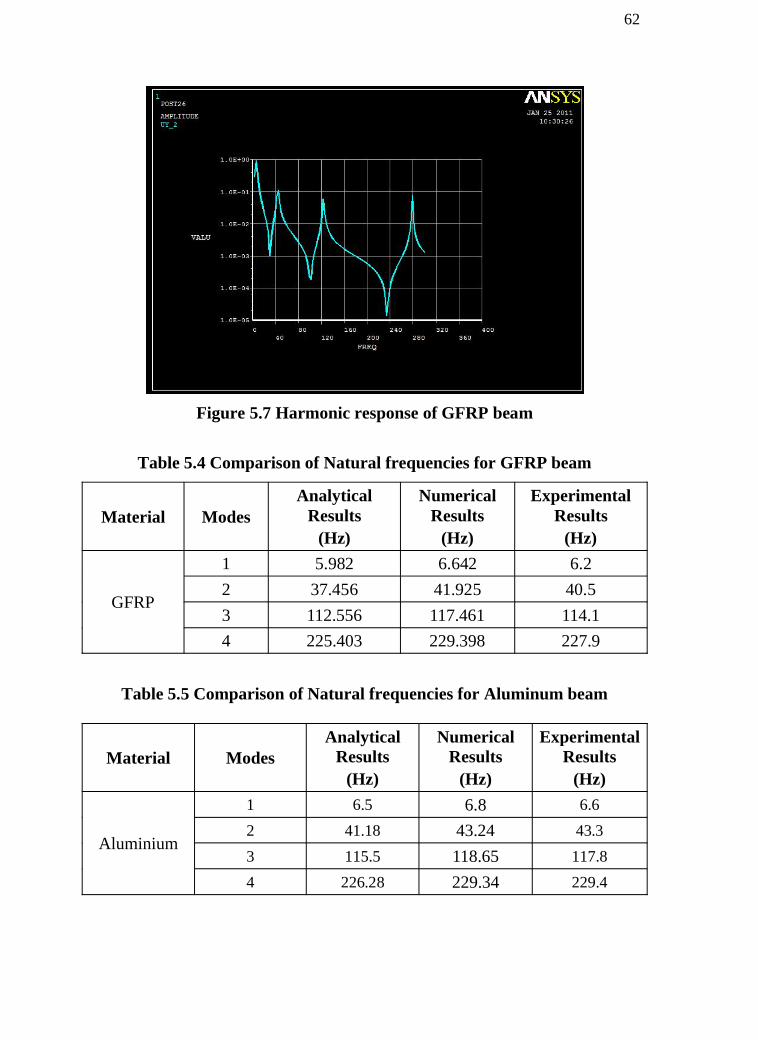
5.4 ANALYSIS OF VIBRATION ON BEAMS
For any system subjected to mechanical vibrations, natural frequency
plays an important role. The system will never be operated near the natural
frequency range as the amplitude of vibrations will be the maximum.
Henceforth, natural frequencies of the system need to be determined before
any vibration study experiment. In this current study, the first four natural
frequencies of GFRP composite structure and aluminium beams are calculated by
using the Equation 5.5 (Rao SS, 2002) and are verified numerically by using
ANSYS. The first four mode shapes and their corresponding natural frequencies
are shown in Figures 5.3 to 5.6. The values of l for the first four modes are
shown in Table 5.3. The properties of GFRP and aluminium structures are
presented in the previous chapter.
(5.5)
where,
n = natural frequency of a cantilever beam in rad/sec.
E = the Y 2
010
20
30
4050
60
70
8090
0 10 20 30 40 50 60 70 80 90
You
ng's
mod
ulus
(GPa
)
Temperature ( 0C)
60
I = Second moment of inertia in N/mm2
l =constant, varies with the order of frequency being found out
Table 5.3 Constant ( l) for the order of frequency
MODE l 1 1.87504
2 4.690491
3 7.854757
4 10.995541
Figure 5.3 First mode shape of the GFRP beam
Figure 5.4 Second mode shape of GFRP beam
61
Figure 5.5 Third mode shape of GFRP beam
Figure 5.6 Fourth mode shape of GFRP beam
Figure 5.7 shows the harmonic response of GFRP beam which clearly
indicates the first four natural frequencies of the structure. Also, the first four natural
frequencies are calculated analytically and are verified experimentally for GFRP of
(0°/0°/0°)s and for aluminium are shown in Tables 5.4 and 5.5 respectively.
62
Figure 5.7 Harmonic response of GFRP beam
Table 5.4 Comparison of Natural frequencies for GFRP beam
Material Modes Analytical
Results (Hz)
Numerical Results
(Hz)
Experimental Results
(Hz)
GFRP
1 5.982 6.642 6.2 2 37.456 41.925 40.5 3 112.556 117.461 114.1 4 225.403 229.398 227.9
Table 5.5 Comparison of Natural frequencies for Aluminum beam
Material Modes Analytical
Results (Hz)
Numerical Results
(Hz)
Experimental Results
(Hz)
Aluminium
1 6.5 6.8 6.6 2 41.18 43.24 43.3 3 115.5 118.65 117.8 4 226.28 229.34 229.4
63
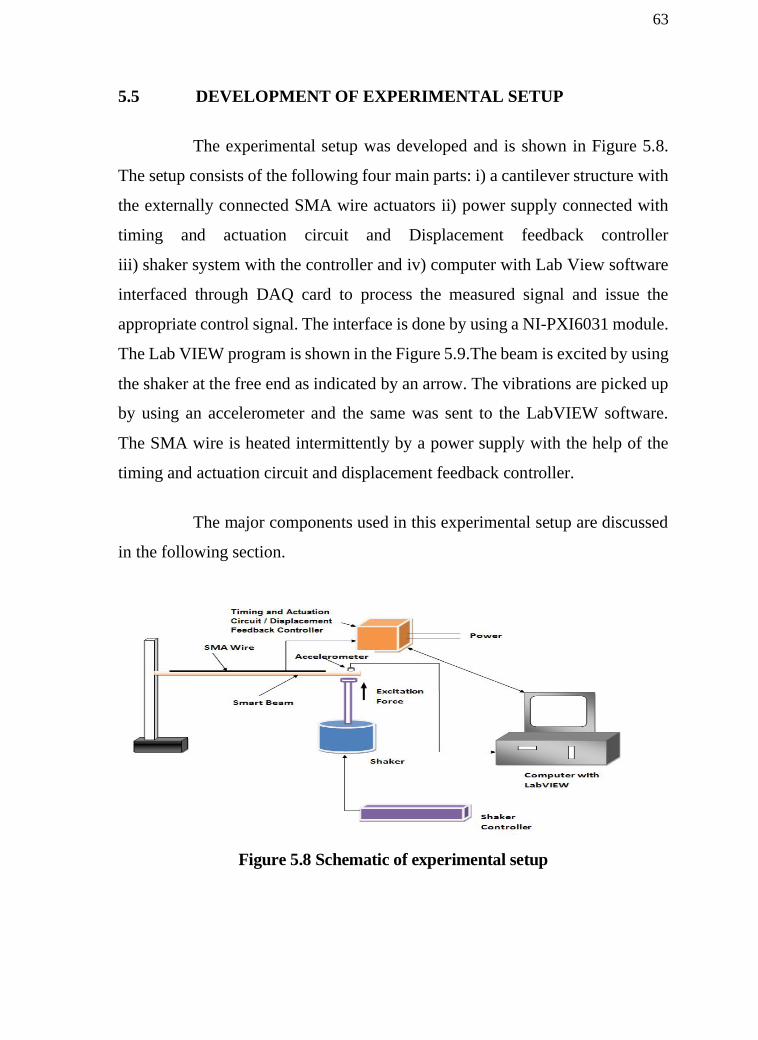
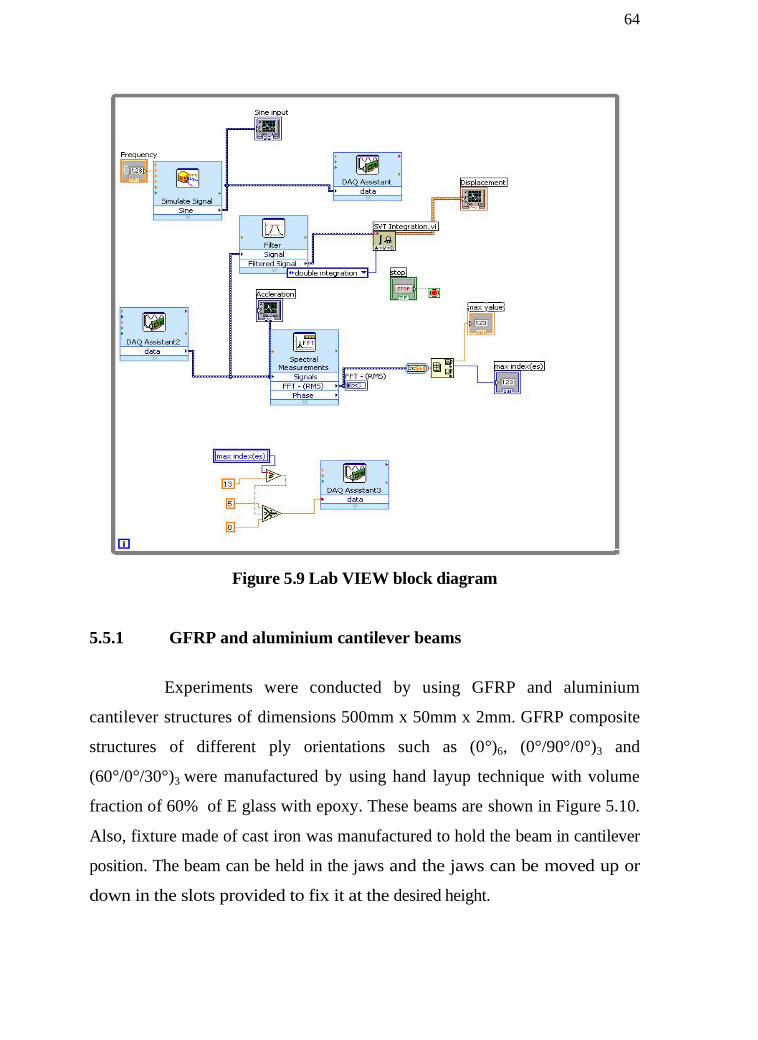
5.5 DEVELOPMENT OF EXPERIMENTAL SETUP
The experimental setup was developed and is shown in Figure 5.8.
The setup consists of the following four main parts: i) a cantilever structure with
the externally connected SMA wire actuators ii) power supply connected with
timing and actuation circuit and Displacement feedback controller
iii) shaker system with the controller and iv) computer with Lab View software
interfaced through DAQ card to process the measured signal and issue the
appropriate control signal. The interface is done by using a NI-PXI6031 module.
The Lab VIEW program is shown in the Figure 5.9.The beam is excited by using
the shaker at the free end as indicated by an arrow. The vibrations are picked up
by using an accelerometer and the same was sent to the LabVIEW software.
The SMA wire is heated intermittently by a power supply with the help of the
timing and actuation circuit and displacement feedback controller.
The major components used in this experimental setup are discussed
in the following section.
Figure 5.8 Schematic of experimental setup
64
Figure 5.9 Lab VIEW block diagram
5.5.1 GFRP and aluminium cantilever beams
Experiments were conducted by using GFRP and aluminium
cantilever structures of dimensions 500mm x 50mm x 2mm. GFRP composite
structures of different ply orientations such as (0°)6, (0°/90°/0°)3 and
(60°/0°/30°)3 were manufactured by using hand layup technique with volume
fraction of 60% of E glass with epoxy. These beams are shown in Figure 5.10.
Also, fixture made of cast iron was manufactured to hold the beam in cantilever
position. The beam can be held in the jaws and the jaws can be moved up or
down in the slots provided to fix it at the desired height.

65
Figure 5.10 Composite and aluminium beams
5.5.2 Accelerometer
An accelerometer pickup used in this experimental work for
sensing the vibrations induced at the free end of the structure is shown in
Figure 5.11. Specifications of the accelerometer used for this study are shown in
Table 5.6.
Figure 5.11 Accelerometer
Table 5.6 Specifications of the accelerometer
Model number 3097A2
Manufacturer Dytran Instruments Inc
Sensitivity 96.72 mV/g
66
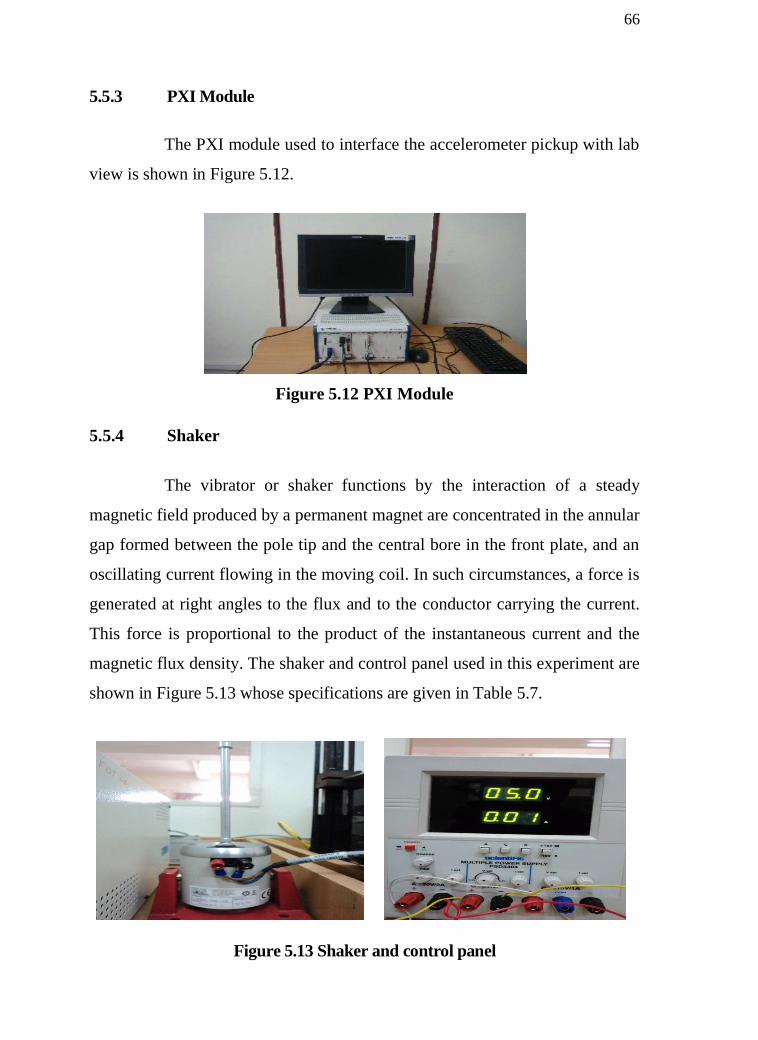
5.5.3 PXI Module
The PXI module used to interface the accelerometer pickup with lab
view is shown in Figure 5.12.
Figure 5.12 PXI Module
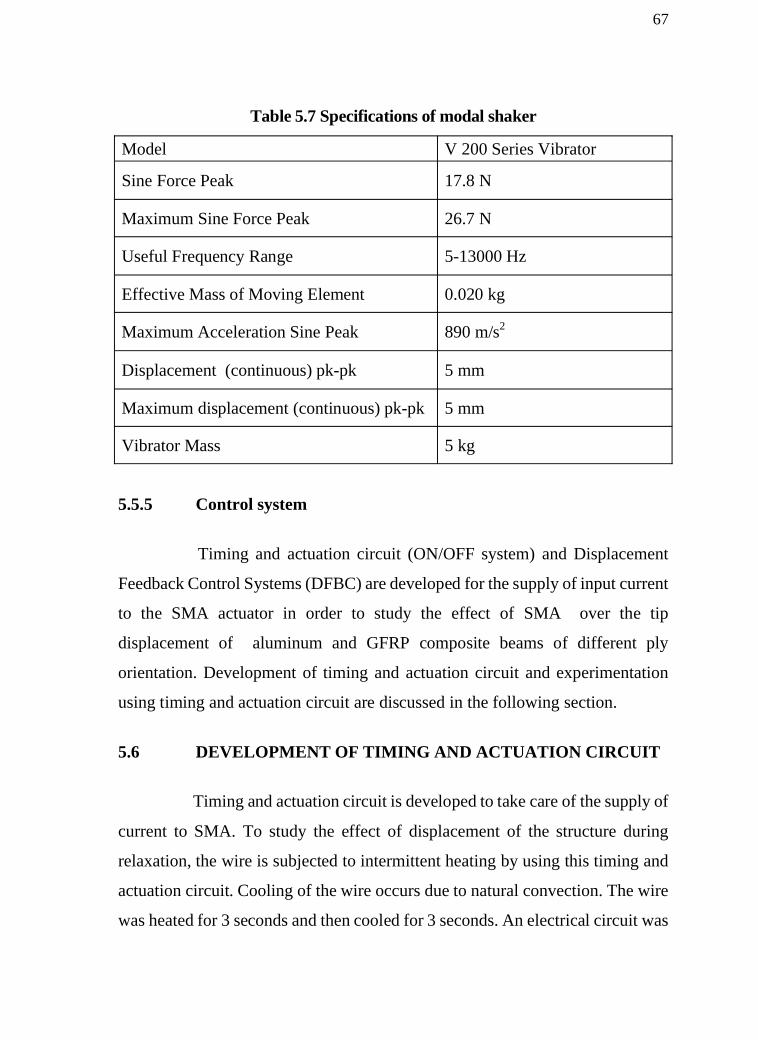
5.5.4 Shaker
The vibrator or shaker functions by the interaction of a steady
magnetic field produced by a permanent magnet are concentrated in the annular
gap formed between the pole tip and the central bore in the front plate, and an
oscillating current flowing in the moving coil. In such circumstances, a force is
generated at right angles to the flux and to the conductor carrying the current.
This force is proportional to the product of the instantaneous current and the
magnetic flux density. The shaker and control panel used in this experiment are
shown in Figure 5.13 whose specifications are given in Table 5.7.
Figure 5.13 Shaker and control panel
67
Table 5.7 Specifications of modal shaker
Model V 200 Series Vibrator
Sine Force Peak 17.8 N
Maximum Sine Force Peak 26.7 N
Useful Frequency Range 5-13000 Hz
Effective Mass of Moving Element 0.020 kg
Maximum Acceleration Sine Peak 890 m/s2
Displacement (continuous) pk-pk 5 mm
Maximum displacement (continuous) pk-pk 5 mm
Vibrator Mass 5 kg
5.5.5 Control system
Timing and actuation circuit (ON/OFF system) and Displacement
Feedback Control Systems (DFBC) are developed for the supply of input current
to the SMA actuator in order to study the effect of SMA over the tip
displacement of aluminum and GFRP composite beams of different ply
orientation. Development of timing and actuation circuit and experimentation
using timing and actuation circuit are discussed in the following section.
5.6 DEVELOPMENT OF TIMING AND ACTUATION CIRCUIT
Timing and actuation circuit is developed to take care of the supply of
current to SMA. To study the effect of displacement of the structure during
relaxation, the wire is subjected to intermittent heating by using this timing and
actuation circuit. Cooling of the wire occurs due to natural convection. The wire
was heated for 3 seconds and then cooled for 3 seconds. An electrical circuit was
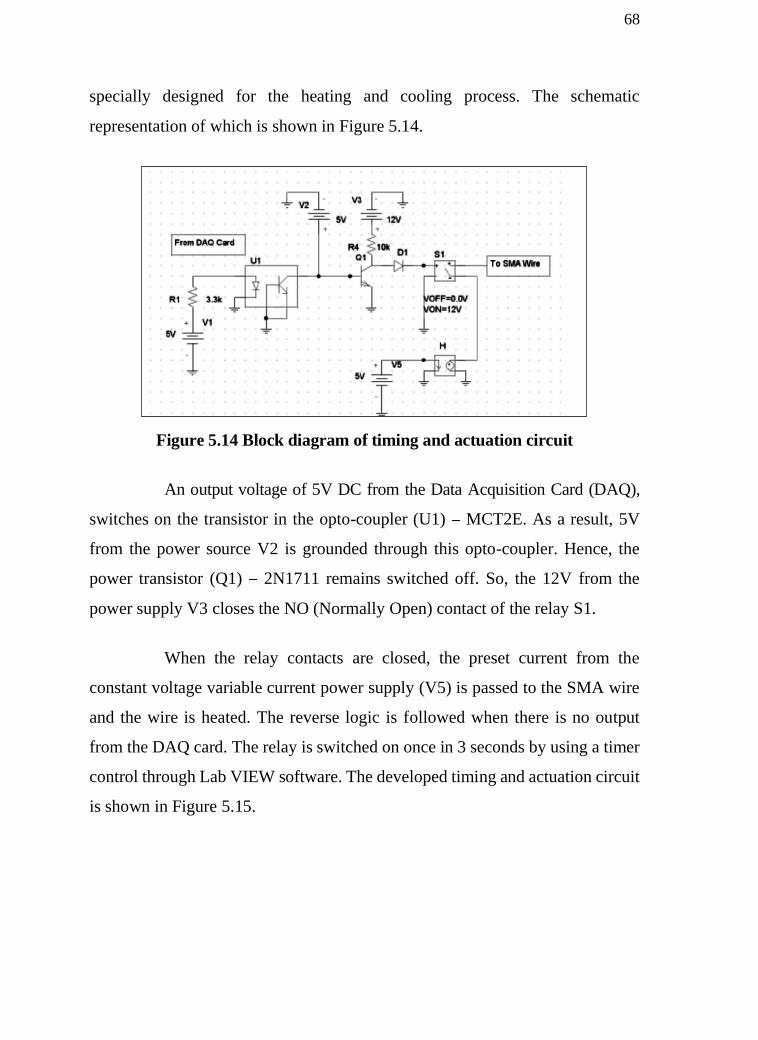
68
specially designed for the heating and cooling process. The schematic
representation of which is shown in Figure 5.14.
Figure 5.14 Block diagram of timing and actuation circuit
An output voltage of 5V DC from the Data Acquisition Card (DAQ),
switches on the transistor in the opto-coupler (U1) MCT2E. As a result, 5V
from the power source V2 is grounded through this opto-coupler. Hence, the
power transistor (Q1) 2N1711 remains switched off. So, the 12V from the
power supply V3 closes the NO (Normally Open) contact of the relay S1.
When the relay contacts are closed, the preset current from the
constant voltage variable current power supply (V5) is passed to the SMA wire
and the wire is heated. The reverse logic is followed when there is no output
from the DAQ card. The relay is switched on once in 3 seconds by using a timer
control through Lab VIEW software. The developed timing and actuation circuit
is shown in Figure 5.15.
69
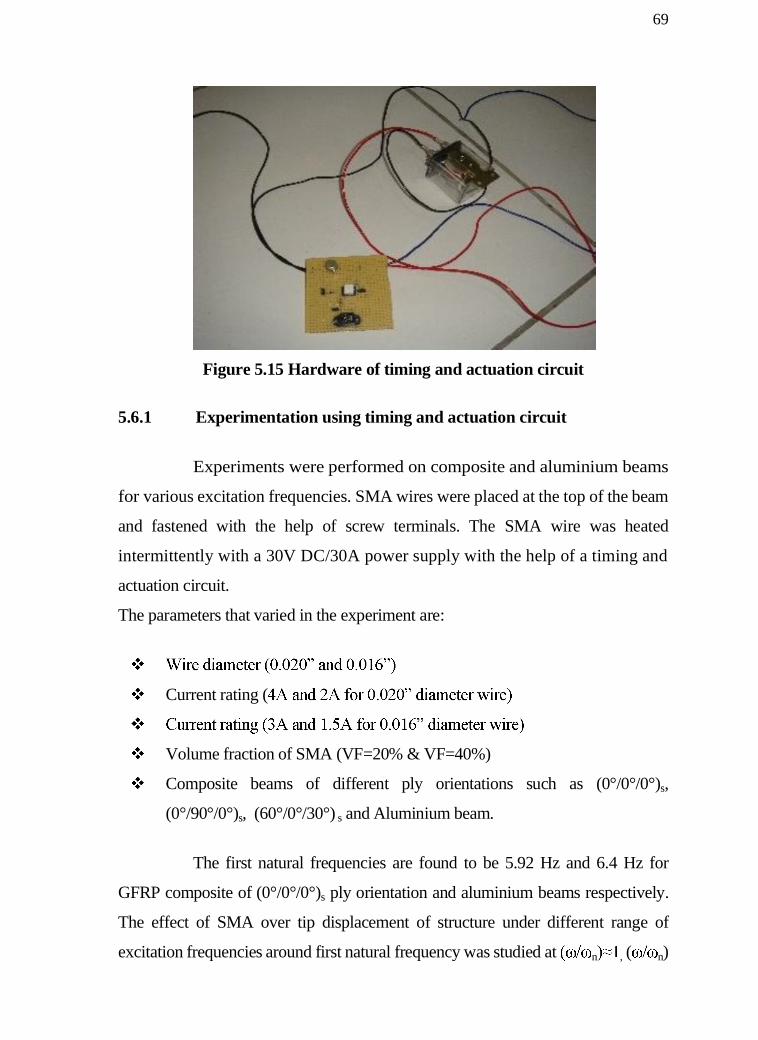
Figure 5.15 Hardware of timing and actuation circuit
5.6.1 Experimentation using timing and actuation circuit
Experiments were performed on composite and aluminium beams
for various excitation frequencies. SMA wires were placed at the top of the beam
and fastened with the help of screw terminals. The SMA wire was heated
intermittently with a 30V DC/30A power supply with the help of a timing and
actuation circuit.
The parameters that varied in the experiment are:
Current rating (
Volume fraction of SMA (VF=20% & VF=40%)
Composite beams of different ply orientations such as (0°/0°/0°)s,
(0°/90°/0°)s, (60°/0°/30°) s and Aluminium beam.
The first natural frequencies are found to be 5.92 Hz and 6.4 Hz for
GFRP composite of (0°/0°/0°)s ply orientation and aluminium beams respectively.
The effect of SMA over tip displacement of structure under different range of
excitation frequencies around first natural frequency was studied at n , ( n)

70
n)>>1. According to the first natural frequency, to satisfy the above
range of excitation frequencies, the structures are excited at 6 Hz, 4 Hz, 2 Hz and
8Hz .
For 20% and 40% volume fraction of SMA, numbers of wires are
calculated by using the density of SMA, density of GFRP and aluminium, cross
sectional area of the wire and cantilever structure, and length of the wire and
cantilever structure. Initially, the structure with different volume fractions of SMA is
excited in the first mode, in order to, find out the deviation in first natural frequency
with respect to variation in temperature. The density values of the GFRP and
aluminium beams are much lesser when compared to the density of the SMA
actuator. Therefore, the natural frequencies of the GFRP with SMA actuator
beams are decreased initially due to an increase in the overall density of the
beams.
However, this phenomenon can be changed by changing the stiffness
of the SMA. The deviation in system natural frequency with respect to variation
in temperature is found theoretically and also experimentally for the (0°/0°/0°)s
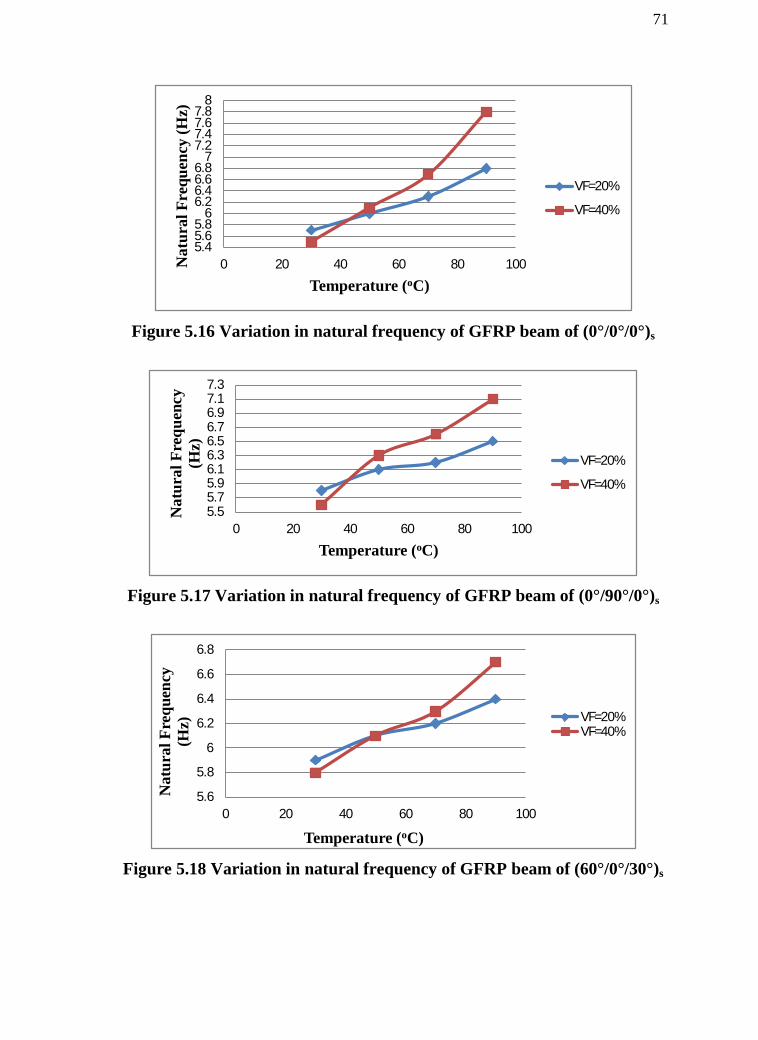
orientation of GFRP, as presented in Figure 5.16. For the other orientations
(0°/90°/0°)s and (60°/0°/30°)s, the deviation in natural frequency for the different
volume fractions were found experimentally with the help of accelerometer and
non contact temperature sensor as shown in Figures 5.17 & 5.18.
From these figures, it can be inferred that an increase in volume
fraction of SMA from 20% to 40% deviates the system natural frequency more
in both sides of natural frequency. The permitted deviation in natural frequency
is comparatively less in the case of SMA wires attached with aluminium
structure, as shown in Figure 5.19.
71
Figure 5.16 Variation in natural frequency of GFRP beam of (0°/0°/0°)s
Figure 5.17 Variation in natural frequency of GFRP beam of (0°/90°/0°)s
Figure 5.18 Variation in natural frequency of GFRP beam of (60°/0°/30°)s
5.45.65.8
66.26.46.66.8
77.27.47.67.8
8
0 20 40 60 80 100Nat
ural
Fre
quen
cy (H
z)
Temperature (oC)
VF=20%
VF=40%
5.55.75.96.16.36.56.76.97.17.3
0 20 40 60 80 100
Nat
ural
Fre
quen
cy
(Hz)
Temperature (oC)
VF=20%
VF=40%
5.6
5.8
6
6.2
6.4
6.6
6.8
0 20 40 60 80 100
Nat
ural
Fre
quen
cy
(Hz)
Temperature (oC)
VF=20%VF=40%

72
Figure 5.19 Variation in natural frequency of aluminium beam
5.6.2 Tip displacement of GFRP beam
Experimental results for different ply orientations of GFRP
composite structures are discussed in this section.
Figures 5.20 & 5.21 show the tip displacement plots of (0°/0°/0°)s
GFRP. It can be inferred that the input current to the SMA wire increases the
force generated by the SMA more, therefore, the tip displacement of the GFRP
cantilever decreases.
Figure 5.20 Displacement plot of (0°/0°/0°)s GFRP beam for excitation
frequency of 2Hz with 40% volume of
2A current rating
5.96
6.16.26.36.46.56.66.76.8
0 20 40 60 80 100
Nat
ural
Fre
quen
cy (H
z)
Temperature (oC)
VF=20%VF=40%
73
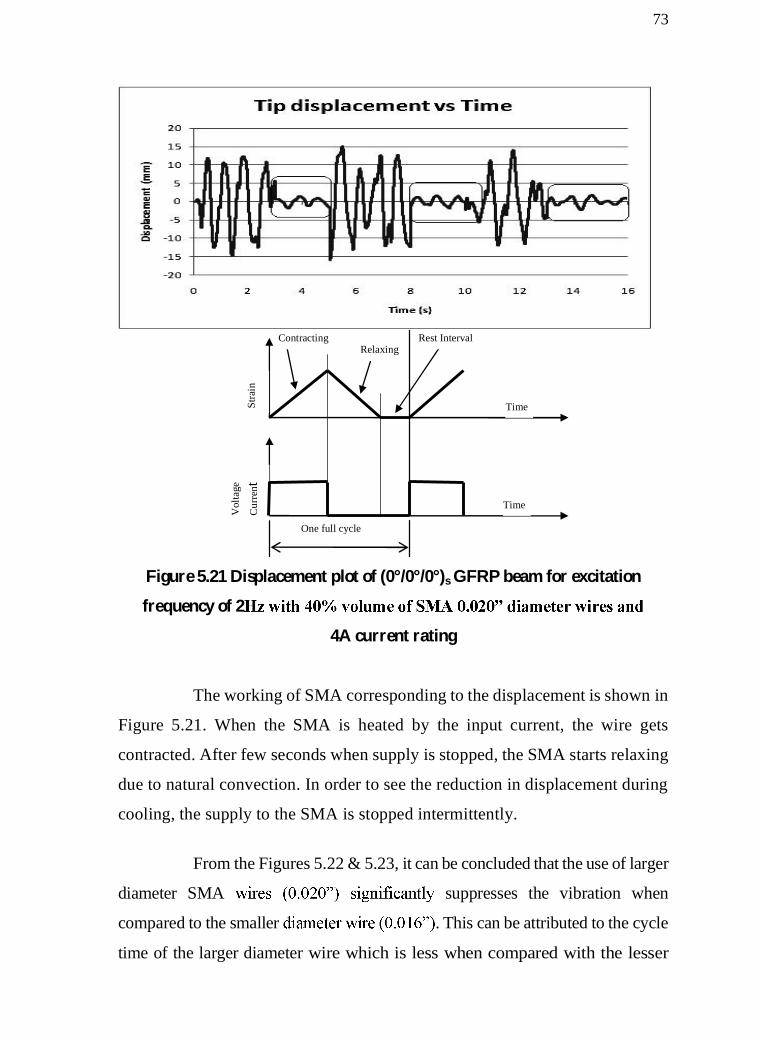
Figure 5.21 Displacement plot of (0°/0°/0°)s GFRP beam for excitation
frequency of 2
4A current rating
The working of SMA corresponding to the displacement is shown in
Figure 5.21. When the SMA is heated by the input current, the wire gets
contracted. After few seconds when supply is stopped, the SMA starts relaxing
due to natural convection. In order to see the reduction in displacement during
cooling, the supply to the SMA is stopped intermittently.
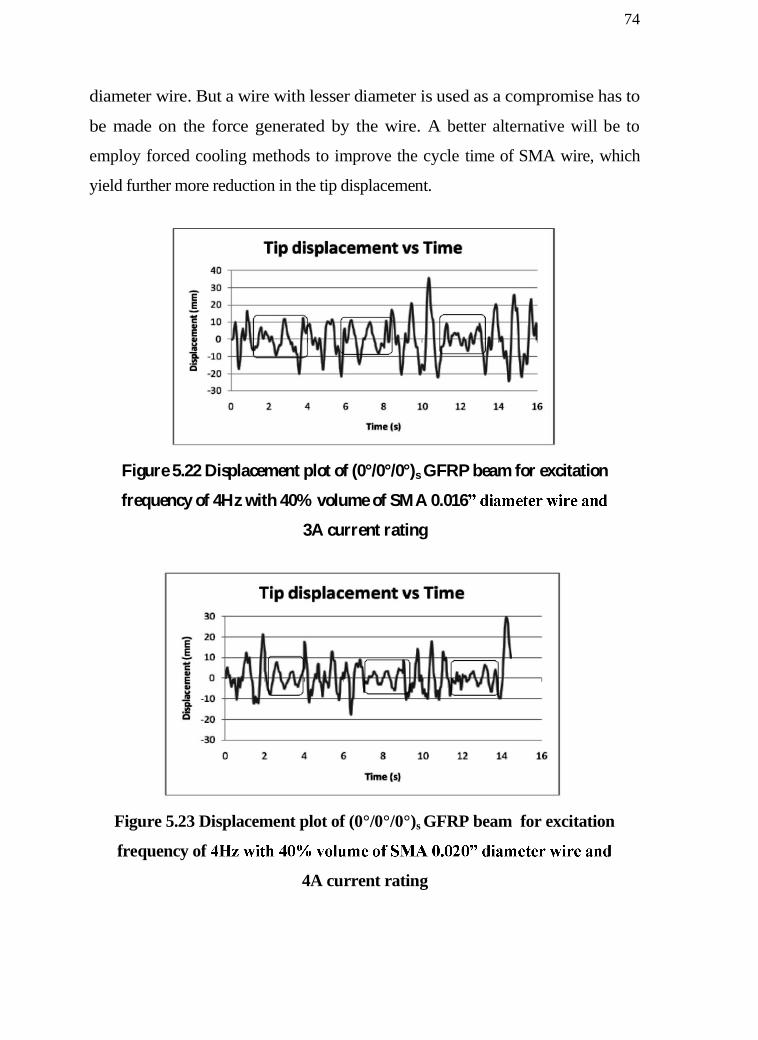
From the Figures 5.22 & 5.23, it can be concluded that the use of larger
diameter SMA suppresses the vibration when
compared to the smaller . This can be attributed to the cycle
time of the larger diameter wire which is less when compared with the lesser
One full cycle
Vol
tage
Cur
rent
Stra
in
Contracting Relaxing
Rest Interval
Time
Time
74
diameter wire. But a wire with lesser diameter is used as a compromise has to
be made on the force generated by the wire. A better alternative will be to
employ forced cooling methods to improve the cycle time of SMA wire, which
yield further more reduction in the tip displacement.
Figure 5.22 Displacement plot of (0°/0°/0°)s GFRP beam for excitation
frequency of 4Hz with 40% volume of SMA 0.016
3A current rating
Figure 5.23 Displacement plot of (0°/0°/0°)s
GFRP beam for excitation
frequency of
4A current rating
75
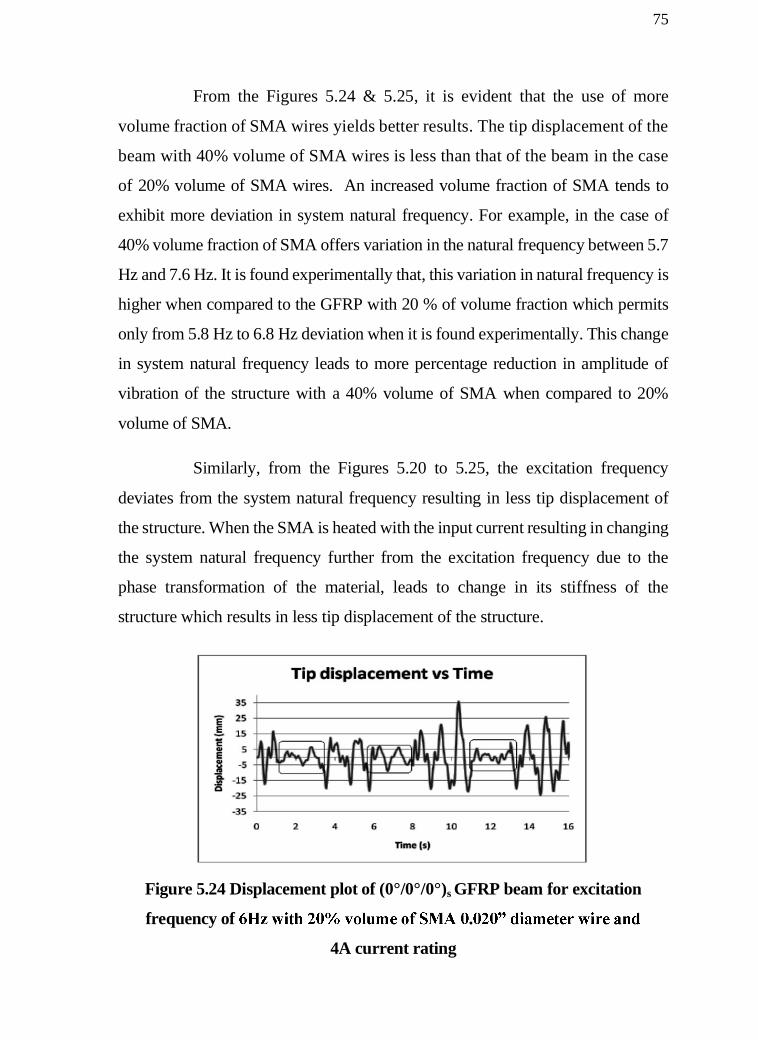
From the Figures 5.24 & 5.25, it is evident that the use of more
volume fraction of SMA wires yields better results. The tip displacement of the
beam with 40% volume of SMA wires is less than that of the beam in the case
of 20% volume of SMA wires. An increased volume fraction of SMA tends to
exhibit more deviation in system natural frequency. For example, in the case of
40% volume fraction of SMA offers variation in the natural frequency between 5.7
Hz and 7.6 Hz. It is found experimentally that, this variation in natural frequency is
higher when compared to the GFRP with 20 % of volume fraction which permits
only from 5.8 Hz to 6.8 Hz deviation when it is found experimentally. This change
in system natural frequency leads to more percentage reduction in amplitude of
vibration of the structure with a 40% volume of SMA when compared to 20%
volume of SMA. Similarly, from the Figures 5.20 to 5.25, the excitation frequency
deviates from the system natural frequency resulting in less tip displacement of
the structure. When the SMA is heated with the input current resulting in changing
the system natural frequency further from the excitation frequency due to the
phase transformation of the material, leads to change in its stiffness of the
structure which results in less tip displacement of the structure.
Figure 5.24 Displacement plot of (0°/0°/0°)s
GFRP beam for excitation
frequency of
4A current rating

76
Figure 5.25 Displacement plot of (0°/0°/0°)s
GFRP beam for excitation
frequency of 6
4A current rating
In this study, the first natural frequency of GFRP structure is 5.92 Hz.
When the structure is excited at the frequency of 6 Hz (approximately equal to the
natural frequency), the amplitude of vibration of the structure becomes excessive.
The structure is embedded with SMA resulting in a slight decrease in
natural frequency. Initially at martensite phase due to an internal compressive stress
induced by the thermal expansion of SMA materials. This results in a small reduction
in its amplitude. Later, when SMA is subjected to heating, it starts deviating from the
system natural frequency and increases to a higher value. This is because of the
increase in resulting in a stiffer beam.
Also, a further deviation in natural frequency was permitted by increasing the volume
of SMA, as discussed in the previous section. Hence, more percentage reduction in
amplitude of vibration is possible, when the structure is excited at 6 Hz when
compared to the other excitation frequencies of 4 Hz and 2 Hz.
77
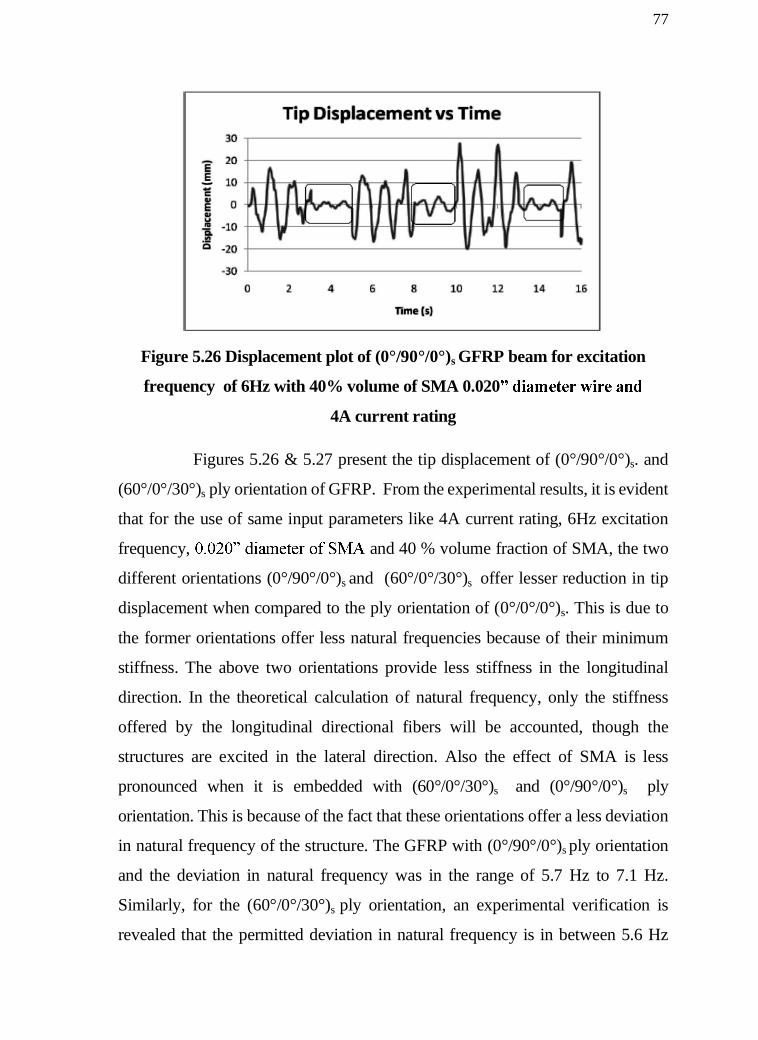
Figure 5.26 Displacement plot of (0°/90°/0°)s
GFRP beam for excitation
frequency of 6Hz with 40% volume of SMA 0.020
4A current rating
Figures 5.26 & 5.27 present the tip displacement of (0°/90°/0°)s. and
(60°/0°/30°)s ply orientation of GFRP. From the experimental results, it is evident
that for the use of same input parameters like 4A current rating, 6Hz excitation
frequency, and 40 % volume fraction of SMA, the two
different orientations (0°/90°/0°)s and (60°/0°/30°)s offer lesser reduction in tip
displacement when compared to the ply orientation of (0°/0°/0°)s. This is due to
the former orientations offer less natural frequencies because of their minimum
stiffness. The above two orientations provide less stiffness in the longitudinal
direction. In the theoretical calculation of natural frequency, only the stiffness
offered by the longitudinal directional fibers will be accounted, though the
structures are excited in the lateral direction. Also the effect of SMA is less
pronounced when it is embedded with (60°/0°/30°)s and (0°/90°/0°)s ply
orientation. This is because of the fact that these orientations offer a less deviation
in natural frequency of the structure. The GFRP with (0°/90°/0°)s ply orientation
and the deviation in natural frequency was in the range of 5.7 Hz to 7.1 Hz.
Similarly, for the (60°/0°/30°)s ply orientation, an experimental verification is
revealed that the permitted deviation in natural frequency is in between 5.6 Hz
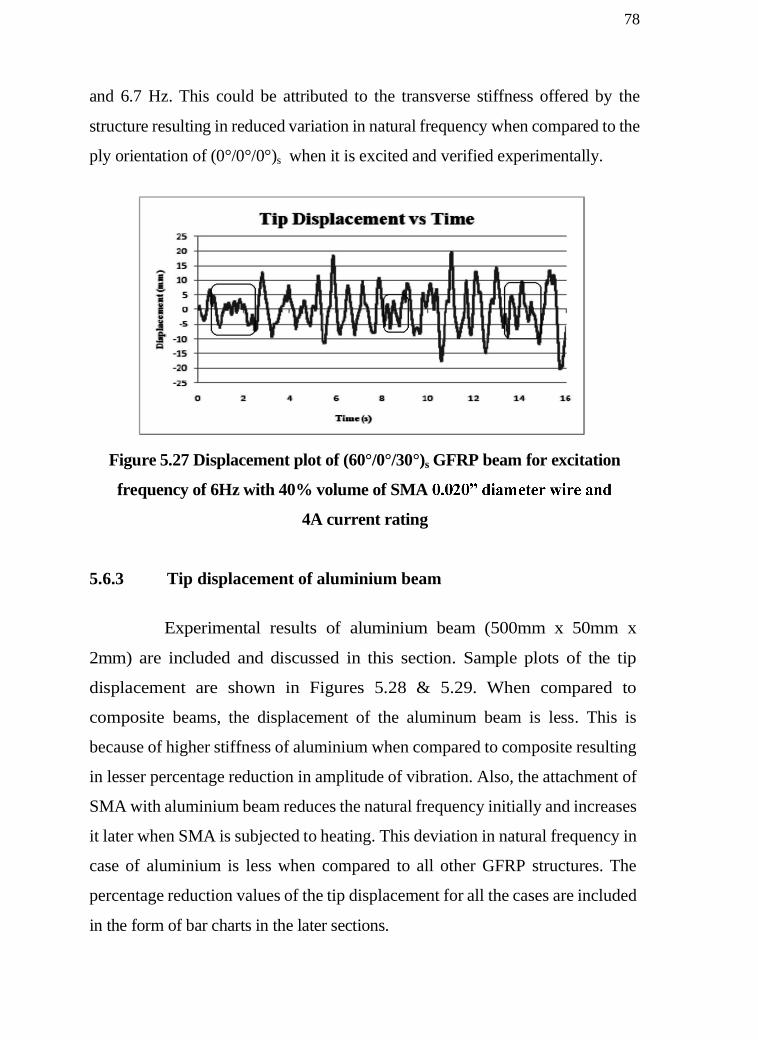
78
and 6.7 Hz. This could be attributed to the transverse stiffness offered by the
structure resulting in reduced variation in natural frequency when compared to the
ply orientation of (0°/0°/0°)s when it is excited and verified experimentally.
Figure 5.27 Displacement plot of (60°/0°/30°)s GFRP beam for excitation
frequency of 6Hz with 40% volume of SMA
4A current rating
5.6.3 Tip displacement of aluminium beam
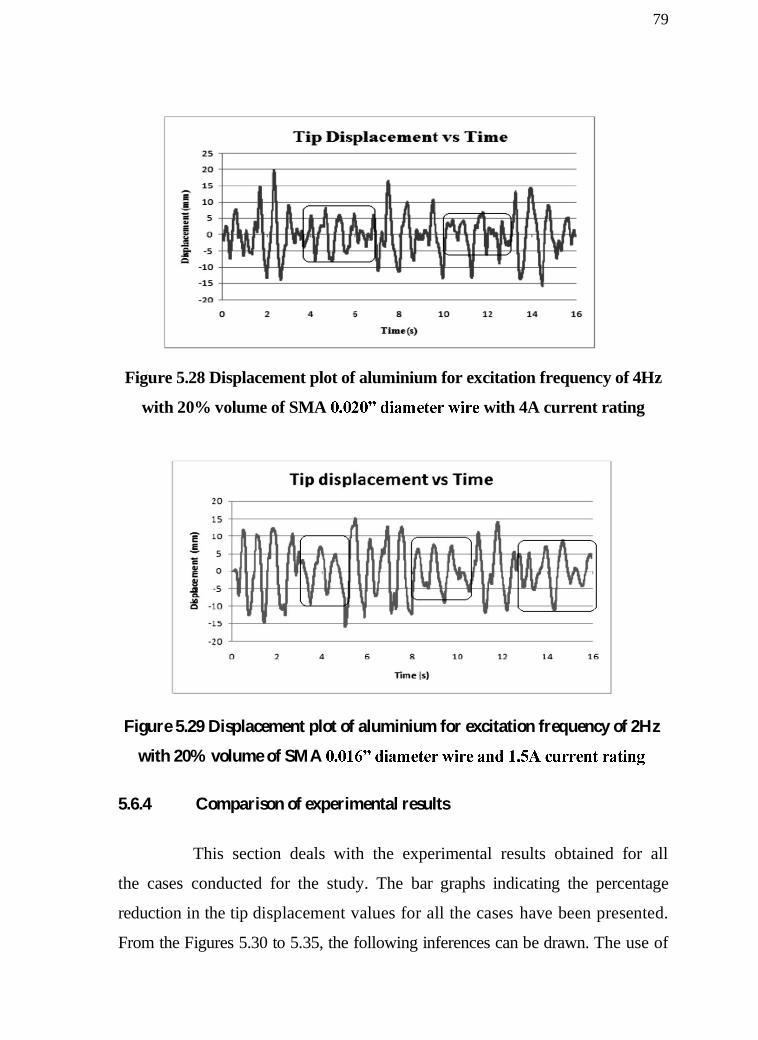
Experimental results of aluminium beam (500mm x 50mm x
2mm) are included and discussed in this section. Sample plots of the tip
displacement are shown in Figures 5.28 & 5.29. When compared to
composite beams, the displacement of the aluminum beam is less. This is
because of higher stiffness of aluminium when compared to composite resulting
in lesser percentage reduction in amplitude of vibration. Also, the attachment of
SMA with aluminium beam reduces the natural frequency initially and increases
it later when SMA is subjected to heating. This deviation in natural frequency in
case of aluminium is less when compared to all other GFRP structures. The
percentage reduction values of the tip displacement for all the cases are included
in the form of bar charts in the later sections.
79
Figure 5.28 Displacement plot of aluminium for excitation frequency of 4Hz
with 20% volume of SMA with 4A current rating
Figure 5.29 Displacement plot of aluminium for excitation frequency of 2Hz
with 20% volume of SMA 5.6.4 Comparison of experimental results
This section deals with the experimental results obtained for all
the cases conducted for the study. The bar graphs indicating the percentage
reduction in the tip displacement values for all the cases have been presented.
From the Figures 5.30 to 5.35, the following inferences can be drawn. The use of

80
larger diameter (d) seem to suppress the vibration
significantly .This is because
larger diameter generates more force.
The use of more volume fraction of SMA wire has yielded better
results when compared to the less volume fraction. When the SMA wire of
diameter was heated with a current of 2A, a 92% reduction in tip
displacement of the structure was found to be possible with a 40% volume
fraction of SMA for (0°/0°/0°)s ply orientation of GFRP. Similarly, the structure
of same orientation with 20% volume fraction of SMA is capable of yielding
84% reduction in tip displacement when it is excited at 6Hz. This is due to a
better deviation in natural frequency was permitted when the volume fraction of
SMA is 40%.
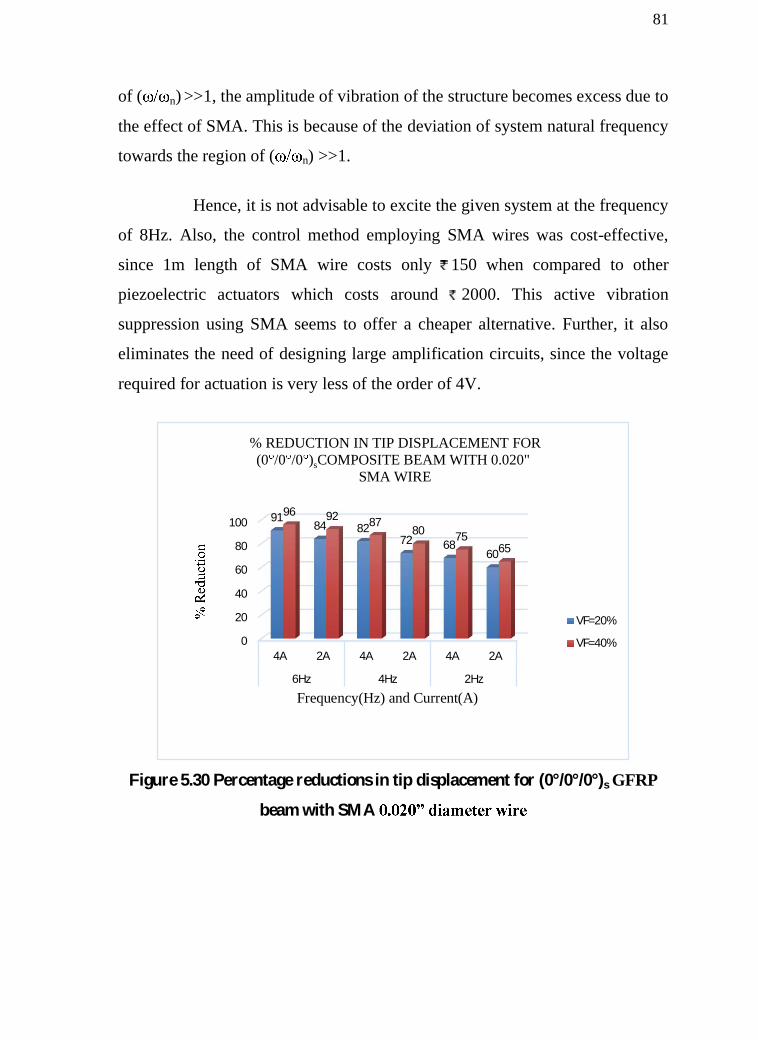
From the Figure 5.30, it is evident that when the structure of
(0°/0°/0°)s ply orientation excited at 6 Hz, the percentage reduction in tip
displacement was observed to be 96% and 92 % with an input current of 4A and
2 A respectively, for the volume fraction of 40% of SMA.
At an excitation frequency of 6 Hz, the percentage reduction in tip
displacement value was found to be the maximum (96%) for the (0°/0°/0°)s
GFRP beam with 40% volume fraction of SMA wires at 4 A
input current rating. The percentage reduction in tip displacement value was
minimum of 38% for the aluminium beam with 20% volume fraction of SMA
wires o at 2 Hz.
The SMA based cantilever structure was excited in the region
( n)<<1, namely, 2 Hz and 4Hz where the amplitude of vibration of the
structure is less. Also, the SMA deviates the system natural frequency further
from excitation. Hence, the effect of SMA was utilized for reducing amplitude of
vibration of structure in this region. Similarly, when it was excited in the region
81
of ( n) >>1, the amplitude of vibration of the structure becomes excess due to
the effect of SMA. This is because of the deviation of system natural frequency
towards the region of ( n) >>1.
Hence, it is not advisable to excite the given system at the frequency
of 8Hz. Also, the control method employing SMA wires was cost-effective,
since 1m length of SMA wire costs only 150 when compared to other
piezoelectric actuators which costs around 2000. This active vibration
suppression using SMA seems to offer a cheaper alternative. Further, it also
eliminates the need of designing large amplification circuits, since the voltage
required for actuation is very less of the order of 4V.
Figure 5.30 Percentage reductions in tip displacement for (0°/0°/0°)s GFRP
beam with SMA
0
20
40
60
80
100
4A 2A 4A 2A 4A 2A
6Hz 4Hz 2Hz
91 84 82
72 68 60
96 92 87 80 75
65
Frequency(Hz) and Current(A)
% REDUCTION IN TIP DISPLACEMENT FOR (0 /0 /0 )sCOMPOSITE BEAM WITH 0.020"
SMA WIRE
VF=20%
VF=40%

82
Figure 5.31 Percentage reductions in tip displacement for (0°/90°/0°)s GFRP
beam with SMA 0.020
Figure 5.32 Percentage reductions in tip displacement for (60°/0°/30°)s GFRP
beam with SMA
0
20
40
60
80
100
4A 2A 4A 2A 4A 2A
6Hz 4Hz 2Hz
82 79 73
63 6252
87 83 80 69 67
56
Frequency(Hz) and Current(A)
% REDUCTION IN TIP DISPLACEMENT FOR (0 /90 /0 )sCOMPOSITE BEAM WITH 0.020"
SMA WIRE
VF=20%
VF=40%
0
20
40
60
80
100
4A 2A 4A 2A 4A 2A
6Hz 4Hz 2Hz
79 77 76 69 64
51
84 80 77 73 69
54
Frequency (Hz) and Current (A)
% REDUCTION IN TIP DISPLACEMENT FOR (60 /0 /30 )s COMPOSITE BEAM WITH 0.020"
SMA WIRE
VF=20%
VF=40%

83
Figure 5.33 Percentage reductions in tip displacement for (60°/0°/30°)s GFRP
beam with SMA
Figure 5.34 Percentage reductions in tip displacement for aluminium beam
with SMA
0102030405060708090
3A 1.5A 3A 1.5A 3A 1.5A
6Hz 4Hz 2Hz
75 71 69 65 59
48
82 76 72 70
63 53
Frequency (Hz) and Current (A)
% REDUCTION IN TIP DISPLACEMENT FOR (60 /0 /30 )sCOMPOSITE BEAM WITH 0.016" SMA
WIRE
VF=20%
VF=40%
0
20
40
60
80
4A 2A 4A 2A 4A 2A
6Hz 4Hz 2Hz
72 69 67 63 61
44
79 75 72
68 66
52
Frequency (Hz) and Current (A)
% REDUCTION IN TIP DISPLACEMENT FOR ALUMINIUM BEAM WITH 0.020" SMA WIRE
VF=20%
VF=40%
84
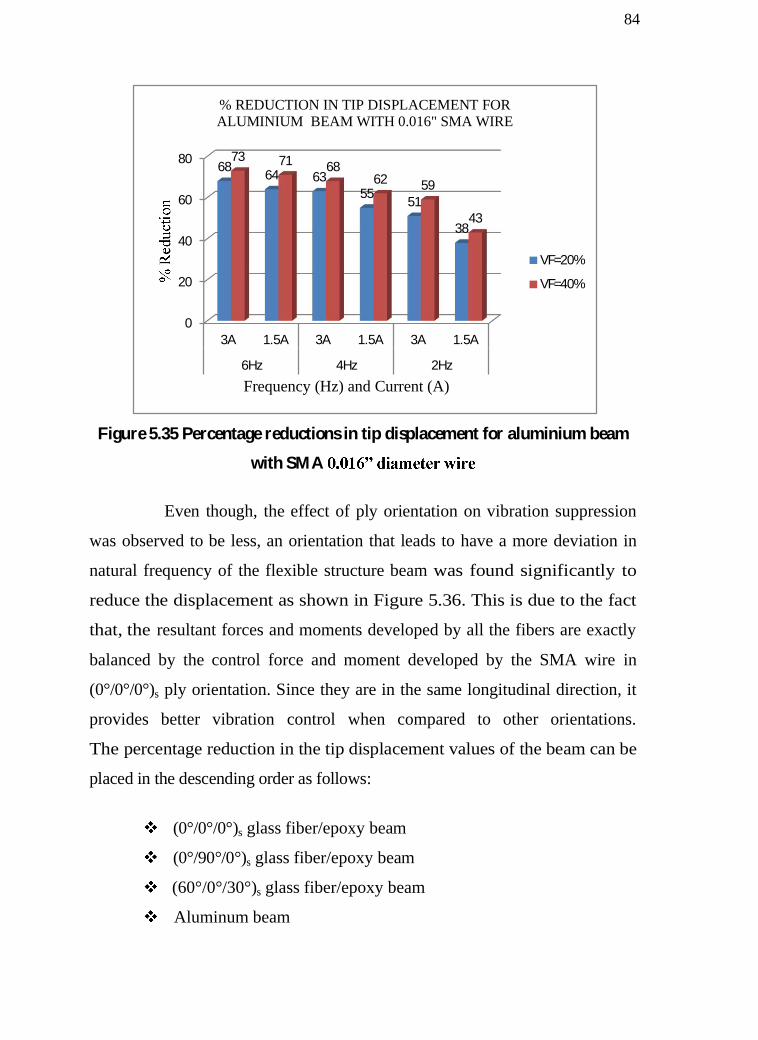
Figure 5.35 Percentage reductions in tip displacement for aluminium beam
with SMA
Even though, the effect of ply orientation on vibration suppression
was observed to be less, an orientation that leads to have a more deviation in
natural frequency of the flexible structure beam was found significantly to
reduce the displacement as shown in Figure 5.36. This is due to the fact
that, the resultant forces and moments developed by all the fibers are exactly
balanced by the control force and moment developed by the SMA wire in
(0°/0°/0°)s ply orientation. Since they are in the same longitudinal direction, it
provides better vibration control when compared to other orientations.
The percentage reduction in the tip displacement values of the beam can be
placed in the descending order as follows:
(0°/0°/0°)s glass fiber/epoxy beam
(0°/90°/0°)s glass fiber/epoxy beam
(60°/0°/30°)s glass fiber/epoxy beam
Aluminum beam
0
20
40
60
80
3A 1.5A 3A 1.5A 3A 1.5A
6Hz 4Hz 2Hz
68 64 63 55 51
38
73 71 68 62 59
43
Frequency (Hz) and Current (A)
% REDUCTION IN TIP DISPLACEMENT FOR ALUMINIUM BEAM WITH 0.016" SMA WIRE
VF=20%
VF=40%
85
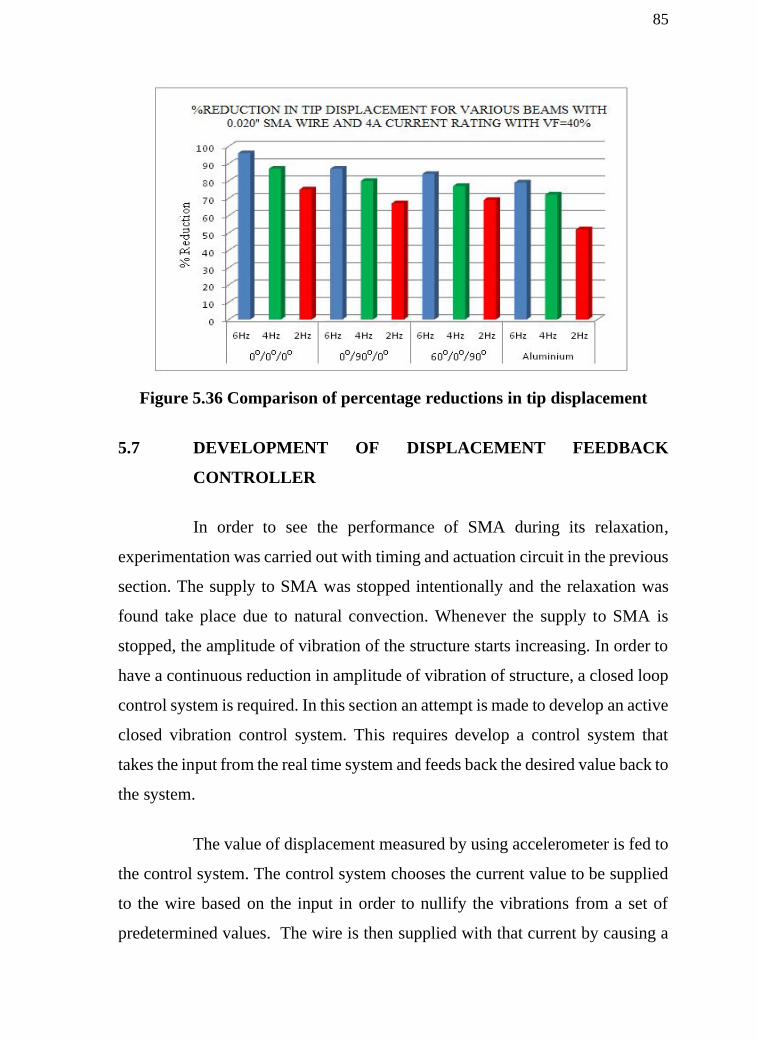
Figure 5.36 Comparison of percentage reductions in tip displacement
5.7 DEVELOPMENT OF DISPLACEMENT FEEDBACK
CONTROLLER
In order to see the performance of SMA during its relaxation,
experimentation was carried out with timing and actuation circuit in the previous
section. The supply to SMA was stopped intentionally and the relaxation was
found take place due to natural convection. Whenever the supply to SMA is
stopped, the amplitude of vibration of the structure starts increasing. In order to
have a continuous reduction in amplitude of vibration of structure, a closed loop
control system is required. In this section an attempt is made to develop an active
closed vibration control system. This requires develop a control system that
takes the input from the real time system and feeds back the desired value back to
the system.
The value of displacement measured by using accelerometer is fed to
the control system. The control system chooses the current value to be supplied
to the wire based on the input in order to nullify the vibrations from a set of
predetermined values. The wire is then supplied with that current by causing a

86
reduction in the amount of tip displacement, which is then again fed back to the
control system by using accelerometer and the action continues.
The power rating of the Constant Current Converter used for this
application is 12V DC. A Microcontroller based closed loop constant current
system will best suit this application. Pulse Width Modulation (PWM) buck dc
converter is described in section 5.7.1.
5.7.1 Theory and design
A PWM buck dc dc converter circuit consists of four components: a
Power Bipolar Junction Transistors is used as a controllable switch S, a diode
D1, an inductor L, and a filter capacitor C. Resistor R, L represents a dc load.
Power Bipolar Junction Transistors are the most commonly used controllable
switches in dc converters because of their high speeds. The diode D1 is called a
freewheeling diode, a flywheel diode, or a catch diode. The switching network is
composed of transistor
educed average voltage.
The switch S is controlled by a pulse-width modulator and is turned on and off at
the switching frequency fs=1/T. The duty cycle D is defined as given in the
Equation 5.6.
(5.6)
ton is the time interval when the switch S is closed and toff is the time
interval when the switch S is open. Since the duty cycle D of the drive voltage
VGS varies, the duty ratio of other waveforms also varies. This permits the
regulation of the dc output voltage against the changes in the dc input voltage Vi
and the load resistance R (or the load current IL). The output voltage Vo of the
buck converter is always lower than the input voltage Vi. Therefore, it is a
87
step-
Because the gate of the Power BJT is not referenced to ground, it is difficult to
drive the transistor. The converter requires a floating gate drive. With the input
current of the converter being discontinuous, a smoothing LC filter is required at
the input. Figure 5.37 shows the block diagram of the control system used in the
experiment.
Figure 5.37 Block diagram of control system
Also, the developed hardware part of the control system is shown in
Figure 5.38.
Figure 5.38 Hardware of Control system
Figure 5.38 Hardware of control circuit
Control Circuit

88
5.7.2 Experimentations on forced vibrations incorporated with DFBC
Similar to the experiments carried out with timing and actuation
circuit, experiments are conducted by using displacement feedback controller
with varying excitation frequency, volume fraction of SMA and size of SMA
wire with ply orientation of (0°/0°/0°)s GFRP composite cantilever structure in
order to demonstrate the effect of DFBC over the reduction in tip displacement
when compared to timing and actuation circuit. From the experiments conducted
by using DFBC, it can be inferred that the continuous reduction in tip
displacement is attained as shown in Figure 5.39.
Figure 5.39 Displacement plot of (0°/0°/0°)s GFRP beam for excitation
frequency of 4Hz with DFBC for varying volume of SMA
This is because of the input current to SMA is maintained
continuously in order to reduce the tip displacement, whereas the current to
SMA was stopped in the case of vibration control through timing and actuation
circuit. Also it is evident that a higher volume of SMA tends to have more
reduction in tip displacement of cantilever structure. Similarly, Figure 5.40
shows that a larger diameter SMA tends to reduce more percentage when

89
compared to smaller diameter of SMA wire embedded with the structure excited
in the same frequency of 4Hz.
Figure 5.40 Displacement plot of (0°/0°/0°)s GFRP beam for excitation
frequency of 4Hz with DFBC for varying size of SMA
5.7.3 Experimentations on free vibration with & without DFBC
In order to demonstrate the settling time and damping property of the
smart beam with different volume fraction and various input currents, free
vibration test was carried out with and without DFBC. Also, the damping factor
with various volume fraction of SMA was also calculated.
The free vibration test of the GFRP beam with SMA actuators was
conducted. The beam was vibrated freely for preset initial displacement values
of 5, 10, 20 and 30 mm. For each of this displacement values, the settling time
for different input current of 1A, 2A and 4A was obtained. The free vibration
experiments were conducted for both GFRP beam with 20% and 40% volume
fraction of SMA wire. The settling time of the GFRP beam with one SMA
-25
-20
-15
-10
-5
0
5
10
15
20
0 2 4 6 8 10 12 14 16
Dis
plac
emen
t (m
m)
Time (s)
Tip displacement Vs Time 0.020" dia wire, 4Acurrent0.016" dia wire, 1.5Acurrent
90
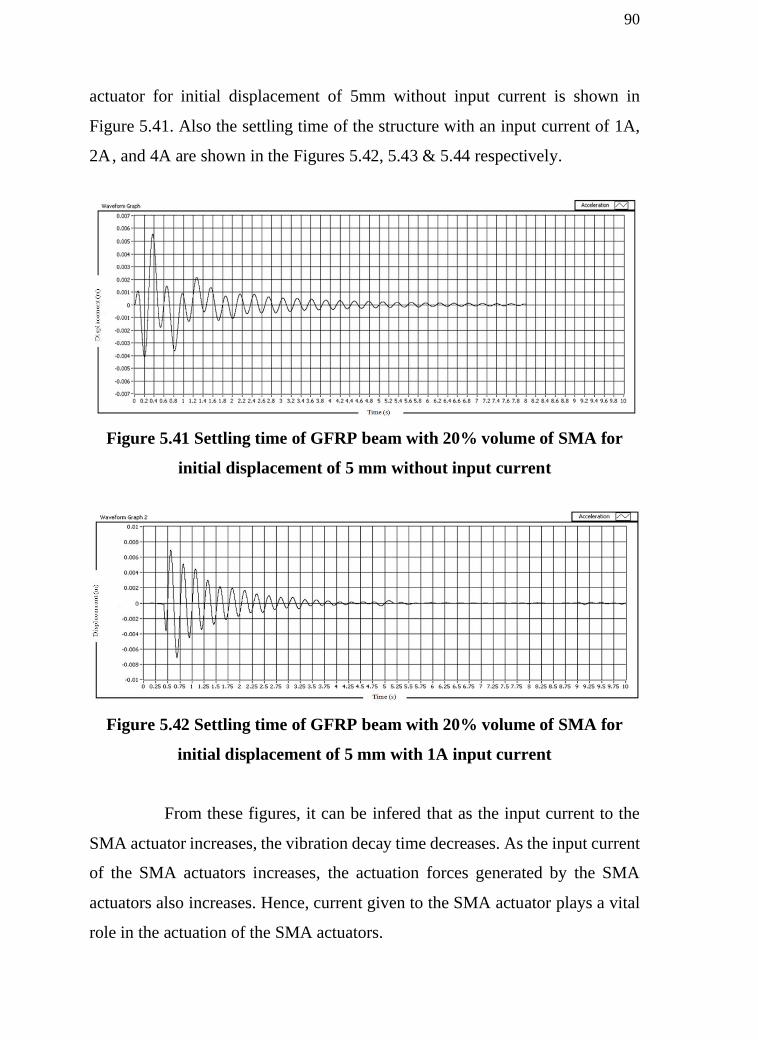
actuator for initial displacement of 5mm without input current is shown in
Figure 5.41. Also the settling time of the structure with an input current of 1A,
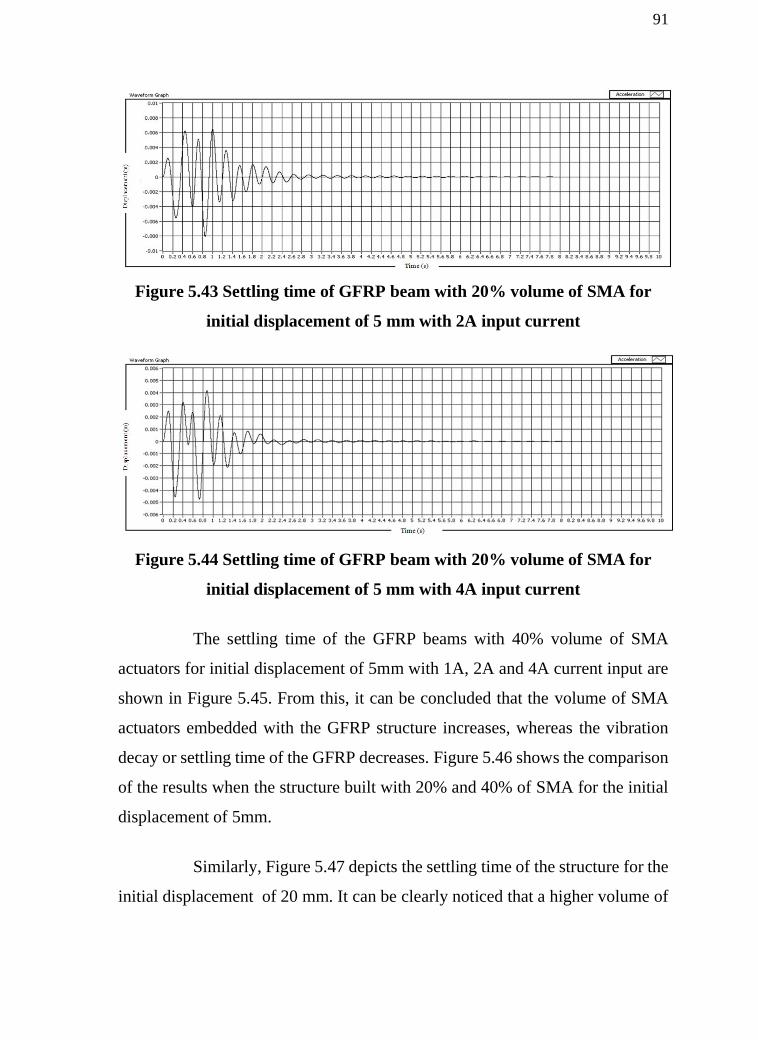
2A , and 4A are shown in the Figures 5.42, 5.43 & 5.44 respectively.
Figure 5.41 Settling time of GFRP beam with 20% volume of SMA for
initial displacement of 5 mm without input current
Figure 5.42 Settling time of GFRP beam with 20% volume of SMA for
initial displacement of 5 mm with 1A input current
From these figures, it can be infered that as the input current to the
SMA actuator increases, the vibration decay time decreases. As the input current
of the SMA actuators increases, the actuation forces generated by the SMA
actuators also increases. Hence, current given to the SMA actuator plays a vital
role in the actuation of the SMA actuators.
91
Figure 5.43 Settling time of GFRP beam with 20% volume of SMA for
initial displacement of 5 mm with 2A input current
Figure 5.44 Settling time of GFRP beam with 20% volume of SMA for
initial displacement of 5 mm with 4A input current
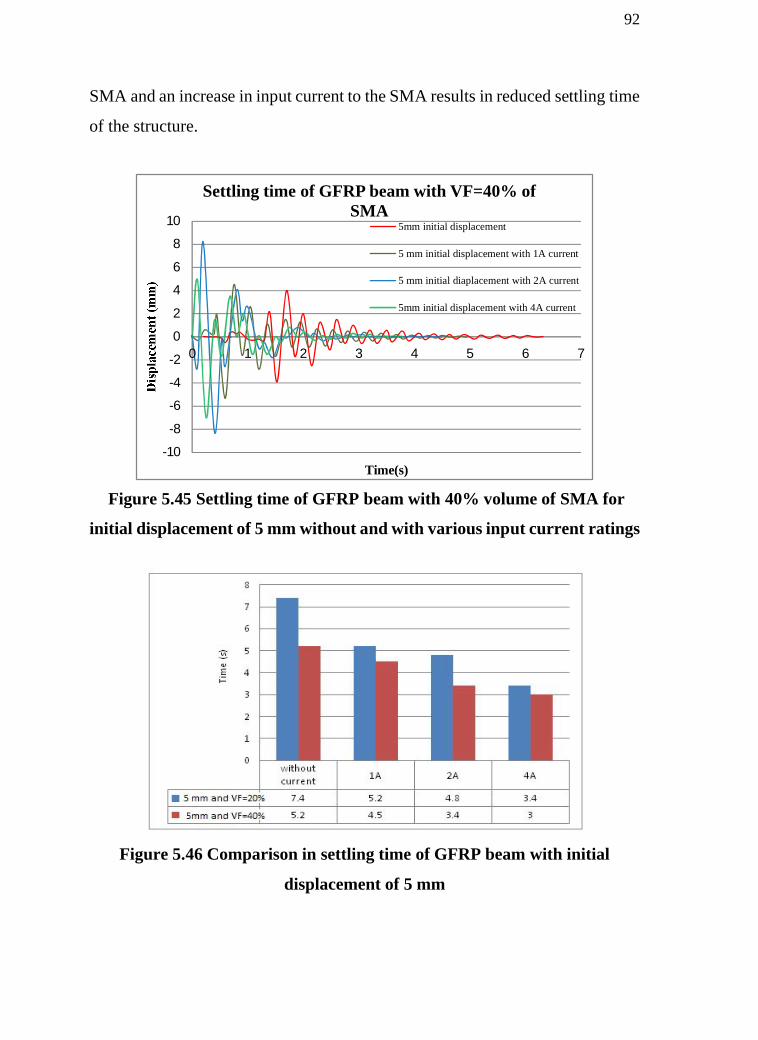
The settling time of the GFRP beams with 40% volume of SMA
actuators for initial displacement of 5mm with 1A, 2A and 4A current input are
shown in Figure 5.45. From this, it can be concluded that the volume of SMA
actuators embedded with the GFRP structure increases, whereas the vibration
decay or settling time of the GFRP decreases. Figure 5.46 shows the comparison
of the results when the structure built with 20% and 40% of SMA for the initial
displacement of 5mm.
Similarly, Figure 5.47 depicts the settling time of the structure for the
initial displacement of 20 mm. It can be clearly noticed that a higher volume of
92
SMA and an increase in input current to the SMA results in reduced settling time
of the structure.
Figure 5.45 Settling time of GFRP beam with 40% volume of SMA for
initial displacement of 5 mm without and with various input current ratings
Figure 5.46 Comparison in settling time of GFRP beam with initial
displacement of 5 mm
-10
-8
-6
-4
-2
0
2
4
6
8
10
0 1 2 3 4 5 6 7
Time(s)
Settling time of GFRP beam with VF=40% of SMA
5mm initial displacement
5 mm initial displacement with 1A current
5 mm initial diaplacement with 2A current
5mm initial displacement with 4A current

93
Figure 5.47 Comparison in settling time of GFRP beam with initial
displacement of 20 mm
Experiments were carried out with the developed DFBC control
system. The GFRP composite structure with 40% volume fraction of SMA was
excited with initial displacements of 5mm, 10mm, 20mm and 30mm. The
consolidated results are presented in Figure 5.48.
Figure 5.48 Settling time of GFRP beam with DFBC for various initial
displacements
-40
-30
-20
-10
0
10
20
30
0 1 2 3 4
Time(s)
Settling time of smart beam with DFBC
5mm initial displacement10 mm initial displacement20 mm initial diaplacement30mm initial displacement
94
Table 5.8 Vibration decay time of smart beam with DFBC
Initial displacement in mm
Vibration decay time in seconds
5 1.6
10 1.8
20 2.2
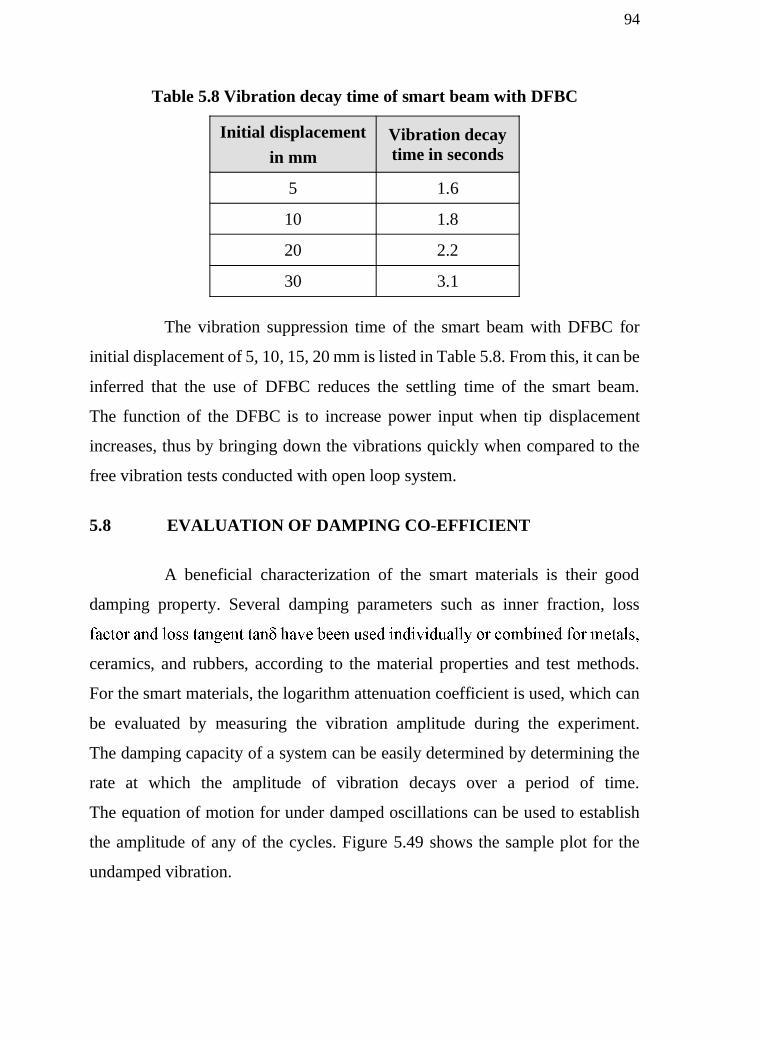
30 3.1 The vibration suppression time of the smart beam with DFBC for
initial displacement of 5, 10, 15, 20 mm is listed in Table 5.8. From this, it can be
inferred that the use of DFBC reduces the settling time of the smart beam.
The function of the DFBC is to increase power input when tip displacement
increases, thus by bringing down the vibrations quickly when compared to the
free vibration tests conducted with open loop system.
5.8 EVALUATION OF DAMPING CO-EFFICIENT
A beneficial characterization of the smart materials is their good
damping property. Several damping parameters such as inner fraction, loss
ceramics, and rubbers, according to the material properties and test methods.
For the smart materials, the logarithm attenuation coefficient is used, which can
be evaluated by measuring the vibration amplitude during the experiment.
The damping capacity of a system can be easily determined by determining the
rate at which the amplitude of vibration decays over a period of time.
The equation of motion for under damped oscillations can be used to establish
the amplitude of any of the cycles. Figure 5.49 shows the sample plot for the
undamped vibration.

95
Figure 5.49 Plot of typical under damped vibration (Rao SS, 2002)
The logarithmic decrement of the smart beam was calculated by using
Equations 5.7 and 5.8.
1/x2) (5.7)
Where x1 = first maximum displacement, x2 = second maximum displacement
(5.8)
The logarithmic decrement of the smart beam for various initial
displacements at different current rating is listed in the Table 5.9.
Table 5.9 Logarithmic decrement of smart structures
Input voltage
Volume Fraction
VF=20% VF=40%
2A 0.113 0.151
4A 0.149 0.316
96
From this, it can be concluded that the logarithmic attenuation
coefficient can be increased by increasing the input current to the SMA
actuators. This is because the higher input current to SMA actuator increases
energy dissipation rate of SMA actuators. Also, the logarithmic attenuation
coefficient can be increased by the increasing volume fraction of SMA actuators.
5.9 CONCLUDING REMARKS
This chapter focuses on the development of a smart structure for an
active vibration suppression by using a shape memory alloy. Glass/fiber epoxy
composite and Aluminium beams are used. Cantilever position of the beam has
been considered for experimentation owing to the fact that many of the
aerospace structure like aircraft wings, where active vibration suppression is a
requirement of cantilever structures. Experiments were carried out on composite
beams for various excitation frequencies, volume fraction of SMA, wire
diameter and variation in input current over different ply orientation of the fibers
of composite beams and beam material have been studied.
The control method employing SMA wires is cost-effective, since 1m
length of SMA wire costs only 150. When compared with other piezoelectric
actuators which costs around 2000, active vibration suppression by using SMA
provides a cheaper alternative. It also eliminates the need of designing large
amplification circuits, since the voltage required for actuation is very less of the
order of 4V. Also, the stiffness changing mechanism of SMA offered more
influence over the natural frequency of flexible structures when compared to
PZT. A control system has been developed for the smart beam. The control
system takes care of automatic switching ON/OFF of the power supply to the
SMA wire thereby aiding intermittent heating of the SMA wire. Cooling of SMA
wire is taken care of by natural convection. DFBC control system has been
developed to maintain the stiffness of SMA continuously in order to control the

97
structural response. From the experiments carried out with free vibration, the
damping factor seems to increase with an increase in the volume fraction of
SMA and the input current to SMA.