chapter 5 synthesis - department of the environment · chapter 5 synthesis ... as noted in chapter...
TRANSCRIPT

416
Chapter 5
Synthesis
Peter Bayliss, Renée Bartolo & Rick van Dam
Contents
5.1 Linkages with other TRIAP Sub-projects 417
5.2 Links between tiered assessment phases 419
5.3 Dealing with uncertainty 422
5.3.1 Types of uncertainty 422
5.3.2 Tools for uncertainty analysis 427
5.3.3 Communication of uncertainty 431
5.4 Scenario testing 432
5.5 Gap analysis 432
5.6 Utility of ERA tools and approach 441
5.7 References 444

Tropical rivers risk assessments – Chapter 5
417
5.1 Linkages with other TRIAP Sub-projects As noted in Chapter 1 (Section 1.5), this study was linked to two other studies through the TRIAP (Inventory of the biological, chemical and physical features of the aquatic ecosystems of the northern tropical rivers region, Lukacs & Finlayson 2008; and Development of a framework for the analysis of ecosystem services provided by aquatic ecosystems, De Groot et al 2008). We anticipated the linkage between Lukacs & Finlayson (2008) and the ecological risk assessment component of TRIAP reported here to be especially strong, with the integrated WIAM framework promoted by the Ramsar Convention (Finlayson et al 2005; see Chapter 1) providing the framework for the linkage.
Much of the biophysical information collected and summarised in Lukacs & Finlayson (2008) was used in this sub-project. In particular, Chapter 2 relied heavily on information presented in the biophysical attribute chapters of Lukacs & Finlayson (2008), especially with respect to providing quantitative data on geomorphology, hydrology, water quality, riparian vegetation, reptiles and fish. Whilst in some cases it provided quantitative data on the above attributes, most of the remaining information drawn from these descriptions highlighted the overall lack of data and information for the undeveloped northern tropics. The Daly River QERAs presented in Chapter 4 only used information on hydrology from Moliere (2008). However, apart from the availability of long-term systematic waterbird survey data across large regions of northern Australia, much of the data collated for Lukacs & Finlayson (2008) was broad-scale regional attribute data rather than data specific to focus catchments such as the Daly River catchment. Had QERAs been attempted on large regional scales across catchments, more of the datasets, particularly biological presence-absence data, would have been used. Needless to say, large data gaps within these datasets would have limited their usefulness and greatly increased uncertainty in assessing risks.
The Daly River catchment was deliberately selected as the focus catchment to assess the utility of a range of quantitative risk assessment methodologies because it is relatively data rich with respect to key assets and key threats compared to the other focus catchments. As highlighted by Finlayson et al (2005), consistency of spatial scale with respect to level of data resolution and quality across inventory, assessment and monitoring processes is a critical criterion for appropriate application of the WIAM paradigm.
Another anticipated strong linkage between the two sub-projects was that the biophysical spatial data collated by Lukacs & Finlayson (2008) would be used in the risk assessments in this report. However, very few of the spatial datasets were ultimately used for this purpose, primarily because they did not have the necessary resolution for the ecological assessment endpoints used in the risk assessments chosen posteriori. Had the timeframes of the inventory and risk assessments been more closely aligned (ie. the present study commenced about 18 months after the inventory study), enabling data requirements for risk assessment to be fed into the planning for the acquisition of the inventory data, it is possible that more of the data compiled for the inventory data would have been in a form suitable for use by the detailed risk analyses. Even so, many of the spatial datasets contained too few data and so were unsuitable for comprehensive regional risk assessments. This lack of data and associated ability to undertake further analyses are discussed in detail throughout Lukacs & Finlayson (2008).
Spatial data from Lukacs & Finlayson (2008) that were used in the RRM in Chapter 3 included the following:
Tropical rivers risk assessments – Chapter 5
418
• Updated version (Series 3) of the GEODATA TOPO 250K Series 2 Waterbodies data.
• Updated version (Series 3) of the GEODATA TOPO 250K Series 2 Drainage data.
Irrespective of the problems that we encountered in our attempt to link the risk assessments undertaken in this study to the inventory and mapping undertaken by Lukacs & Finlayson (2008), valuable lessons were learnt for future or repeat studies of the scope, depth and scale that have been undertaken for the TRIAP. Paramount amongst these is the need to clearly define at the outset the general purposes of, and range of specific end uses for, collecting biophysical data at multiple scales. Data requirements for risk assessments will be driven by the objective of the assessment and the associated problem definition/conceptual modelling phases. Consequently, information collected simply as an inventory exercise may not be in a suitable format for certain assessments, although this is obviously a necessary first step. We recognise that there is no such thing as a “one size fits all” inventory data set, and that all key information first needs to be captured then to be re-formatted for different purposes. Hence, the end user issues raised here should not detract from the usefulness or quality of inventory datasets, many of which will be able to be used for future assessments not yet identified. Additionally, all inventory datasets have intrinsic value in their own right as part of the overall synthesis of the current state of knowledge of the study area, including knowledge gaps. Furthermore, the generalised WIAM model is circular in action, with the starting point being iterative between inventory and assessment. Hence, inventory effort can be prioritised based on need, which should increase the focus on supporting the specific assessment at hand.
Another major lesson learnt is that inventories should also include the collation of data/information on existing or emerging threats in addition to natural or cultural attributes that may be susceptible to these threats. This approach would greatly assist with the early identification of generic and specific assessment needs. Indeed, the formal guidance on wetland inventory provided by Ramsar includes the need for collation of information on attributes such as land tenure, land use, management issues and threats (Finlayson et al 1999; Finlayson et al 2005).
The study by De Groot et al (2008) was not as closely tied to the other two TRIAP sub-projects, and was focused on two catchments, the Daly River and Mary River, rather than the whole Northern Tropical Rivers study area. Nevertheless, information gained by De Groot et al (2008) on the ecosystem services provided by the wetlands of the Daly River catchment was used for the Daly River catchment description in Chapter 2, but not for the data-driven analyses in Chapters 3 or 4. De Groot et al (2008) followed an integrated ecosystem services analysis framework to document, combine and compare the ecological, socio-cultural and economic values of the various ecosystem services provided by the wetlands. When examined closely, the framework is very similar to the WIAM framework as both require inventory of the ecosystem services or ecological assets and a subsequent analysis of these in a specific context. The major differences between the work of De Groot et al (2008) and the WIAM framework lie in the focus or emphasis of the frameworks. The ecosystem services analysis framework focuses on the integration of ecological, socio-cultural and economic values and analysis of the associated trade-offs between the types of values. In comparison, the WIAM framework focuses mostly on ecological values and emphasises consistency of scale between its components. Whilst the quantitative risk analyses presented in Chapter 4 also provided analyses of selected aspects of socio-cultural and economic values, such as recreational fishing and the costs of weed control, a more powerful approach would be to embed these into a holistic and explicit ecosystem services framework, and is a future recommendation.
Tropical rivers risk assessments – Chapter 5
419
5.2 Links between tiered assessment phases As stated in Chapter 1.4 (and depicted in Figure 1.3), a hierarchical and tiered approach was adopted for the risk assessments, with analyses at increasing levels of detail/quantification as spatial scale became smaller. The intention was that clear linkages would exist through the levels, with each new level being guided by the outcomes of the previous level. This is consistent with the concept of a tiered risk assessment whereby an initial prioritisation/screening process is undertaken and then followed by strategic, targeted assessments on the high priority issues. Each tier is designed to increase understanding and decrease uncertainty (US EPA 1998; Burgman 2005). In reality, however, the process did not operate entirely in this manner with the three project stages occurring at least partly in parallel (ie. identification/description of assets, pressures and threats; ii. prioritisation/screening of ecological risks of multiple pressures/threats; and iii. quantitative risk assessment of key threats). This was due in most part to project timing constraints, the mix and availability of personnel contributing to the project and the selection of certain issues for analysis based on data availability in order to be able to demonstrate various risk analysis approaches.
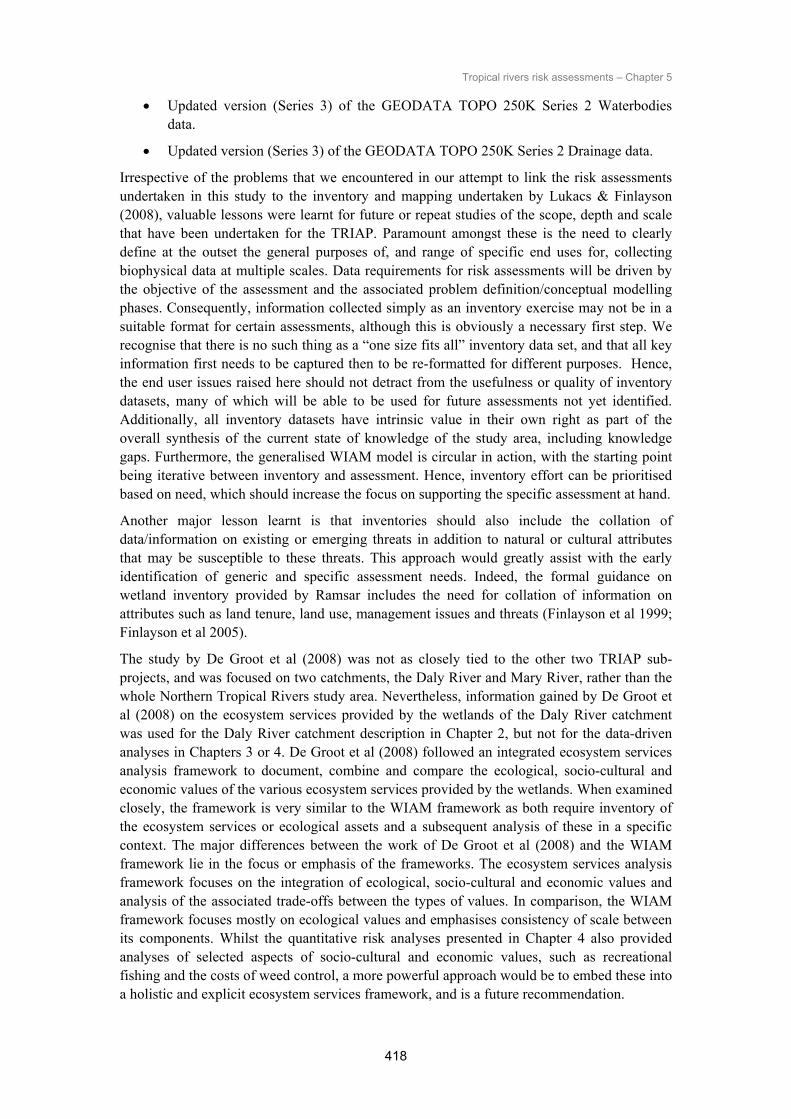
Nevertheless, linkages through the stages can be demonstrated for various ecological assets – pressure/threat interactions, as depicted for the Daly River assessments in Figures 5.1 a-c and 5.2. In Chapter 2, conceptual models (ie. asset-threat matrices) identified interactions between the key assets (and some of their values) and threats for the study areas (see Figure 5.1a). The qualitative assessments in Chapter 2 did not aim to prioritise the aquatic ecological assets or the threats to the assets, other than to distinguish existing and emerging/future threats. The key aim of these assessments was to identify and describe the key assets and pressures/threats so they could be included in the Relative Risk Models (RRM). In this sense, Chapter 2 represented part of the problem formulation/hazard identification step of an ecological risk assessment.
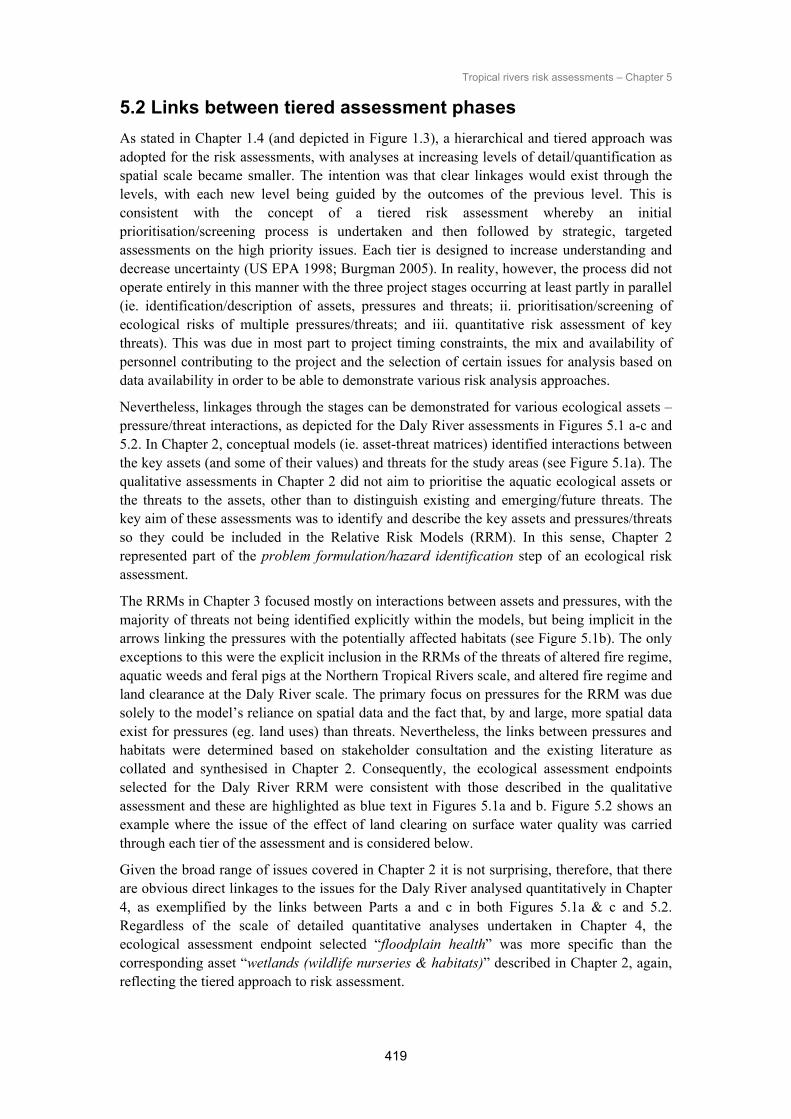
The RRMs in Chapter 3 focused mostly on interactions between assets and pressures, with the majority of threats not being identified explicitly within the models, but being implicit in the arrows linking the pressures with the potentially affected habitats (see Figure 5.1b). The only exceptions to this were the explicit inclusion in the RRMs of the threats of altered fire regime, aquatic weeds and feral pigs at the Northern Tropical Rivers scale, and altered fire regime and land clearance at the Daly River scale. The primary focus on pressures for the RRM was due solely to the model’s reliance on spatial data and the fact that, by and large, more spatial data exist for pressures (eg. land uses) than threats. Nevertheless, the links between pressures and habitats were determined based on stakeholder consultation and the existing literature as collated and synthesised in Chapter 2. Consequently, the ecological assessment endpoints selected for the Daly River RRM were consistent with those described in the qualitative assessment and these are highlighted as blue text in Figures 5.1a and b. Figure 5.2 shows an example where the issue of the effect of land clearing on surface water quality was carried through each tier of the assessment and is considered below.
Given the broad range of issues covered in Chapter 2 it is not surprising, therefore, that there are obvious direct linkages to the issues for the Daly River analysed quantitatively in Chapter 4, as exemplified by the links between Parts a and c in both Figures 5.1a & c and 5.2. Regardless of the scale of detailed quantitative analyses undertaken in Chapter 4, the ecological assessment endpoint selected “floodplain health” was more specific than the corresponding asset “wetlands (wildlife nurseries & habitats)” described in Chapter 2, again, reflecting the tiered approach to risk assessment.

A. Chapter 2 - Qualitative Asset-Threat matrix B. Chapter 3 - Semi quantitative, spatially explicit Relative Risk Model
Perennial flow
Maintenance of perennial flow
Threatened species
Maintenance of aquatic threatened species
Water quality
Water quality
Riparian vegetationMaintenance of
riparian vegetation
Biodiversity
Maintenance of biodiversity
C. Chapter 4 - Quantitative Bayesian Network for risks of surface water extraction and weeds on floodplain health
Figure 5.1 a-c Linkages between the three levels of assessment undertaken for the Daly River catchment – Example 1: Effect of surface water extraction and wetland weeds
on floodplain health. For (a) and (b), text highlighted in blue represents common ecological assets or assessment endpoints. Linkages between (a) & (c) and (b) & (c) are depicted by the red (unbroken) and blue (broken) arrows and boxes, respectively.
420
Tropical rivers risk assessments – C
hapter 5

A. Chapter 2 - Qualitative Asset-Threat matrix B. Chapter 3 - Semi quantitative, spatially explicit Relative Risk Model
Perennial flow
Maintenance of perennial flow
Threatened species
Maintenance of aquatic threatened species
Water quality
Water quality
Riparian vegetationMaintenance of
riparian vegetation
Biodiversity
Maintenance of biodiversity
C. Chapter 4 - Quantitative Bayesian Network for risks of land clearance on in-stream water quality
Figure 5.2 Linkages between the three levels of assessment undertaken for the Daly River catchment – Example 2: Effect of land clearing on in-stream water quality. Linkages between (a), (b) and (c) are depicted by the red (unbroken) arrows and boxes.
421
Tropical rivers risk assessments – C
hapter 5

Tropical rivers risk assessments – Chapter 5
422
The major aim of the RRMs was to prioritise the pressures/threats and assets in terms of potential ecological risk. Whilst the full range of pressures/threats described in Chapter 2 was covered, only a priority subset of the assets/values was selected for detailed assessment. This subset was identified as containing the most important assets/values based on reports from, and workshops and general discussions with, stakeholders. The results of the RRM for the Daly River indicated that the pressures/threats with the greatest risk to the aquatic ecological values were: grazing of native vegetation; land clearance; and transport and communications (eg. roads, railways, airports/aerodromes). This result did not change when stakeholder perceptions about the significance of the impact of various existing pressures/threats were factored into the assessment as a component of uncertainty. At least one of these high ranking pressures/threats, land clearance, was assessed quantitatively in Chapter 4, with the direct linkage between the semi-quantitative analyses shown in Figure 5.2. The other two threats assessed in Chapter 4, floodplain weeds (ie. mimosa and para grass) and surface water extraction, while not incorporated as pressures/threats in the RRM, were selected largely because they are key current (weeds) and emerging (surface water extraction) threats to the aquatic ecological assets of the Daly River catchment as highlighted in Chapter 2.
Despite the limited ability to fully adhere to a formal tiered assessment approach, this study nevertheless demonstrated the key principles of such an approach, particularly in relation to the scale (and level of detail) at which different levels of assessment are undertaken. This aspect was discussed in further detail in Section 5.1 in relation to the integrated WIAM framework promoted by the Ramsar Convention (Finlayson et al 2005; also see Chapter 1).
5.3 Dealing with uncertainty
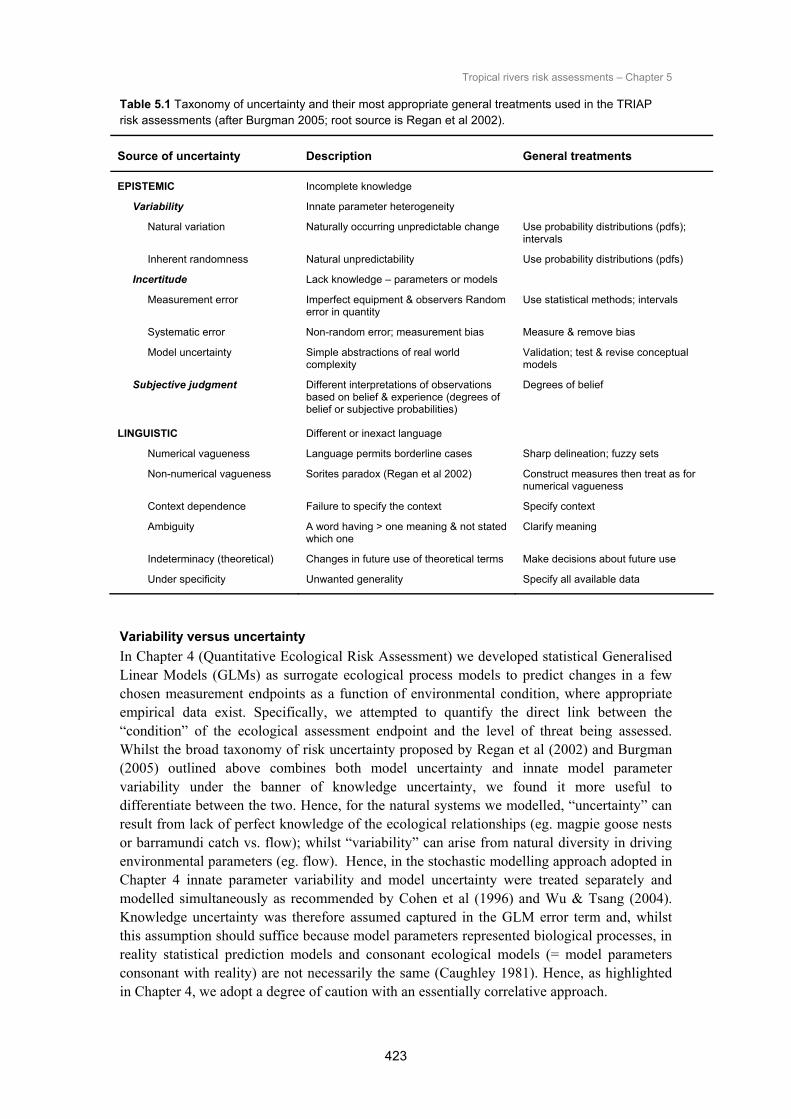
5.3.1 Types of uncertainty Risk assessment is fundamentally about making decisions in the face of uncertainty. All natural and human environments are characterised by uncertainty and, hence, we need to have a clear idea of what we mean by uncertainty before we attempt to deal with it. Regan et al (2002) developed a taxonomy of uncertainty that, at its highest level, distinguishes between epistemic and linguistic uncertainty. Burgman (2005) used their taxonomy to underpin his compendium of risks and decisions for conservation and management, and provided a very comprehensive treatment of the different types of uncertainty encountered in risk assessment under the epistemic-linguistic dichotomy (see Table 5.1). Epistemic uncertainty basically deals with uncertainties associated with incomplete knowledge and different degrees of belief in subjective views of that knowledge. Knowledge uncertainty results from limitations in how we observe or sample the real world because of insufficient data, measurement error, extrapolation, spatial and temporal variability and complexity, and is the domain of conventional statistics and science (Hilborn & Mangel 1997, Burgman 2005). Uncertainty from subjective judgement results from differences in interpretation of data based on human observation and experience and will, therefore, entail different degrees of belief in that subjective view (Hilborn & Mangel 1997). In contrast, linguistic uncertainty (see below) results from people using words differently or inexactly (Burgman 2005).
Epistemic uncertainty can result from either variability or incertitude; variability is an innate unpredictable change in a parameter (eg. the size of a barramundi, seasonal rainfall & river flow) reflecting real natural heterogeneity. In contrast, incertitude is lack of knowledge about parameters, models and their associated errors (Burgman 2005).
Tropical rivers risk assessments – Chapter 5
423
Table 5.1 Taxonomy of uncertainty and their most appropriate general treatments used in the TRIAP risk assessments (after Burgman 2005; root source is Regan et al 2002).
Source of uncertainty Description General treatments
EPISTEMIC Incomplete knowledge
Variability Innate parameter heterogeneity
Natural variation Naturally occurring unpredictable change Use probability distributions (pdfs); intervals
Inherent randomness Natural unpredictability Use probability distributions (pdfs)
Incertitude Lack knowledge – parameters or models
Measurement error Imperfect equipment & observers Random error in quantity
Use statistical methods; intervals
Systematic error Non-random error; measurement bias Measure & remove bias
Model uncertainty Simple abstractions of real world complexity
Validation; test & revise conceptual models
Subjective judgment Different interpretations of observations based on belief & experience (degrees of belief or subjective probabilities)
Degrees of belief
LINGUISTIC Different or inexact language
Numerical vagueness Language permits borderline cases Sharp delineation; fuzzy sets
Non-numerical vagueness Sorites paradox (Regan et al 2002) Construct measures then treat as for numerical vagueness
Context dependence Failure to specify the context Specify context
Ambiguity A word having > one meaning & not stated which one
Clarify meaning
Indeterminacy (theoretical) Changes in future use of theoretical terms Make decisions about future use
Under specificity Unwanted generality Specify all available data
Variability versus uncertainty In Chapter 4 (Quantitative Ecological Risk Assessment) we developed statistical Generalised Linear Models (GLMs) as surrogate ecological process models to predict changes in a few chosen measurement endpoints as a function of environmental condition, where appropriate empirical data exist. Specifically, we attempted to quantify the direct link between the “condition” of the ecological assessment endpoint and the level of threat being assessed. Whilst the broad taxonomy of risk uncertainty proposed by Regan et al (2002) and Burgman (2005) outlined above combines both model uncertainty and innate model parameter variability under the banner of knowledge uncertainty, we found it more useful to differentiate between the two. Hence, for the natural systems we modelled, “uncertainty” can result from lack of perfect knowledge of the ecological relationships (eg. magpie goose nests or barramundi catch vs. flow); whilst “variability” can arise from natural diversity in driving environmental parameters (eg. flow). Hence, in the stochastic modelling approach adopted in Chapter 4 innate parameter variability and model uncertainty were treated separately and modelled simultaneously as recommended by Cohen et al (1996) and Wu & Tsang (2004). Knowledge uncertainty was therefore assumed captured in the GLM error term and, whilst this assumption should suffice because model parameters represented biological processes, in reality statistical prediction models and consonant ecological models (= model parameters consonant with reality) are not necessarily the same (Caughley 1981). Hence, as highlighted in Chapter 4, we adopt a degree of caution with an essentially correlative approach.

Tropical rivers risk assessments – Chapter 5
424
Linguistic uncertainty Linguistic uncertainty arises because language is not exact (Burgman 2005). We reduced linguistic uncertainty throughout this project through consistent use of clearly defined terminologies summarised in up-front tables, as outlined below:
• Chapter 1 (Sections 1.3.2) – definitions of terms used in risk assessment and how these relate to our use of risk assessment terminology in this project.
• Chapter 2 (Sections 2.2.1 and 2.2.2) – definitions of particular ecological assets and pressures and threats.
• Chapter 3 (Sections 3.2.1 and 3.2.2) – definitions of habitats and pressures/threats used in the RRM approach.
• Chapter 4 (Section 4.1, Table 4.1) – definitions of key ecosystem assets and threats, and ecological and measurement endpoints, used for quantitative ecological risk assessment of aquatic ecosystems in the Daly River catchment.
Defining aspects of the risk assessment is important in ensuring consistency, tracking shifts in definitions after stakeholder consultations (see Bartolo 2006), and ensuring stakeholders are using a common language when providing input to the various stages of the risk assessment process.
Uncertainty in knowledge The important difference between uncertainty due to knowledge gaps and uncertainty due to innate parameter variability is addressed above (variability vs. uncertainty). The major issue confronting knowledge uncertainty is that, because there will always be incomplete knowledge, there will always be a diversity of views of how ecosystems work as reflected in the diversity of existing biophysical models. For example, in Chapter 4 we highlighted two dichotomous views about the feasibility and, hence, utility of developing predictive models to manage aquatic ecosystems. Harris (1997) argued that better knowledge is needed for better management and that, despite real world complexities, it is possible to develop simple predictive models because aquatic ecosystems are analogous to Complex Adaptive Systems (CAS) that have underlying rules irrespective of scale. In contrast, however, Reckhow (1999) argued that aquatic ecosystems are far too complex to model and predict with any degree of certainty and, hence, he suggested that a probabilistic approach such as Bayesian Networks (BNs) would be more useful. Needless to say a continuum of competing alternative models of how aquatic ecosystems work lies between these two extreme views. Hence, divergent views about how ecosystems work exist even among technical experts and this inevitably gives rise to structural uncertainty in models. Burgman (2005) argued that conceptualising causal models is often a subjective process in itself, and that the search for the right structure is often intuitive. Knowledge uncertainties associated with predictive process models, therefore, generally manifest in the early stages of conceptualising causal linkages, and it is the conceptual model that guides subsequent risk assessment (see below). It is important, therefore, to develop methodologies to screen conceptual models of ecosystems based on the likelihood of best fit given the data, and this is discussed below (Section 5.3.2, Tools for uncertainty analysis – Conceptual models).
Uncertainty in knowledge associated with inputs into the conceptual models developed for the RRM is acknowledged in Chapter 3 (Section 3.6.2). In order to reduce the effects of uncertainty in knowledge on the Daly River catchment conceptual models, expert

Tropical rivers risk assessments – Chapter 5
425
stakeholders were involved in two workshops to refine the models, thereby reducing the influence of individual investigator bias and providing additional infill for information gaps.
We note that although Regan et al (2002) and Burgman (2005) group uncertainties associated with incomplete knowledge and different degrees of belief in a subjective view under one taxonomic class called epistemic uncertainty (Table 5.1), the two sources are often treated independently as if mutually exclusive. This is exemplified by the fact that, if scientific knowledge or data amenable to frequentist statistics are lacking, then the default option is to resort to “expert opinion” or a “subjective view” (and see Figure 4.6), which inevitably entail different degrees of belief and so are considered by the scientific mainstream to be less certain. However, this is a useful approach when confronted with incomplete scientific knowledge, and underpins BNs that accommodate both objective and subjective probabilities.
Nevertheless, the incorporation of subjective beliefs within a BN is more powerful than being just a simple default option for lack of objective probability data. As highlighted in Chapter 4 the great utility of a BN is its recognition of the dual nature of probability through chance (via frequentist statistics) and belief (via Bayesian statistics and/or expert opinion); hence both world views are accorded equal status. For example, as acknowledged in Chapter 4, a major limitation of our Quantitative Ecological Risk Assessment (QERA) is that we excluded cultural flow values of local Indigenous people in our risk assessments. We suggest, however, that the BN approach should allow the two different knowledge systems (Western scientific vs. Indigenous cultural) to be combined and, therefore, it may provide a mechanism for community empowerment in decision making processes.
Uncertainty in data Spatial data Chapter 3.6.2 summarised uncertainty in the spatial data used for input into the RRM. Some key findings included:
• Uncertainty related to spatial data may be quantified where error matrices exist for spatial data derived from remotely sensed imagery (eg. the Northern Territory Land Use Mapping data).
• There are data gaps in national mapping programs that are undertaken by the jurisdictions thereby increasing uncertainty of data for specific RRM inputs (eg. Western Australia National Vegetation Information System-riparian extract). There also are instances of over-estimation and under-estimation in some mapping (land use types derived through ACLUMP).
• There is a lower degree of uncertainty on core national datasets that are updated and maintained such as wetlands and drainage.
Data used to derive quantitative process models All data used to develop stochastic ecological process models to undertake QERAs were obtained from sample observations of the real world, and generally under a limited set of spatial and temporal conditions. Hence, observational data have associated measurement errors and limitations in the range of innate variability captured. Uncertainties associated with data that describe key variables used to model ecological processes for risk assessment are discussed below.
Moliere (2008) addressed measurement error in determining flow volumes (ML) at the Mt Nancar gauging station on the Daly River between 1966 and 2006 (G8140040), which were
Tropical rivers risk assessments – Chapter 5
426
used in Chapter 4 in all quantitative risk models. He used data from the nearby gauging station (G8140041, 7 km upstream) to fill gaps in the record (see Chapter 4, page 266).
Estimates of magpie goose density and their nest density were derived by systematic aerial surveys, which were subjected to precision and accuracy errors (Bayliss & Yeomans 1990b). Observed densities of geese and nests were corrected for consistent accuracy error (or negative visibility bias) to estimates of absolute density using independently derived correction factors (Bayliss & Yeomans 1990a). Precision error, as reflected in the standard error of density estimates, is basically a function of sampling intensity, and all magpie goose aerial surveys enjoyed high sampling rates (5.0 -10% of total floodplain area, see Bayliss & Yeomans 1990b for the Daly Region). Hence, we assume that the GLM (multiple regression equation) derived in Chapter 4 to predict nest density from the density of available breeders and wet season flow volume is not swamped by sampling error captured during the Monte Carlo simulations (see below). The of estimates of native wetland vegetation and weed covers across the Daly River floodplain, as ascertained by the helicopter survey method, have a similar level of reliability to the geese and nest data.
The nature and magnitude of errors associated with catch-effort data of the barramundi fishery cannot be ascertained without independent investigation, but may include inaccurate log book entries of the quantity and location of commercial and recreational tour catches, and errors associated with questionnaire surveys of a small sample of recreational fishers during the Classic Competition. However, we assume that these errors are likely to be small relative to the overall changes in catch and abundance (as indexed by Catch Per Unit Effort [CPUE]) due to changes in fishing effort and flow volume, and as indicated by Monte Carlo simulation (see below). We assume also that these errors are likely additive and captured in the model regression error. More important, however, is the fact that the two models used to assess the potential impact of flow extraction on in-stream health, catch vs. effort and flow and CPUE vs. flow, cannot be combined into one overall risk analysis because the data are not independent. The separate risk analyses were justified on the basis that current fishing effort is not considered a threat to existing barramundi stock level primarily because independent modelling by Northern Territory Fisheries indicated that, to date, only 15% of the total biomass of unfished stock has been removed by mostly recreational fishers. However, recreational fishing effort (Chapter 4.3.1) is increasing over time and will likely be a key future threat if not managed appropriately. Hence, in future a BN is needed that combines potential threats from both flow extraction and fishing effort using population assessments of barramundi independent of the fishery.
Measurement errors associated with the statistical models (GLM & nonlinear regression) used to predict sediment and nutrient exports from North Queensland catchments from the percentage of land cleared for land use, and applied to the Daly River catchment and its sub-catchments (Chapter 4.4), include classification errors and are discussed above and in Chapter 3. The greatest uncertainty, however, lies in the untested assumption that the percentage of land in the catchment not in pristine condition is a reasonable index of land use across all catchments in tropical Queensland and the Northern Territory and, hence, sediment and nutrient exports. We recommend, therefore, that future assessments of the impact of land clearing on water quality should encompass a detailed analysis of likely sediment and nutrient inputs due directly to the combined individual effects of different land uses (eg. pastoral vs. horticulture vs. agriculture vs. conservation).
In summary, we assume that key data uncertainties are captured by the statistical-based process models developed to quantify risks. As indicated above, Monte Carlo simulation and sensitivity analysis can then be used to examine the influence of errors in risk outputs (see

Tropical rivers risk assessments – Chapter 5
427
below). We highlight also the fact that BNs can accommodate most types of subjective and objective error structures.
5.3.2 Tools for uncertainty analysis Table 5.2 summarises the key advantages and limitations of various tools used to deal with uncertainty in risk assessment, and a detailed discussion of selected tools follows.
Conceptual models In addition to capturing relevant knowledge and expertise about cause-effect linkages and interactions, conceptual models used for risk assessment can communicate the full range of assumptions and uncertainties that underlie the model. Hence, all risk assessments are preceded by a conceptual model that first defines the purpose of the analysis, and secondly makes explicit all assumptions about cause-effect relationships and possible interactions with respect to threats and assets (via the measurement endpoint). However, we highlight above (Uncertainty of knowledge) that, given the importance of the conceptual model in guiding the risk assessment process at the outset, and the existence of competing models of how ecosystems work even among experts, new methodologies need to be developed to screen them based on minimal and/or qualitative data. For example, Dambacher et al (2003) proposed an innovative methodology to screen conceptual ecosystem models whereby a qualitative analysis of sign directed graphs is embedded into the probabilistic framework of a Bayesian Network. The approach incorporates the effects of feedback on the models’ response to a sustained change in one or more of its parameters, and may provide an efficient means to explore the effect of alternative model structures. Additionally, the method is amenable to stakeholder input and may mitigate the cognitive bias in expert opinion (Dambacher et al 2003).
Interval and Sensitivity Analyses As outlined in Chapter 3 (Sections 3.2.5 and 3.5) a number of sensitivity analysis tests were undertaken to test the robustness of the RRMs developed for the Northern Tropical Rivers and the Daly River catchment. Interval analysis was used to test the rankings of selected risk regions in the Daly River catchment through developing upper and lower bounding models based on stakeholder perceptions of the magnitude of effects of pressures/threats on ecological assets as described by the conceptual models. The results of the interval analyses indicated that the Daly River catchment RRM was representative of the stakeholder perceptions. Other sensitivity analyses undertaken included:
• Collapsing the water quality and aquatic threatened species assessment endpoints into one endpoint and determining if there were significant changes in the rankings of the risk regions in the Daly River catchment;
• Testing two different riparian datatsets used to derive habitat rankings for riparian habitat in the Daly River catchment; and
• Comparing risk region rankings for vulnerability to sea level rise at the Northern Tropical Rivers scale based on percentage cover and number of hectares.
Although the above mentioned tests are useful, in order to conduct a fully quantitative and informative uncertainty analysis, a Monte Carlo approach should be undertaken.

Table 5.2 Summary of the advantages and limitations of the analytical tools used to deal with uncertainty in risk assessment.
Tool Advantages Limitations
Conceptual model Guides risk assessment process from outset. Captures relevant knowledge and expertise about hypothesised cause-effect linkages and interactions. Can communicate full range of assumptions and uncertainties that underlie the model.
Given lack of complete knowledge about how aquatic ecosystems work there exists many competing alternative models (eg. top-down vs. bottom-up drivers). Need innovative methodologies to test and filter different conceptual model structures.
Semi-quantitative
Sensitivity analyses Provides the means to assess the robustness of the model (Walker et al 2001).
Enables testing of specific scenarios or model inputs.
Needs to be quantitative to truly assess model validity (eg. Monte Carlo methods).
Quantitative
Interval analysis Provides a mechanism of including and accounting for perceptions of the magnitude of effects of pressures/threats to ecological assets. Also provides uncertainty measures on the hypotheses generated by the conceptual model through the stakeholder specified ranges.
Can construct upper and lower bounding functions for a model (Moore 1979)
One stakeholder group can skew the averages based on their beliefs, thereby creating outliers.
Basic frequentist probabilities for exposure & effects
Low data requirements, simple summary of overall risk probability. Risk profiles change over time; do not identify cause-effects, ecological interactions or complexities; often only exposure data available, effects data generally lacking.
Statistical (empirical) models
GLMs (eg. simple linear or multiple linear regression equations)
Generates predictive equation that allows parameters to vary. Can use probability density functions (pdfs) to capture innate variability of model parameters. Knowledge uncertainty accounted for with MR error term.
Data rich models, appropriate data often unavailable. Models costly to parameterise. Assumption that complex, nonlinear systems can be simulated with normal multivariate linear equations often false.
Nonlinear regression models Accounts for typical nonlinear biophysical system responses (optimal; threshold or hysteresis effect, or tipping points).
Data rich models, appropriate data often unavailable. Models costly to parameterise. Nonlinearity often leads to highly complex & unstable outputs, increasing uncertainty & reducing utility.
Stochastic process models ( hybrid process & empirical models)
Above statistical models used as surrogated stochastic ecological process models because parameters assumed to index real biophysical processes. Input variables are pdfs accounting for natural system variability. Knowledge uncertainty assumed accounted for by the model error term.
Data rich models, appropriate data and replication often unavailable. Models costly to parameterise. Model outputs sometimes sensitive to parameter estimates & errors, increasing uncertainty & decreasing predictability & utility.
428
Tropical rivers risk assessments – C
hapter 5
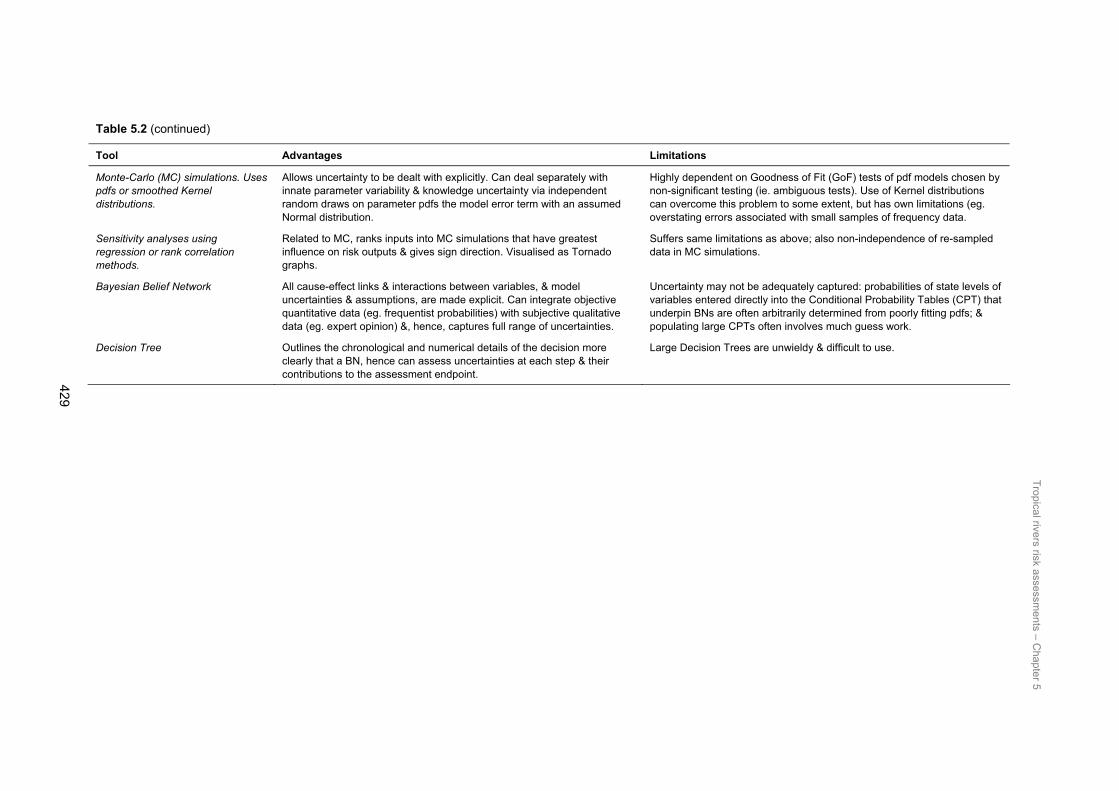
Table 5.2 (continued)
Tool Advantages Limitations
Monte-Carlo (MC) simulations. Uses pdfs or smoothed Kernel distributions.
Allows uncertainty to be dealt with explicitly. Can deal separately with innate parameter variability & knowledge uncertainty via independent random draws on parameter pdfs the model error term with an assumed Normal distribution.
Highly dependent on Goodness of Fit (GoF) tests of pdf models chosen by non-significant testing (ie. ambiguous tests). Use of Kernel distributions can overcome this problem to some extent, but has own limitations (eg. overstating errors associated with small samples of frequency data.
Sensitivity analyses using regression or rank correlation methods.
Related to MC, ranks inputs into MC simulations that have greatest influence on risk outputs & gives sign direction. Visualised as Tornado graphs.
Suffers same limitations as above; also non-independence of re-sampled data in MC simulations.
Bayesian Belief Network All cause-effect links & interactions between variables, & model uncertainties & assumptions, are made explicit. Can integrate objective quantitative data (eg. frequentist probabilities) with subjective qualitative data (eg. expert opinion) &, hence, captures full range of uncertainties.
Uncertainty may not be adequately captured: probabilities of state levels of variables entered directly into the Conditional Probability Tables (CPT) that underpin BNs are often arbitrarily determined from poorly fitting pdfs; & populating large CPTs often involves much guess work.
Decision Tree Outlines the chronological and numerical details of the decision more clearly that a BN, hence can assess uncertainties at each step & their contributions to the assessment endpoint.
Large Decision Trees are unwieldy & difficult to use.
429
Tropical rivers risk assessments – C
hapter 5

Tropical rivers risk assessments – Chapter 5
430
Predictive process models, Monte Carlo scenario simulations & sensitivity analyses As outlined in Chapter 4 (Section 4.1.2), where data were sufficient a multiple regression equation (or other GLM), or a nonlinear regression equation, was used to predict the measurement endpoint as a function of environmental condition that incorporates also some measure of the threat being assessed. These are called stochastic ecological process models (ie. empirically derived statistical models) because model response and predictive variables are essentially surrogate measures of ecological processes. Model parameters are characterised by their probability distribution functions (pdfs), and knowledge uncertainty is assumed captured in the model error term. Hence, uncertainty from lack of perfect knowledge of the ecological relationship (eg. barramundi catch vs. flow volume) and from natural variability in model parameters can be accounted for separately in “what if” scenario simulations (see below). The method of Wu & Tsang (2004) was trialled also for barramundi datasets by replacing pdfs of predictive parameters with smoothed Kernel distributions. All simulation scenarios were examined using a two-stage Monte Carlo simulation method (Cohen et al 1996), and results show that smoothed Kernel distributions and “off-the-shelf” pdfs often produced exactly the same mean outputs even if the pdfs are poor fits to observed data.
As outlined in Chapter 4 (Section 4.1.2), the effect of model parameter inputs on risk outputs was ascertained using sensitivity analysis of all Monte Carlo outputs (pdfs were randomly sampled 10,000 times or more to derive stable mean values). Sensitivity analysis was undertaken using regression analysis, whereby sampled input variable values were regressed against output values, producing a measure of sensitivity by input variable that are plotted on a Tornado graph.
Bayesian Networks & Decision Trees for Decision As outlined in Chapter 4.1.2 BNs were trialled and assessed for utility because a key advantage is that they can be used to fill empirical information gaps based on expert opinion and probabilities. However, BNs often have severe practical limitations because of the need to populate large Conditional Probability Tables (CPTs). The approach we adopted, therefore, was to incorporate the outputs from predictive models and pdfs that characterise key variables into an overall simplified BN structure that avoided reliance on large CPTs. Even so, limitations to utility still persisted because of the need to incorporate feedback cycles within dynamic biophysical and decision making systems. Other BN advocates, however, suggest alternative pathways to increased utility. For example, Thomas et al (2005) argued that there is a clear need to simplify and focus BN modelling tasks, and that the best way to accomplish this is to minimise the number of factors representing threats that require parameterisation by using a bottom-up prioritisation process rather than the usual top-down process employed by scientists. They concluded that comprehensive expert and stakeholder input was vital in the conceptual model simplification processes.
However, whilst we agree with Thomas et al (2005) on the need to focus on stakeholder inputs at the beginning of the process to develop a conceptual model, we argue also that stakeholders (or end users) must also have an input into the final evaluation stages where ecological assessment endpoints are actually subjectively assessed. This would minimise the possibility of the values of the risk modeller subsuming stakeholder values. For example, even with the best data available to quantify exposure and effects of wetland weeds, at the end of the day any assessment of floodplain health will still depend on a consensus subjective view about what constitutes “Excellent, OK and Poor” conditions of floodplain health. For example, in Kakadu National Park a 35% para grass cover and the accompanying loss of

Tropical rivers risk assessments – Chapter 5
431
native plant species is viewed as “Poor”. In contrast, for a floodplain used for cattle grazing it might be viewed as “Excellent”. Hidden amongst the equations and probabilities of the BN for assessment of Daly River floodplain health, therefore, is the inescapable fact that subjective value judgments of what levels of each assessment endpoint constitutes “Poor, OK and Good” need to be embedded into the final assessment node. This is the point where comprehensive stakeholder consultation needs to take over from objective probabilities in order to elicit the key subjective values and opinions from the people most affected by any decision based on risk. Hence, whilst stakeholder participation is absolutely essential in developing conceptual models at the start of the risk assessment process, it is also critical at the very end when decisions based on value judgments need to be made. The middle stage of the BN construction involves scientifically based technical value judgments and, basically, there is a correct and incorrect way of approaching this. However, with regards to social value judgments there is no right or wrong as all views (within limits) are equally valid.
As outlined in Chapter 4 (Section 4.1.2), Influence Diagrams and Decision Trees are BNs that support decision optimisation based on utility values assigned to different possible outcomes of the decision (Cain 2001). Influence Diagrams are useful for showing the relationship between events and the general structure of a decision clearly and concisely. In contrast, Decision Trees outline the chronological and numerical details of the decision (Pallisade 2000). A “first-cut” Decision Tree was developed for the barramundi fishery from the BN used to examine potential risks of water extraction on catch (Chapter 4.3.6). Whilst only a trial version, the Decision Tree allowed a clearer examination of influence pathways and trade-offs of different water extraction and fishing effort policies on catch. Use of a monetary value ($) as the assessment endpoint in the Decision Tree allows the benefits and costs of alternative policy options for use of flow to be compared (eg. commercial vs. recreational fisheries, fisheries vs. agricultural production, etc). However, as highlighted in Chapter 4, the rough estimate of the dollar value of a barramundi caught in the recreational fishery is only a starting point and, therefore, requires more justifiable estimates based on new survey data.
5.3.3 Communication of uncertainty As stated as a mantra throughout this report, all good risk assessments are guided at the outset by a conceptual model that, in addition to capturing relevant knowledge, can communicate in a transparent fashion the full range of assumptions and uncertainties that underlie the model. Uncertainty has been documented at all stages in the risk assessment conducted for this project. Conceptual models are basically box and arrow diagrams that visually display known or hypothesised causal linkages within a system and serve as very powerful communication tools. However, most risk assessments that flow from conceptual models, particularly those dependent on quantitative models, are complex mathematical and/or statistical symbolic constructs beyond the reach of most stakeholders and even technical experts. Hence, whilst scientifically elegant, they are poor communication tools because not many people can speak the language. There are two key exceptions to this generalisation, both of which have been used here with effect: (i) the spatially-explicit Relative Risk Model; and (ii) Bayesian Networks.
As for conceptual models, BNs are box and arrow diagrams that conceptualise the system to be managed in order to better understand how it works as an integrated whole. BNs can use both subjective (expert opinion) and objective probabilities to fill information gaps until knowledge increases, which can be combined with statistical models and/or process-based cause-effect models, all within a decision making and overall risk assessment framework. Hence, BNs are a very powerful visual communication tool. For example, a BN constructed
Tropical rivers risk assessments – Chapter 5
432
in NeticaTM is a much more useful communication tool than risk models constructed in other modelling environments because it is graphically based and, hence, more suitable for use as a decision making tool by stakeholders. The cascade effect of a change in variable state, or the subjective value of a decision and/or the uncertainty associated with it, can be observed simultaneously. The benefits of using spatially explicit QERA methods (see Chapter 4, Section 4.2.4 for floodplain weeds) and BNs as decision making and communication tools for environmental managers have been highlighted throughout the report.
5.4 Scenario testing In Chapter 2, the key current and emerging pressures/threats for the Northern Tropical Rivers and focus catchments were identified, although no testing/analysis was undertaken. Taking this a step further, the risk assessments in Chapters 3 (RRM) and 4 (QERA) included analyses of a number of specific scenarios for pressures/threats. Table 5.3 summarises the scenarios examined and includes the various methods adopted, the assessment and measurement ecological endpoints assessed used, and the outcome.
In Chapter 3 both present and future scenarios were modelled for pressures/threats using the RRM approach. The outcomes of the scenario modelling are summarised in Table 5.3. The current scenarios were based on multiple land use activities and altered fire regimes at both the Northern Tropical Rivers and Daly River catchment scales and additionally invasive flora and fauna at the Northern tropical Rivers scale. Future scenario modelling was undertaken for vulnerability of wetlands to sea level rise at both scales. The sea level rise scenario used, was a projected rise of 10-20 cm on top of the upper range of the 0.18-0.59 cm global projection by 2100 (CSIRO 2007). Consequently, all wetlands below 1 m in elevation and within tidal influence (we chose 70 km as the tidal influence limit) were deemed vulnerable to sea level rise in the future (out to 2100).
In Chapter 4 the influence of different interventions used to manage risks to the ecological assessment endpoint was firstly examined quantitatively via the stochastic process models using “what if” scenario simulations, and secondly as outputs to BNs. Hence, the BNs presented in Chapter 4 may form the start of an adaptive Decision Support System (DSS) that can be improved over time, especially with additional and/or better information flowing from targeted and well-designed future monitoring programs.
5.5 Gap analysis Adequate data and knowledge are critical for undertaking successful risk assessments of the scale and detail described in this study. The acquisition of better data and knowledge will improve confidence in risk estimates and therefore allow more informed decision making (US EPA 1998). As was evident throughout Chapters 3 and 4, data requirements differ for different risk assessment approaches. This section summarises the key gaps in data and knowledge that were identified during the course of this study.

Table 5.3 Summary of scenarios examined to assess potential impacts of some key threats to chosen ecological assessment endpoints using different methods.
Framework & method Ecosystem asset & assessment endpoint
Measurement endpoint Threat scenario Outcome
Relative Risk Model
Northern Tropical Rivers Maintenance of flow regimes
Water Quality
Maintenance of riparian vegetation
Maintenance of biodiversity
N/A Multiple land uses
Invasive flora and fauna
Altered fire regime
Sea level rise
Key pressures/threats:
Grazing natural vegetation
Feral pigs
Altered fire regime
Risk Regions with highest relative risk scores:
Adelaide River (NT)
Finniss River (NT)
Mitchell River (Qld)
Leichhardt River (Qld)
Daly River catchment Maintenance of perennial regimes
Water Quality
Maintenance of riparian vegetation
Maintenance of biodiversity
N/A Multiple land uses
Land clearing
Altered fire regime
Sea level rise
Key pressures/threats:
Grazing natural vegetation
Transport & communications
Land clearing
Risk Regions with highest relative risk scores:
Daly River
Douglas River
Katherine River
Green Ant Creek
QERA
GLM stochastic process model & Monte Carlo simulations
Floodplain health
Health of magpie goose population
Magpie geese nest density 0-100% flow extraction Reduction in mean nest density directly proportional to flow reduction
433
Tropical rivers risk assessments – C
hapter 5

Table 5.3 (continued)
Framework & method Ecosystem asset & assessment endpoint
Measurement endpoint Threat scenario Outcome
Spatially explicit risk probabilities derived from frequency of exposure & effects.
Floodplain health
Health of magpie goose population
Magpie geese nest density 2003 and 2007 extent of mimosa & para grass wetland weeds
Risks manageable at 16% & 1.5% coverage of mimosa & para grass, respectively.
Bayesian Network Floodplain health
Health of magpie goose population
Magpie geese nest density; wet & dry season habitats; plant biodiversity on floodplain
0%, 20% & 50% flow extractions, in absence & presence of weeds (ie. in combination with extent of mimosa & para grass in 2003).
Effect of flow extractions overwhelmed by impacts of weeds on floodplain “health”.
Bayesian Network extended to include increasing colonisation of weeds on across floodplain & weed control nodes (management target, cost of control).
Floodplain health
Health of magpie goose population
Magpie geese nest density; wet & dry season habitats; plant biodiversity on floodplain
No flow extraction simulated. Weeds colonisation floodplain over time, with and without control. Management scenarios include different control targets & different investment levels.
A control target of 10% cover of mimosa cost $750K & increased floodplain health classified as being in “Good” condition from 4% to 72%.
GLM stochastic process model & Monte Carlo simulations.
In-stream health
Socio-economic health of river
Barramundi commercial & recreational catch
0-100% flow extraction Declines in commercial & recreational catches will rapidly increase with flow extraction then ameliorate (ie. slow down).
GLM stochastic process model & Monte Carlo simulations.
In-stream health
Population health of barramundi per se
Barramundi population abundance indexed by CPUE
0-100% flow extraction Linear decrease in stock abundance with increasing flow extraction.
Bayesian Network. In-stream health
Socio-economic health of river
Barramundi commercial & recreational catch
Commercial fishing effort low; recreational fishing effort high; flow extractions 01-100%.
Health of recreational catch very sensitive to flow extraction.
Bayesian Network. In-stream health
Population health of barramundi per se
Barramundi population abundance indexed by CPUE
0-100% flow extraction. Barramundi health indexed by “safe” reduction levels applicable to harvested populations.
Health of population abundance very sensitive to flow extraction.
434
Tropical rivers risk assessments – C
hapter 5
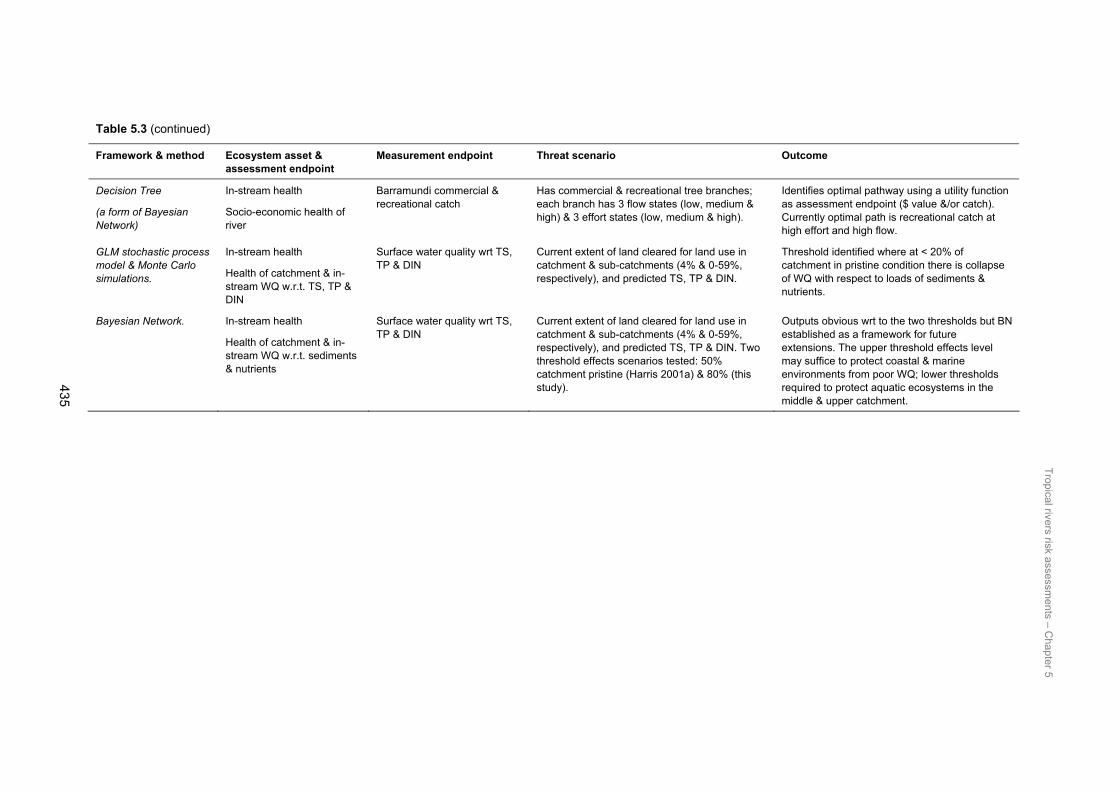
Table 5.3 (continued)
Framework & method Ecosystem asset & assessment endpoint
Measurement endpoint Threat scenario Outcome
Decision Tree
(a form of Bayesian Network)
In-stream health
Socio-economic health of river
Barramundi commercial & recreational catch
Has commercial & recreational tree branches; each branch has 3 flow states (low, medium & high) & 3 effort states (low, medium & high).
Identifies optimal pathway using a utility function as assessment endpoint ($ value &/or catch). Currently optimal path is recreational catch at high effort and high flow.
GLM stochastic process model & Monte Carlo simulations.
In-stream health
Health of catchment & in-stream WQ w.r.t. TS, TP & DIN
Surface water quality wrt TS, TP & DIN
Current extent of land cleared for land use in catchment & sub-catchments (4% & 0-59%, respectively), and predicted TS, TP & DIN.
Threshold identified where at < 20% of catchment in pristine condition there is collapse of WQ with respect to loads of sediments & nutrients.
Bayesian Network. In-stream health
Health of catchment & in-stream WQ w.r.t. sediments & nutrients
Surface water quality wrt TS, TP & DIN
Current extent of land cleared for land use in catchment & sub-catchments (4% & 0-59%, respectively), and predicted TS, TP & DIN. Two threshold effects scenarios tested: 50% catchment pristine (Harris 2001a) & 80% (this study).
Outputs obvious wrt to the two thresholds but BN established as a framework for future extensions. The upper threshold effects level may suffice to protect coastal & marine environments from poor WQ; lower thresholds required to protect aquatic ecosystems in the middle & upper catchment.
435
Tropical rivers risk assessments – C
hapter 5
Tropical rivers risk assessments – Chapter 5
436
Gehrke et al (2004) and Hamilton & Gehrke (2005) detailed the key scientific knowledge gaps for Australia’s tropical rivers, synthesised from a multi-disciplinary technical forum held in Darwin in February 2004. Broad themes of knowledge gaps included: sustainable water extraction; linkages between the biophysical components of the aquatic landscape; ecosystem processes of, and services provided by, rivers; and understanding and dealing with the impacts of climate change. More specific areas where additional data and increased knowledge were required included: the hydrological record (ie. the gauging network); surface water – groundwater interactions and associated estimates of sustainable yield; baseline descriptive (ie. inventory) data for many biological components and associated indicators of ecological condition; river typology/classification systems; and basal food resources for economically important food webs and associated drivers of the productivity. The gaps identified during this project (and the related study by Lukacs & Finlayson 2008) are, for the most part, consistent with, or reflective of, these issues.
Whilst documenting a vast amount of literature, the process of identifying and describing the aquatic ecological assets of, and pressures/threats to, the Northern Tropical Rivers study area in Chapter 2 also identified numerous gaps in information and knowledge on the biophysical attributes of the aquatic ecosystems. Paramount amongst these were:
• regional biodiversity, including general species distributional information, relationships between species and habitats and the extent of endemism;
• surface water – groundwater interactions;
• distribution and functions of riparian vegetation;
• water quality;
• processes supporting dry season refugia; and
• the role of riverine freshwater discharge (and its constituents – eg. nutrients, sediments) for estuarine and coastal marine productivity.
The various biophysical theme reports from Lukacs & Finlayson (2008) also identified major gaps in distributional data for key taxa groups as well as water quality, hydrology and geomorphology data. The gaps and limitations in relation to spatial datasets identified throughout Chapter 2 were addressed more thoroughly in Chapter 3, where they were applied in the RRM. Some of these are outlined below.
When applying the RRM approach at the Northern Tropical Rivers and Daly River catchment scales in Chapter 3 there were a number of knowledge and data gaps identified that resulted in specific pressures/threats and habitats not being represented or inadequately represented. These data gaps contribute to uncertainty in the models. These data gaps are summarised below.
Northern Tropical Rivers:
• Land clearing data – we were only able to source quantitative land clearing data for the Northern Territory despite there being a land clearing mapping program in Queensland (we had difficulties in sourcing the data). As a consequence, land clearing was omitted from the model.
• Weeds data – although weeds data were included, the data (based on density obtained largely through expert knowledge) at this scale are qualitative and would be better represented by predictive habitat suitability maps. An omission from the weeds dataset was Mimosa pigra, a key floodplain weed.
Tropical rivers risk assessments – Chapter 5
437
• Riparian data – there are some regions such as the northern coast of Western Australia where there were no riparian areas mapped, thereby increasing uncertainty for those particular risk regions. Similarly, there is both an under-estimation and over-estimation of riparian habitat in Queensland (dependent on catchment), which may be due to the fact that the source data may not be suited for extracting riparian habitat. Further validation in these regions would improve this dataset and decrease associated uncertainty.
• Water impoundment (dams) – the inclusion of dams as a pressure/threat in the RRM would be useful. There is a 1:1 000 000 scale dam dataset representing dams that have greater than 200 ML capacity (smaller dams are included if they are owned or controlled by the state). This particular dataset includes capacity that could be the basis of ranking this pressure/threat. The 1:1 000 000 scale data can be supplemented with the 1:250 000 scale data that includes dam walls, town rural storage and flood irrigation storage.
Daly River catchment:
• There were no suitable catchment–based datasets available for invasive species (both weeds and feral animals such as pigs). There is an opportunistic non-systematic weeds dataset available that, after quality assessment, was deemed unsuitable for incorporation into the RRM. Major exceptions, however, to this lack of weeds data are the systematic surveys of floodplain weeds, specifically mimosa and para grass, undertaken by the Northern Territory Government Weeds Branch in 2003 (see below). Chapter 4 developed a range of predictive Habitat Suitability Models for both of these wetland weeds. Similar models and associated maps are required for major terrestrial weeds throughout the Daly River catchment and its sub-catchments.
• Wetlands – Unfortunately, the currently available 1:50,000 scale wetland map (refer to Chapter 2) for the Daly River basin does not cover the entire catchment. Hence, it was not able to be used for the RRM analysis With some further work, the 1:50,000 scale mapping could be expanded to include the rest of the catchment, thereby providing a higher resolution dataset for model input.
Similarly, in our QERA of aquatic ecosystems in the Daly River catchment presented in Chapter 4, there were also a number of knowledge and data gaps identified that resulted in specific risks to assets not being fully assessed. This omission contributed to uncertainty in the models. The identified knowledge and data gaps are summarised as follows:
Floodplain health:
• Statistical models were developed to predict the density of magpie goose nests from the availability of geese to breed and the quantity and quality of available nesting habitat as indexed by flow volume. Whilst both linear and nonlinear regression models explained much of the observed variability in nest density (67% & 98%, respectively, Chapter 4.2.1), only 11 wet season samples were used. Hence, results could have been fortuitous, especially for the highly predictive nonlinear model, and is the reason the latter was not used in subsequent risk analysis. Furthermore, Figure 4.8a suggests that the relationship between nest density and river flow volume could be a double threshold-effects relationship and, hence, cannot be adequately modelled with the addition of quadratic polynomial terms. Additional goose survey data are required for the Daly River floodplain to validate the threshold-effects model and,

Tropical rivers risk assessments – Chapter 5
438
similar analyses are required for other floodplains to independently test the generality of the nest-flow relationship.
• A major pressure on nesting success not accounted for in Chapter 4 but which should be included in future assessments is the customary harvest of eggs by local Indigenous people (see Dexter & Bayliss 1991). This traditional practice would reduce the availability of breeders (Brook & Whitehead 2005a,b) and should also be accounted for in future assessments of floodplain condition that use nest density as ecological assessment and measurement endpoints. Conversely, sustainable harvests of magpie goose eggs and adults should, in future, be considered important socio-cultural assessment endpoints that may be at risk from future flow extraction and wetland weeds.
• A key result of Chapter 4 is that the wetland weeds mimosa and para grass are most likely the major threats to floodplain health, dwarfing the effects of a simulated 20% flow extraction. Whilst our spatially-explicit QERA of both weeds was based on data derived from intensive systematic surveys undertaken in 2003, they are currently five years old and out-dated, particularly in relation to the estimated areal doubling rates of mimosa (< 2 years) and para grass (~ 5 years). New base-line weed survey data are required in order to undertake a more comprehensive weeds ecological risk assessment as recommended in Chapter 4. Subjective stakeholder values also need to be ascertained to determine what constitutes “Good, OK and Poor” floodplain health as indexed by the percentage cover of weeds.
• Magpie goose abundance across the Top End of the Northern Territory exhibit approximate 20-year periodicities coherent with similar periodicities in river flow (Chapter 4, Section 4.2.8). Hence, use of risk probabilities dependent on flow that are averaged over these periods are inappropriate because initial conditions matter. Future risk assessments that use species or biological processes dependent on periodic flow as a condition metric should account for non-stationary risk probabilities. New statistical methods are required as suggested by Young (1999).
In-stream health:
• As highlighted above (Uncertainty in data – Section 5.3.1), we did not treat fishing effort as an additional threat to the abundance of catchable barramundi (& hence also sustainability of catches) because the catch and effort data are not independent. Future risk assessments need to simultaneously combine potential threats from both flow extraction and fishing effort using population assessment models of barramundi stock levels derived independently of the fishery. Subjective stakeholder values need also to be ascertained to determine what constitutes “Excellent, Ok and Poor” levels of barramundi catch.
• Additionally, and as outlined above (Tools for uncertainty analysis), a “first-cut” Decision Tree was developed for the barramundi fishery to examine the influence pathways and trade-offs of different water extraction and fishing effort policies on the monetary value of catches. We indirectly derived a preliminary estimate of the dollar value of a recreational barramundi catch based on a series of extrapolations from survey data collected by Coleman (2004). However, as highlighted above, this estimate is only a starting point that most likely entails a high degree of uncertainty. Hence, more reliable estimates based on new survey data are required.

Tropical rivers risk assessments – Chapter 5
439
• In this work we simulated the effects of wet season flow extraction only on barramundi catch and abundance. However, future water development scenarios in the Daly River catchment are likely to involve dry season extractions of surface flows and/or groundwater (Chapter 4.3.9). The effects of dry season flow extraction on the ecology of freshwater fish are unknown, and could potentially be more significant than wet season extraction given the importance of dry season base flow to ecological integrity of these groundwater-fed rivers. Hence, knowledge is required on seasonal flow relationships for a wide range of fish species encompassing the diversity of life histories and functional community groups found in aquatic habitats. Such a study is well underway in the Daly River catchment (M. Douglas, CDU pers comm) and it would be beneficial, therefore, to link the flow models developed for barramundi using longitudinal time series data to this study of detailed cross-sectional data collected over a few years.
• There are many potential indirect impacts on fish communities associated with water extraction that need to be examined in future risk assessments besides the direct impacts of reduced flow. Land use associated with water use within a catchment may have a major influence on the terrestrial-aquatic interface per se and, hence, could affect fish populations and their community dynamics through the disruption of biophysical processes, particularly spatial heterogeneity and connectivity of physical habitats (Chapter 4.3.9). In addition the effects of inputs of additional suspended sediment and nutrients on system function need to be addressed.
• The effects of other exotic aquatic weeds (eg. cabomba, Cabomba caroliniana) and exotic fish (eg. Tilapia, Oreochromis mossambicus) in riverine and floodplain habitats need to also be included in future risk assessments.
• The relationship between changes in climate regime, marine ecosystems and fish catch have been well documented globally (Chapter 4.3.9). Barramundi abundance is strongly correlated to flow as deduced from the limited time series of the fishery data. The abundance exhibits an approximate 20-year flow-related periodicity similar to magpie geese. Hence, new statistical methods are required to assess non-stationary risk associated with flow and fish.
• Erskine et al (2004) devised complex flow extraction rules for the Daly River. Overall it was recommended a maximum 20% flow extraction during recessional flow periods of flood events. In contrast, we simulated wet season flow extractions to assess aquatic ecosystem health irrespective of hydrographic stage, and based only on a couple of extraction rules and assumptions that err towards simplicity and practicality in the face of highly variable uncertain flow events (Chapter 4.2.1). However, the flow extraction recommendations of Erskine et al (2004) are based on well considered assessments of current knowledge of environmental requirements of key aquatic ecological processes in the Daly River. Hence, if endorsed, they should be assessed at some future stage and our QERA framework could accommodate such an assessment.
• Future risk assessments of surface water extraction should also account for the fact that land clearing for certain types of land use may increase surface runoff and, to some degree, counter-balance the effects of extraction (see Cain 2001). However, the effects on land clearing on sediment and nutrient loads and, hence, on water quality, would also need to be considered in parallel with any increase in flow.

Tropical rivers risk assessments – Chapter 5
440
Land clearing and surface water quality:
• The underlying assumption of statistical models developed to predict sediment and nutrient exports for North Queensland catchments, for application to data poor Northern Territory catchments, is that the percentage of land cleared for land use is a simple and direct predictor of nutrient loads because it integrates many disturbance-based environmental attributes that influence sediment and nutrient exports. These models suggest an effects threshold of 80% of land cleared and is in contrast to the 50% level estimated by Harris (2001b) for Australian catchments in general. The reason for this discrepancy should be examined.
• The 80% threshold effects level suggests that most of the catchment would have to be cleared of native vegetation cover for other land uses before a measurable, and most likely irreversible, change is detected in total loads of sediments and nutrients at a river mouth. Hence, our models predicting sediment and nutrient export loads in relation to land cover per se are useless as early warning systems because irreversible damage occurs in the catchment well before the 80% threshold inj water quality is reached at the river mouth. Comprehensive knowledge of how changes in water quality may affect aquatic ecosystems within upper to mid-catchments is required, in addition to impacts on receptors such as freshwater wetlands and the riparian zone that may trap sediments and some nutrients.
• Additionally, the broad physico-chemical endpoints used to assess surface water quality in Chapter 4 should be refined to encompass more sensitive and so more useful ecological indicators, such as those that capture the direct links between nutrients, sediments and the condition of biological communities in different trophic levels (eg. some fish species, macroinvertebrates, Vallisneria nana, algae & benthic diatoms).
• Other key processes in catchments that may influence water quality and that have not been addressed by this current risk assessment include: the influence of land use type on water quality; the influence of land clearing and land use type on ground water recharge rates and hence on ground water dependent ecosystems such as riparian habitats; and the effects of landscape-scale fires on water quality in floodplain, in-stream and riparian habitats.
• The cause of the elevated levels of nitrate found in groundwater in the Douglas River sub-catchment needs to be identified because it has the potential to impact on future water quality in both the Douglas and the Daly Rivers. In summary, more knowledge is required on what happens to nitrates after application as it travels through the groundwater and through the hyporheic zone into the river (P Jolly, pers comm, NT NRETA).
• The limited number of spatial replicates (n=12 tropical catchments in North Queensland) used in the sediment and nutrient export models precludes validation through random selection of sub-sets of the total data set. Model validation should therefore be treated as a separate future exercise by testing the application of the prediction equations in a number of independent catchments in the NT and elsewhere in the northern tropics. As suggested in Chapter 4.4.8, the Elizabeth and Darwin Rivers are ideal validation candidates because of their long water quality time series, and the changes in land use patterns in these catchments over the past two decades. The validation process would allow improvements also to both conceptual and empirical models of land use and water quality, reducing uncertainty in predictions.

Tropical rivers risk assessments – Chapter 5
441
5.6 Utility of ERA tools and approach Amongst numerous identified research priorities for northern Australia, Gehrke et al (2004) noted the need for large-scale risk assessment approaches, including risk mapping and predictive modelling associated with identified threat or development scenarios, or drivers of change, including clearing, grazing, roads, rail, mines and climate change and sea level rise. This project represents one of the first steps towards addressing this need and developing relevant and meaningful risk assessment approaches for the Northern Tropical Rivers. To conclude this report, we have summarised the utility and key benefits of using the risk assessment tools and approaches employed for this project.
The utility of the RRM, including the advantages and limitations of the approach, are discussed in detail in Chapter 3 (Section 3.6.4; and see summary in Table 5.4). However, through the application of the RRM in this study we have discovered and highlight the following key points:
• The RRM approach provides a robust framework for conducting regional ecological risk assessments, especially when examining the interaction of multiple pressures/threats with multiple ecological assets.
• One of the major advantages in applying the RRM is the ability to output maps of relative risk, which facilitates communication between experts and stakeholders.
• The RRM approach is easily understood, transparent and flexible in that the models can be readily updated as more information and data become available.
• The outputs of the RRM can be used by decision makers as a high level screening tool for identifying risk regions most at risk and in prioritising further research.
The utility of a range of methods used to quantitatively assess risk to aquatic ecosystems in the Daly River catchment, including their advantages and limitations, are discussed in detail in Chapter 4 (Sections 4.1.2 and 4.5; & see summary in Table 5.2). However, through application in this study we have discovered and highlight the following key points:
• Where exposure and effects data are collected spatially (eg. the distribution & abundance of weeds or a key asset), then a spatially-explicit quantitative risk assessment should be undertaken because it would be more useful to on-ground management of risk. Additionally, Habitat Suitability Models (HSMs) can be developed for the risk agents and assets under threat to better predict exposure and effects.
• There are two basic types of ecological models that have separate functions and both have application for risk assessment and management. Empirical (or statistical) models are used to predict, and process-based mechanistic models are used to enhance ecological understanding. Each type of model has major advantages and limitations (Table 5.4). We adopt a hybrid modelling approach (stochastic process models) that combines the best of both worlds and, which allows uncertainties due to knowledge gaps and innate parameter variability to be explicitly accounted for via Monte Carlo simulation and sensitivity analysis.

Tropical rivers risk assessments – Chapter 5
442
Table 5.4 Summary of advantages and limitations of the various ERA tools utilised in this project
Tool Advantages Limitations
Conceptual models Provides a powerful communication tool representing the understanding of how a system functions enabling others to evaluate this understanding. Models are readily modified as knowledge from stakeholders and experts is incorporated Generate testable hypotheses.
Over simplification of interactions between pressures/threats and ecological assets. Rely on information being available-where there is no information there is an increase in uncertainty. Requires concise documentation of hypotheses and areas of uncertainty to be valuable.
Relative Risk Model Robust framework for ERA at the regional scale. Graphical output (maps) through the risk characterisation process. Easy to understand and simplistic. Easily updated as more information and data become available. Focuses further research.
Data input (spatial) may not represent the true nature of the pressures/threats and habitats. Relative ranks from one regional model can not be compared with relative ranks from another regional model Can oversimplify the complexity of interactions Ranks may be misinterpreted and used inappropriately Based on an additive approach when some pressures/threats may have multiplicative effects
Spatially-explicit quantitative risk assessment of exposure & effects
Allows best use of exposure and assets data collected spatially. Better suited to on-ground risk management requirements. Allows development of Habitat Suitability Models (HSM) for both the risk agents and assets under threat, which allows better prediction of exposure and effects.
Needs comprehensive spatial data sets generally derived from costly systematic surveys. Trade-off between model complexity and utility required.
Hybrid empirical and process-based models
Statistical models used as surrogate stochastic process models
GLMs (eg. linear & nonlinear regressions)
Combines empirical (statistical) and process-based (mechanistic) modelling approaches. Makes best use of available data and knowledge. Mean parameter values of process model can be replaced with probability density functions (pdfs) to account for innate parameter variability. Model error.
Need comprehensive data sets to parameterise models. Predictive variables are only surrogates of complex ecological processes so degree of caution required. Increased model complexity through nonlinear and multivariate relationships can dramatically increase uncertainty. Hence trade-off between model complexity and utility required. Models can be parameter sensitive and so unstable and highly uncertain.
Bayesian Belief Networks Ideal risk management tool for complex, variable and poorly understood systems exposed to multiple threats and management treatments. Highly flexible, can integrate subjective beliefs with objective probability data. Facilitates stakeholder engagement. A powerful communication tool because it is visually based - changes in the state level of a variable or decision rule can be viewed as an integrated whole.
Often underpinned by large, unwieldy and unseen Conditional Probability Tables (CPTs) that are arbitrarily populated. Feedback loops common in ecological and decision making systems are not allowed, and time steps cannot be simulated easily. Often used as a panacea for all modelling problems, hence there exist a plethora of unusable spaghetti networks.
Decision Trees Useful when a decision needs to be optimised.
Outlines chronological and numerical details of the decision more clearly than a BN.
Non-monetary utility functions difficult to define.
Can become unwieldy and so difficult to use.
Tropical rivers risk assessments – Chapter 5
443
• Bayesian Networks are an ideal risk management tool for complex ecosystems that are highly variable, poorly understood and exposed to multiple threats and management treatments from multiple land use. BNs are highly flexible and can integrate subjective beliefs with objective data, facilitating stakeholder engagement and communication of complex issues. However, a major limitation is that they are often underpinned by large, unwieldy and unseen Conditional Probability Tables (CPTs) that are sometimes arbitrarily populated. We therefore adopted a simplified approach to populating CPTs in intersecting child nodes by replacing them with equations (eg. stochastic process models), or conditional statements that use outputs from parent nodes, as input variables (eg. other equations, pdfs or constants). Other major limitations are that feedback loops common in ecological and decision making systems are not allowed in BNs, and time steps cannot be simulated easily. However, both constraints can be overcome by developing parallel models in external modelling environments (eg. Excel Visual Basic) and importing the outcomes as inputs into the BN when required. BNs may be an appropriate and empowering risk management tool for Indigenous stakeholders because it allows subjective belief and, hence, gives equal weighting to unquantifiable cultural values.
• Decision Trees are a form of BN and are used when a decision needs to be optimised. Nevertheless, there exists much debate over monetary utility functions that attempt to measure environmental benefits resulting from intervention costs when risks are managed. Whilst Decision Trees outline the chronological and numerical details of the decision more clearly than a BN or compact Influence Diagram, they can nevertheless also become unwieldy and so difficult to use. We found that this problem is overcome if only a handful of key variables are used in analysis and not more than two state levels per variable.
Finally, the overarching framework of tiered risk assessment (described in Chapter 1) is as important as the individual risk analysis tools themselves. It stands to reason that for a region as extensive and diverse in its ecological and socio-cultural assets and values as the Northern Tropical Rivers study area, screening and prioritisation of risks to such assets and values is critical in order to focus investment in the most appropriate catchments and on the key issues. Tiered risk assessment ensures that all the key ecological assets (ie. potential assessment endpoints) and potential threats are identified, and that all the potential interactions between them are considered initially. From this, appropriate screening measures (through stakeholders and actual risk screening tools) serve to eliminate the most unlikely and/or less important interactions and direct subsequent, more detailed assessments to the more likely and/or more important interactions. The process is transparent, and stakeholders can see where and how decisions were made. As noted in Section 5.2, for various reasons it was not possible in this study to follow fully a tiered approach, although numerous benefits of it were, nevertheless, still realised. In reality, time and budget constraints may always make it difficult for a proper tiered risk assessment approach to be adopted, but it should at least be aimed for. Moreover, documenting reasons for departures from the approach, and how this impacts on the confidence in the outcomes, will assist in retaining the overall rigour of such assessments.

Tropical rivers risk assessments – Chapter 5
444
5.7 References Bartolo R 2006. Stakeholder views: Assets and threats to the tropical rivers of the Flinders
River catchment, Queensland. Interim Workshop Report, Richmond, 6 June 2006. www.environment.gov.au/ ssd/tropical-rivers/pubs/richmond-stakeholder-workshop.pdf.
Bayliss P & Yeomans KM 1990a. Use of low-level aerial photography to correct bias in aerial survey estimates of Magpie Goose and Whistling Duck density in the Northern Territory. Australian Wildlife Research 17, 1-10.
Bayliss P & Yeomans KM 1990b. Seasonal distribution and abundance of Magpie Geese Anseranas semipalmata Latham, in the Northern Territory, and their relationship to habitat, 1983-86. Australian Wildlife Research 17, 15-38.
Burgman MA 2005. Risks and Decisions for Conservation and Environmental Management. Cambridge University Press, Cambridge, UK.
Brook BW & Whitehead PJ 2005a. Sustainable harvest regimes for magpie geese (Anseranas semipalmata) under spatial and temporal heterogeneity. Wildlife Research 32, 459–464.
Brook BW & Whitehead PJ 2005b. Plausible bounds for maximum rate of increase in magpie geese (Anseranas semipalmata): implications for harvest. Wildlife Research 32, 465–471.
Cain J 2001. Planning improvements in natural resources management. Guidelines for using Bayesian networks to support the planning and management of development programmes in the water sector and beyond. Natural Environment Research Council, Centre for Ecology and Hydrology (CEH) Wallingford, UK. 124 pp.
Cohen JT, Lampson MA & Bowers TS 1996. The Use of two-Stage Monte Carlo Simulation Techniques to Characterize variability and Uncertainty in Risk Analysis. Human and Ecological Risk Assessment 2(4), 939-971.
De Groot D, Finlayson M, Verschuuren B, Ypma O & Zylstra M 2008. Integrated assessment of wetland services and values as a tool to analyze policy trade-offs and management options: A case study in the Daly and Mary River catchments, northern Australia. Supervising Scientist Report 198, Supervising Scientist, Darwin NT, in press.
Dexter N & Bayliss P 1991. The effect of experimental clutch harvest on numbers of magpie goose nests and juvenile recruitment. Wildlife Research 18(5), 533 - 537
Erskine WD, Jolly P & Smith I 2004. Environmental Water Requirements of the Daly River: Revision of Recommendations of Erskine et al (2003). Based on Daly Region Water Allocation Workshop held in Darwin on 5th May 2004. Report No. 30/2004D. Northern Territory Department of Infrastructure, Planning and Environment.
Finlayson CM, Davidson NC, Spiers AG & Stevenson NJ 1999. Global wetland inventory – current status and future priorities. Marine & Freshwater Research 50, 717-727.
Finlayson CM, Bellio MG & Lowry JB 2005. A conceptual basis for the wise use of wetlands in northern Australia – linking information needs, integrated analyses, dirvers of change and human well being. Marine & Freshwater Research 56, 269-277.
Gehrke P, Bristow K, Bunn S, Douglas M, Edgar B, Finlayson M, Hamilton S, Loneragan N, Lund M, Pearson R, Prosser I & Robson C 2004. Sustainable Futures for Australia’s Tropical Rivers – A strategy for developing research directions for Australia’s tropical river systems. CSIRO Land and Water Technical Report No. 17/04, 19 pp.

Tropical rivers risk assessments – Chapter 5
445
Hamilton SK & Gehrke PC 2005. Australia’s tropical river systems: current scientific understanding and critical knowledge gaps for sustainable management. Marine & Freshwater Research 56, 243-252.
Harris GP 2001a. Biogeochemistry of nitrogen and phosphorus in Australian catchments, rivers and estuaries: effects of land use and flow regulation and comparisons with global patterns. Marine and Freshwater Research 52, 139-49.
Harris GP 2001b. A Nutrient Dynamics Model for Australian Waterways: Land Use, Catchment Biogeochemistry and Water Quality in Australian Rivers, Lakes and Estuaries. Australian State of the Environment Second Technical Paper Series (Inland Waters), Department of Environment & Heritage, Canberra.
Hilborn R & Mangel M 1997. The Ecological Detective: Confronting Models with Data. Monographs in Population Biology 28. Princeton, New Jersey: Princeton University Press.
Jackson S, Storrs M & Morrison J 2005. Recognition of Aboriginal rights, interests and values in river research and management: Perspectives from northern Australia. Ecological Management and Restoration 6(2), 105-110.
Jackson S 2004. Preliminary Report on Aboriginal perspectives on land-use and water management in the Daly River Region, Northern Territory. CSIRO Sustainable Ecosystems. A Report to the Northern Land Council.
Lukacs G & Finlayson M (eds) 2008. A Compendium of ecological information on Australia’s Northern Tropical Rivers. Sub-project 1 of Australia’s Tropical Rivers – an integrated data assessment and analysis. A report to Land & Water Australia. Australian Centre for Tropical Freshwater Research, National Centre for Tropical Wetland Research, Townsville, Qld, in press.
MEA (Millennium Ecosystem Assessment) 2003. Ecosystems and human well being – a framework for assessment. World Resources Institute, USA.
Moliere D 2008. Hydrology. In A Compendium of ecological information on Australia’s Northern Tropical Rivers. Sub-project 1 of Australia’s Tropical Rivers – an integrated data assessment and analysis eds Lukacs G & Finlayson M. A report to Land & Water Australia. Australian Centre for Tropical Freshwater Research, National Centre for Tropical Wetland Research, Townsville, Qld, in press.
Moore R.E 1979. Methods and Applications of Interval Analysis. Society for Industrial and Applied Mathematics, Philadelphia.
Netica 1997. NeticaTM Application User’s Guide. Version 1.05. Norsys Software Corp., Vancouver, BC, Canada.
Pallisade 2000. Precision TreeTM. Pallisade Corporation. Newfield, NY USA. 215 pp.
Reckhow KH 1999. Water quality prediction and probability network models. Canadian Journal of Fisheries and Aquatic Sciences 56(7), 1150-1158.
Regan HM, Colyvan M & Burgman MA 2002. A taxonomy and treatment of uncertainty for ecology and conservation biology. Ecological Applications 12, 618-628.
Silverman BW 1990. Density Estimation for Statistics and Data Analysis. Chapman and Hall, London, New York. 175 pp. First edition 1986.

Tropical rivers risk assessments – Chapter 5
446
US EPA (U.S. Environmental Protection Agency) 1998. Guidelines for Ecological Risk Assessment. EPA/630/R-95/002F. Risk Assessment Forum, Washington, DC, USA.
Walker R, Landis W & Brown P 2001. Developing a Regional Ecological Risk Assessment: A Case Study of a Tasmanian Agricultural Catchment. Human and Ecological Risk Assessment 7, 417-439.
Wu F-C & Tsang Y-P 2004. Second-order Monte Carlo uncertainty/variability analysis using correlated model parameters: application to salmonid embryo survival risk assessment. Ecological Modelling 177, 392-414.