chapter 6: aviation sector - the energy transition...
TRANSCRIPT

CHAPTER6:AVIATIONSECTOR
62
63
Thescenarioinvolvesthefollowingparameters:
GENERAL OVERVIEW
The transition risk story for the aviation sector articulates itself through three trends:
• Changes in volume. Demand for international flights is expected to grow on average 4%-5% annually in the comingdecades (ICAO 2016a). In contrast, a 2°C transition would be associated with a low-demand scenario for air travelas consumers switch to rail, information technology, and local travel. Policy signals (e.g. carbon prices, incentivesfor rail travel, etc.) are likely to impact this. Modal switch, whether market or consumer driven, may thus play a keyrole in shifting volume, as well as unexpected macro trends (e.g. terrorism, pandemics, etc.).
• Scaling of alternative fuels. The scale up of alternative fuels will respond to evolving market standards (e.g.approval of blends for commercial use), development of country-specific policy goals (e.g. targets on biofuelconsumption) and further extension of international organizations and coalition targets (e.g. continuation of IATA’sand ICAO’s fuel efficiency targets through to 2050).
• Efficiency gains. Fuel efficiency gains will come from two main sources: technological improvements related to theairplane itself (e.g. aerodynamics, designs, material substitution) and more sophisticated traffic management andinfrastructure use (e.g. satellite navigation, optimization of control centres). The International Civil AviationOrganization (ICAO) has set a medium-term goal to improve fleet-fuel efficiency by 2% per year through 2020. Overthe last years, this goal has been surpassed with annual average improvements of 3.9% IEA 2016a.
The scenarios presented here cover passenger aviation.
6AVIATIONSECTOR
Jetfuelprices(USD/gallon)
MARKETPRICING
Carboncreditmandates(#andEuro/tCO2)Fuelefficiencystandards(kg/km)
POLICYMANDATES,INCENTIVES&TAXES
Demand(passenger-kilometres)Fuelefficiency(gfuel/revenuepassengerkm)
PRODUCTION&TECHNOLOGY
BiofuelPenetration(%)

5THINGSBEFOREGETTINGSTARTED
1. International vs. National Aviation. Distinction between perspectives in international and nationalaviation are necessary to reduce the uncertainty around the quantification of transition risks. It isestimated that under the ACT Scenario, aviation will be near equally affected by carbon taxes and theshift to rail transport, while the first affects both international and domestic segments, the second isexpected to represent a higher risk for domestic aviation (Table 6.1).
2. Governance. Governance in the aviation sector follows a two-fold approach. Governments areresponsible for setting measures to decrease or control domestic emissions, while international emissionsare covered by the measures set by the International Civil Aviation Organization (ICAO). Thus, alignmentand coordination between both parties is required to follow an efficient application of the measures.
3. International Targets. ICAO has set two main goals: to improve annual fuel efficiency by 2% and tostabilize international aviation emissions at 2020 levels. To achieve this, it has developed a set ofmeasures including, the CO2 Emissions Certification Standard (see Page 69) targeting technologyimprovements, a Global Air Navigation Plan targeting operational improvements and a carbon-offsettingprogram (see Page 68) to compensate those emissions that surpass 2020 levels. ICAO has however notset any targets on the uptake of Sustainable Alternative Fuels (SAF). In the countries in scope, theinitiatives come from governments (e.g. US and EU) and the private sector (e.g. Mexico and Germany).
4. Biofuel Prices. The price of biofuels will have a major role in increasing the uptake of SustainableAlternative fuels. Currently there are few scenarios modelling the changes in biofuel prices for aviation. Inthe US, the Energy Information Administration has estimated that in 2020 prices could be in the range of1€/L - 1.4€/L, an increase of 0.6€/L and 1€/L respect to jet fuel prices under a low oil price scenario.Recent estimates for Europe suggest that the additional costs could reach 1.20 €/L, representing anincrease of 4.3€ per passenger in a 1000 km flight (Insight_E 2015).
5. Market-based Measures. The Carbon Offsetting and Reduction Scheme for International Aviation(CORSIA) is the first scheme regulating international emissions. It applies to all international routes exceptthose to or from Least Developed Countries, Small Island Developing States or Landlocked DevelopedCountries. The program will start in 2021 in a voluntary basis until 2026. It is currently scheduled to lastuntil 2035. The application of CORSIA is seen as a potential material risk for companies. Changes in threefactors will determine the impact of the measure to the company: i.) fuel efficiency; ii.) demand, and iii.)the cost of an offset.
5THINGSBEFOREGETTINGSTARTED
Driver 2020 2025 2030 2035 2040Carbontax 162(2%) 553(6%) 1066(9%) 1783(13%) 2541(16%)
Railtransport 214(3%) 566(6%) 1024(9%) 1588(12%) 2335(14%)
TABLE 6.1 REDUCTION OF WORLD AIR TRANSPORT BY DRIVER (GPKM & SHARE IN TOTAL GPKM) (SOURCE:AUTHORS, BASED ON IEA 2016)
64

65
TABLE 6.2 AIR TRANSPORT DEMAND IN THE ACT AND LCT SCENARIOS (BILLION PKM) (SOURCE: AUTHORS, BASED ONIEA 2016A)
Overview. ICAO estimates that global passenger traffic is expected to grow from 5 billion to more than 13 billion RPK(Revenue Passenger-Kilometer) over the period 2010-2030 (i.e. average annual growth rate of 4.9%). Under thescenarios developed here, the demand captures changes that could correspond to: i.) Modal shifts from air travel toHigh-Speed Rail (HSR); and ii.) Changes in the economics of air travel due to carbon pricing or other policy instruments.
Risk pass-through mechanism. A change in demand can be translated to a change in the average load factor of acompany, thus having a direct effect on passenger revenues. Companies with long-term ownership of long-term assetspurchased under growth assumptions that will not materialize are likely to be the most exposed to changes in volume.
Sources. Demand is generally modelled using external variables such as GDP and population projections, however,long-term changes are generally modelled using assumptions around changes in the connectivity of supply networks(e.g. OECD 2016, Boeing 2016) or substitution of air by rail transport (e.g. IEA 2016a, Greenpeace 2015). Modelling thesector’s demand requires considering changes in domestic and international operations as both segments may behavedifferently in the transition, thus having a different impact at company level. Most scenarios either cover the sector asa whole (e.g. ETP) or one of the segments (e.g. Greenpeace 2015), limiting the analysis of a company’s risk.
Method ACT. Two models are used, IEA’s 2DS scenario which presents general sector changes, and an integratedassessment model developed by the International Centre for Research on Environment and Development (CIRED)which models domestic demand for selected regions. European countries estimates are build based the currentcountry demand share (e.g. number of passengers) reported in EUROSTAT. The share is assumed to be constant acrossscenarios, in line with the low demand forecast of Eurocontrol 2017 and 2013. Domestic transport estimates for Braziland Mexico were not built due to the lack of a granular regional breakdown.
Results. Under the ACT scenario demand’s annual growth rate will be cut nearly by half compared to the LCT due tothe effect of carbon-related policy instruments and the shift to rail transport. Brazil and Mexico are the economiesthat will experience the highest growth explained by macro-economic factors and the expansion of national andinternational routes (see Table 6.2). Companies with high domestic operations are the most exposed to the transitionas global demand is expect to increase only by 27% through 2035 compared to current levels (see Table 6.3).
6.1 DEMAND
Method LCT. The LCT takes the estimates of IEA 4DS 2016. It does not model changes in the domestic segment as thescenarios follow the same demand levels under business as usual.
YearWorld Brazil France Germany Italy Mexico US
ACT LCT ACT LCT ACT LCT ACT LCT ACT LCT ACT LCT ACT LCT2015 6 290 113 264 201 169 56 1 4702020 15% 21% 8% 12% 7% 15% 7% 15% 7% 15% 18% 25% 9% 13%2025 32% 49% 30% 42% 10% 30% 10% 30% 10% 30% 37% 55% 16% 29%2030 49% 82% 55% 80% 12% 45% 12% 45% 12% 46% 55% 89% 22% 44%2035 65% 119% 85% 124% 14% 62% 14% 62% 14% 62% 71% 125% 29% 61%2040 80% 158% 114% 171% 17% 80% 17% 80% 17% 80% 86% 161% 37% 80%
TABLE 6.3 GROWTH RATE OF AIR DOMESTIC TRANSPORT UNDER ACT (BILLION PKM) (SOURCE: AUTHORS BASED ONAEA 2016, EUROSTAT 2016, IATA 2016, CIRED 2016)
Year World France Germany Italy US2015 2 314 22 18 23 1 0182020 -41% -28% -28% -28% -64%2025 -28% 87% 87% 87% -81%2030 0% 179% 179% 179% -59%2035 27% 305% 305% 305% -41%
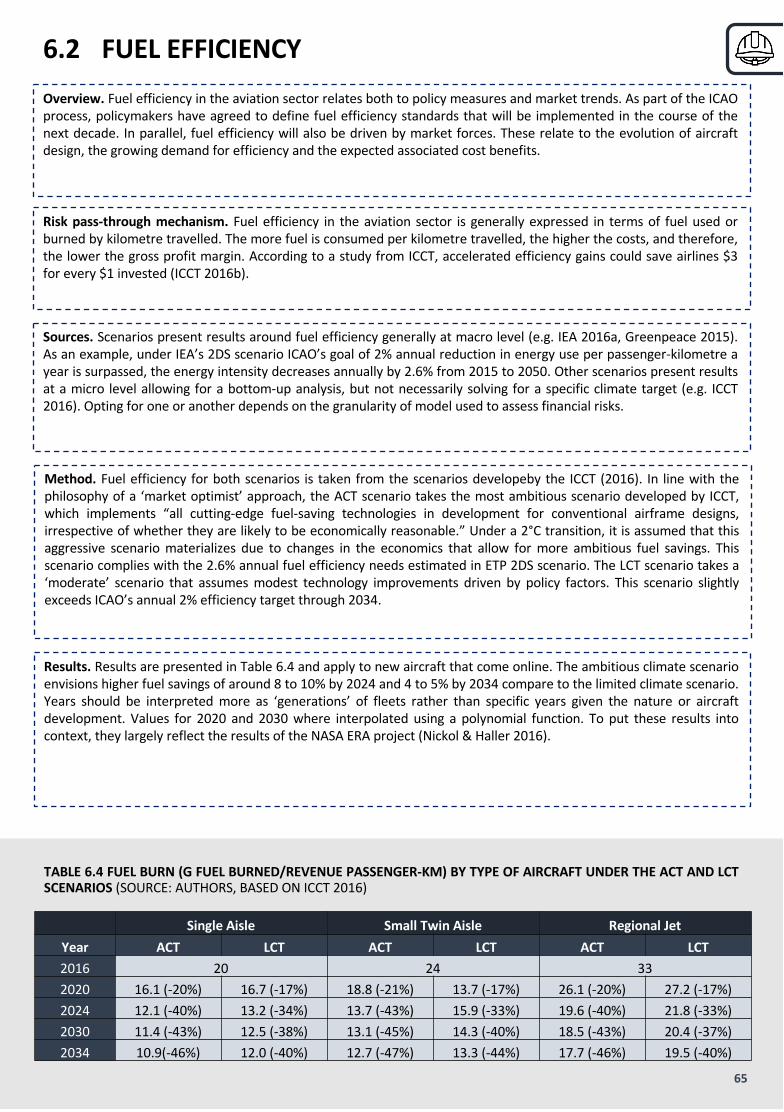
SingleAisle SmallTwinAisle RegionalJetYear ACT LCT ACT LCT ACT LCT2016 20 24 332020 16.1(-20%) 16.7(-17%) 18.8(-21%) 13.7(-17%) 26.1(-20%) 27.2(-17%)2024 12.1(-40%) 13.2(-34%) 13.7(-43%) 15.9(-33%) 19.6(-40%) 21.8(-33%)2030 11.4(-43%) 12.5(-38%) 13.1(-45%) 14.3(-40%) 18.5(-43%) 20.4(-37%)2034 10.9(-46%) 12.0(-40%) 12.7(-47%) 13.3(-44%) 17.7(-46%) 19.5(-40%)
TABLE 6.4 FUEL BURN (G FUEL BURNED/REVENUE PASSENGER-KM) BY TYPE OF AIRCRAFT UNDER THE ACT AND LCTSCENARIOS (SOURCE: AUTHORS, BASED ON ICCT 2016)
Overview. Fuel efficiency in the aviation sector relates both to policy measures and market trends. As part of the ICAOprocess, policymakers have agreed to define fuel efficiency standards that will be implemented in the course of thenext decade. In parallel, fuel efficiency will also be driven by market forces. These relate to the evolution of aircraftdesign, the growing demand for efficiency and the expected associated cost benefits.
Risk pass-through mechanism. Fuel efficiency in the aviation sector is generally expressed in terms of fuel used orburned by kilometre travelled. The more fuel is consumed per kilometre travelled, the higher the costs, and therefore,the lower the gross profit margin. According to a study from ICCT, accelerated efficiency gains could save airlines $3for every $1 invested (ICCT 2016b).
Sources. Scenarios present results around fuel efficiency generally at macro level (e.g. IEA 2016a, Greenpeace 2015).As an example, under IEA’s 2DS scenario ICAO’s goal of 2% annual reduction in energy use per passenger-kilometre ayear is surpassed, the energy intensity decreases annually by 2.6% from 2015 to 2050. Other scenarios present resultsat a micro level allowing for a bottom-up analysis, but not necessarily solving for a specific climate target (e.g. ICCT2016). Opting for one or another depends on the granularity of model used to assess financial risks.
Method. Fuel efficiency for both scenarios is taken from the scenarios developeby the ICCT (2016). In line with thephilosophy of a ‘market optimist’ approach, the ACT scenario takes the most ambitious scenario developed by ICCT,which implements “all cutting-edge fuel-saving technologies in development for conventional airframe designs,irrespective of whether they are likely to be economically reasonable.” Under a 2°C transition, it is assumed that thisaggressive scenario materializes due to changes in the economics that allow for more ambitious fuel savings. Thisscenario complies with the 2.6% annual fuel efficiency needs estimated in ETP 2DS scenario. The LCT scenario takes a‘moderate’ scenario that assumes modest technology improvements driven by policy factors. This scenario slightlyexceeds ICAO’s annual 2% efficiency target through 2034.
Results. Results are presented in Table 6.4 and apply to new aircraft that come online. The ambitious climate scenarioenvisions higher fuel savings of around 8 to 10% by 2024 and 4 to 5% by 2034 compare to the limited climate scenario.Years should be interpreted more as ‘generations’ of fleets rather than specific years given the nature or aircraftdevelopment. Values for 2020 and 2030 where interpolated using a polynomial function. To put these results intocontext, they largely reflect the results of the NASA ERA project (Nickol & Haller 2016).
6.2 FUELEFFICIENCY
65
67
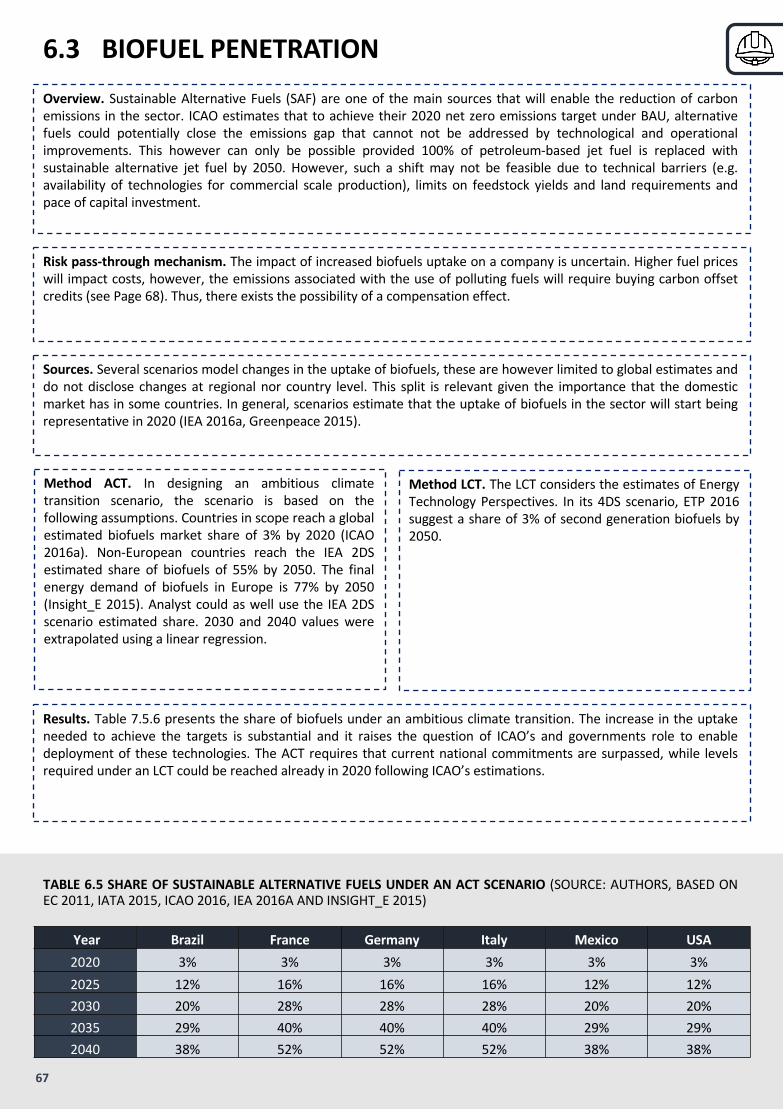
TABLE 6.5 SHARE OF SUSTAINABLE ALTERNATIVE FUELS UNDER AN ACT SCENARIO (SOURCE: AUTHORS, BASED ONEC 2011, IATA 2015, ICAO 2016, IEA 2016A AND INSIGHT_E 2015)
Overview. Sustainable Alternative Fuels (SAF) are one of the main sources that will enable the reduction of carbonemissions in the sector. ICAO estimates that to achieve their 2020 net zero emissions target under BAU, alternativefuels could potentially close the emissions gap that cannot not be addressed by technological and operationalimprovements. This however can only be possible provided 100% of petroleum-based jet fuel is replaced withsustainable alternative jet fuel by 2050. However, such a shift may not be feasible due to technical barriers (e.g.availability of technologies for commercial scale production), limits on feedstock yields and land requirements andpace of capital investment.
Risk pass-through mechanism. The impact of increased biofuels uptake on a company is uncertain. Higher fuel priceswill impact costs, however, the emissions associated with the use of polluting fuels will require buying carbon offsetcredits (see Page 68). Thus, there exists the possibility of a compensation effect.
Sources. Several scenarios model changes in the uptake of biofuels, these are however limited to global estimates anddo not disclose changes at regional nor country level. This split is relevant given the importance that the domesticmarket has in some countries. In general, scenarios estimate that the uptake of biofuels in the sector will start beingrepresentative in 2020 (IEA 2016a, Greenpeace 2015).
Method ACT. In designing an ambitious climatetransition scenario, the scenario is based on thefollowing assumptions. Countries in scope reach a globalestimated biofuels market share of 3% by 2020 (ICAO2016a). Non-European countries reach the IEA 2DSestimated share of biofuels of 55% by 2050. The finalenergy demand of biofuels in Europe is 77% by 2050(Insight_E 2015). Analyst could as well use the IEA 2DSscenario estimated share. 2030 and 2040 values wereextrapolated using a linear regression.
Results. Table 7.5.6 presents the share of biofuels under an ambitious climate transition. The increase in the uptakeneeded to achieve the targets is substantial and it raises the question of ICAO’s and governments role to enabledeployment of these technologies. The ACT requires that current national commitments are surpassed, while levelsrequired under an LCT could be reached already in 2020 following ICAO’s estimations.
6.3 BIOFUELPENETRATION
Method LCT. The LCT considers the estimates of EnergyTechnology Perspectives. In its 4DS scenario, ETP 2016suggest a share of 3% of second generation biofuels by2050.
Year Brazil France Germany Italy Mexico USA2020 3% 3% 3% 3% 3% 3%2025 12% 16% 16% 16% 12% 12%2030 20% 28% 28% 28% 20% 20%2035 29% 40% 40% 40% 29% 29%2040 38% 52% 52% 52% 38% 38%

Year ACT LCT2014 2.7 2.72020 2.2 2.22025 2.4 2.72030 2.7 3.22035 2.7 3.42040 2.7 3.6
TABLE 6.6 JET FUEL PRICE DEVELOPMENT (USD / GALLON) (SOURCE: AUTHORS, BASED ON ETP 2016 AND INDEXMUNDI)
Overview. Jet fuel is the main fuel used today in air transport, the expectations around its price will thus be influencedby the decisions on fuel efficiency measures and the uptake of sustainable alternative fuels.
Risk pass-through mechanism. An increase in jet fuel prices will increase the operational expenses related to fuelcosts, ceteris paribus, this translates in a decrease of the operating income.
Sources. There are no scenarios modelling the price of jet fuel oil under both an ambitious climate transition scenarionor a limited climate transition scenario.
Method. Jet fuel prices are highly correlated with crude oil Brent prices, thus under the ACT and LCT jet fuel prices arebased on oil prices. Using historical correlation, a constant jet-fuel to oil ratio of 0.028 is applied for both scenarios.
Results. Table 6.6 presents the estimates for Jet fuel prices under the ACT and LCT. Under the ACT a decrease in pricesis expected, this decrease will be responding to a decrease in jet fuel demand that is expected to halve by 2040respect to 2030 levels.
6.4 JETFUELPRICES
67

69
Carbonoffsetprice2020 2030 2035
6$/tCO2 10$/tCO2 12$/tCO2
TABLE 6.8 ALTERNATIVE CARBON OFFSETPRICE UNDER CORSIA (USD/TCO2) (SOURCE:AUTHORS, BASED ON ICAO 2016B)
Overview. International aviation emissions, which fall out of the scope of the Kyoto Protocol, are, since 2016, coveredby the Carbon Offsetting and Reduction Scheme for International Aviation (CORSIA) (see Page 63). Several othervoluntary instruments exist (e.g. Clean Development Mechanisms, Verified Carbon Standard, the Gold Standard),however, in the aviation sector, as in general in the transport sector, the uptake is rather low.
Risk pass-through mechanism. The application of CORSIA will affect companies’ operational expenses in the form ofhigher costs associated with the purchase of carbon offsets.
Sources. The only scenarios available modelling the effects of a market-based measure such as carbon offsettingprograms have been developed by ICAO 2013, ICAO scenarios have however not been adjusted to include recentdevelopments around CORSIA. Moreover, these scenarios do not intend to address the needs under a 2°C policy targetbut rather model the different avenues needed to reach the sector’s targets.
Method. Under CORSIA only those emissions surpassing 2020 levels will be offset. This mean that under an ambitiousclimate transition scenario companies won’t be required to offset their emissions, however, under a limited climatetransition scenario companies will have to abide to the scheme. The role of CORSIA in risk assessment is defined thenby two situations:
• The sector reaches its international emissions peak around 2020 (see Fig. 6.7). Companies do not have to buyoffsets as emissions are under 2020 levels.
• The sector continues emitting over 2020 levels and carbon offsets must be purchased to achieve the sector’scarbon neutral goal.
Results. The number of carbon offsets (see Annex 5) to be purchased by a company will depend on the overall totalemissions of the countries participating in CORSIA, however, the impact of the measure on the emissions reductionwill be conditional upon the cost of an offset. There is still high uncertainty around the cost of each offset and how itwill articulate with measures set up at national level. The analysis can be conducted using either the expected carbonprices under the LCT (see page 26), thus reaching a maximum of 50 EUR/tCO2 in 2040 or the “alternative” low carbonprices (see Table 6.8) that ICAO is currently including in its CORSIA roadshows.
6.5 CARBONCREDITMANDATE
FIGURE 6.7 PROJECTED DEMAND FOR OFFSETS UNDER AN MBMSCHEME (GT CO2) (2020 - 2035) (SOURCE: AUTHORS, BASED ONICCT 2013, 2016 AND ENVI 2015)
0
500
1000
1500
2000
2010 2015 2020 2025 2030 2035
Emiss
ionsfrom
Internationa
lAviation(M
tCO2)
Carbon neutral2020goalbaseline
CORSIA's voluntaryphase
CORSIA's mandatoryphase
0
500
1000
1500
2000
2005 2010 2015 2020 2025 2030 2035EmissionsfromInternationalAv
iation(M
tCo2)
lessoptimistic optimisticnoalternative fuels optimistic25%alternativefuels
Baseline EmissionspathwayunderRCP4.5 EmissionspathwayunderRCP2.6
0
500
1000
1500
2000
2005 2010 2015 2020 2025 2030 2035EmissionsfromInternationalAv
iation(M
tCo2)
lessoptimistic optimisticnoalternative fuels optimistic25%alternativefuels
Baseline EmissionspathwayunderRCP4.5 EmissionspathwayunderRCP2.6

Newin-production
Aircrafttype Verylargeaircraft Twinaisle Singleaisle Regionaljets Businessjets Freighters
2015average 2.9 1.7 0.9 0.7 0.6 2.12028target 2.6 1.8 0.9 0.7 0.6 1.9Reduction 10% 0% 6% 0% 0% 7%
NewtypesNewdesignaircraftaverage5 2.8 1.5 0.8 0.6 0.5 -Requiredmetricvalue(2020– 2028) 2.5 1.7 0.8 0.7 0.6 -Reduction 10% 0% 0% 0% 0% -
TABLE 6.9 ESTIMATED METRIC VALUE (KG/KM) REDUCTION REQUIRED FOR NEW IN-PRODUCTION AND NEW TYPESAIRCRAFT BY AIRCRAFT CATEGORY UNDER BOTH SCENARIOS (SOURCE: AUTHORS, BASED ON ICCT 2016)
Overview. Fuel efficiency standards are mainly based on emissions reduction through technology deployment. Twomajor standards, namely the non-volatile Particulate Matter (nvPM) standard for engines and the CO2 EmissionsCertification Standard have been recently adopted and will frame aircraft design in the following years. The focus isgiven to the latter standard, as the direct impact of the nvPM standard on climate change lies on the reduction ofblack carbon emissions (i.e. emissions from incomplete combustion), which do not fall under the scope of the study.
The ICAO developed in 2016 the first global CO2 Emissions Certification Standard for new aircraft to support efficiencygains based on the adoption of fuel efficient technologies into airplane system design (e.g. propulsion, aerodynamicsand structures). The standard will apply to new type (NT) designs of subsonic jet and turboprop airplanes launchedafter 2020 and those that will be in-production (InP) from 2023. Airplanes not meeting the standard can no longer beproduced from 2028. The standard makes a distinction based on the maximum take-off weight of the aircraft (MTOM)and sitting capacity, it assigns a higher reduction of CO2 to larger airplanes with a MTOM higher that 60 tonnes.
Risk pass-through mechanism. Compliance with a standard will require in general companies to increase theirexpenditure in fuel efficient measures. These expenses will most likely have a negative impact in the short runcompany’s net income margins under and ACT. Under an LCT the expenditures will be compensated by the savings.However, since the stringency of the standards is low on average companies won’t be affected by it.
Sources. There are currently no scenarios that put into context the application of the CO2 Emissions CertificationStandard. However, the requirements of the standard can be compared to the ICCT estimations on required fuelefficiency under the aggressive and moderate scenarios (see Page 65). ICCT “business as usual scenario” estimates anincrease in fuel efficiency of 27% on average for new types in 2024 (ICCT 2016a).
Method. To date, there is no reference on the potential strengthening of the standard. Therefore, estimations aroundfuture values are not developed. The description and analysis of the standard is therefore intended to inform on themisalignment of current policy and needs under the scenarios developed.
Results. Under both scenarios companies will be on average already complying to the standard. Considering today’srequirements, companies manufacturing and/or having a fleet complying with the minimum threshold won’t becontributing to the achievement of either scenario. It is estimated that the standard will contribute to an averageincrease in fuel efficiency of 4% in 2020 (see Table 6.9), however, to achieve the efficiency levels required under theACT and the LCT an average increase of 40% and 33% is already needed in 2024 (see Page 65). The standard thereforedoes not pose additional cost to companies under the selected scenarios – assuming they get implemented bycompanies.
6.6 FUELEFFICIENCYSTANDARDS
69

1. TRANSITION SCENARIOS
The consortium will develop and publicly release two transition risk scenarios, the first representing a ‘soft’transition extending current and planned policies and technological trends (e.g. an IEA NPS trajectory), and thesecond representing an ambitious scenario that expands on the data from the IEA 450S /2DS, the project’s assetlevel data work (see Number 2), and relevant third-party literature. The project will also explore moreaccelerated decarbonization scenarios.
2. COMPANY & FINANCIAL DATA
Oxford Smith School and 2° Investing Initiative will jointly consolidate and analyze asset level information acrosssix energy-relevant sectors (power, automotive, steel, cement, aircraft, shipping), including an assessment ofcommitted emissions and the ability to potentially ‘unlock’ such emissions (e.g. reducing load factors).
3. VALUATION AND RISKMODELS
a) 2°C portfolio assessment – 2° Investing Initiative. 2° Investing Initiative will seek to integrate the projectresults into their 2°C alignment model and portfolio tool and analytics developed as part of the SEI metricsproject.
b) ClimateXcellence Model – The CO-Firm. This company risk model comprises detailed modeling steps toassess how risk factors impact margins and capital expenditure viability at the company level.
c) Valuation models – Kepler Cheuvreux. The above impact on climate- and energy-related changes tocompany margins and cash flows can be used to feed discounted cash flow and other valuation models offinancial analysts. Kepler Cheuvreux will pilot this application as part of their equity research.
d) Credit risk rating models – S&P Global. The results of the project will be used by S&P Global to determine ifthere is a material impact on a company’s creditworthiness. S&P Dow Jones Indices, a S&P Global Division,will explore the potential for developing indices integrating transition risk.
The ET Risk consortium, funded by the European Commission, is working todevelop the key analytical building blocks (Fig. 0.1) needed for Energy Transitionrisk assessment and bring them tomarket over the coming two years.
MEETTHEBUILDERS- ETRISKCONSORTIUM
SCEN
ARIO Macroeconomic
trends/Legal&
reputational
Policycostsandincentives
Production&technologyMarketpricing
FIG. 0.0: ASSESSING TRANSITION RISK ACROSS THE INVESTMENT CHAIN (SOURCE: AUTHORS)
DATA Assetleveldata Companyleveldata Financialdata
Adaptivecapacity/Dynamic
capabilities
MODE
LS
Alignmentmodels&tools
Companylevelimpacts(ClimateXcellenceModel)
Creditrisk/ratingmodelsValuationmodels
RISKS&OPPORTUNITIESENERGYTRANSITION
71

ABOUT 2° INVESTING INITIATIVE
The 2° Investing Initiative [2° ii] is a multi-stakeholder think tank working to align the financial sector with 2°Cclimate goals. Our research work seeks to align investment processes of financial institutions with climate goals;develop the metrics and tools to measure the climate friendliness of financial institutions; and mobilizeregulatory and policy incentives to shift capital to energy transition financing. The association was founded in2012 and has offices in Paris, London, Berlin, and New York City.
ABOUT THE CO-FIRM
The CO-Firm GmbH is a boutique consultancy specialized in developing climate and energy strategies forfinancial services providers, industry, and utilities. Based on financial risk modelling under a range of climate andenergy scenarios, the proprietary ClimateXcellence Toolset, and a dataset of more than 200.000 assets and morethan 15.000 different technical mitigation measures, The CO-Firm supports its clients in identifying, evaluatingand realizing their specific economic opportunities in the national and global climate transition. Specifically, theCO-Firm serves its clients in adjusting their strategies, setting Science Based Targets, creating new businessmodels, and identifying cost savings in their operations and their supply chain. Additionally, the consultancyprovides regulatory monitoring services.
The views expressed in this report are the sole responsibility of the authors and do not necessarily reflect those of the sponsor, the ETRisk consortium members, nor those of the review committee members. The authors are solely responsible for any errors.
RISKS&OPPORTUNITIESENERGYTRANSITION
Contact:
Email:[email protected]:www.2degrees-investing.org
Telephone:+33142811997•+15164183156Paris(France): 97ruelaFayette,75010Paris,FranceNewYork(UnitedStates):205E42ndStreet,10017
NY,USALondon(UnitedKingdom):40Bermondsey Street,
SE13UDLondon,UKBerlin(Germany):AmKupfergraben 6a,10117
Berlin,Germany
Authors:LauraRamirez*,JakobThomä***,Jean-ChristianBrunke**,NicoleRöttmer**,MarcoDuran*,ChrisWeber*,StanDupré*,MartinGranzow**,MarkFulton(Advisor)*2° InvestingInitiative**TheCO-Firm***2°InvestingInitiative,ADEME,ConservatoireNationaldesArtsetMétiers
ThisprojecthasreceivedfundingfromtheEuropeanUnion’sHorizon2020researchandinnovationprogrammeundergrantagreementNo696004.