chapter 6 buildings sector energy consumption - eia.gov · chapter 6 buildings sector energy...
TRANSCRIPT
101U.S. Energy Information Administration | International Energy Outlook 2016
Chapter 6
Buildings sector energy consumptionOverviewEnergy consumed in the buildings sector consists of residential and commercial end users and accounts for 20.1% of the total delivered energy consumed worldwide. Consumption of delivered, or site, energy contrasts with the use of the primary energy that also includes the energy used to generate and deliver electricity to individual sites such as homes, offices, or industrial plants. In the International Energy Outlook 2016 (IEO2016) Reference case, delivered energy consumption in buildings worldwide increases by an average of 1.5%/year from 2012 to 2040. In the non-Organization for Economic Cooperation and Development (non-OECD) nations, consumption of delivered energy in buildings grows by 2.1%/year from 2012 to 2040, nearly three times the growth rate for the OECD nations.
Residential sectorEnergy consumption in the residential sector includes all energy consumed by households, excluding transportation uses.253 It includes energy used for heating, cooling, lighting, water heating, and consumer products. Energy consumption in the residential sector is affected by income levels, energy prices, location, building and household characteristics, weather, efficiency and type of equipment, energy access, availability of energy sources, and energy-related policies, among other factors. As a result, the type and amount of energy consumed by households can vary significantly within and across regions and countries.In the IEO2016 Reference case, residential sector energy use accounts for about 13% of total world delivered energy consumption in 2040. Delivered energy consumption in the residential sector grows by an average of 1.4%/year from 2012 to 2040, increasing by a total of 48% over the entire period. Residential energy use in the non-OECD nations increases by an average of 2.1%/year from 2012 to 2040 in the Reference case and accounts for 80% of all growth in world residential energy use over the 28-year period. OECD residential sector energy use grows much more slowly, averaging 0.6%/year over the same period, but residential energy consumption per capita remains higher in OECD countries than in non-OECD countries through 2040.Electricity becomes an increasingly important energy source for the residential sector throughout the projection period. The electricity share of world residential energy consumption grows from 39% in 2012 to 43% in 2040, and by 2025 electricity surpasses natural gas as the leading source of residential delivered energy.China and India continue to lead world residential energy demand growth in the IEO2016 Reference case, mainly as a result of their relatively fast-paced economic growth. In 2040 their combined residential energy consumption is more than double their 2012 total and accounts for nearly 27% of total world residential energy consumption.
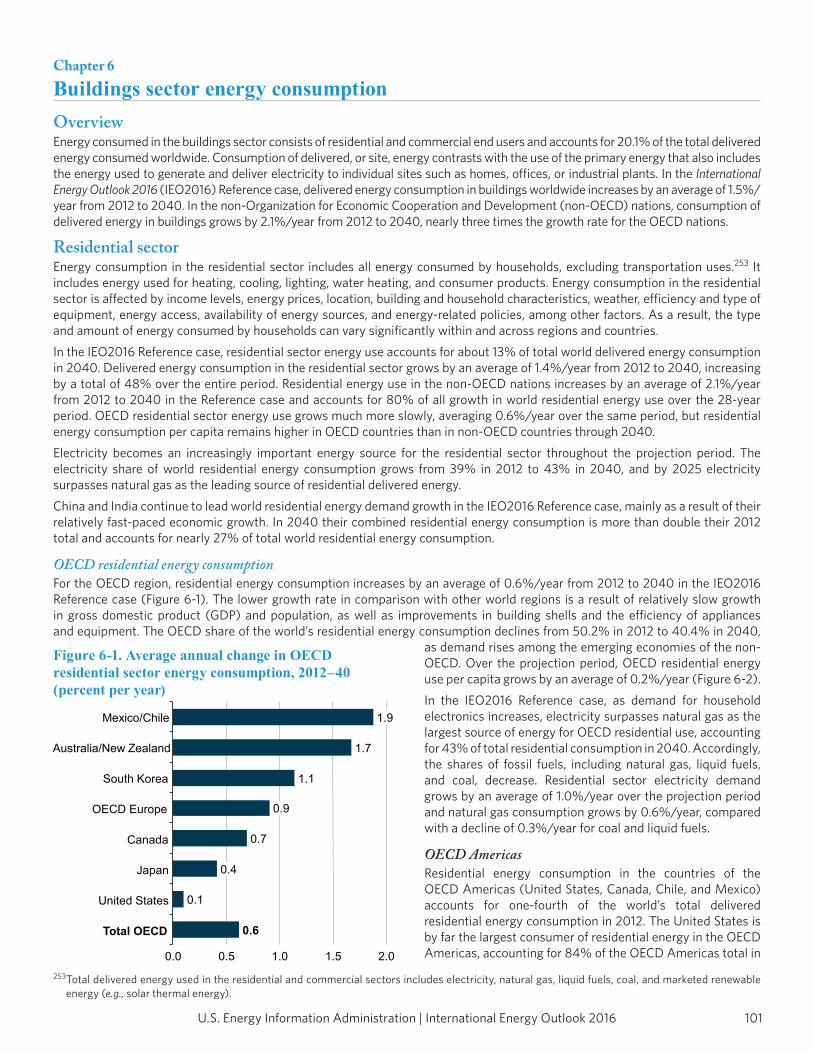
OECD residential energy consumptionFor the OECD region, residential energy consumption increases by an average of 0.6%/year from 2012 to 2040 in the IEO2016 Reference case (Figure 6-1). The lower growth rate in comparison with other world regions is a result of relatively slow growth in gross domestic product (GDP) and population, as well as improvements in building shells and the efficiency of appliances and equipment. The OECD share of the world’s residential energy consumption declines from 50.2% in 2012 to 40.4% in 2040,
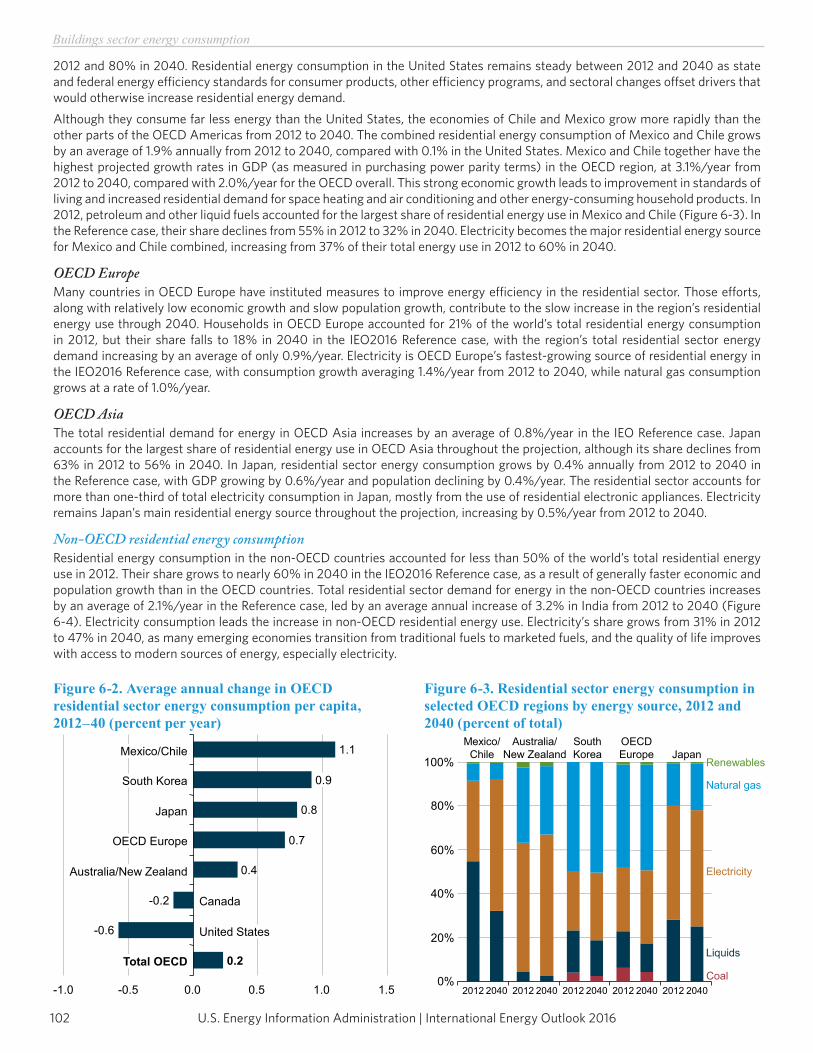
as demand rises among the emerging economies of the non-OECD. Over the projection period, OECD residential energy use per capita grows by an average of 0.2%/year (Figure 6-2).In the IEO2016 Reference case, as demand for household electronics increases, electricity surpasses natural gas as the largest source of energy for OECD residential use, accounting for 43% of total residential consumption in 2040. Accordingly, the shares of fossil fuels, including natural gas, liquid fuels, and coal, decrease. Residential sector electricity demand grows by an average of 1.0%/year over the projection period and natural gas consumption grows by 0.6%/year, compared with a decline of 0.3%/year for coal and liquid fuels.
OECD AmericasResidential energy consumption in the countries of the OECD Americas (United States, Canada, Chile, and Mexico) accounts for one-fourth of the world’s total delivered residential energy consumption in 2012. The United States is by far the largest consumer of residential energy in the OECD Americas, accounting for 84% of the OECD Americas total in
253 Total delivered energy used in the residential and commercial sectors includes electricity, natural gas, liquid fuels, coal, and marketed renewable energy (e.g., solar thermal energy).
0.6
0.1
0.4
0.7
0.9
1.1
1.7
1.9
0.0 0.5 1.0 1.5 2.0
Total OECD
United States
Japan
Canada
OECD Europe
South Korea
Australia/New Zealand
Mexico/Chile
Figure 6-1. Average annual change in OECD residential sector energy consumption, 2012–40 (percent per year)
U.S. Energy Information Administration | International Energy Outlook 2016102
Buildings sector energy consumption
2012 and 80% in 2040. Residential energy consumption in the United States remains steady between 2012 and 2040 as state and federal energy efficiency standards for consumer products, other efficiency programs, and sectoral changes offset drivers that would otherwise increase residential energy demand.Although they consume far less energy than the United States, the economies of Chile and Mexico grow more rapidly than the other parts of the OECD Americas from 2012 to 2040. The combined residential energy consumption of Mexico and Chile grows by an average of 1.9% annually from 2012 to 2040, compared with 0.1% in the United States. Mexico and Chile together have the highest projected growth rates in GDP (as measured in purchasing power parity terms) in the OECD region, at 3.1%/year from 2012 to 2040, compared with 2.0%/year for the OECD overall. This strong economic growth leads to improvement in standards of living and increased residential demand for space heating and air conditioning and other energy-consuming household products. In 2012, petroleum and other liquid fuels accounted for the largest share of residential energy use in Mexico and Chile (Figure 6-3). In the Reference case, their share declines from 55% in 2012 to 32% in 2040. Electricity becomes the major residential energy source for Mexico and Chile combined, increasing from 37% of their total energy use in 2012 to 60% in 2040.
OECD EuropeMany countries in OECD Europe have instituted measures to improve energy efficiency in the residential sector. Those efforts, along with relatively low economic growth and slow population growth, contribute to the slow increase in the region’s residential energy use through 2040. Households in OECD Europe accounted for 21% of the world’s total residential energy consumption in 2012, but their share falls to 18% in 2040 in the IEO2016 Reference case, with the region’s total residential sector energy demand increasing by an average of only 0.9%/year. Electricity is OECD Europe’s fastest-growing source of residential energy in the IEO2016 Reference case, with consumption growth averaging 1.4%/year from 2012 to 2040, while natural gas consumption grows at a rate of 1.0%/year.
OECD AsiaThe total residential demand for energy in OECD Asia increases by an average of 0.8%/year in the IEO Reference case. Japan accounts for the largest share of residential energy use in OECD Asia throughout the projection, although its share declines from 63% in 2012 to 56% in 2040. In Japan, residential sector energy consumption grows by 0.4% annually from 2012 to 2040 in the Reference case, with GDP growing by 0.6%/year and population declining by 0.4%/year. The residential sector accounts for more than one-third of total electricity consumption in Japan, mostly from the use of residential electronic appliances. Electricity remains Japan’s main residential energy source throughout the projection, increasing by 0.5%/year from 2012 to 2040.
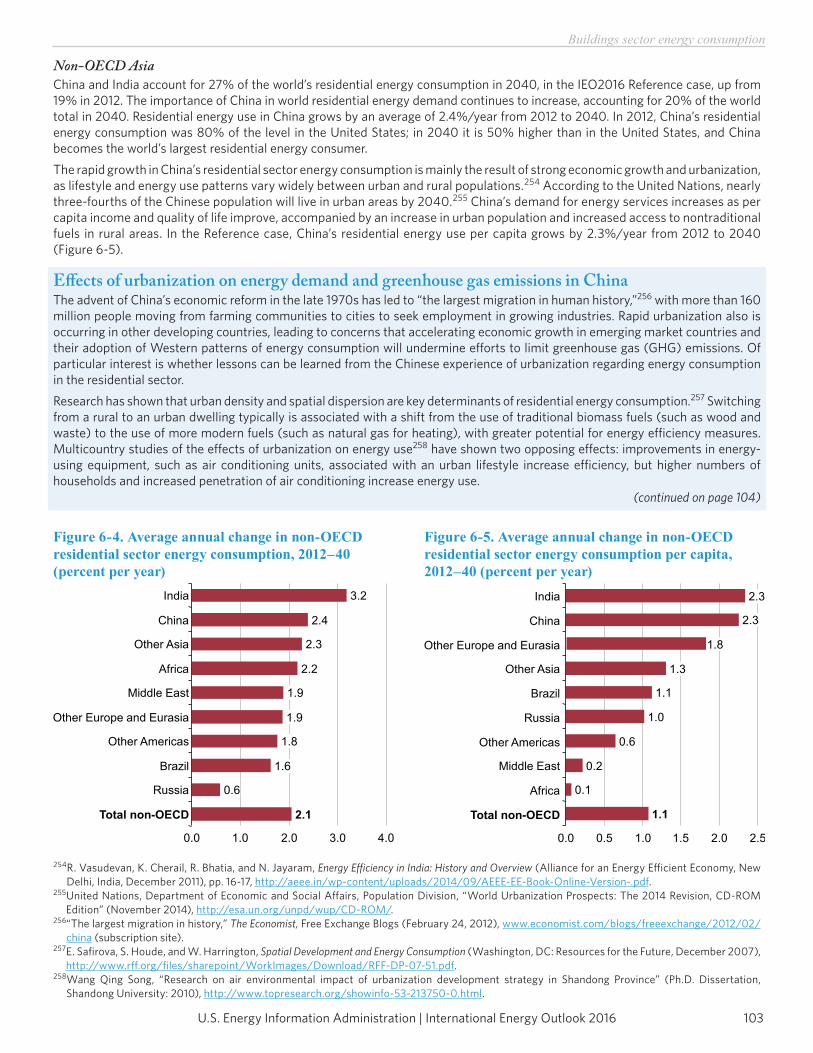
Non-OECD residential energy consumptionResidential energy consumption in the non-OECD countries accounted for less than 50% of the world’s total residential energy use in 2012. Their share grows to nearly 60% in 2040 in the IEO2016 Reference case, as a result of generally faster economic and population growth than in the OECD countries. Total residential sector demand for energy in the non-OECD countries increases by an average of 2.1%/year in the Reference case, led by an average annual increase of 3.2% in India from 2012 to 2040 (Figure 6-4). Electricity consumption leads the increase in non-OECD residential energy use. Electricity’s share grows from 31% in 2012 to 47% in 2040, as many emerging economies transition from traditional fuels to marketed fuels, and the quality of life improves with access to modern sources of energy, especially electricity.
0.2
-0.6
-0.2
0.4
0.7
0.8
0.9
1.1
-1.0 -0.5 0.0 0.5 1.0 1.5
Total OECD
United States
Canada
Australia/New Zealand
OECD Europe
Japan
South Korea
Mexico/Chile
Figure 6-2. Average annual change in OECD residential sector energy consumption per capita, 2012–40 (percent per year)
0%
20%
40%
60%
80%
100%
Mexico/Chile
Australia/New Zealand
SouthKorea
OECDEurope Japan
Renewables
Natural gas
Electricity
Liquids
Coal2012 20402012 2040 2012 2040 2012 2040 2012 2040
Figure 6-3. Residential sector energy consumption in selected OECD regions by energy source, 2012 and 2040 (percent of total)
103U.S. Energy Information Administration | International Energy Outlook 2016
Buildings sector energy consumption
Non-OECD AsiaChina and India account for 27% of the world’s residential energy consumption in 2040, in the IEO2016 Reference case, up from 19% in 2012. The importance of China in world residential energy demand continues to increase, accounting for 20% of the world total in 2040. Residential energy use in China grows by an average of 2.4%/year from 2012 to 2040. In 2012, China’s residential energy consumption was 80% of the level in the United States; in 2040 it is 50% higher than in the United States, and China becomes the world’s largest residential energy consumer.The rapid growth in China’s residential sector energy consumption is mainly the result of strong economic growth and urbanization, as lifestyle and energy use patterns vary widely between urban and rural populations.254 According to the United Nations, nearly three-fourths of the Chinese population will live in urban areas by 2040.255 China’s demand for energy services increases as per capita income and quality of life improve, accompanied by an increase in urban population and increased access to nontraditional fuels in rural areas. In the Reference case, China’s residential energy use per capita grows by 2.3%/year from 2012 to 2040 (Figure 6-5).
Effects of urbanization on energy demand and greenhouse gas emissions in ChinaThe advent of China’s economic reform in the late 1970s has led to “the largest migration in human history,”256 with more than 160 million people moving from farming communities to cities to seek employment in growing industries. Rapid urbanization also is occurring in other developing countries, leading to concerns that accelerating economic growth in emerging market countries and their adoption of Western patterns of energy consumption will undermine efforts to limit greenhouse gas (GHG) emissions. Of particular interest is whether lessons can be learned from the Chinese experience of urbanization regarding energy consumption in the residential sector.Research has shown that urban density and spatial dispersion are key determinants of residential energy consumption.257 Switching from a rural to an urban dwelling typically is associated with a shift from the use of traditional biomass fuels (such as wood and waste) to the use of more modern fuels (such as natural gas for heating), with greater potential for energy efficiency measures. Multicountry studies of the effects of urbanization on energy use258 have shown two opposing effects: improvements in energy-using equipment, such as air conditioning units, associated with an urban lifestyle increase efficiency, but higher numbers of households and increased penetration of air conditioning increase energy use.
254 R. Vasudevan, K. Cherail, R. Bhatia, and N. Jayaram, Energy Efficiency in India: History and Overview (Alliance for an Energy Efficient Economy, New Delhi, India, December 2011), pp. 16-17, http://aeee.in/wp-content/uploads/2014/09/AEEE-EE-Book-Online-Version-.pdf.
255 United Nations, Department of Economic and Social Affairs, Population Division, “World Urbanization Prospects: The 2014 Revision, CD-ROM Edition” (November 2014), http://esa.un.org/unpd/wup/CD-ROM/.
256 “The largest migration in history,” The Economist, Free Exchange Blogs (February 24, 2012), www.economist.com/blogs/freeexchange/2012/02/china (subscription site).
257 E. Safirova, S. Houde, and W. Harrington, Spatial Development and Energy Consumption (Washington, DC: Resources for the Future, December 2007), http://www.rff.org/files/sharepoint/WorkImages/Download/RFF-DP-07-51.pdf.
258 Wang Qing Song, “Research on air environmental impact of urbanization development strategy in Shandong Province” (Ph.D. Dissertation, Shandong University: 2010), http://www.topresearch.org/showinfo-53-213750-0.html.
2.1
0.6
1.6
1.8
1.9
1.9
2.2
2.3
2.4
3.2
0.0 1.0 2.0 3.0 4.0
Total non-OECD
Russia
Brazil
Other Americas
Other Europe and Eurasia
Middle East
Africa
Other Asia
China
India
Figure 6-4. Average annual change in non-OECD residential sector energy consumption, 2012–40 (percent per year)
1.1
0.1
0.2
0.6
1.0
1.1
1.3
1.8
2.3
2.3
0.0 0.5 1.0 1.5 2.0 2.5
Total non-OECD
Africa
Middle East
Other Americas
Russia
Brazil
Other Asia
Other Europe and Eurasia
China
India
Figure 6-5. Average annual change in non-OECD residential sector energy consumption per capita, 2012–40 (percent per year)
(continued on page 104)
U.S. Energy Information Administration | International Energy Outlook 2016104
Buildings sector energy consumption
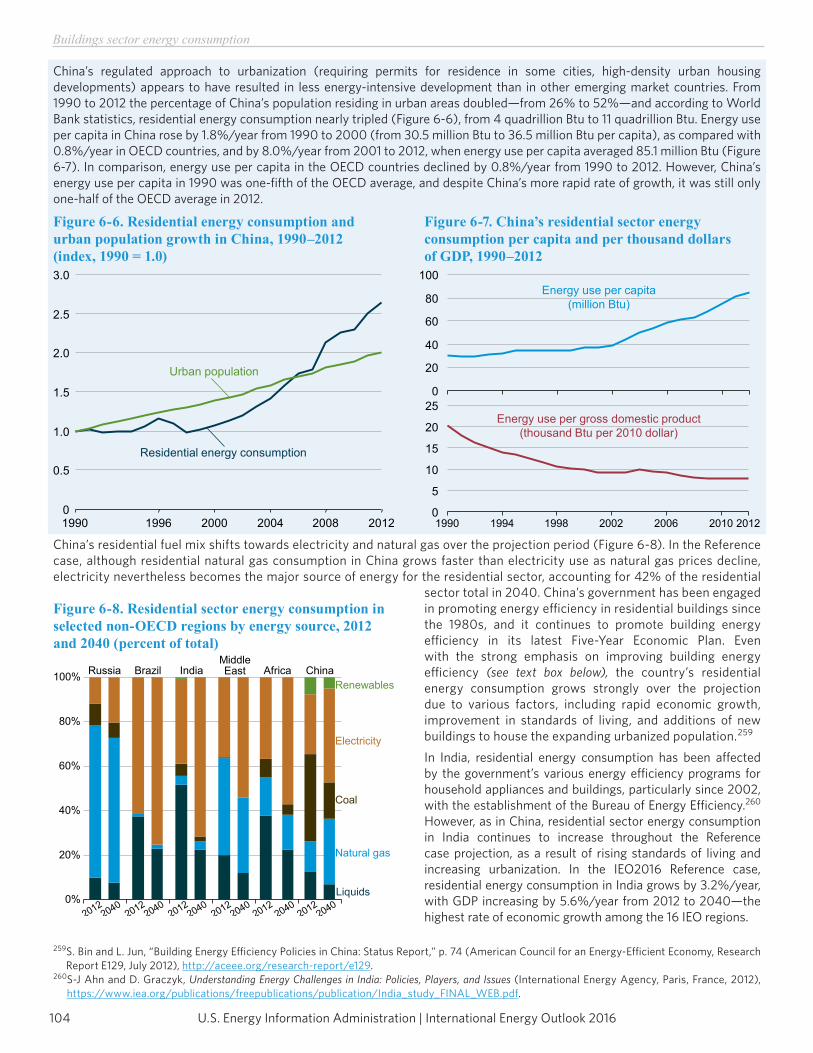
China’s regulated approach to urbanization (requiring permits for residence in some cities, high-density urban housing developments) appears to have resulted in less energy-intensive development than in other emerging market countries. From 1990 to 2012 the percentage of China’s population residing in urban areas doubled—from 26% to 52%—and according to World Bank statistics, residential energy consumption nearly tripled (Figure 6-6), from 4 quadrillion Btu to 11 quadrillion Btu. Energy use per capita in China rose by 1.8%/year from 1990 to 2000 (from 30.5 million Btu to 36.5 million Btu per capita), as compared with 0.8%/year in OECD countries, and by 8.0%/year from 2001 to 2012, when energy use per capita averaged 85.1 million Btu (Figure 6-7). In comparison, energy use per capita in the OECD countries declined by 0.8%/year from 1990 to 2012. However, China’s energy use per capita in 1990 was one-fifth of the OECD average, and despite China’s more rapid rate of growth, it was still only one-half of the OECD average in 2012.
China’s residential fuel mix shifts towards electricity and natural gas over the projection period (Figure 6-8). In the Reference case, although residential natural gas consumption in China grows faster than electricity use as natural gas prices decline, electricity nevertheless becomes the major source of energy for the residential sector, accounting for 42% of the residential
sector total in 2040. China’s government has been engaged in promoting energy efficiency in residential buildings since the 1980s, and it continues to promote building energy efficiency in its latest Five-Year Economic Plan. Even with the strong emphasis on improving building energy efficiency (see text box below), the country’s residential energy consumption grows strongly over the projection due to various factors, including rapid economic growth, improvement in standards of living, and additions of new buildings to house the expanding urbanized population.259 In India, residential energy consumption has been affected by the government’s various energy efficiency programs for household appliances and buildings, particularly since 2002, with the establishment of the Bureau of Energy Efficiency.260 However, as in China, residential sector energy consumption in India continues to increase throughout the Reference case projection, as a result of rising standards of living and increasing urbanization. In the IEO2016 Reference case, residential energy consumption in India grows by 3.2%/year, with GDP increasing by 5.6%/year from 2012 to 2040—the highest rate of economic growth among the 16 IEO regions.
259 S. Bin and L. Jun, “Building Energy Efficiency Policies in China: Status Report,” p. 74 (American Council for an Energy-Efficient Economy, Research Report E129, July 2012), http://aceee.org/research-report/e129.
260 S-J Ahn and D. Graczyk, Understanding Energy Challenges in India: Policies, Players, and Issues (International Energy Agency, Paris, France, 2012), https://www.iea.org/publications/freepublications/publication/India_study_FINAL_WEB.pdf.
Energy use per capita(million Btu)
0
20
40
60
80
100
Energy use per gross domestic product(thousand Btu per 2010 dollar)
0
5
10
15
20
25
1990 1994 1998 2002 2006 2010 2012
Figure 6-7. China’s residential sector energy consumption per capita and per thousand dollars of GDP, 1990–2012
0
0.5
1.0
1.5
2.0
2.5
3.0
1990 1996 2000 2004 2008 2012
Urban population
Residential energy consumption
Figure 6-6. Residential energy consumption and urban population growth in China, 1990–2012 (index, 1990 = 1.0)
0%
20%
40%
60%
80%
100% Russia Brazil IndiaMiddleEast Africa China
Renewables
Natural gas
Electricity
Liquids
Coal
Figure 6-8. Residential sector energy consumption in selected non-OECD regions by energy source, 2012 and 2040 (percent of total)
105U.S. Energy Information Administration | International Energy Outlook 2016
Buildings sector energy consumption
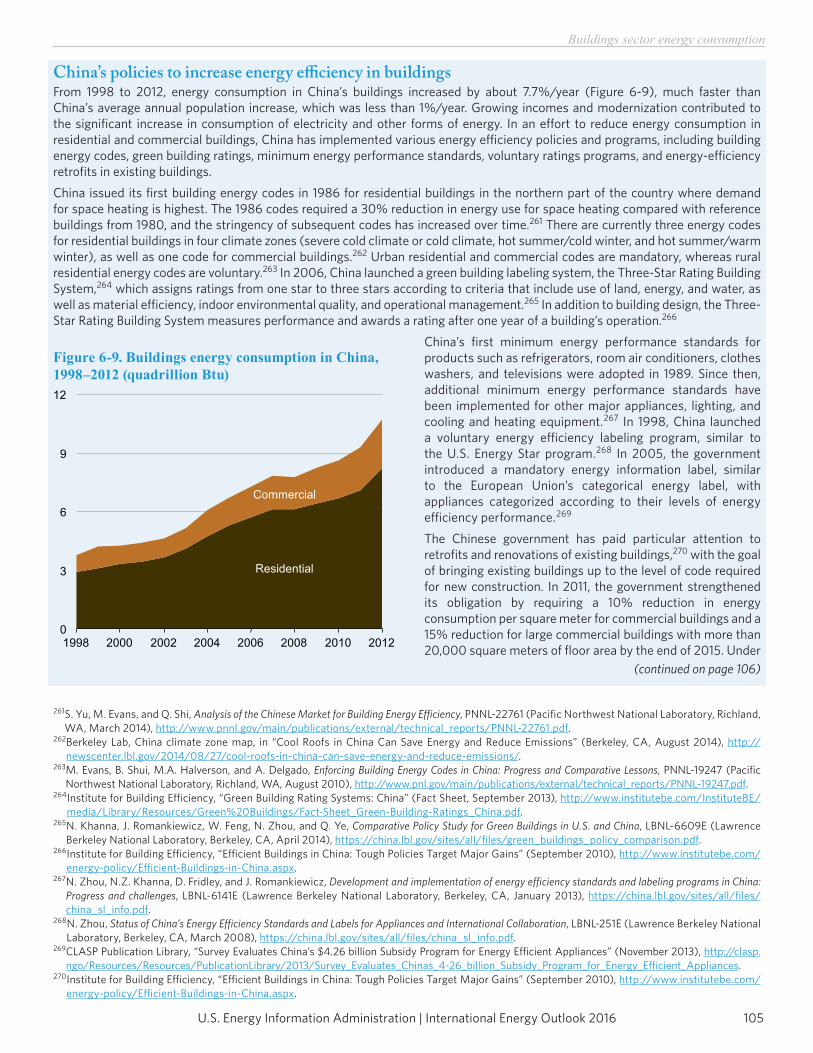
China’s policies to increase energy efficiency in buildingsFrom 1998 to 2012, energy consumption in China’s buildings increased by about 7.7%/year (Figure 6-9), much faster than China’s average annual population increase, which was less than 1%/year. Growing incomes and modernization contributed to the significant increase in consumption of electricity and other forms of energy. In an effort to reduce energy consumption in residential and commercial buildings, China has implemented various energy efficiency policies and programs, including building energy codes, green building ratings, minimum energy performance standards, voluntary ratings programs, and energy-efficiency retrofits in existing buildings.China issued its first building energy codes in 1986 for residential buildings in the northern part of the country where demand for space heating is highest. The 1986 codes required a 30% reduction in energy use for space heating compared with reference buildings from 1980, and the stringency of subsequent codes has increased over time.261 There are currently three energy codes for residential buildings in four climate zones (severe cold climate or cold climate, hot summer/cold winter, and hot summer/warm winter), as well as one code for commercial buildings.262 Urban residential and commercial codes are mandatory, whereas rural residential energy codes are voluntary.263 In 2006, China launched a green building labeling system, the Three-Star Rating Building System,264 which assigns ratings from one star to three stars according to criteria that include use of land, energy, and water, as well as material efficiency, indoor environmental quality, and operational management.265 In addition to building design, the Three-Star Rating Building System measures performance and awards a rating after one year of a building’s operation.266
China’s first minimum energy performance standards for products such as refrigerators, room air conditioners, clothes washers, and televisions were adopted in 1989. Since then, additional minimum energy performance standards have been implemented for other major appliances, lighting, and cooling and heating equipment.267 In 1998, China launched a voluntary energy efficiency labeling program, similar to the U.S. Energy Star program.268 In 2005, the government introduced a mandatory energy information label, similar to the European Union’s categorical energy label, with appliances categorized according to their levels of energy efficiency performance.269
The Chinese government has paid particular attention to retrofits and renovations of existing buildings,270 with the goal of bringing existing buildings up to the level of code required for new construction. In 2011, the government strengthened its obligation by requiring a 10% reduction in energy consumption per square meter for commercial buildings and a 15% reduction for large commercial buildings with more than 20,000 square meters of floor area by the end of 2015. Under
261 S. Yu, M. Evans, and Q. Shi, Analysis of the Chinese Market for Building Energy Efficiency, PNNL-22761 (Pacific Northwest National Laboratory, Richland, WA, March 2014), http://www.pnnl.gov/main/publications/external/technical_reports/PNNL-22761.pdf.
262 Berkeley Lab, China climate zone map, in “Cool Roofs in China Can Save Energy and Reduce Emissions” (Berkeley, CA, August 2014), http://newscenter.lbl.gov/2014/08/27/cool-roofs-in-china-can-save-energy-and-reduce-emissions/.
263 M. Evans, B. Shui, M.A. Halverson, and A. Delgado, Enforcing Building Energy Codes in China: Progress and Comparative Lessons, PNNL-19247 (Pacific Northwest National Laboratory, Richland, WA, August 2010), http://www.pnl.gov/main/publications/external/technical_reports/PNNL-19247.pdf.
264 Institute for Building Efficiency, “Green Building Rating Systems: China” (Fact Sheet, September 2013), http://www.institutebe.com/InstituteBE/media/Library/Resources/Green%20Buildings/Fact-Sheet_Green-Building-Ratings_China.pdf.
265 N. Khanna, J. Romankiewicz, W. Feng, N. Zhou, and Q. Ye, Comparative Policy Study for Green Buildings in U.S. and China, LBNL-6609E (Lawrence Berkeley National Laboratory, Berkeley, CA, April 2014), https://china.lbl.gov/sites/all/files/green_buildings_policy_comparison.pdf.
266 Institute for Building Efficiency, “Efficient Buildings in China: Tough Policies Target Major Gains” (September 2010), http://www.institutebe.com/energy-policy/Efficient-Buildings-in-China.aspx.
267 N. Zhou, N.Z. Khanna, D. Fridley, and J. Romankiewicz, Development and implementation of energy efficiency standards and labeling programs in China: Progress and challenges, LBNL-6141E (Lawrence Berkeley National Laboratory, Berkeley, CA, January 2013), https://china.lbl.gov/sites/all/files/china_sl_info.pdf.
268 N. Zhou, Status of China’s Energy Efficiency Standards and Labels for Appliances and International Collaboration, LBNL-251E (Lawrence Berkeley National Laboratory, Berkeley, CA, March 2008), https://china.lbl.gov/sites/all/files/china_sl_info.pdf.
269 CLASP Publication Library, “Survey Evaluates China’s $4.26 billion Subsidy Program for Energy Efficient Appliances” (November 2013), http://clasp.ngo/Resources/Resources/PublicationLibrary/2013/Survey_Evaluates_Chinas_4-26_billion_Subsidy_Program_for_Energy_Efficient_Appliances.
270 Institute for Building Efficiency, “Efficient Buildings in China: Tough Policies Target Major Gains” (September 2010), http://www.institutebe.com/energy-policy/Efficient-Buildings-in-China.aspx.
0
3
6
9
12
1998 2000 2002 2004 2006 2008 2010 2012
Commercial
Residential
Figure 6-9. Buildings energy consumption in China, 1998–2012 (quadrillion Btu)
(continued on page 106)
U.S. Energy Information Administration | International Energy Outlook 2016106
Buildings sector energy consumption
the Green Building Action Plan of 2013, more than 400 million square feet in residential homes were to be retrofitted by the end of 2015, and all eligible commercial buildings in the northern heating zone were to be retrofitted by the end of 2020.271
Energy demand from China’s buildings is expected to continue to grow as a result of urbanization, further increases in disposable income per capita, and demand for more comforts and services. Upgrades of building energy efficiency performance standards, new technology development, education and awareness programs, enforcement of energy efficiency policies, and improved compliance could each play a role in reducing future rates of growth in China’s energy consumption.
In the IEO2016 Reference case, India’s residential sector fuel mix transitions from mainly liquid fuels to mainly electricity. Electricity is used mostly for appliances; in 2010 ceiling fans and lighting accounted for nearly 62% of India’s total residential electricity consumption, and refrigeration accounted for 13%.272 As incomes increase and more people have access to electricity, the ownership of appliances powered by electricity also increases.273 Consequently, electricity demand grows faster than total residential energy demand over the projection period: 5.5%/year compared with 3.2%/year.
Non-OECD Europe and EurasiaRussia is the largest economy in non-OECD Europe and Eurasia. In the IEO2016 Reference case, Russia’s residential sector energy consumption grows by an average of 0.6%/year and accounts for about 50% of the region’s total residential energy consumption in 2040. Although its population is expected to decline by an average of 0.4%/year from 2012 to 2040, increases in urbanization and GDP growth of about 2.0%/year contribute to an increase in Russia’s residential energy use over that period.274
On a per capita basis, Russia currently leads the non-OECD countries in residential energy consumption, and its residential sector total continues to grow in the IEO2016 Reference case by 0.6%/year. Inefficient building designs and heating systems, along with the cold climate in much of Russia, are among the factors leading to high per capita energy consumption.275 To improve the energy efficiency of residential buildings, the Russian government passed an Energy Efficiency Law in November 2009 that included mandated metering in new buildings, as well as other measures aimed at measuring building efficiency.276 Although the IEO2016 Reference case assumes some improvements in Russia’s energy efficiency, economic growth of 2.0%/year over the projection period results in rising living standards and more demand for energy-consuming appliances and equipment, offsetting some of the savings and resulting in increased residential energy use through 2040.
Other non-OECDThe countries of the Middle East accounted for about 6.6% of total world residential energy consumption in 2012. The region’s population accounted for 3.0% of the 2012 world total, but it is projected to grow by an average of 1.7%/year—far greater than the world average population increase of 0.9%/year. Although there are wide variations in income among the countries of the Middle East, the region’s overall economy is projected to grow by 3.7%/year from 2012 to 2040 in the IEO2016 Reference case. Residential energy consumption in the region increases by an average of 1.9%/year in the Reference case. In the residential sector, electricity becomes the main source of energy, as its share of the fuel mix increases from 36% to 53% while the natural gas share declines from 44% to 34%. The increase in electricity results largely from higher demand for electric appliances, particularly air conditioners for space cooling.Residential energy consumption in Africa increases by 2.2%/year from 2012 to 2040 in the Reference case. Much of the continent is still not connected to a power grid, relying heavily on traditional nonmarketed biomass as an energy source. In 2012, Africa accounted for about 15% of world population but only 3.5% of world marketed residential energy consumption. In the Reference case in 2040, Africa’s share of world population rises to 21%, and its share of residential energy consumption rises to 4.3%. Energy consumption per capita is low in the region and is projected to remain nearly flat through 2040. Africa has the second-highest projected rate of GDP growth in the world in the IEO2016 Reference case, averaging 4.8%/year from 2012 to 2040.In Brazil, the largest economy in the non-OECD Americas region, residential energy consumption increases by 1.6%/year from 2012 to 2040 in the Reference case. Brazil’s household fuel mix continues to move away from liquid fuels toward electricity, and electricity remains the leading source of energy, followed by liquid fuels, throughout the projection period. Electricity’s share of residential sector energy consumption grows from 61% in 2012 to 75% in 2040, while the liquid fuels share declines by more than one-third, from 37% to 24% over that period.271 S. Yu, M. Evans, and Q. Shi, Analysis of the Chinese Market for Building Energy Efficiency, PNNL-22761 (Pacific Northwest National Laboratory, Richland,
WA, March 2014), http://www.pnnl.gov/main/publications/external/technical_reports/PNNL-22761.pdf.272 R. Rawal and Y. Shukla, Residential Buildings in India: Energy Use Projections and Savings Potentials (Global Buildings Performance Network, Paris,
France, September 2014), p. 16, http://www.gbpn.org/sites/default/files/08.%20INDIA%20Baseline_TR_low.pdf.273 S. de la Rue du Can, et al., Residential and Transportation Energy Use in India: Past Trend and Future Outlook (Berkeley, CA: Ernest Orlando Lawrence
Berkeley National Laboratory, January 2009), http://eetd.lbl.gov/sites/all/files/lbnl-1753e.pdf.274 Asia Pacific Energy Research Centre, APEC Energy Demand and Supply Outlook 2006: Economy Review (Japan: Institute of Energy Economics, 2006),
pp. 79-84, http://aperc.ieej.or.jp/file/2010/9/24/EDSO2006_Whole_Report.pdf.275 T. Lychuk, M. Evans, M. Halverson, and V. Roshchanka, Analysis of the Russian Market for Building Energy Efficiency, PNNL-22110 (Richland, WA: Pacific
Northwest National Laboratory, December 2012) p. 2, http://www.pnnl.gov/main/publications/external/technical_reports/PNNL-22110.pdf.276 K.V. Bruk, “Energy Efficiency Laws in Russia – Starting the Journey,” The Moscow Times (April 10, 2012), http://www.themoscowtimes.com/article/
energy-efficiency-laws-in-russia--starting-the-journey/456427.html.
107U.S. Energy Information Administration | International Energy Outlook 2016
Buildings sector energy consumption
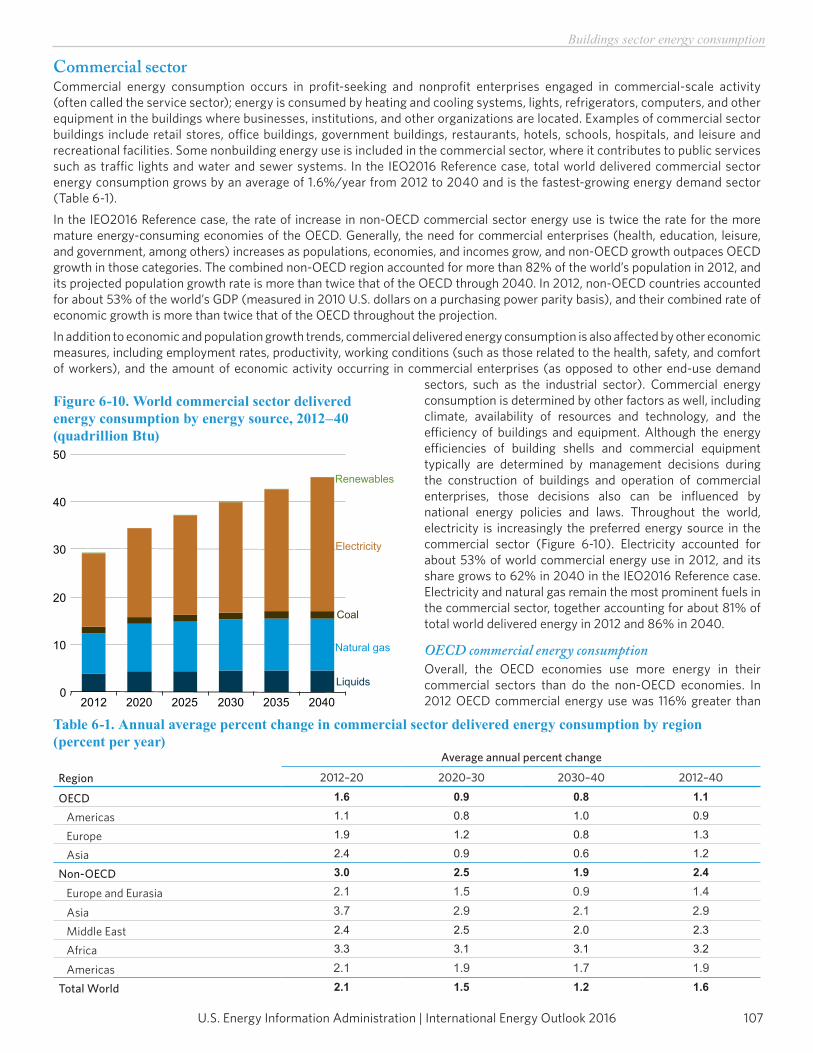
Commercial sectorCommercial energy consumption occurs in profit-seeking and nonprofit enterprises engaged in commercial-scale activity (often called the service sector); energy is consumed by heating and cooling systems, lights, refrigerators, computers, and other equipment in the buildings where businesses, institutions, and other organizations are located. Examples of commercial sector buildings include retail stores, office buildings, government buildings, restaurants, hotels, schools, hospitals, and leisure and recreational facilities. Some nonbuilding energy use is included in the commercial sector, where it contributes to public services such as traffic lights and water and sewer systems. In the IEO2016 Reference case, total world delivered commercial sector energy consumption grows by an average of 1.6%/year from 2012 to 2040 and is the fastest-growing energy demand sector (Table 6-1).In the IEO2016 Reference case, the rate of increase in non-OECD commercial sector energy use is twice the rate for the more mature energy-consuming economies of the OECD. Generally, the need for commercial enterprises (health, education, leisure, and government, among others) increases as populations, economies, and incomes grow, and non-OECD growth outpaces OECD growth in those categories. The combined non-OECD region accounted for more than 82% of the world’s population in 2012, and its projected population growth rate is more than twice that of the OECD through 2040. In 2012, non-OECD countries accounted for about 53% of the world’s GDP (measured in 2010 U.S. dollars on a purchasing power parity basis), and their combined rate of economic growth is more than twice that of the OECD throughout the projection.In addition to economic and population growth trends, commercial delivered energy consumption is also affected by other economic measures, including employment rates, productivity, working conditions (such as those related to the health, safety, and comfort of workers), and the amount of economic activity occurring in commercial enterprises (as opposed to other end-use demand
sectors, such as the industrial sector). Commercial energy consumption is determined by other factors as well, including climate, availability of resources and technology, and the efficiency of buildings and equipment. Although the energy efficiencies of building shells and commercial equipment typically are determined by management decisions during the construction of buildings and operation of commercial enterprises, those decisions also can be influenced by national energy policies and laws. Throughout the world, electricity is increasingly the preferred energy source in the commercial sector (Figure 6-10). Electricity accounted for about 53% of world commercial energy use in 2012, and its share grows to 62% in 2040 in the IEO2016 Reference case. Electricity and natural gas remain the most prominent fuels in the commercial sector, together accounting for about 81% of total world delivered energy in 2012 and 86% in 2040.
OECD commercial energy consumptionOverall, the OECD economies use more energy in their commercial sectors than do the non-OECD economies. In 2012 OECD commercial energy use was 116% greater than
Table 6-1. Annual average percent change in commercial sector delivered energy consumption by region (percent per year)
Region
Average annual percent change
2012–20 2020–30 2030–40 2012–40
OECD 1.6 0.9 0.8 1.1
Americas 1.1 0.8 1.0 0.9
Europe 1.9 1.2 0.8 1.3
Asia 2.4 0.9 0.6 1.2
Non-OECD 3.0 2.5 1.9 2.4
Europe and Eurasia 2.1 1.5 0.9 1.4
Asia 3.7 2.9 2.1 2.9
Middle East 2.4 2.5 2.0 2.3
Africa 3.3 3.1 3.1 3.2
Americas 2.1 1.9 1.7 1.9
Total World 2.1 1.5 1.2 1.6
0
10
20
30
40
50
2012 2020 2025 2030 2035 2040
Renewables
Natural gas
Electricity
Liquids
Coal
Figure 6-10. World commercial sector delivered energy consumption by energy source, 2012–40 (quadrillion Btu)
U.S. Energy Information Administration | International Energy Outlook 2016108
Buildings sector energy consumption
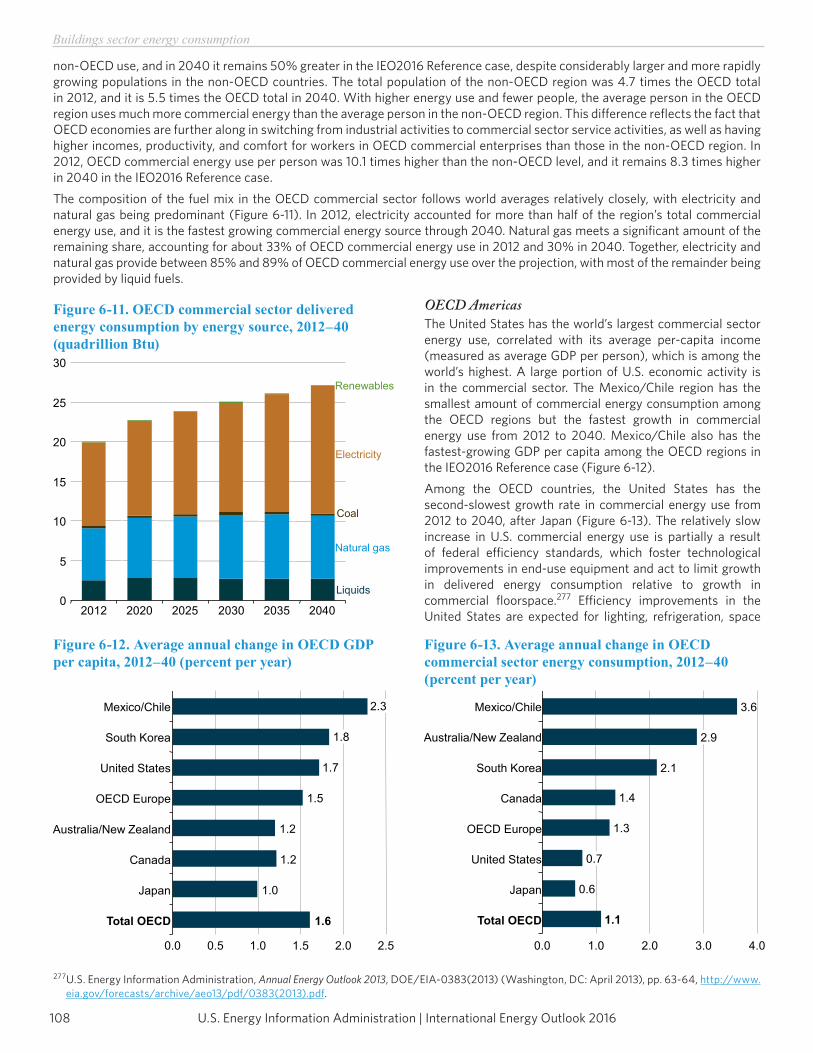
non-OECD use, and in 2040 it remains 50% greater in the IEO2016 Reference case, despite considerably larger and more rapidly growing populations in the non-OECD countries. The total population of the non-OECD region was 4.7 times the OECD total in 2012, and it is 5.5 times the OECD total in 2040. With higher energy use and fewer people, the average person in the OECD region uses much more commercial energy than the average person in the non-OECD region. This difference reflects the fact that OECD economies are further along in switching from industrial activities to commercial sector service activities, as well as having higher incomes, productivity, and comfort for workers in OECD commercial enterprises than those in the non-OECD region. In 2012, OECD commercial energy use per person was 10.1 times higher than the non-OECD level, and it remains 8.3 times higher in 2040 in the IEO2016 Reference case.The composition of the fuel mix in the OECD commercial sector follows world averages relatively closely, with electricity and natural gas being predominant (Figure 6-11). In 2012, electricity accounted for more than half of the region’s total commercial energy use, and it is the fastest growing commercial energy source through 2040. Natural gas meets a significant amount of the remaining share, accounting for about 33% of OECD commercial energy use in 2012 and 30% in 2040. Together, electricity and natural gas provide between 85% and 89% of OECD commercial energy use over the projection, with most of the remainder being provided by liquid fuels.
OECD AmericasThe United States has the world’s largest commercial sector energy use, correlated with its average per-capita income (measured as average GDP per person), which is among the world’s highest. A large portion of U.S. economic activity is in the commercial sector. The Mexico/Chile region has the smallest amount of commercial energy consumption among the OECD regions but the fastest growth in commercial energy use from 2012 to 2040. Mexico/Chile also has the fastest-growing GDP per capita among the OECD regions in the IEO2016 Reference case (Figure 6-12).Among the OECD countries, the United States has the second-slowest growth rate in commercial energy use from 2012 to 2040, after Japan (Figure 6-13). The relatively slow increase in U.S. commercial energy use is partially a result of federal efficiency standards, which foster technological improvements in end-use equipment and act to limit growth in delivered energy consumption relative to growth in commercial floorspace.277 Efficiency improvements in the United States are expected for lighting, refrigeration, space
277 U.S. Energy Information Administration, Annual Energy Outlook 2013, DOE/EIA-0383(2013) (Washington, DC: April 2013), pp. 63-64, http://www.eia.gov/forecasts/archive/aeo13/pdf/0383(2013).pdf.
Total OECD
Japan
Canada
Australia/New Zealand
OECD Europe
United States
South Korea
Mexico/Chile
0.0 0.5 1.0 1.5 2.0 2.5
2.3
1.8
1.7
1.5
1.2
1.2
1.0
1.6
Figure 6-12. Average annual change in OECD GDP per capita, 2012–40 (percent per year)
0
5
10
15
20
25
30
2012 2020 2025 2030 2035 2040
Renewables
Natural gas
Electricity
Liquids
Coal
Figure 6-11. OECD commercial sector delivered energy consumption by energy source, 2012–40 (quadrillion Btu)
Total OECD
Japan
United States
OECD Europe
Canada
South Korea
Australia/New Zealand
Mexico/Chile
0.0 1.0 2.0 3.0 4.0
1.1
0.6
0.7
1.3
1.4
2.1
2.9
3.6
Figure 6-13. Average annual change in OECD commercial sector energy consumption, 2012–40 (percent per year)
109U.S. Energy Information Administration | International Energy Outlook 2016
Buildings sector energy consumption
cooling, and space heating as a result of the Energy Independence and Security Act of 2007 (EISA2007) and the Energy Policy Act of 2005.
OECD EuropeCommercial sector energy use in OECD Europe increases by 1.3%/year in the IEO2016 Reference case. OECD Europe has an established history of efficiency initiatives and, among OECD regions, used the lowest amount of energy per unit of economic output (GDP) in 2012. The October 2012 enactment of the European Union’s Energy Efficiency Directive improves energy efficiency in the buildings sector.278 In addition, a number of individual countries in OECD Europe have introduced initiatives to improve energy efficiency in the commercial sector. For example, the Netherlands strengthened its building standards in 2009, requiring newly constructed or renovated nonresidential buildings to be 40% more energy-efficient than previous standards.279
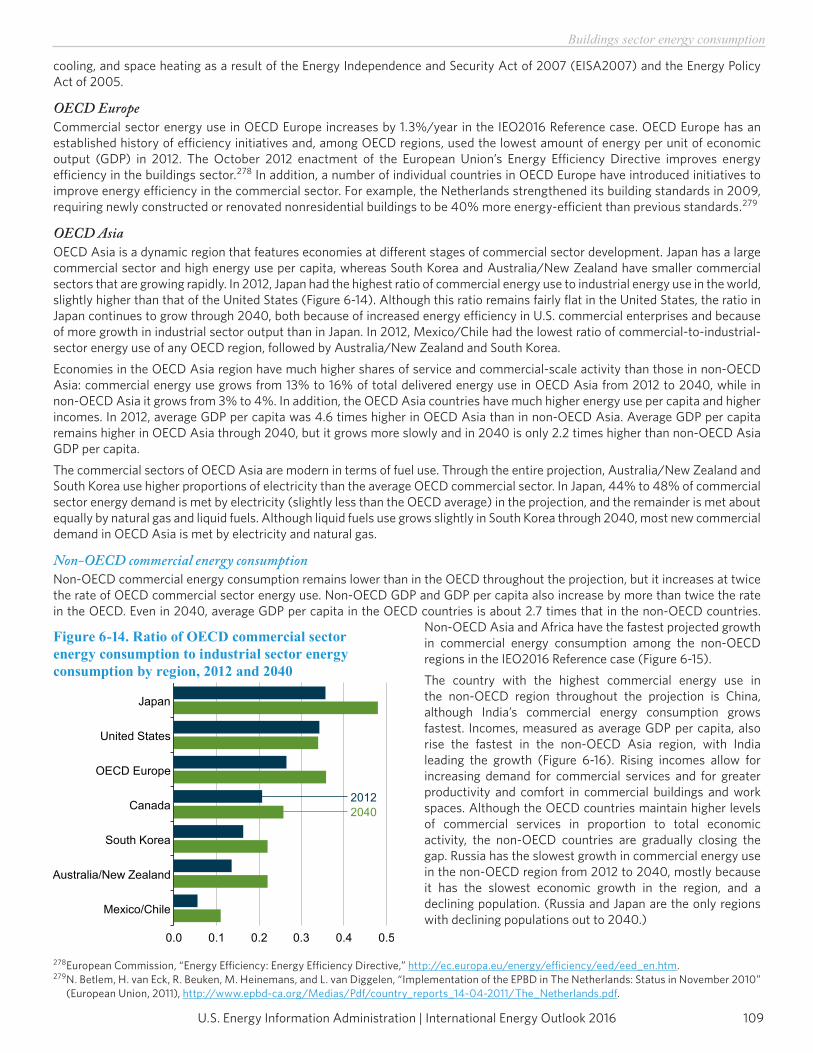
OECD AsiaOECD Asia is a dynamic region that features economies at different stages of commercial sector development. Japan has a large commercial sector and high energy use per capita, whereas South Korea and Australia/New Zealand have smaller commercial sectors that are growing rapidly. In 2012, Japan had the highest ratio of commercial energy use to industrial energy use in the world, slightly higher than that of the United States (Figure 6-14). Although this ratio remains fairly flat in the United States, the ratio in Japan continues to grow through 2040, both because of increased energy efficiency in U.S. commercial enterprises and because of more growth in industrial sector output than in Japan. In 2012, Mexico/Chile had the lowest ratio of commercial-to-industrial-sector energy use of any OECD region, followed by Australia/New Zealand and South Korea.
Economies in the OECD Asia region have much higher shares of service and commercial-scale activity than those in non-OECD Asia: commercial energy use grows from 13% to 16% of total delivered energy use in OECD Asia from 2012 to 2040, while in non-OECD Asia it grows from 3% to 4%. In addition, the OECD Asia countries have much higher energy use per capita and higher incomes. In 2012, average GDP per capita was 4.6 times higher in OECD Asia than in non-OECD Asia. Average GDP per capita remains higher in OECD Asia through 2040, but it grows more slowly and in 2040 is only 2.2 times higher than non-OECD Asia GDP per capita.The commercial sectors of OECD Asia are modern in terms of fuel use. Through the entire projection, Australia/New Zealand and South Korea use higher proportions of electricity than the average OECD commercial sector. In Japan, 44% to 48% of commercial sector energy demand is met by electricity (slightly less than the OECD average) in the projection, and the remainder is met about equally by natural gas and liquid fuels. Although liquid fuels use grows slightly in South Korea through 2040, most new commercial demand in OECD Asia is met by electricity and natural gas.
Non-OECD commercial energy consumptionNon-OECD commercial energy consumption remains lower than in the OECD throughout the projection, but it increases at twice the rate of OECD commercial sector energy use. Non-OECD GDP and GDP per capita also increase by more than twice the rate in the OECD. Even in 2040, average GDP per capita in the OECD countries is about 2.7 times that in the non-OECD countries.
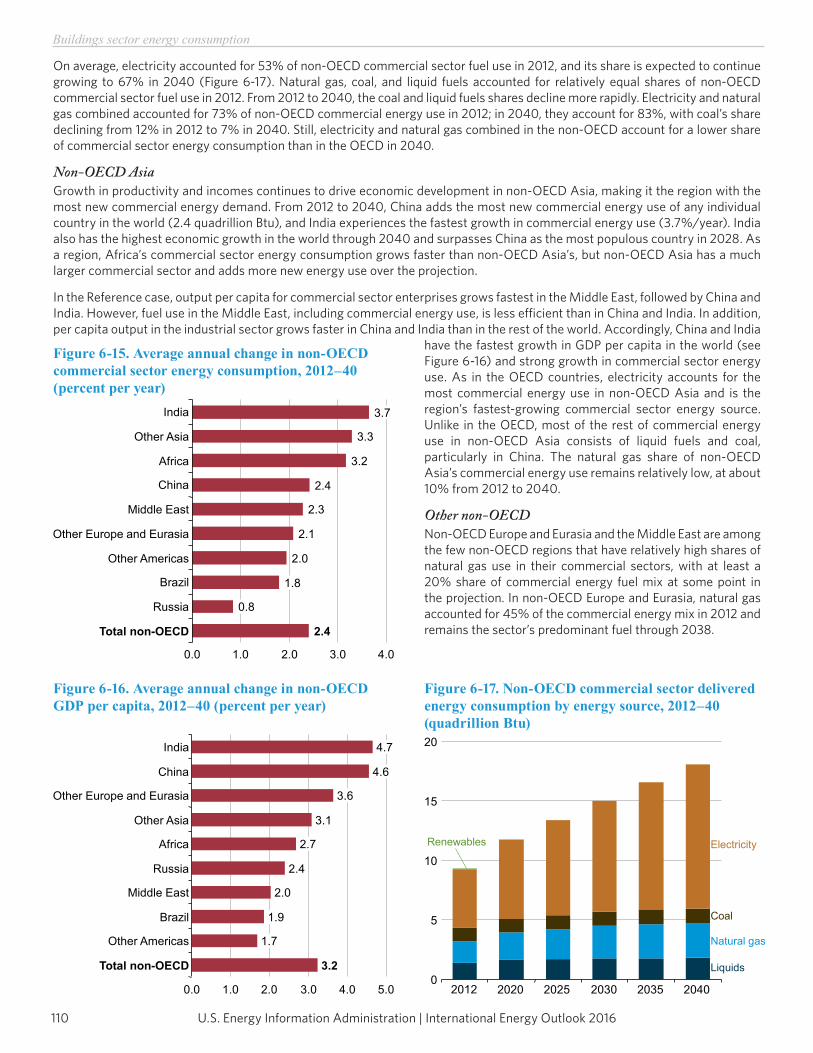
Non-OECD Asia and Africa have the fastest projected growth in commercial energy consumption among the non-OECD regions in the IEO2016 Reference case (Figure 6-15).The country with the highest commercial energy use in the non-OECD region throughout the projection is China, although India’s commercial energy consumption grows fastest. Incomes, measured as average GDP per capita, also rise the fastest in the non-OECD Asia region, with India leading the growth (Figure 6-16). Rising incomes allow for increasing demand for commercial services and for greater productivity and comfort in commercial buildings and work spaces. Although the OECD countries maintain higher levels of commercial services in proportion to total economic activity, the non-OECD countries are gradually closing the gap. Russia has the slowest growth in commercial energy use in the non-OECD region from 2012 to 2040, mostly because it has the slowest economic growth in the region, and a declining population. (Russia and Japan are the only regions with declining populations out to 2040.)
278 European Commission, “Energy Efficiency: Energy Efficiency Directive,” http://ec.europa.eu/energy/efficiency/eed/eed_en.htm.279 N. Betlem, H. van Eck, R. Beuken, M. Heinemans, and L. van Diggelen, “Implementation of the EPBD in The Netherlands: Status in November 2010”
(European Union, 2011), http://www.epbd-ca.org/Medias/Pdf/country_reports_14-04-2011/The_Netherlands.pdf.
0.0 0.1 0.2 0.3 0.4 0.5
Mexico/Chile
Australia/New Zealand
South Korea
Canada
OECD Europe
United States
Japan
20122040
Figure 6-14. Ratio of OECD commercial sector energy consumption to industrial sector energy consumption by region, 2012 and 2040
U.S. Energy Information Administration | International Energy Outlook 2016110
Buildings sector energy consumption
On average, electricity accounted for 53% of non-OECD commercial sector fuel use in 2012, and its share is expected to continue growing to 67% in 2040 (Figure 6-17). Natural gas, coal, and liquid fuels accounted for relatively equal shares of non-OECD commercial sector fuel use in 2012. From 2012 to 2040, the coal and liquid fuels shares decline more rapidly. Electricity and natural gas combined accounted for 73% of non-OECD commercial energy use in 2012; in 2040, they account for 83%, with coal’s share declining from 12% in 2012 to 7% in 2040. Still, electricity and natural gas combined in the non-OECD account for a lower share of commercial sector energy consumption than in the OECD in 2040.
Non-OECD AsiaGrowth in productivity and incomes continues to drive economic development in non-OECD Asia, making it the region with the most new commercial energy demand. From 2012 to 2040, China adds the most new commercial energy use of any individual country in the world (2.4 quadrillion Btu), and India experiences the fastest growth in commercial energy use (3.7%/year). India also has the highest economic growth in the world through 2040 and surpasses China as the most populous country in 2028. As a region, Africa’s commercial sector energy consumption grows faster than non-OECD Asia’s, but non-OECD Asia has a much larger commercial sector and adds more new energy use over the projection.
In the Reference case, output per capita for commercial sector enterprises grows fastest in the Middle East, followed by China and India. However, fuel use in the Middle East, including commercial energy use, is less efficient than in China and India. In addition, per capita output in the industrial sector grows faster in China and India than in the rest of the world. Accordingly, China and India
have the fastest growth in GDP per capita in the world (see Figure 6-16) and strong growth in commercial sector energy use. As in the OECD countries, electricity accounts for the most commercial energy use in non-OECD Asia and is the region’s fastest-growing commercial sector energy source. Unlike in the OECD, most of the rest of commercial energy use in non-OECD Asia consists of liquid fuels and coal, particularly in China. The natural gas share of non-OECD Asia’s commercial energy use remains relatively low, at about 10% from 2012 to 2040.
Other non-OECDNon-OECD Europe and Eurasia and the Middle East are among the few non-OECD regions that have relatively high shares of natural gas use in their commercial sectors, with at least a 20% share of commercial energy fuel mix at some point in the projection. In non-OECD Europe and Eurasia, natural gas accounted for 45% of the commercial energy mix in 2012 and remains the sector’s predominant fuel through 2038.2.4
0.8
1.8
2.0
2.1
2.3
2.4
3.2
3.3
3.7
0.0 1.0 2.0 3.0 4.0
Total non-OECD
Russia
Brazil
Other Americas
Other Europe and Eurasia
Middle East
China
Africa
Other Asia
India
Figure 6-15. Average annual change in non-OECD commercial sector energy consumption, 2012–40 (percent per year)
3.2
1.7
1.9
2.0
2.4
2.7
3.1
3.6
4.6
4.7
0.0 1.0 2.0 3.0 4.0 5.0
Total non-OECD
Other Americas
Brazil
Middle East
Russia
Africa
Other Asia
Other Europe and Eurasia
China
India
Figure 6-16. Average annual change in non-OECD GDP per capita, 2012–40 (percent per year)
Renewables
Natural gas
Electricity
Liquids0
5
10
15
20
2012 2020 2025 2030 2035 2040
Coal
Figure 6-17. Non-OECD commercial sector delivered energy consumption by energy source, 2012–40 (quadrillion Btu)
111U.S. Energy Information Administration | International Energy Outlook 2016
Buildings sector energy consumption
In Brazil, commercial sector energy use is dominated by electricity, which accounted for 92% of the country’s commercial energy use in 2012 and will account for 93% in 2040 in the Reference case. However, as a result of concern about overreliance on electricity in the aftermath of a severe drought that resulted in electricity shortages and a national energy emergency, the Brazilian government in 2001 enacted a Law of Energy Efficiency280 and in 2009 released energy efficiency rules for commercial buildings in an effort to improve energy efficiency. The goal of the 2009 initiative is to manage growth in energy consumption through improvements in commercial building shells, heating and cooling systems, and lighting.
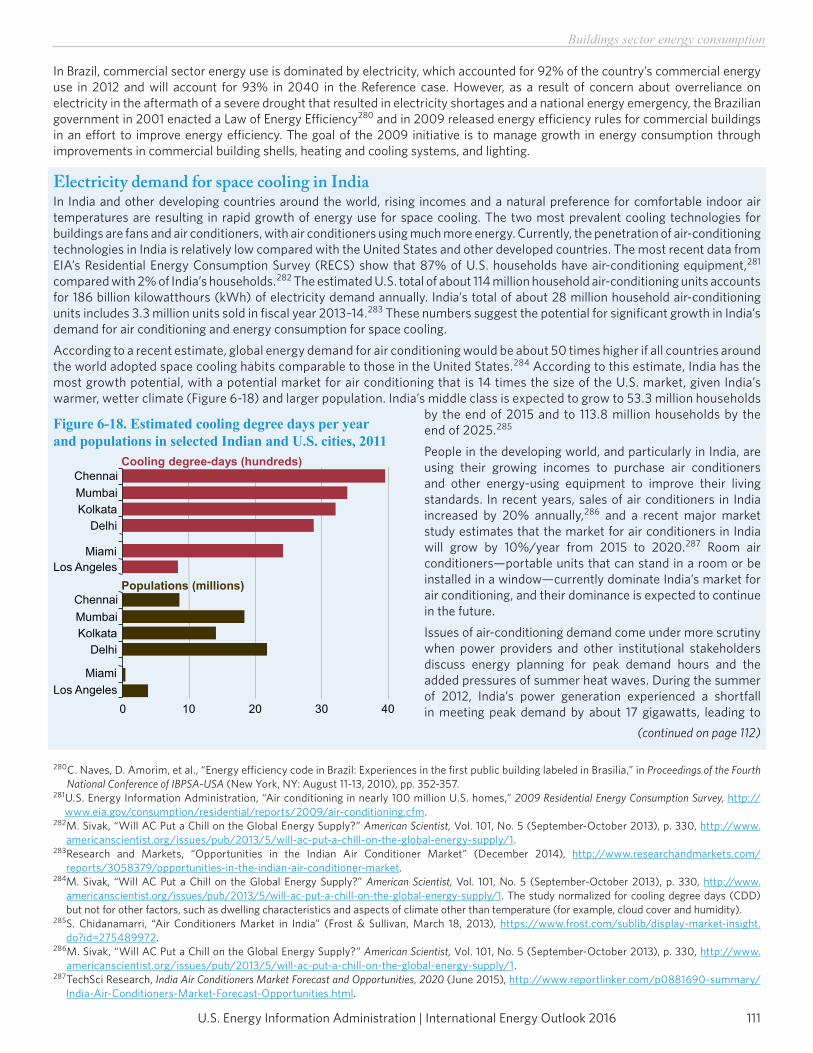
Electricity demand for space cooling in IndiaIn India and other developing countries around the world, rising incomes and a natural preference for comfortable indoor air temperatures are resulting in rapid growth of energy use for space cooling. The two most prevalent cooling technologies for buildings are fans and air conditioners, with air conditioners using much more energy. Currently, the penetration of air-conditioning technologies in India is relatively low compared with the United States and other developed countries. The most recent data from EIA’s Residential Energy Consumption Survey (RECS) show that 87% of U.S. households have air-conditioning equipment,281 compared with 2% of India’s households.282 The estimated U.S. total of about 114 million household air-conditioning units accounts for 186 billion kilowatthours (kWh) of electricity demand annually. India’s total of about 28 million household air-conditioning units includes 3.3 million units sold in fiscal year 2013–14.283 These numbers suggest the potential for significant growth in India’s demand for air conditioning and energy consumption for space cooling.According to a recent estimate, global energy demand for air conditioning would be about 50 times higher if all countries around the world adopted space cooling habits comparable to those in the United States.284 According to this estimate, India has the most growth potential, with a potential market for air conditioning that is 14 times the size of the U.S. market, given India’s warmer, wetter climate (Figure 6-18) and larger population. India’s middle class is expected to grow to 53.3 million households
by the end of 2015 and to 113.8 million households by the end of 2025.285
People in the developing world, and particularly in India, are using their growing incomes to purchase air conditioners and other energy-using equipment to improve their living standards. In recent years, sales of air conditioners in India increased by 20% annually,286 and a recent major market study estimates that the market for air conditioners in India will grow by 10%/year from 2015 to 2020.287 Room air conditioners—portable units that can stand in a room or be installed in a window—currently dominate India’s market for air conditioning, and their dominance is expected to continue in the future.Issues of air-conditioning demand come under more scrutiny when power providers and other institutional stakeholders discuss energy planning for peak demand hours and the added pressures of summer heat waves. During the summer of 2012, India’s power generation experienced a shortfall in meeting peak demand by about 17 gigawatts, leading to
280 C. Naves, D. Amorim, et al., “Energy efficiency code in Brazil: Experiences in the first public building labeled in Brasilia,” in Proceedings of the Fourth National Conference of IBPSA-USA (New York, NY: August 11-13, 2010), pp. 352-357.
281 U.S. Energy Information Administration, “Air conditioning in nearly 100 million U.S. homes,” 2009 Residential Energy Consumption Survey, http://www.eia.gov/consumption/residential/reports/2009/air-conditioning.cfm.
282 M. Sivak, “Will AC Put a Chill on the Global Energy Supply?” American Scientist, Vol. 101, No. 5 (September-October 2013), p. 330, http://www.americanscientist.org/issues/pub/2013/5/will-ac-put-a-chill-on-the-global-energy-supply/1.
283 Research and Markets, “Opportunities in the Indian Air Conditioner Market” (December 2014), http://www.researchandmarkets.com/reports/3058379/opportunities-in-the-indian-air-conditioner-market.
284 M. Sivak, “Will AC Put a Chill on the Global Energy Supply?” American Scientist, Vol. 101, No. 5 (September-October 2013), p. 330, http://www.americanscientist.org/issues/pub/2013/5/will-ac-put-a-chill-on-the-global-energy-supply/1. The study normalized for cooling degree days (CDD) but not for other factors, such as dwelling characteristics and aspects of climate other than temperature (for example, cloud cover and humidity).
285 S. Chidanamarri, “Air Conditioners Market in India” (Frost & Sullivan, March 18, 2013), https://www.frost.com/sublib/display-market-insight.do?id=275489972.
286 M. Sivak, “Will AC Put a Chill on the Global Energy Supply?” American Scientist, Vol. 101, No. 5 (September-October 2013), p. 330, http://www.americanscientist.org/issues/pub/2013/5/will-ac-put-a-chill-on-the-global-energy-supply/1.
287 TechSci Research, India Air Conditioners Market Forecast and Opportunities, 2020 (June 2015), http://www.reportlinker.com/p0881690-summary/India-Air-Conditioners-Market-Forecast-Opportunities.html.
0 10 20 30 40Los Angeles
Miami
DelhiKolkataMumbaiChennai
Los AngelesMiami
DelhiKolkataMumbaiChennai
Cooling degree-days (hundreds)
Populations (millions)
Figure 6-18. Estimated cooling degree days per year and populations in selected Indian and U.S. cities, 2011
(continued on page 112)
U.S. Energy Information Administration | International Energy Outlook 2016112
Buildings sector energy consumption
interruptions of residential electricity service for 16 hours a day in some areas of the country288 and a large-scale blackout that affected nearly 600 million people.289 In 2015, India experienced an intense and sustained heat wave, setting records in many parts of the country (heat indexes registered as high as 144 degrees Fahrenheit in Bhubneshwar, close to the northeast coast of India).290 While there is still much to learn about the performance of the power grid during the 2015 heat wave, there have been reported improvements in procedures since 2012 and also reports of electricity outages that lasted four hours a day in the northern region of the country.291
India began its first efficiency program for air conditioners in 2006, when India’s Bureau of Energy Efficiency (BEE) started a standards and competitive labeling program for the equipment. The program involves setting a standard minimum efficiency level, with a competitive labeling program above that level, so consumers can compare higher efficiency levels when purchasing air conditioners. BEE also set out a plan to raise the minimum standard and corresponding competitive labels over time. An early analysis of the program by Lawrence Berkeley National Laboratory (LBNL) estimated that the standards and labels would reduce electricity use by 27 terawatthours (TWh) annually by 2020, projecting base case consumption of 42 TWh in 2010, 195 TWh in 2020, and 552 TWh in 2030 for air conditioning alone without the efficiency program.292 Subsequent LBNL analysis has shown that the expected increase in the minimum efficiency level has been delayed compared to the earlier analysis, which assumed a minimum standard of 2.7 Energy Efficiency Ratio (EER) by 2010 (a level that was not actually reached until 2014).293 As the country’s market for air conditioning grows and pushes up energy use, efforts to increase efficiency can help relieve the upward pressure on electricity demand.
288 S. Cox, “Cooling a Warming Planet: A Global Air Conditioning Surge,” Yale Environment 360 (July 10, 2012), http://e360.yale.edu/feature/cooling_a_warming_planet_a_global_air_conditioning_surge/2550/.
289 Hindustan Times, “Heatwave claims over 1,100 across country, temperatures soaring” (May 28, 2015), http://www.hindustantimes.com/india-news/heat-wave-claims-over-750-lives-in-ap-telangana-temperatures-will-continue-to-soar-this-week/article1-1351358.aspx.
290 J. Samenow, “India’s hellish heat wave, in hindsight,” The Washington Post (June 10, 2015), http://www.washingtonpost.com/blogs/capital-weather-gang/wp/2015/06/10/indias-hellish-heat-wave-in-hindsight/.
291 Hindustan Times, “India’s electricity woes: The heat’s on, the power’s off” (May 25, 2015), http://www.hindustantimes.com/comment/india-s-electricity-woes-the-heat-s-on-the-power-s-off/article1-1351170.aspx.
292 M.A. McNeil and M. Iyer, Techno-Economic Analysis of Indian Draft Standard Levels for Room Air Conditioners, LBNL-64204 (Lawrence Berkeley National Laboratory, Berkeley, CA, March 2007), https://escholarship.org/uc/item/8wr8433w#page-1.
293 A. Phadke, N. Abhyankar, and N. Shah, Avoiding 100 New Power Plants by Increasing Efficiency of Room Air Conditioners in India: Opportunities and Challenges (Lawrence Berkeley National Laboratory, Berkeley, CA, June 2014), http://eetd.lbl.gov/sites/all/files/lbnl-6674e.pdf.